Power BI Data Modeling
Overview
In this article, we delve into the fundamental concepts of data modeling in Power BI and its critical role in transforming raw data into meaningful business insights. Data modeling in Power BI is the process of comprehensively analyzing and defining the various data types your business collects and produces while establishing the relationships between these data elements.
Introduction
In today's data-driven world, businesses are faced with abundant information flowing in from various sources. As the volume of data grows, the need to make sense of it becomes ever more essential. This is where data modeling in Power BI emerges as a vital tool, empowering organizations to analyze, organize, and derive valuable insights from their data assets. Data modeling is the process of structuring and defining data elements, their types, and the relationships between them, creating a blueprint that lays the foundation for effective data analysis. In this article, we explore the world of data modeling in Power BI, understanding its significance and uncovering the key techniques that unlock the true potential of business intelligence.
What is Data Modelling?
Data modeling in Power BI establishes relationships between multiple data tables to create a coherent and comprehensive view of the data. When data is imported into Power BI from various sources, it often resides in separate tables with related information. By creating connections or relationships between these tables based on shared columns, Power BI understands how the data is interconnected. This allows users to build reports and visualizations seamlessly, combining data from different tables, and enabling powerful analysis and insights. Data modeling in Power BI is a flexible and efficient way to harness the full potential of disparate data sources without consolidating all data into a single table.
Imagine a scenario where a retail company wants to optimize its inventory management. They store data on products, suppliers, sales, and stock levels in various databases. Data modeling in Power BI allows them to organize this complex data landscape coherently. For instance, they can create relationships between product data and supplier data, enabling them to track which products come from which suppliers. Moreover, by linking sales data with stock levels, they can analyze which products are selling well and need replenishment. The resulting data model visually represents these interconnections, facilitating insightful business analysis and decision-making. As a result, the retail company can identify trends, make informed inventory decisions, and ultimately enhance its overall operational efficiency.
Benefits of Data Modeling
The benefits of data modeling in Power BI are significant:
- Improved Data Analysis:
Data modeling in Power BI enables seamless data integration from multiple tables, facilitating comprehensive analysis and unlocking deeper insights into business performance. - Enhanced Reporting:
By establishing relationships between tables, Power BI can create dynamic and interactive reports that draw upon interconnected data, presenting a holistic view of the organization's data. - Flexibility and Scalability:
Data modeling allows businesses to work with diverse and distributed data sources, accommodating changes and additions to the data model as the organization grows. - Simplified Complex Queries:
A well-designed data model makes complex queries more straightforward, leading to faster data retrieval and improved performance in Power BI reports and dashboards. - Data Accuracy and Consistency:
By enforcing relationships between tables, data modeling ensures data accuracy and consistency across the organization.
Data Modeling Concept Examples
Here are the three data modeling concept examples:
Conceptual Data Modelling:
In conceptual data modeling, the focus is on defining the business's fundamental structure and data. For example, a conceptual data model for an e-commerce business may include entities such as "Customer," "Employee," and "Product," with relationships between them. The primary goal is to organize business concepts and their interconnections, providing a broad understanding of the data's scope and relationships.
Logical Data Modelling:
Building upon the conceptual data model, logical data modeling delves deeper into specific attributes of data within each entity and the relationships between these attributes. This model incorporates technical details and business rules, enabling more precise data analysis and decision-making. For instance, in a logical data model, we might define that "Customer A" purchased "Product B" from "Sales Associate C."
Physical Data Modelling:
The physical data model represents the practical implementation of the logical data model, specifically designed for a particular database tool and data storage technology. In this stage, the data modeling’s actual implementation occurs, reflecting the culmination of the previous conceptual and logical modeling efforts.
Using Data Modeling and Navigation
Now, let's explore the process of data modeling in Power BI for different tables and data sources within Power BI. Initially, we'll import two tables: "CustomerData" (consisting of customer purchase details) and "ProductData" (comprising product details). To load data from various sources, including Excel sheets or other data formats, we can utilize Power BI's "GetData" feature, as shown below.

Subsequently, upon selecting the Excel Worksheet using the "Get Data" feature, you can load the chosen sheet, as illustrated in the following image.

After successfully loading both Excel sheets, you can see them and their features on the right end of the screen. To establish a relationship between these tables, navigate to the "Model View" located on the left side, as depicted in the figure below.

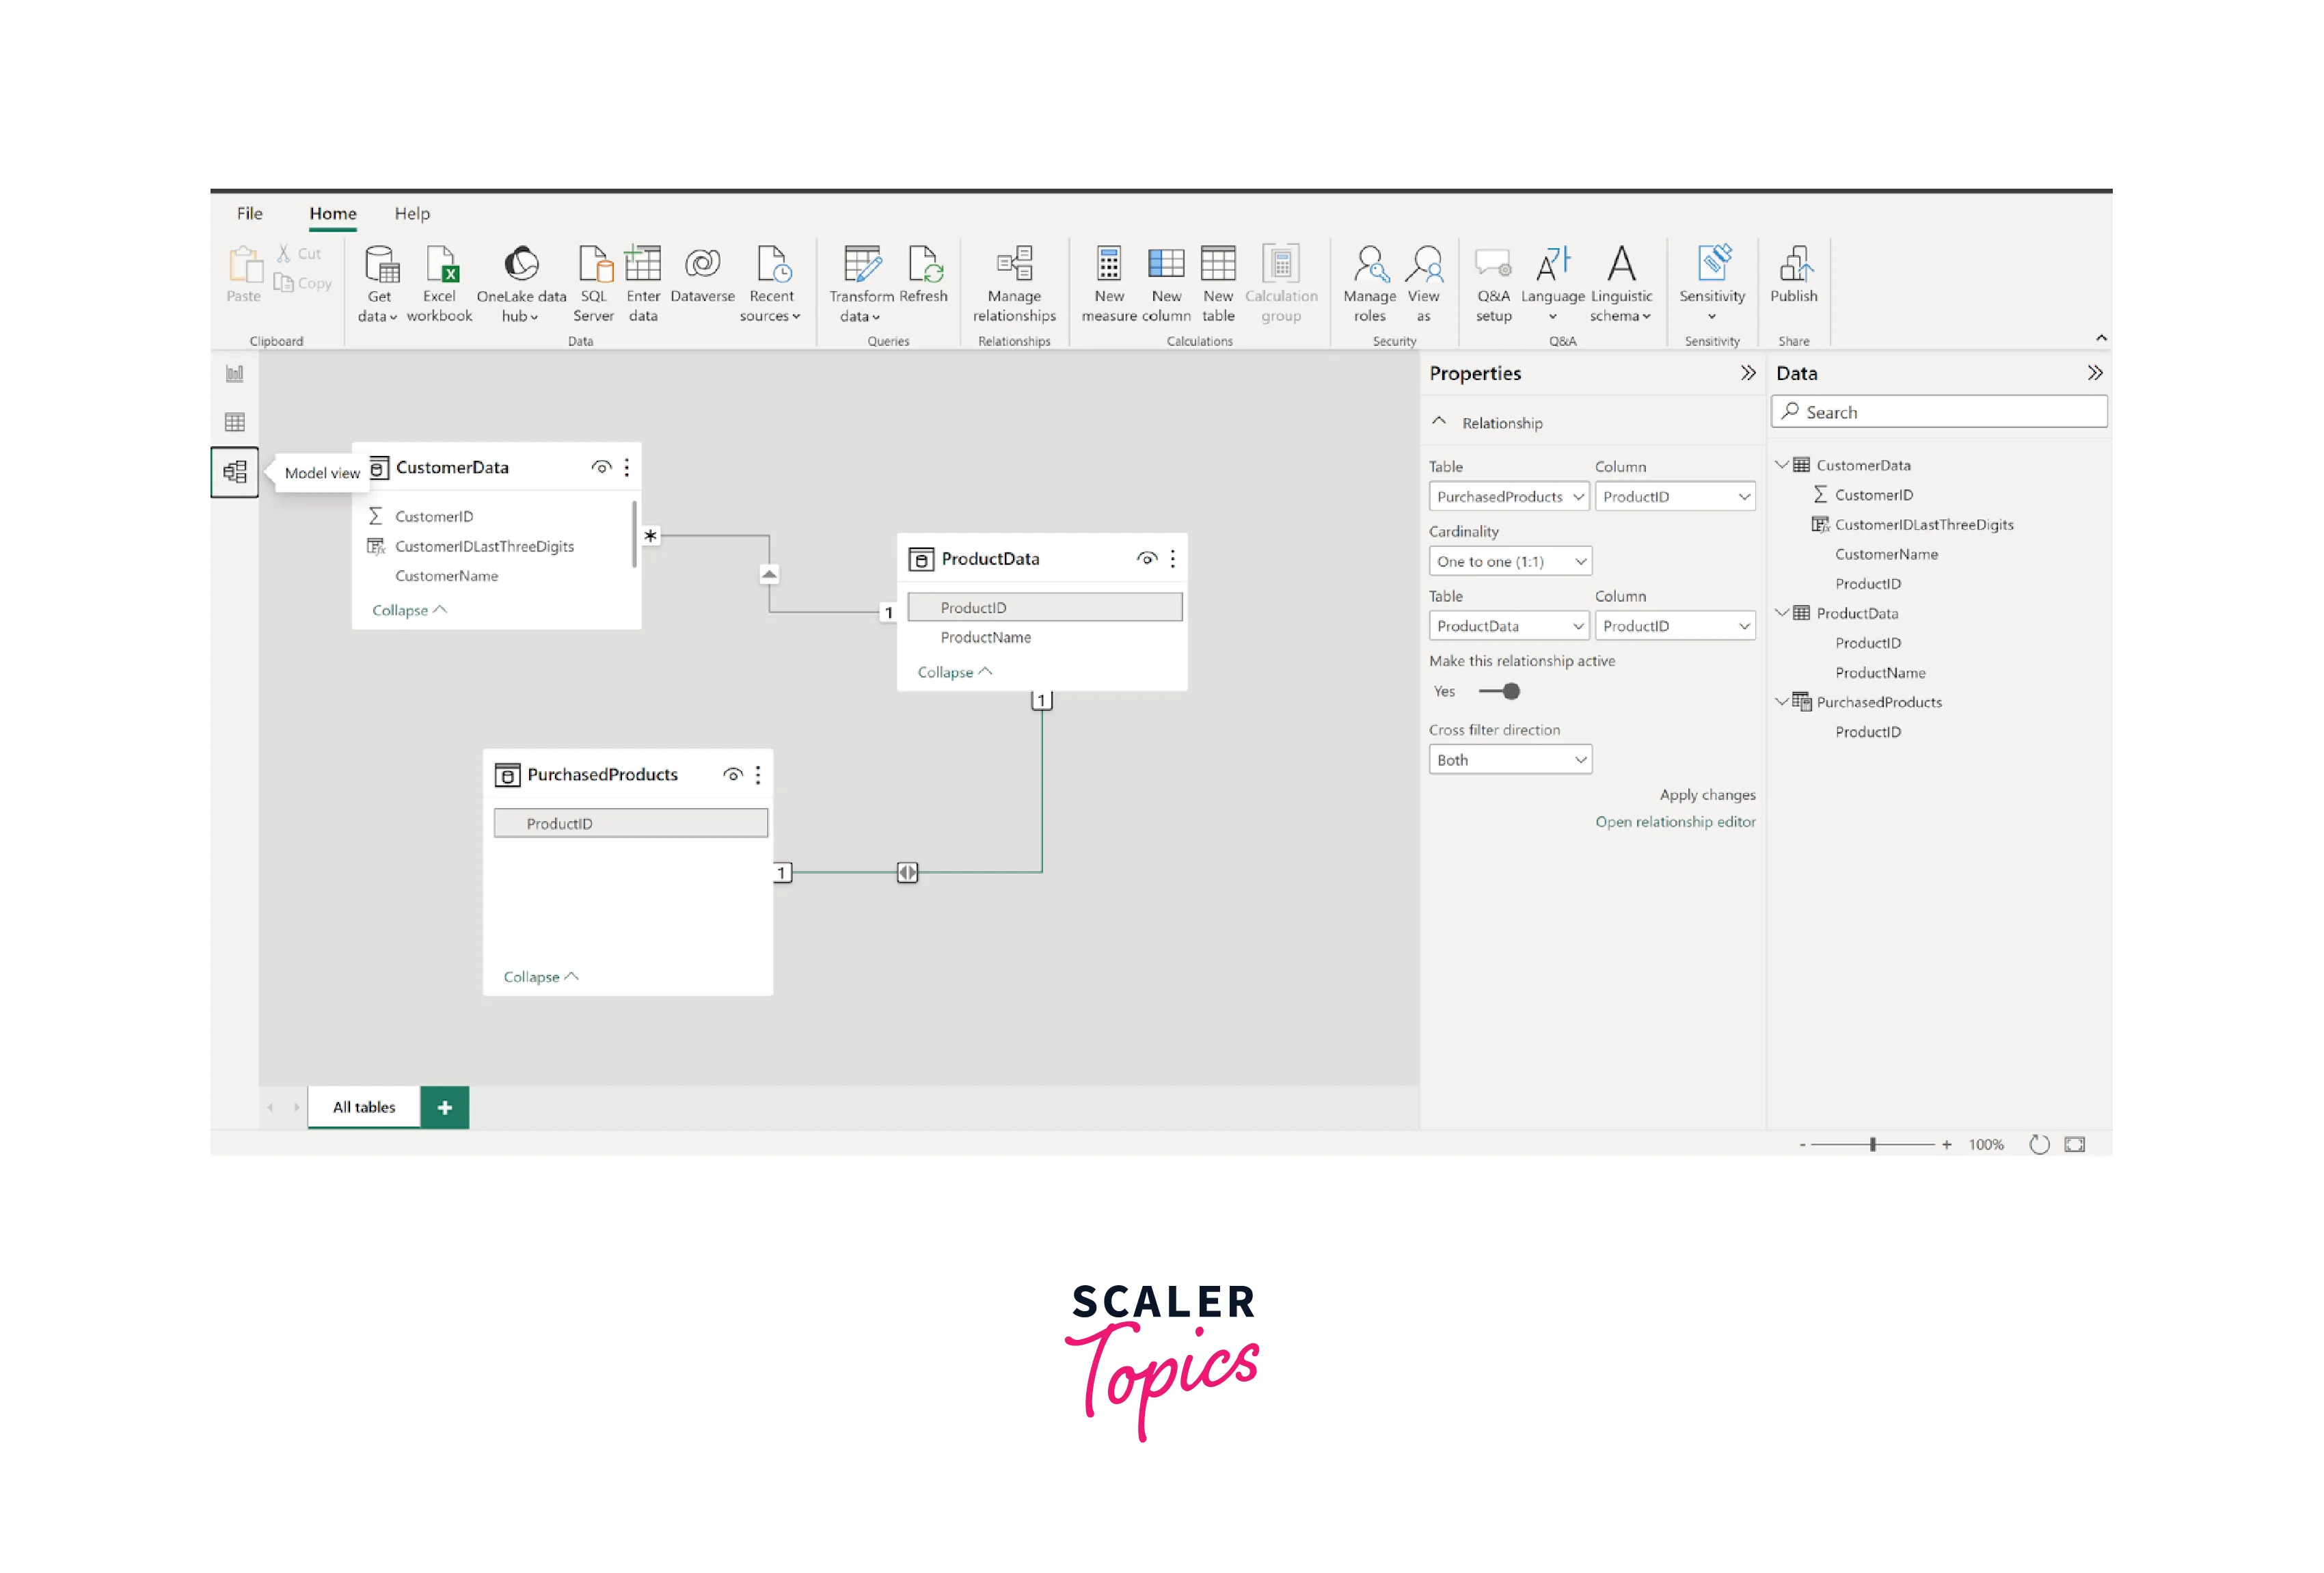
In the figure below, you'll notice that Power BI has automatically detected the relationship between the two features by connecting the "ProductID" column for both tables/sheets. This seamless connection enables smooth data integration and analysis. Furthermore, if you wish to create additional relationships or manage existing ones, you can do so by using the "Manage Relationships" option located at the top of the interface. This functionality allows you to define relationships based on other relevant columns, enhancing the data model's coherence and depth of analysis.

Using the above guide, you can perform data modeling in Power BI that involves creating connections or relationships between multiple data sources or tables. By establishing these relationships, Power BI seamlessly integrates data from diverse sources, enabling a comprehensive view of the organization's information. The process empowers users to perform complex data analysis, generate interactive reports, and gain valuable insights from consolidated data. This data modeling capability is pivotal in business intelligence, ensuring data accuracy, consistency, and efficiency.
Creating Calculated Columns
Creating calculated columns using the Power BI modeling feature is a straightforward and powerful way to extend the capabilities of your data model. For example, if you have a "Sales" table with columns "Quantity" and "Unit Price," and you want to create a calculated column called "Total Sales", you can use the formula:
This calculated column will automatically calculate the total sales amount for each row based on the quantity and unit price. Calculated columns are recalculated whenever the data changes, ensuring that the results stay up-to-date and consistent. They provide a powerful way to perform data transformations without altering the underlying data source, enabling users to gain deeper insights and make data-driven decisions within Power BI reports and visualizations.
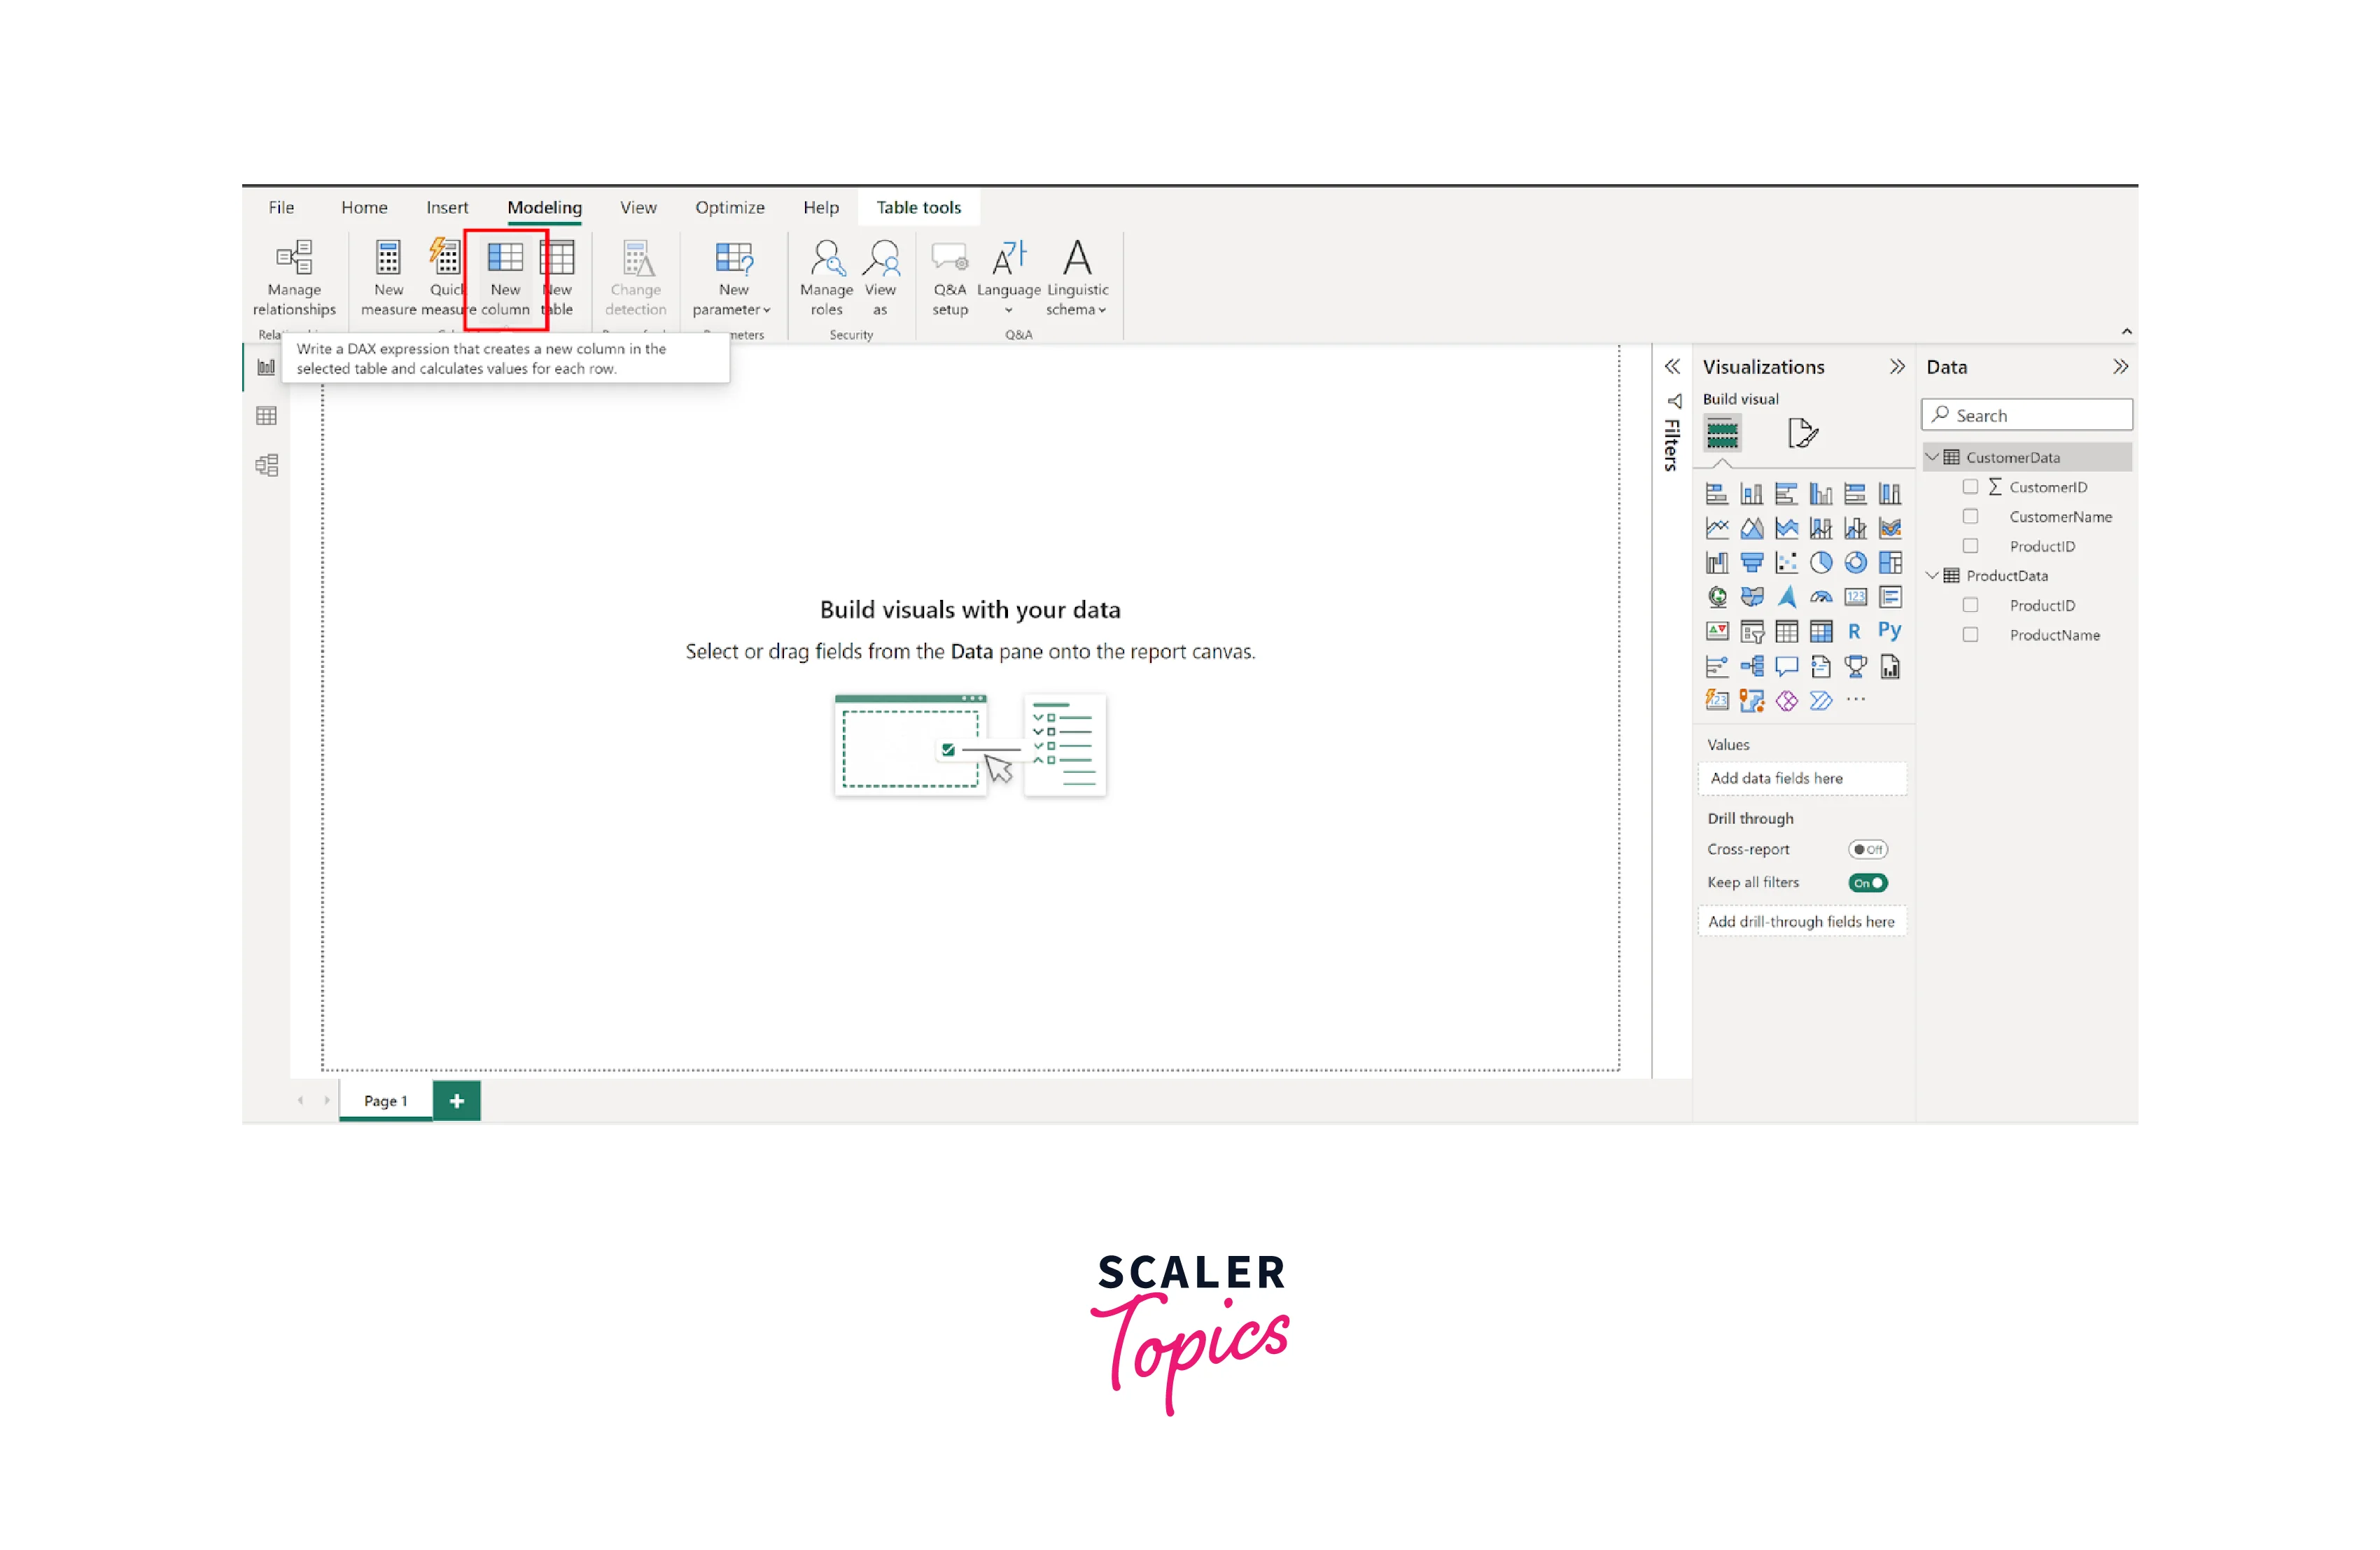
In our previous example, we will proceed to add a new column to one of the tables. Specifically, we will create a column named "CustomerIDLastThreeDigits" within the table, capturing the last three digits of the customer ID feature. To perform this operation, as shown in the below figure, you need to go to the "Modeling" tab on the Power BI ribbon at the top and then click on "New Column" in the "Calculations" group. This will open the formula bar.
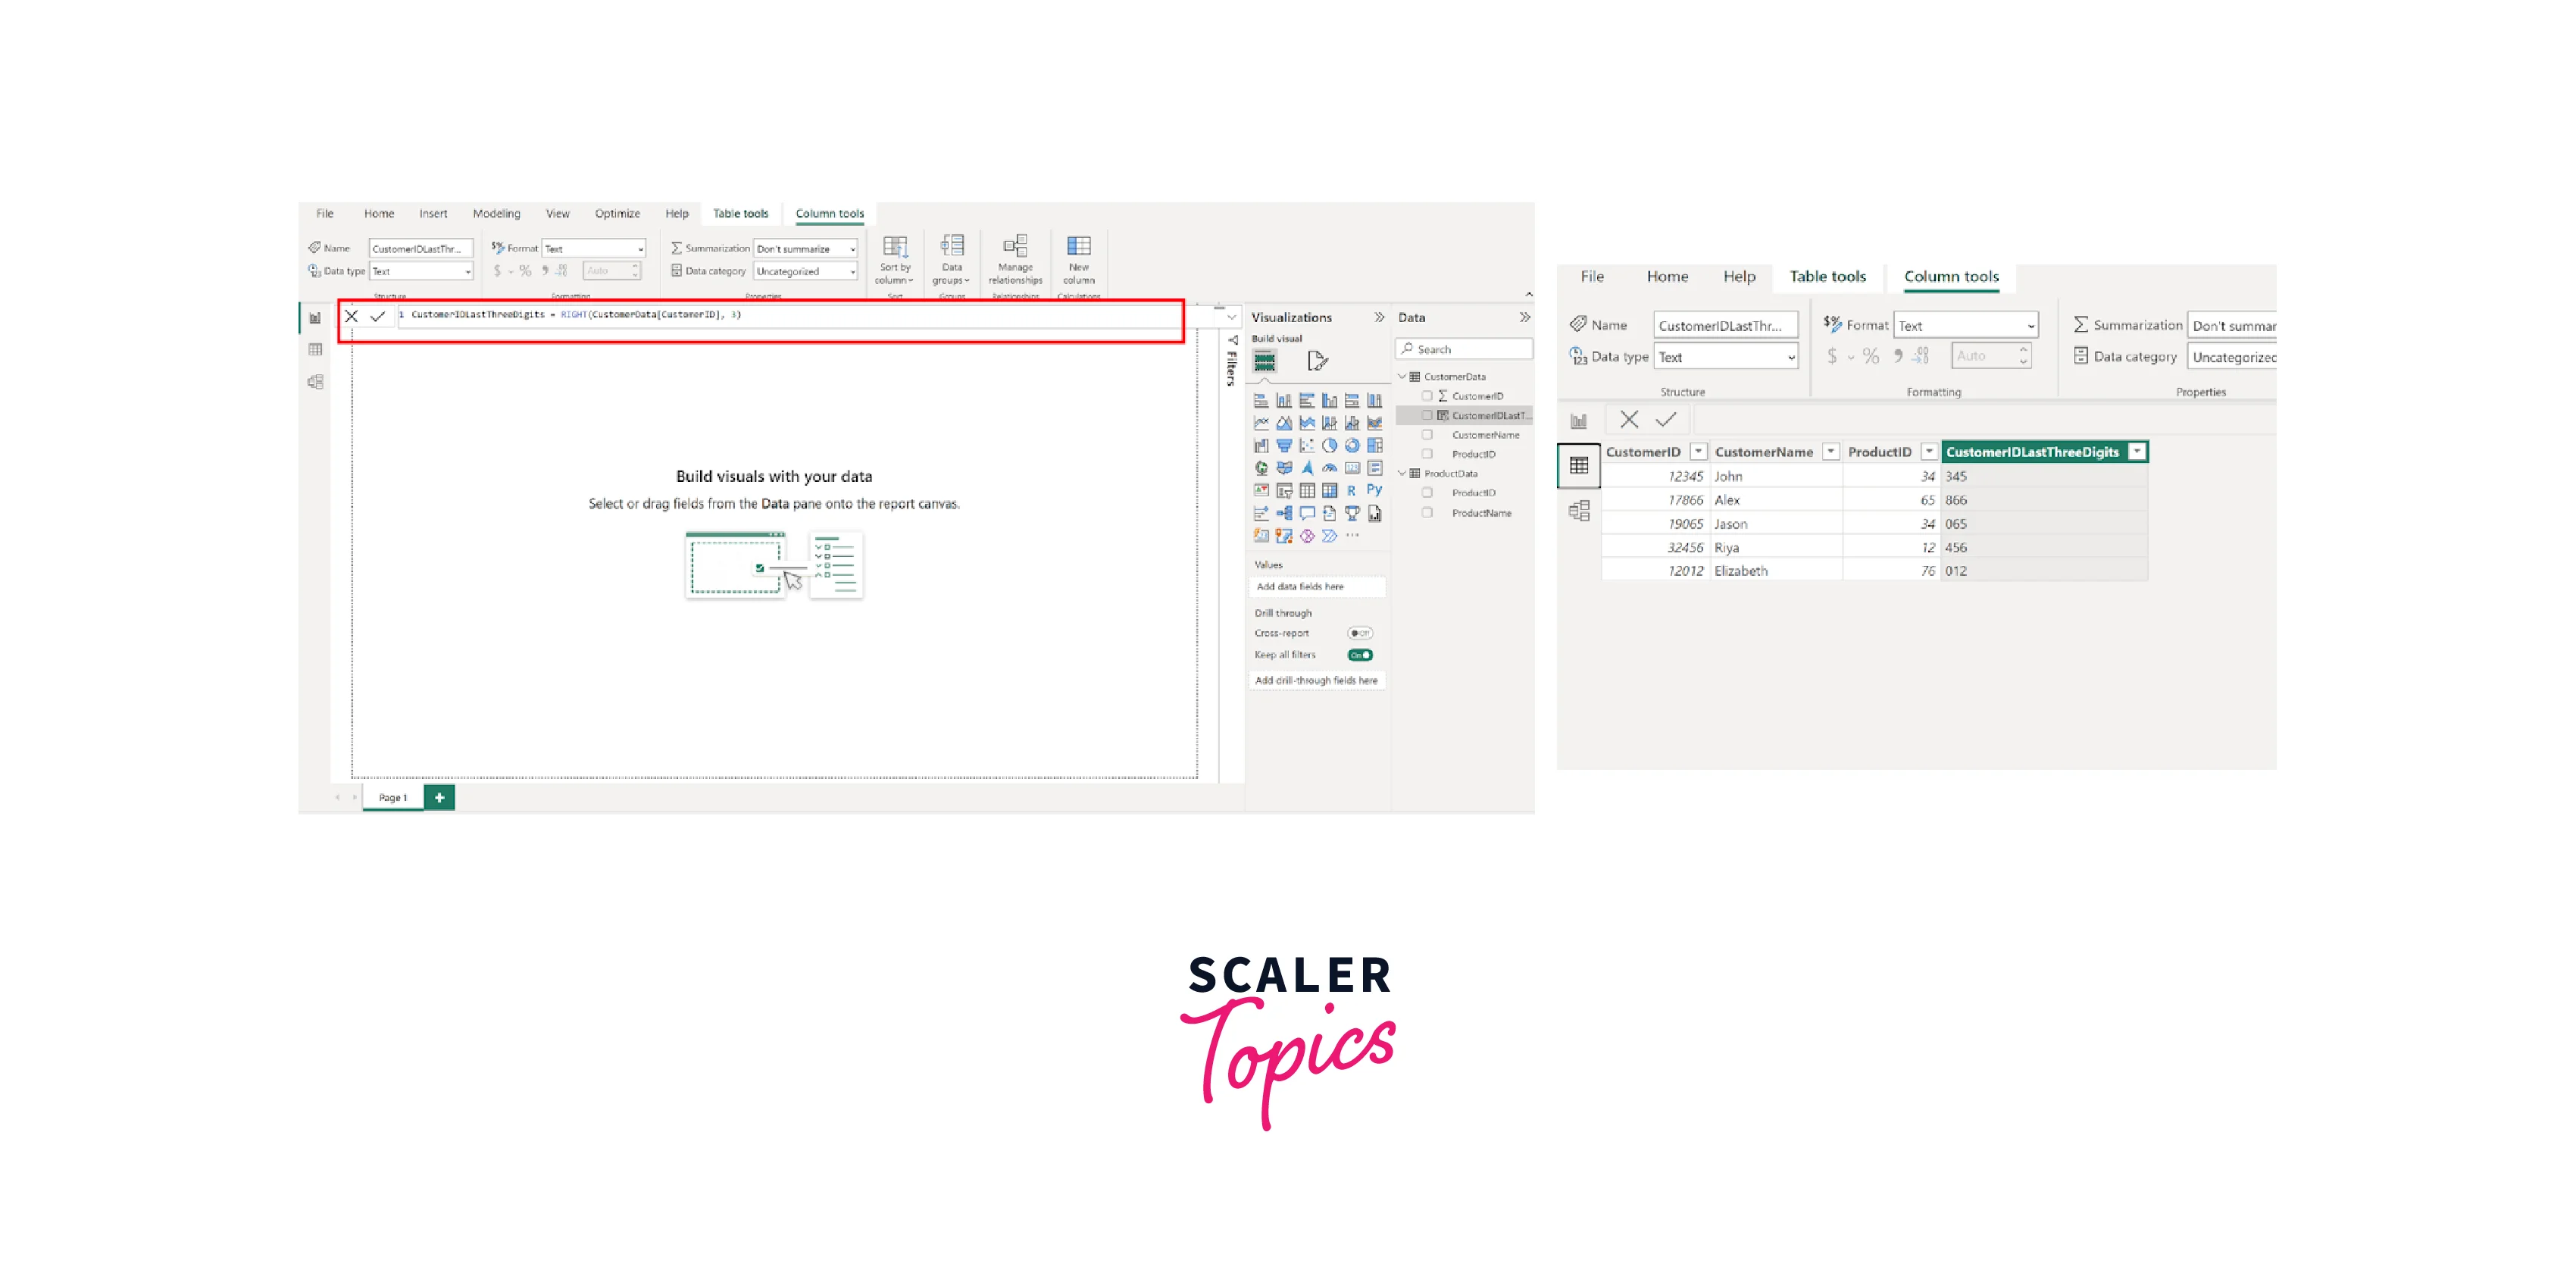
Next, in the formula bar, enter the formula for your calculated column using the DAX (Data Analysis Expressions) language. DAX offers a wide range of functions to perform various calculations and transformations. Press Enter to apply the formula, and the calculated column will be added to the selected table, as shown below.
Creating Calculated Tables
Creating calculated tables in Power BI modeling unleashes additional analytical possibilities by generating new tables based on defined expressions or filters. For instance, you can create a calculated table that only filters the "Sales" table to include data for specific products or customers. Calculated tables provide an efficient way to organize and present data tailored to your analysis, enhancing data exploration and insight generation within Power BI. To create a new table, go to the "Modeling" tab on the Power BI ribbon. Then, click on "New Table" in the "Calculations" group. This opens a formula bar. In the formula bar, use DAX expressions to define the logic for the new table. Press Enter to apply the formula, and the calculated table will be generated. To demonstrate, we will create a new table containing a list of only purchased product IDs using the "CustomerData" table.

After creating the new table, you can navigate to the Model View and establish an additional relationship for the recently generated table.
How do Data Modeling Concepts Impact Analytics?
Data modeling concepts significantly impact analytics as they lay the foundation for effective data analysis and informed decision-making. A well-crafted data model ensures that each business unit contributes to the overall organizational goals, leading to more impactful data analytics and business intelligence. Moreover, a robust data model optimizes analytics performance, even with large and complex data sets, making data analysis more straightforward. By defining data relationships within the model, analyzing the required data becomes effortless, enabling quick insights into the effects of process changes, pricing strategies, or staffing decisions.
Managing Time-Based Data
Managing time-based data in Power BI using the drill-through feature allows users to focus on specific periods or intervals for deeper analysis. With drill-through, you can create detailed reports that offer insights into a particular time segment from a larger dataset, such as days, weeks, or months. Users can "drill through" to a more granular report that precisely examines the selected period by clicking on a data point related to time in a visual. This capability enhances the ability to spot trends, anomalies, or patterns over time, enabling better decision-making and a more comprehensive understanding of the data's temporal dynamics.
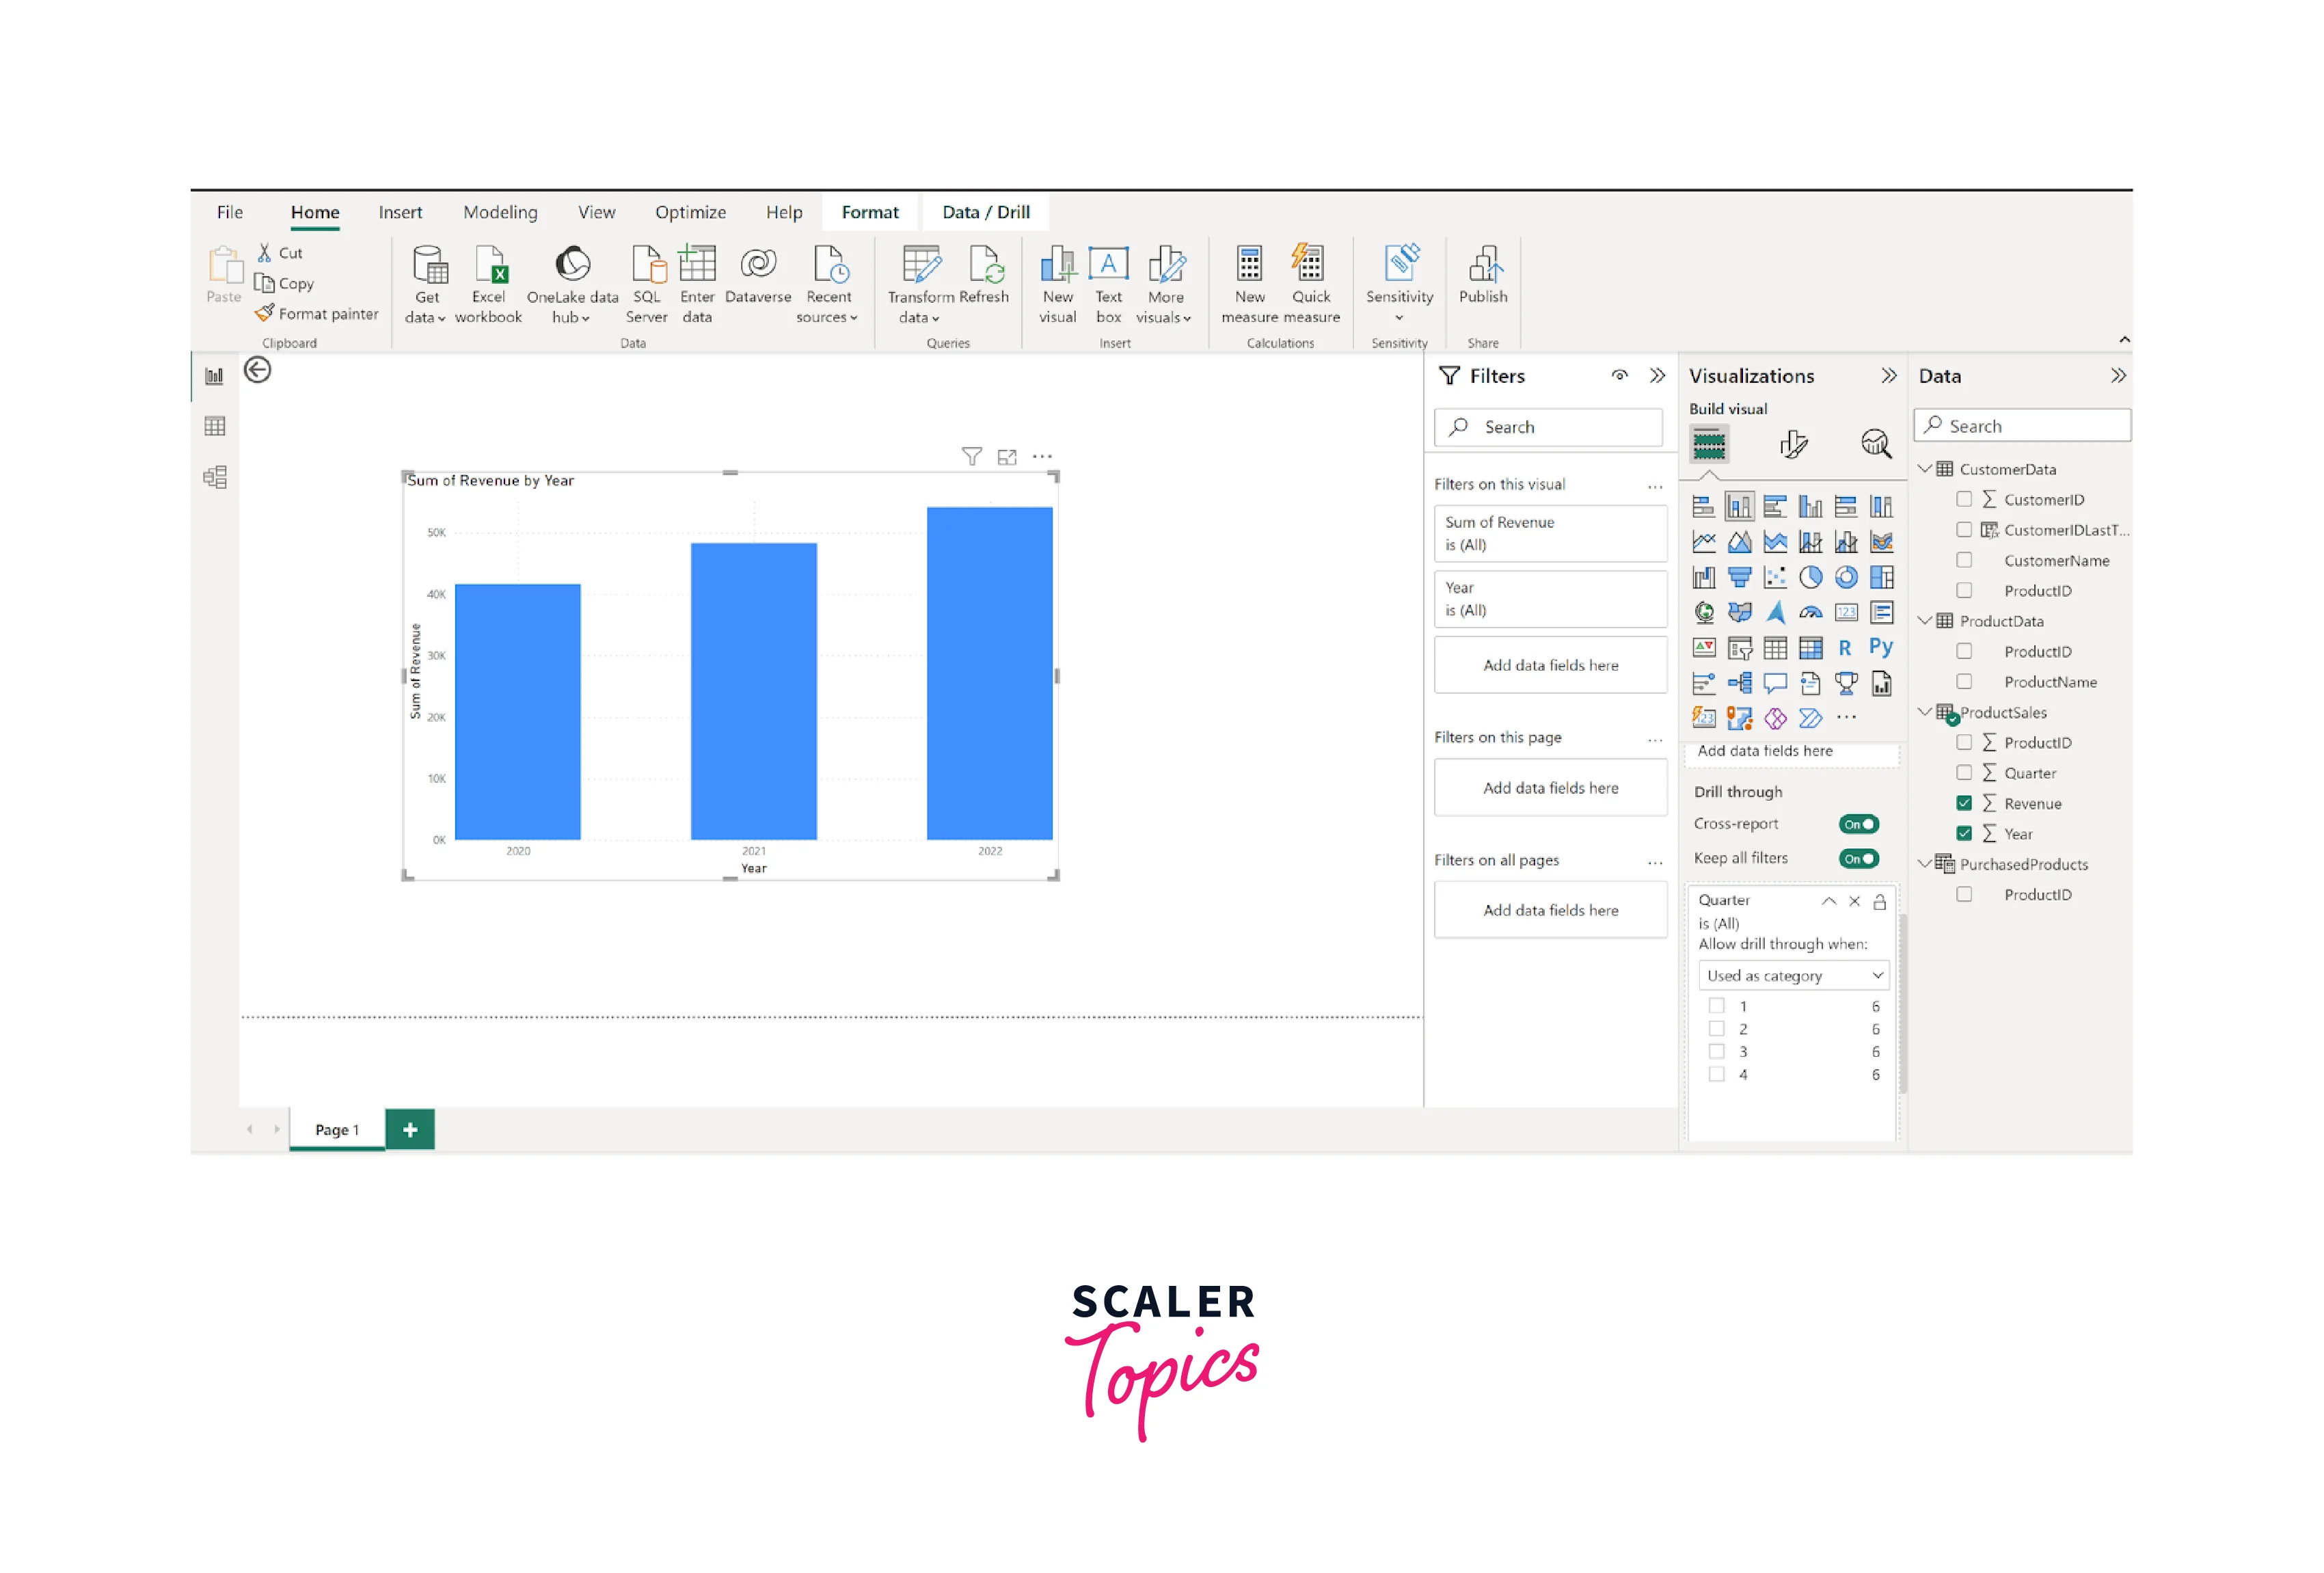
As depicted in the figure below, we incorporated a new dataset containing product revenue categorized by year and quarter. Upon loading the data and selecting the appropriate features, Power BI automatically presents a comprehensive view of the total revenue every year. Additionally, we can utilize the drill-down capability to delve into quarterly revenues, gaining a more detailed and granular insight into the product revenues.
Conclusion
- Data modeling in Power BI enables organizations to analyze and define data relationships effectively, providing a structured view of their business information.
- By creating connections between multiple data sources and tables, Power BI empowers users to perform complex data analysis, generate dynamic reports, and gain valuable insights for informed decision-making.
- A well-designed data model enhances data accuracy, consistency, and performance, elevating the organization's business intelligence capabilities and fostering data-driven success.