Handling Dates in Power BI
Overview
Dates are a fundamental aspect of data analysis, providing crucial insights into trends, patterns, and seasonality. Power BI, Microsoft's powerful business intelligence tool, offers a range of features and functions to help users effectively manage and manipulate date data. Efficiently managing dates in Power BI is paramount for data analysis. This article delves into essential techniques and best practices for handling dates in Power BI. From functions and calculations to creating date tables, we'll explore how to harness the full power of Power BI's date functionalities.
Date Data Types in Power BI
Dates in Power BI are not just simple pieces of information; they are structured data types that come with a wealth of functionalities. There are two primary date data types you'll encounter -
-
Date -
The "Date" data type in Power BI is designed to handle calendar dates, including day, month, and year. It's ideal for situations where you need to work with precise dates, such as sales transactions or project timelines.
-
Datetime -
The "Datetime" data type goes a step further by including both date and time information. This type is invaluable when you need to track events with timestamps, such as log entries or sensor data.
Understanding and correctly using these date data types is crucial as it allows Power BI to recognize and interpret your date-related data accurately. This foundation allows you to leverage Power BI's extensive date-related functions and features to perform complex date calculations and create dynamic, insightful reports.
Date Functions and Calculations in Power BI
This section explores various functions related to date data types in DAX Power BI, empowering you to perform advanced date calculations and enhance your data analysis capabilities.
Date Arithmetic and Manipulation
Here are a few of the most commonly used Power BI functions for Date Arithmetic and Manipulation -
- DATEADD - This function allows you to add or subtract a specified number of units (e.g., days, months, years) to or from a date.
- DATEDIFF - Use DATEDIFF to calculate the difference between two dates in various date parts (e.g., days, months, years).
- EOMONTH - EOMONTH returns the last day of the month before or after a specified number of months from a given date.
- EDATE - EDATE helps you calculate a new date by adding or subtracting a specified number of months from a given date.
- TODAY - TODAY simply returns the current date, which is useful for dynamic date calculations.
- NOW - Similar to TODAY, NOW returns the current date and time for more precise timestamp calculations.
Extracting Components from Dates
Here are various Power BI functions for extracting components from date values -
- YEAR - The YEAR function retrieves the year component from a date.
- MONTH - Use the MONTH function to extract the month component from a date.
- DAY - The DAY function extracts the day component from a date.
- QUARTER - QUARTER returns the quarter component (1, 2, 3, or 4) from a date
- HOUR - Use HOUR to extract the hour component from a datetime value.
- MINUTE - The MINUTE function retrieves the minute component from a datetime value.
- SECOND - SECOND extracts the second component from a datetime value.
- WEEKDAY - WEEKDAY returns the day of the week (1 for Sunday, 2 for Monday, and so on) for a given date.
Aggregating and Grouping by Date
When it comes to aggregating and grouping data by date in Power BI, you can utilize several functions and techniques, as shown below -
- SUMMARIZE - With SUMMARIZE, you can create summarized tables that group data by one or more date columns and perform aggregations like SUM, COUNT, AVERAGE, etc., within those groups.
- ROLLUP - The ROLLUP function allows you to create aggregated groupings in a table, which is handy for hierarchical date groupings like year, quarter, and month.
- GROUPBY - GROUPBY enables you to group data in a table by one or more columns, including date columns, and apply aggregations or transformations to those groups.
What are Power BI Date Tables?
In Power BI, a date table is a specialized table dedicated to managing and enriching date-related data and exclusively comprising date-related information. Its primary purpose is to provide a comprehensive, structured calendar of dates, allowing for seamless date-based analysis and reporting. A well-crafted date table typically includes columns for date, year, quarter, month, day of the week, and other relevant date attributes.
Power BI reports frequently demand analyses based on date and time dimensions. Creating a date table becomes a valuable asset in this context. Date tables empower you to dissect your data effortlessly according to various date attributes, including weekdays, months, quarters, and years. Moreover, they enable the effective utilization of DAX time intelligence functions that may not function optimally in their absence. To ensure accurate analysis, it's imperative to maintain correct formatting for all date table columns.
How to Create Date Tables in Power BI?
Requirements
Key requirements to create a date table in Power BI include the following -
- The date table must feature a date column with the date/time data type.
- Ensure there are no empty values in the date column. The date column should not have any gaps or missing dates.
- The date column must maintain uniqueness across its values.
- The date table should cover complete periods, such as calendar years (from January to December) or fiscal years.
Names for Power BI Date Tables
Date tables may go by different names, including calendar tables, date dimension tables, and calendar dimension tables. Regardless of the terminology used, they all describe the same concept - a table containing a single record for each day, featuring a column that represents various attributes associated with the respective dates.
Generating Power BI Date Tables
There are three primary methods for generating date tables within Power BI, as mentioned below -
Source Data
When importing your data, there's a possibility that it includes an existing date table from the data source. In such instances, there's no necessity to generate an additional date table. This existing date table can be seamlessly incorporated into the data model, establishing relationships with other tables within. However, if the source data lacks a date table, there are multiple approaches available for its creation.
DAX
Creating a date table in Power BI using DAX involves the use of the DAX formula language to generate a table with date values. Follow these steps to create a date table-
-
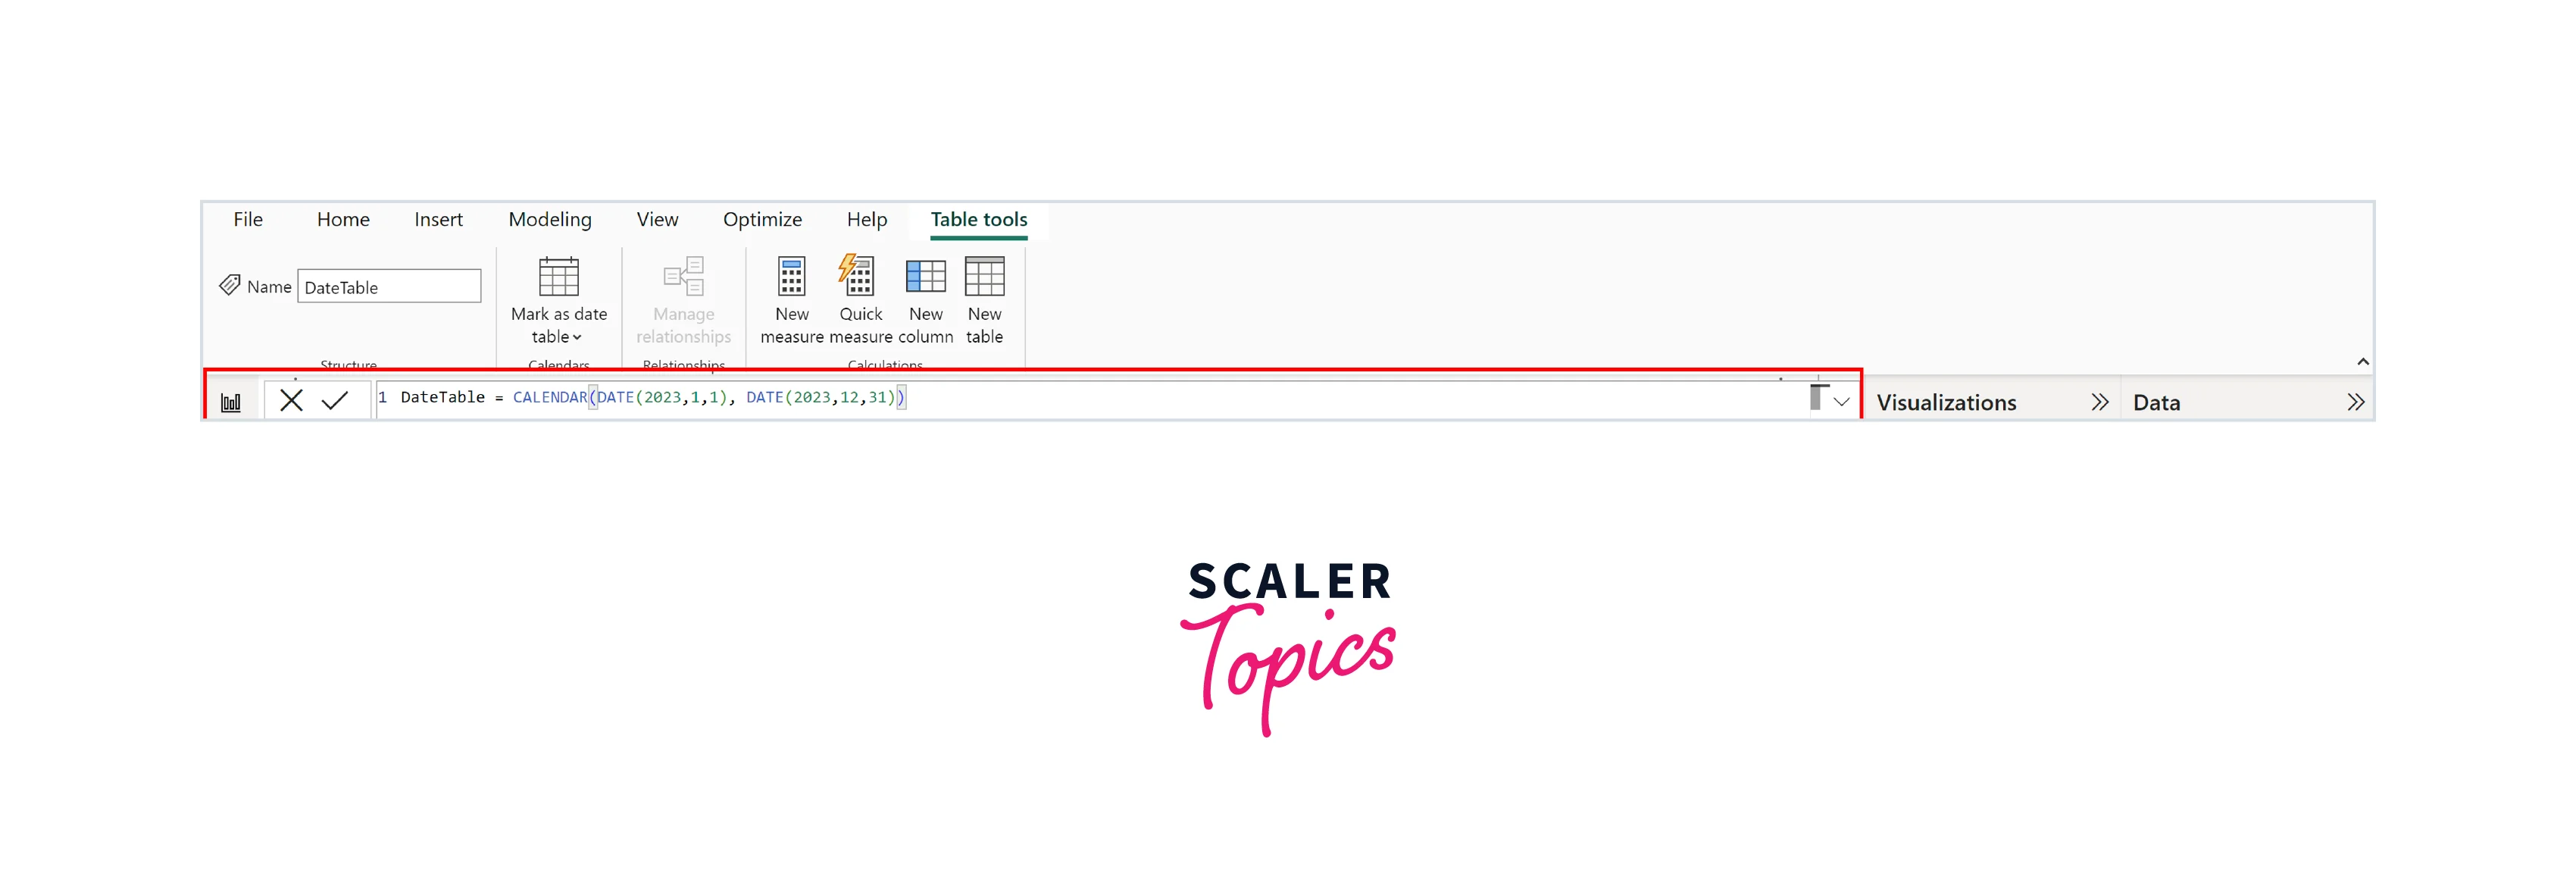
Launch Power BI Desktop and open your desired Power BI file or create a new one. Click on the "Modeling" tab in the Power BI Desktop ribbon.
-
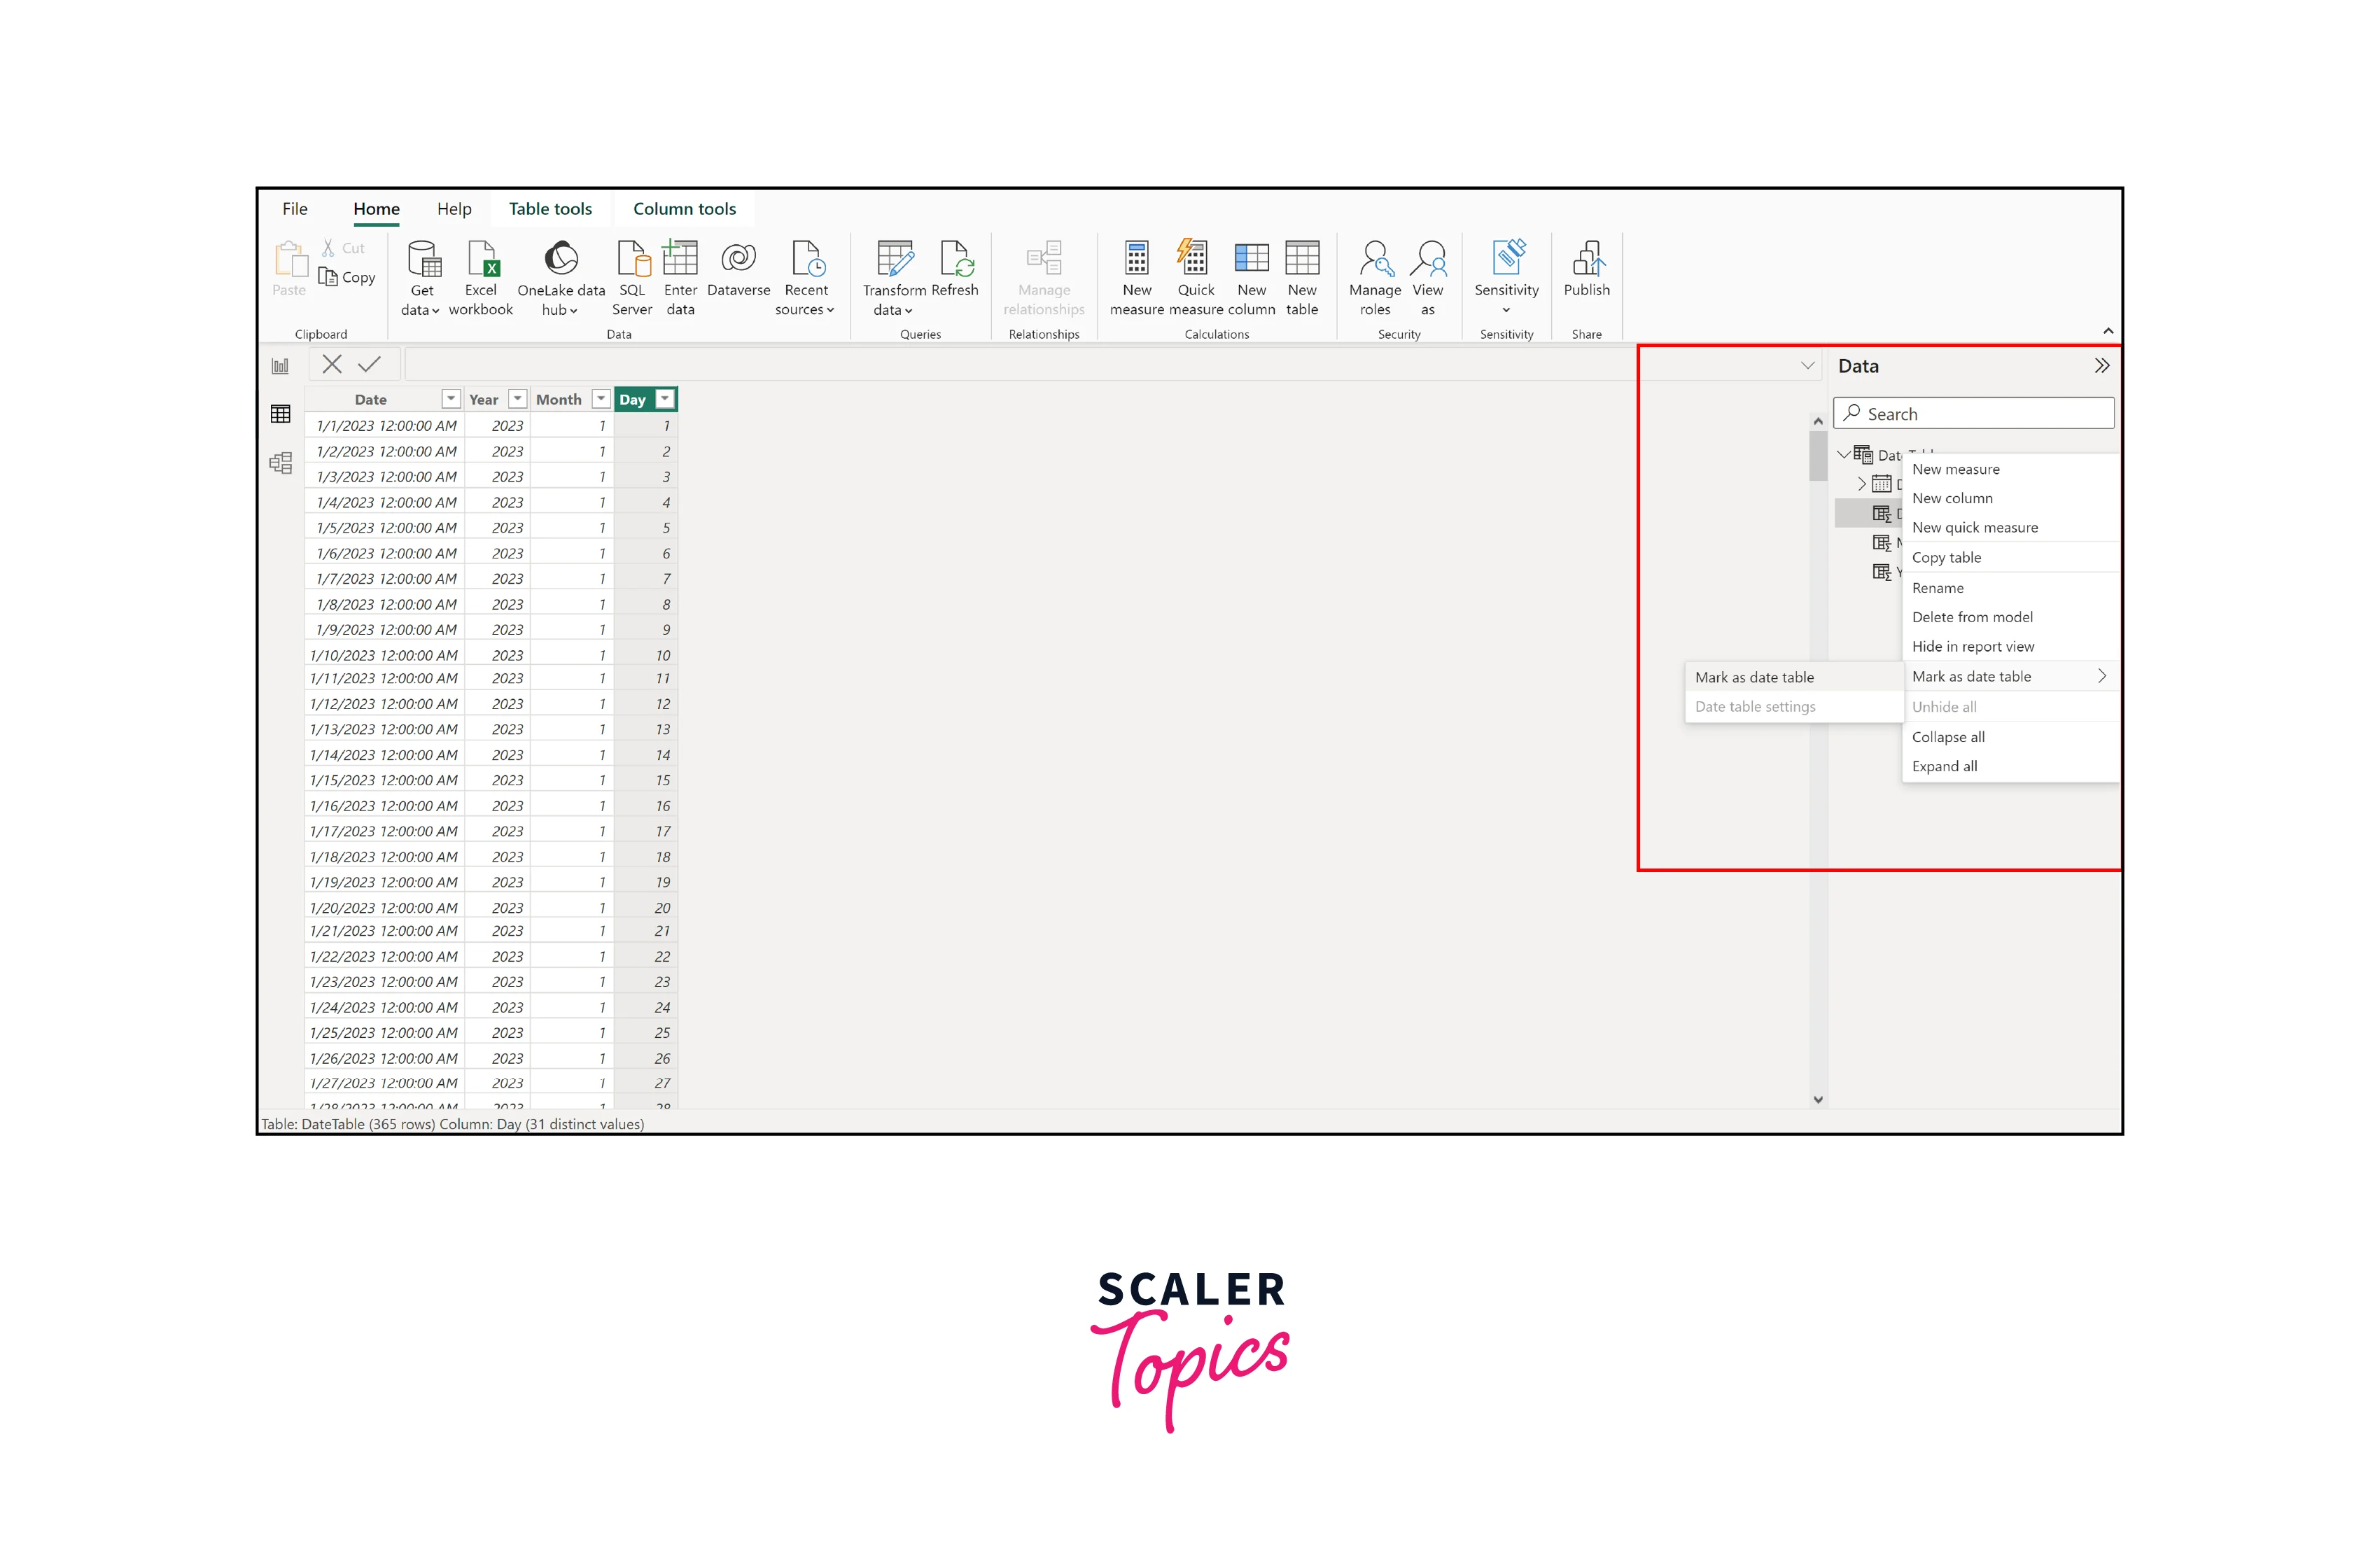
In the "Calculations" group, click on the "New Table" button. In the formula bar that appears at the top, enter a DAX formula to generate your date table, as shown in the figure below. This formula generates a date table named "DateTable" with dates spanning from January 1, 2023, to December 31, 2023. You can customize the start and end dates according to your requirements. After entering the DAX formula, press Enter to create the table.
-
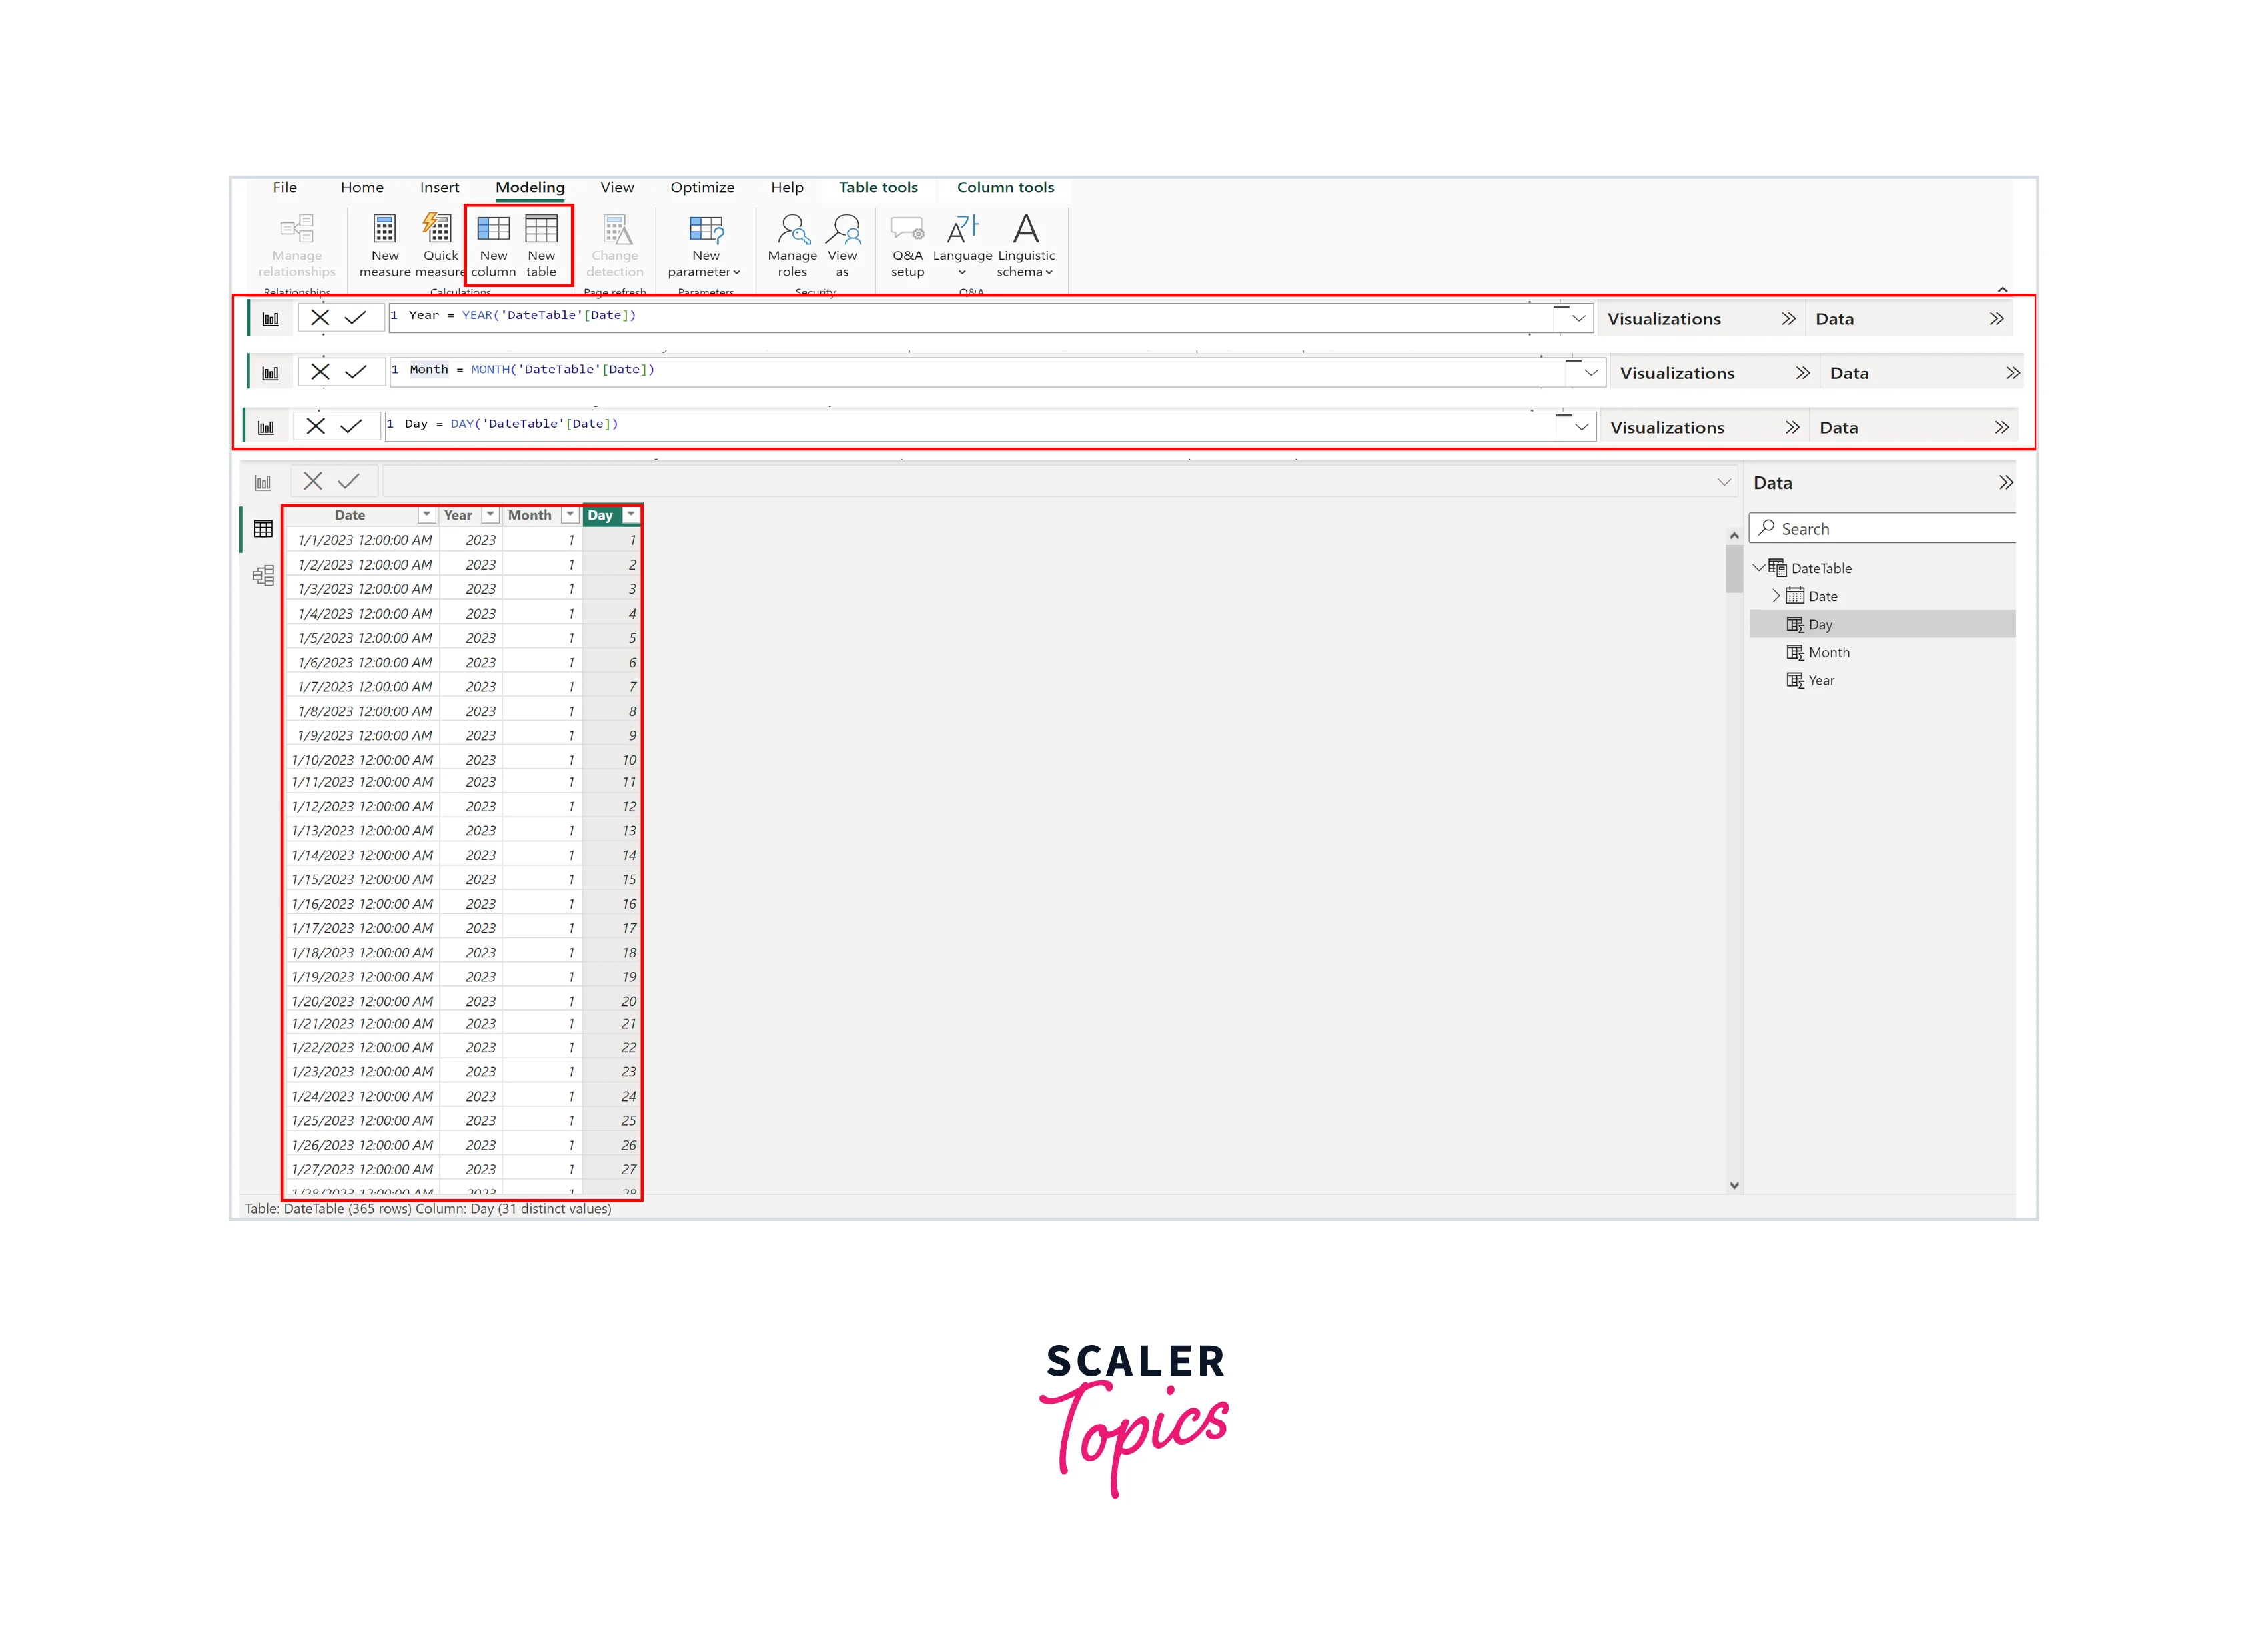
Additional columns like Year, Month, Weekday, and Week of the Year can be included in the table. To achieve this, click the 'New Column' button on the ribbon and input the corresponding DAX expressions for each column you wish to incorporate.
Power Query
Creating a date table in Power BI using Power Query involves a series of steps to generate and customize a date table. Here's how to do it -
-
Launch Power BI Desktop and open your desired Power BI file or create a new one. Go to the "Home" tab in the Power BI Desktop ribbon and click on "Transform Data." This opens the Power Query Editor.
-
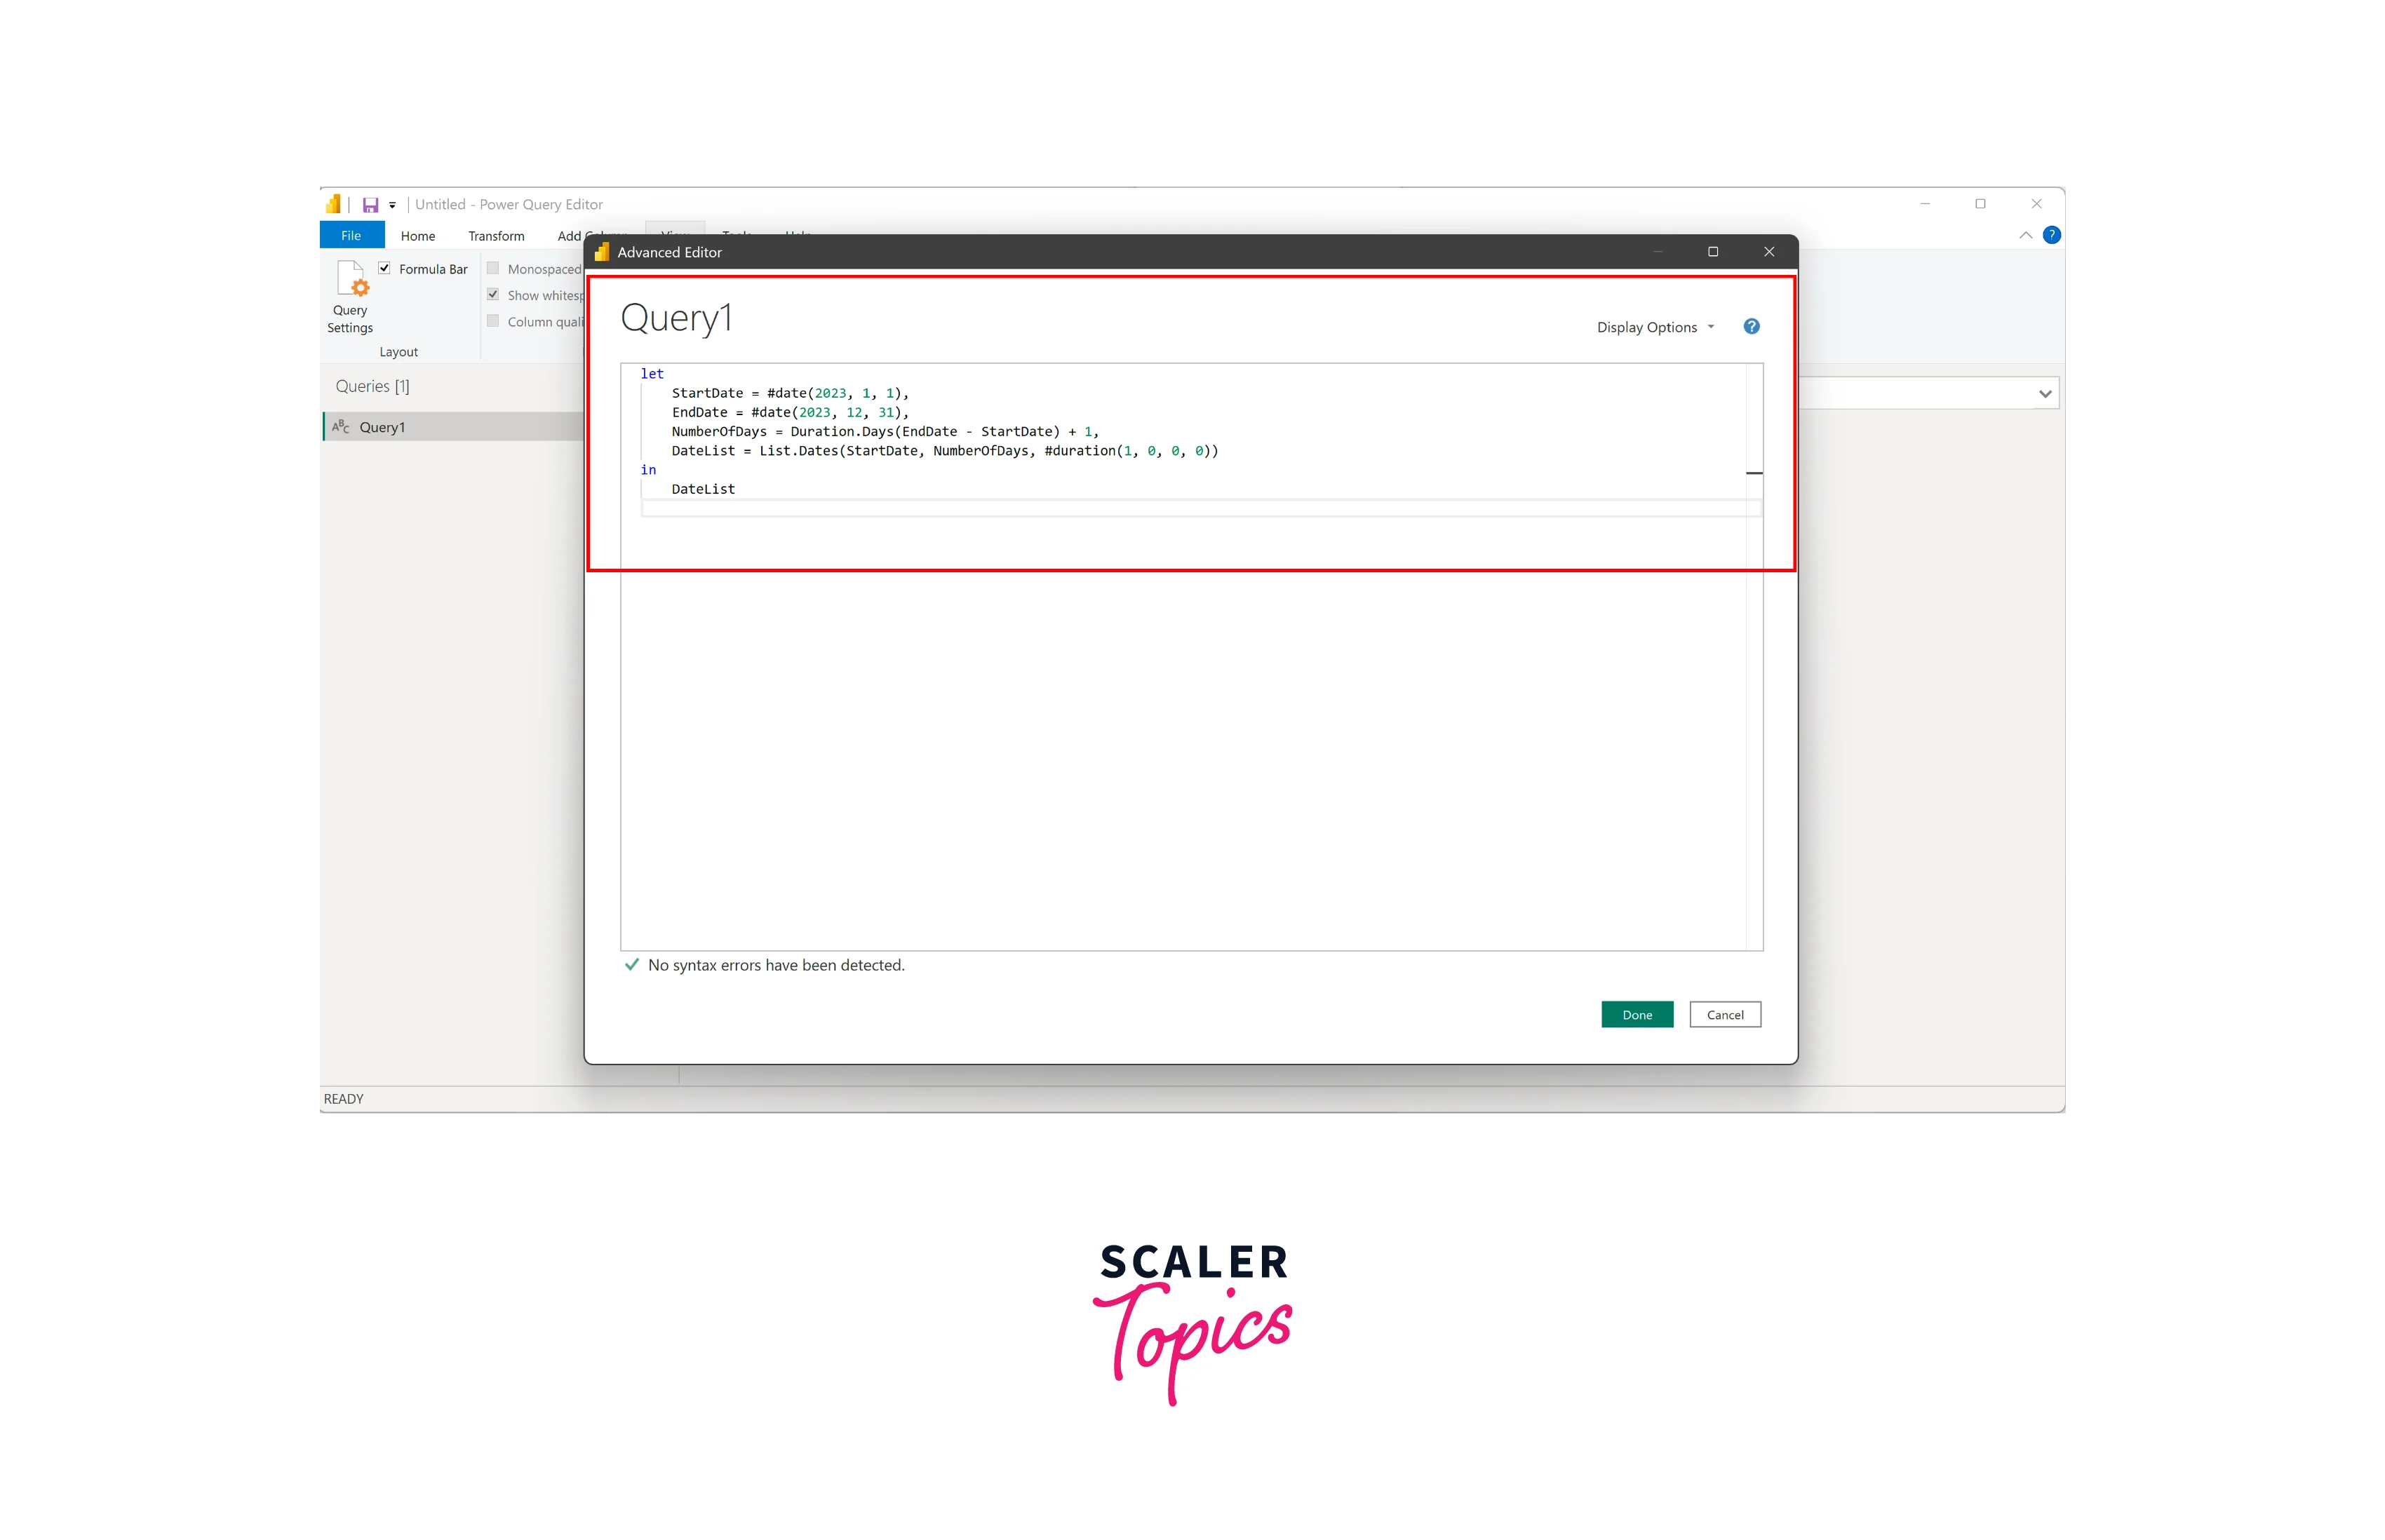
In the Power Query Editor, click on the "Home" tab, then select "New Source" and choose "Blank Query." In the newly created blank query, go to the "View" tab, and click on the "Advanced Editor" option.
-
In the Advanced Editor, enter the M code to generate a list of dates. Here's an example of M code to create a date table spanning from January 1, 2023, to December 31, 2023.
-
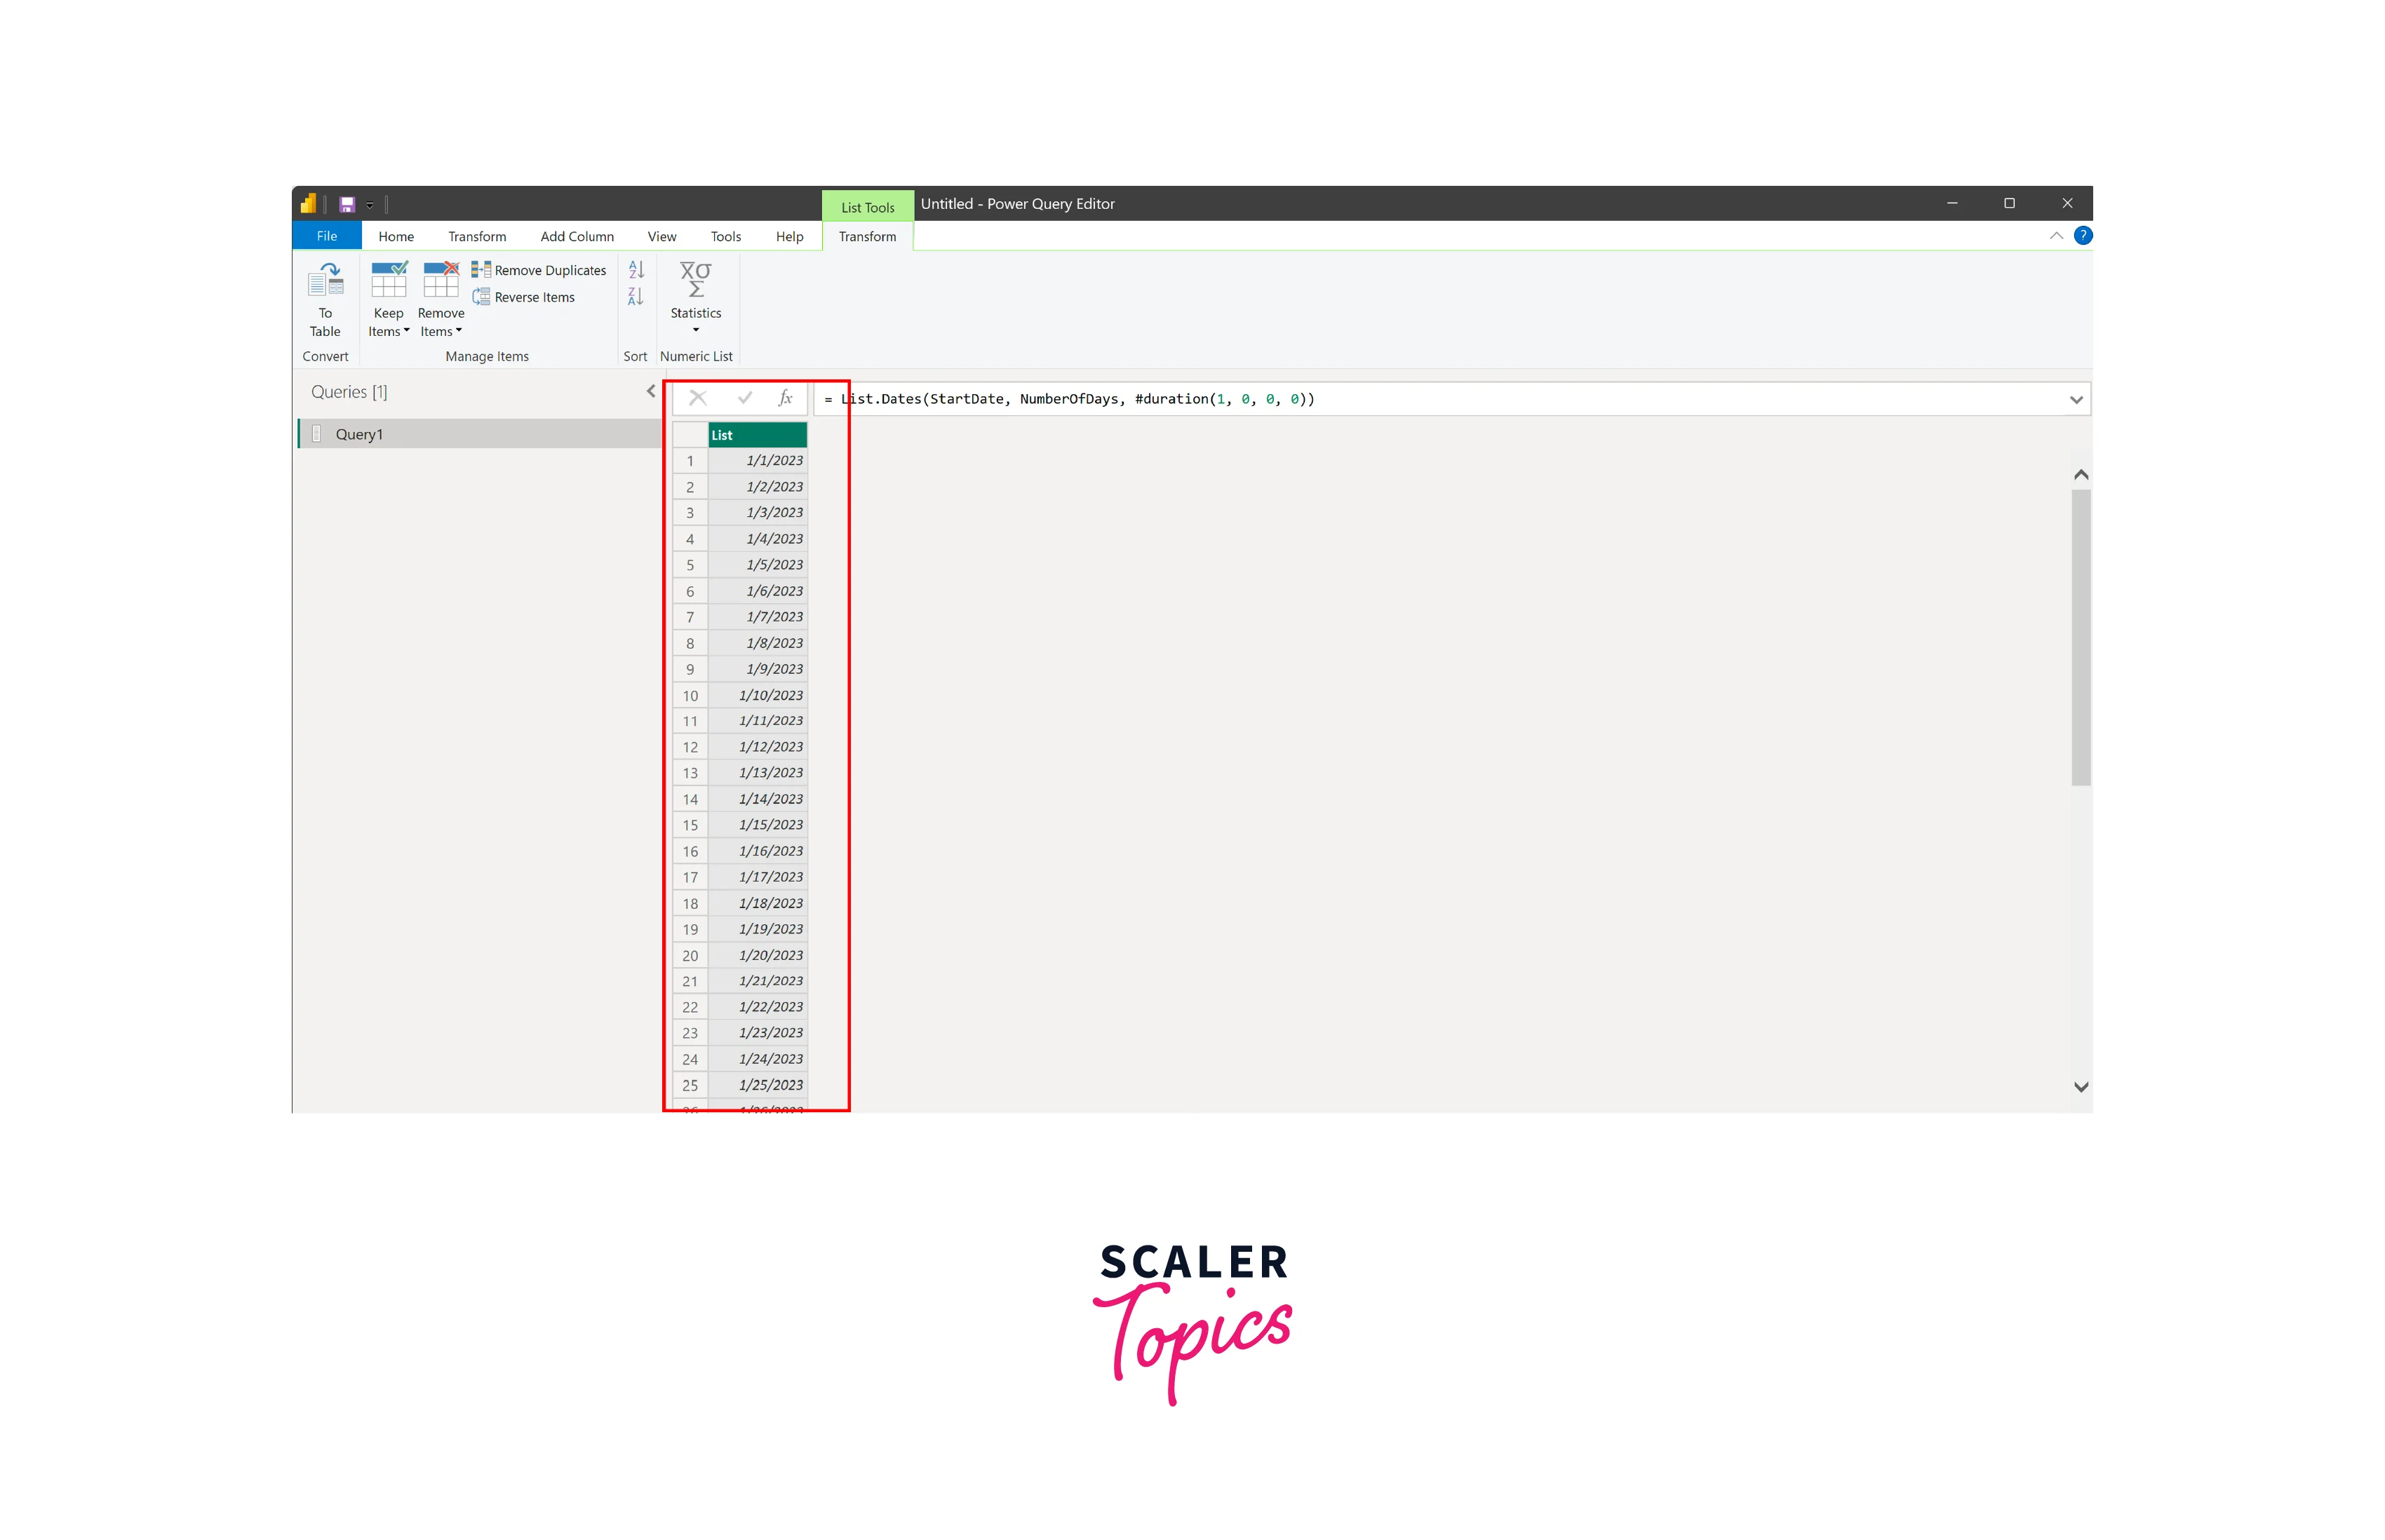
After invoking the custom function, you will get a table with a single column containing the list of dates. Click the expand icon in the column header to expand the table. Rename the columns as needed. For example, you can rename the column containing dates to "Date."
Marking a Table as the Date Table
Once you've generated the date table using one of the methods mentioned earlier, the next step is to designate it as a Date Table. Simply right-click on the table's name in the Fields pane and choose 'Mark as date table.
Creating Relationships between Date Tables and Other Tables
Creating relationships between date tables and other tables in your Power BI data model is crucial for meaningful analysis. To establish a relationship, go to the 'Model' view, drag and connect the date column in the date table with the corresponding date column in your target table. Ensure that you select the appropriate relationship type and Cross filter direction based on your analysis needs. These relationships enable dynamic date-based filtering and facilitate insightful report creation.
Data Filtering and Slicing by Dates
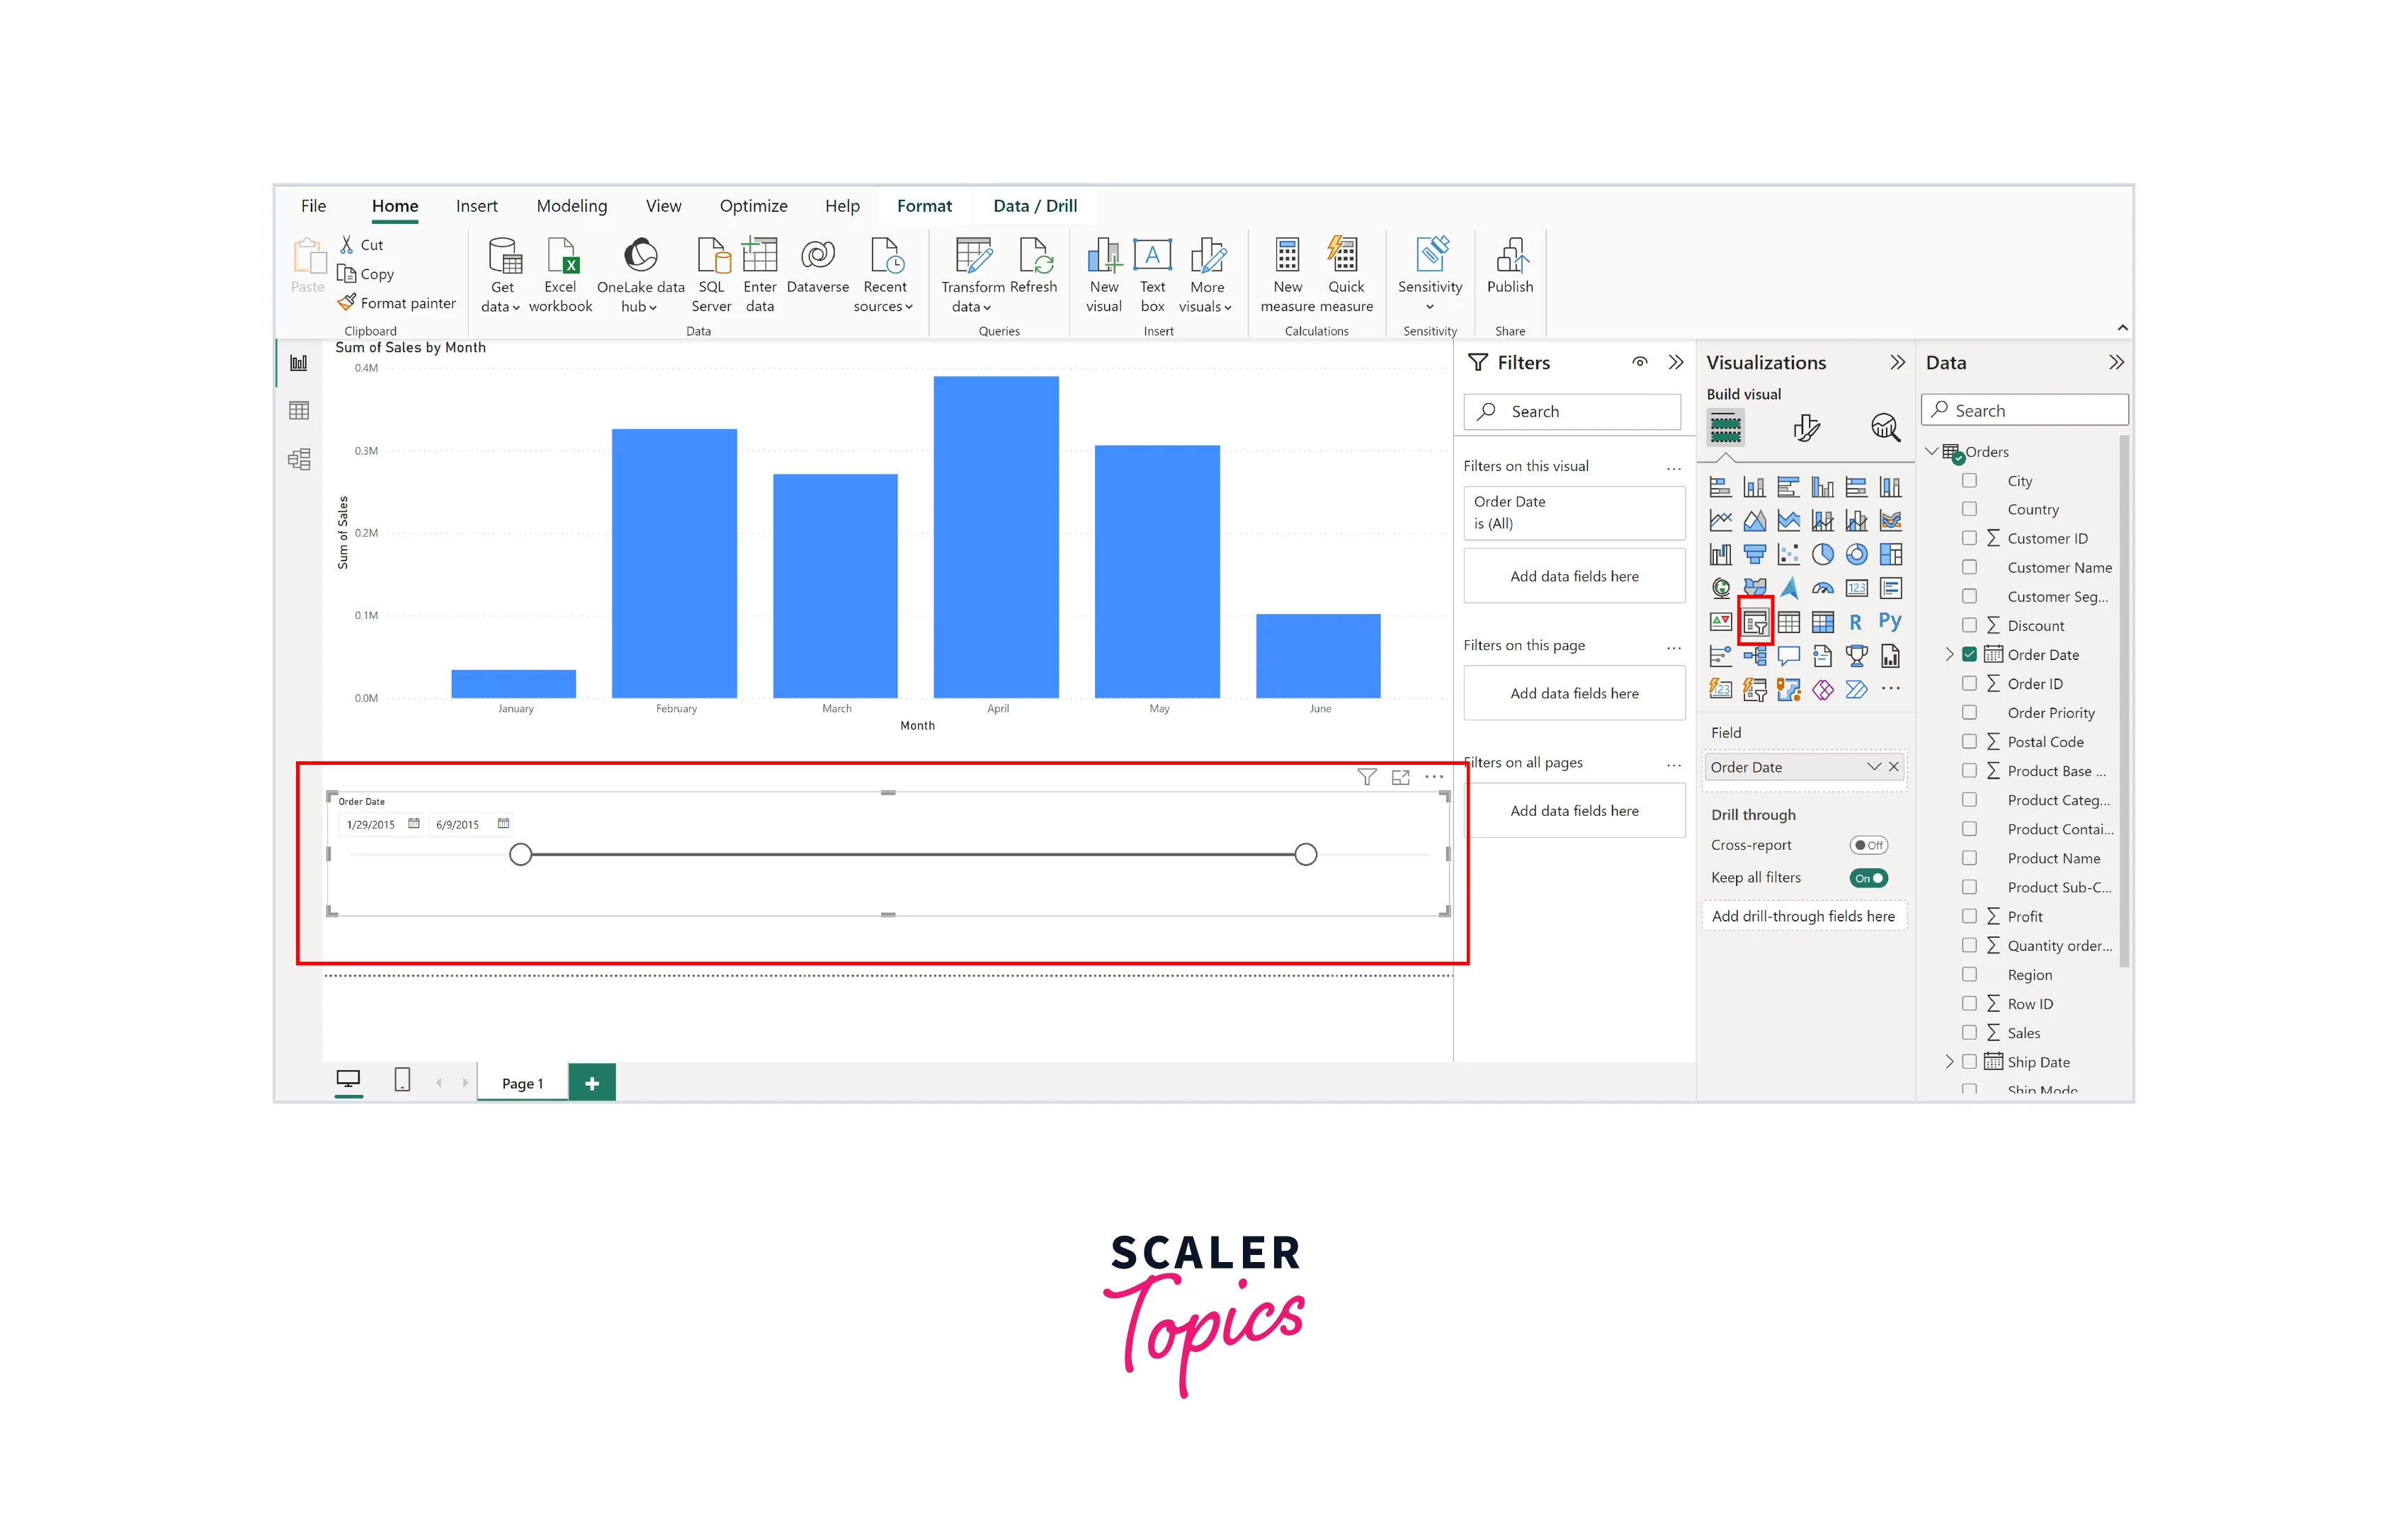
Data filtering and slicing by dates in Power BI is straightforward. You can use date attributes from your date table to filter visuals or create slicers. To filter data, drag a date attribute (e.g., Year, Month, Day) into the visual's 'Filters' or 'Axis' field. To create a slicer, add a date attribute to the 'Slicer' visual and interactively select date ranges. You can select specific date ranges or use relative date filtering options for dynamic analysis. These actions help focus your insights on specific time frames and enhance your data exploration.
Visualizing Time Series Data in Power BI
1. Creating Line Charts and Area Charts
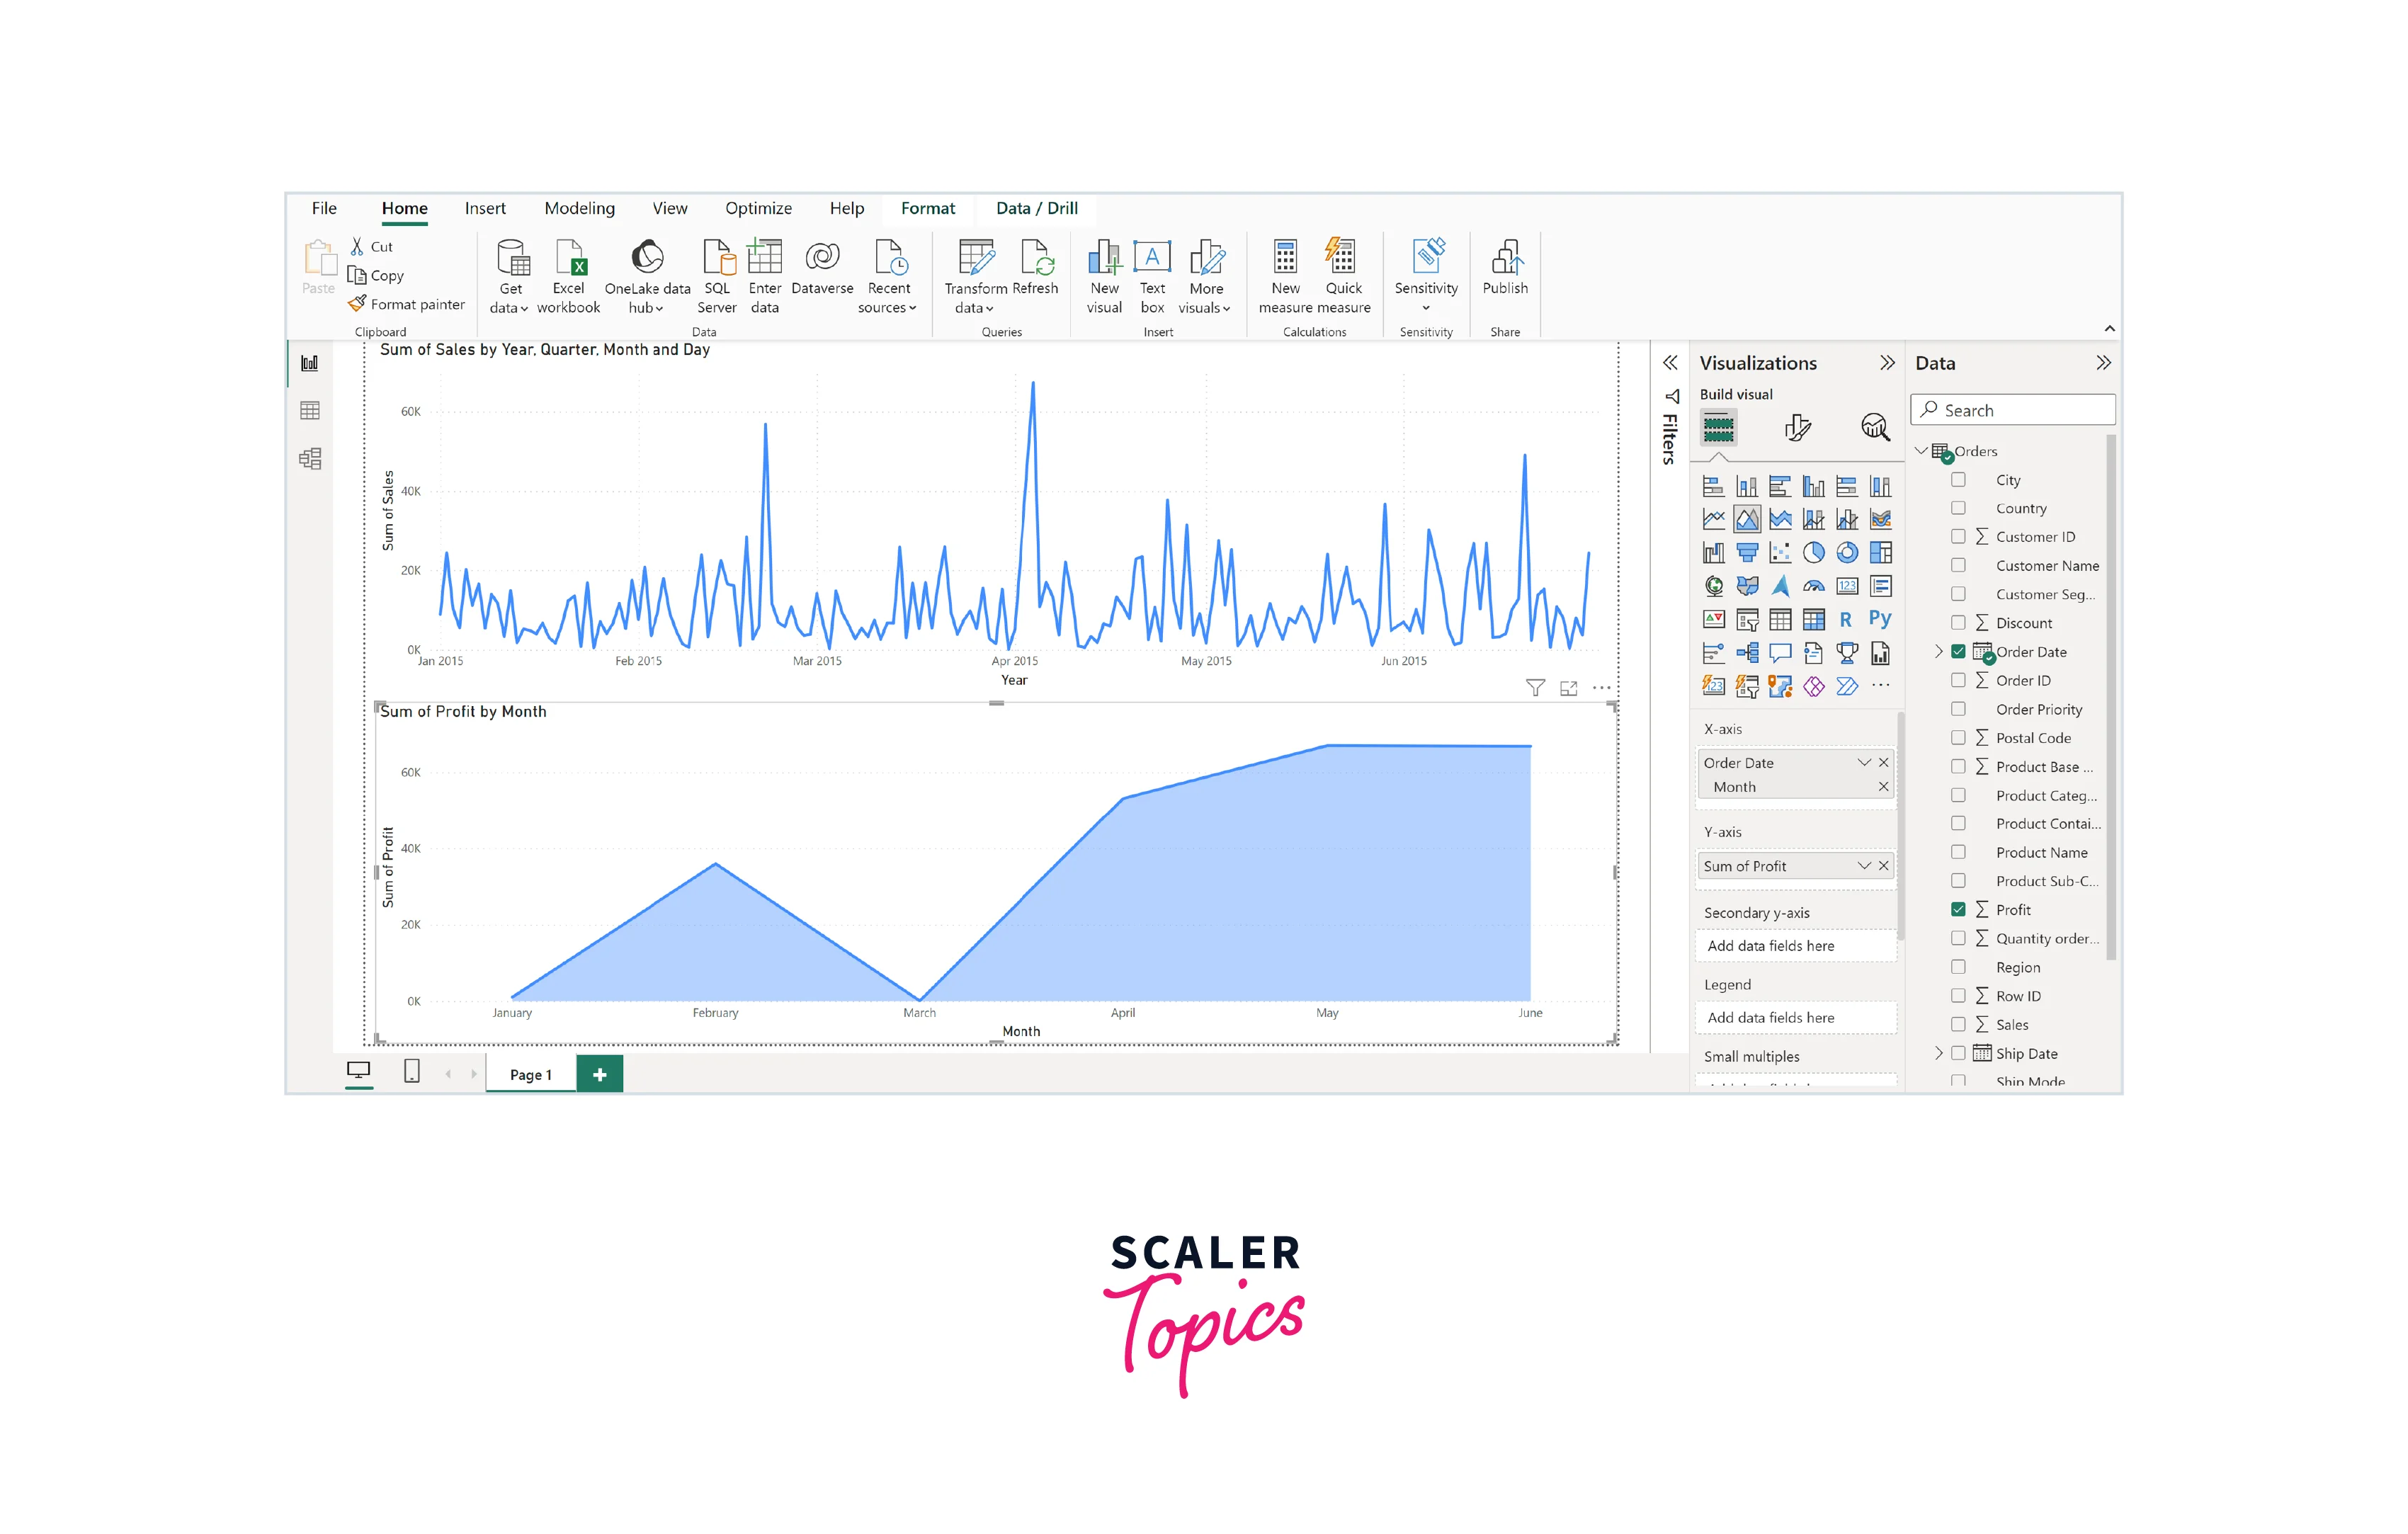
Line charts and area charts are powerful tools for visualizing time series data in Power BI. Line charts display data as a series of data points connected by lines, making it easy to see trends and fluctuations over time. Area charts provide a similar view but fill the area under the line, emphasizing the cumulative effect. Both chart types allow users to track changes, identify patterns, and compare time-based data, making them ideal for visualizing time series data in a clear and informative manner.
2. Utilizing Time Series Analysis and Forecasting
Time series analysis and forecasting in Power BI enable you to uncover hidden patterns and predict future trends in your data. By applying techniques like exponential smoothing and ARIMA modeling, you can gain valuable insights into temporal data. These tools empower you to make data-driven decisions and proactively plan for the future based on historical trends and patterns.
3. Customizing Date Axes and Formats
Customizing date axes and formats in Power BI allows you to tailor the appearance of your visuals. You can adjust date axis intervals, formats, and labels to enhance readability and focus on specific time intervals. This flexibility ensures your reports effectively convey time-based insights, catering to your audience's preferences and analysis needs.
Conclusion
- Effective date handling is essential for robust data analysis in Power BI. Mastering date tables, relationships, and functions equips you to extract valuable insights from your data.
- Utilizing line charts, area charts, and custom date axes, you can visualize time series data with precision, allowing for trend analysis and forecasting.
- By harnessing the full potential of Power BI's date capabilities, you empower yourself to transform raw data into actionable insights, enabling better decision-making and data-driven outcomes.