Dax Functions in Power BI
Overview
In the world of data analysis and visualization, Power BI, developed by Microsoft, stands as a powerful business intelligence tool. At the heart of its capabilities lies the Data Analysis Expressions (DAX) language, a formula language specifically designed for Power BI and other Microsoft tools. DAX function in Power BI empowers users to create custom calculations, measures, and aggregations, adding a new layer of flexibility to data analysis. In this article, we delve into various DAX functions, exploring syntax, and uses to create insightful reports.
Prerequisites
To understand the DAX function in Power BI, here are some prerequisites you should consider -
- Basic Data Analysis Knowledge -
Familiarity with fundamental data analysis concepts such as data types, tables, columns, and basic calculations will help you grasp DAX functions more effectively. - Data Modeling Concepts -
Understanding concepts like relationships between tables, one-to-many, many-to-many relationships, and star schema modeling will be crucial for using DAX functions effectively. - Microsoft Excel Experience -
Since DAX is built on similar principles as Excel formulas, having a background in Excel and experience with formula creation will be beneficial. - Mathematics and Statistics -
Basic knowledge of mathematical and statistical concepts will be helpful, especially when working with functions that involve calculations like averages, sums, and percentages.
DAX Formula - Syntax
To understand any language with ease, breaking down a statement into individual elements is really helpful. When dealing with the DAX function in Power BI, mastering the syntax is key to effectively creating custom calculations. Let's take a look at the example below to dive into the syntax of a DAX expression -
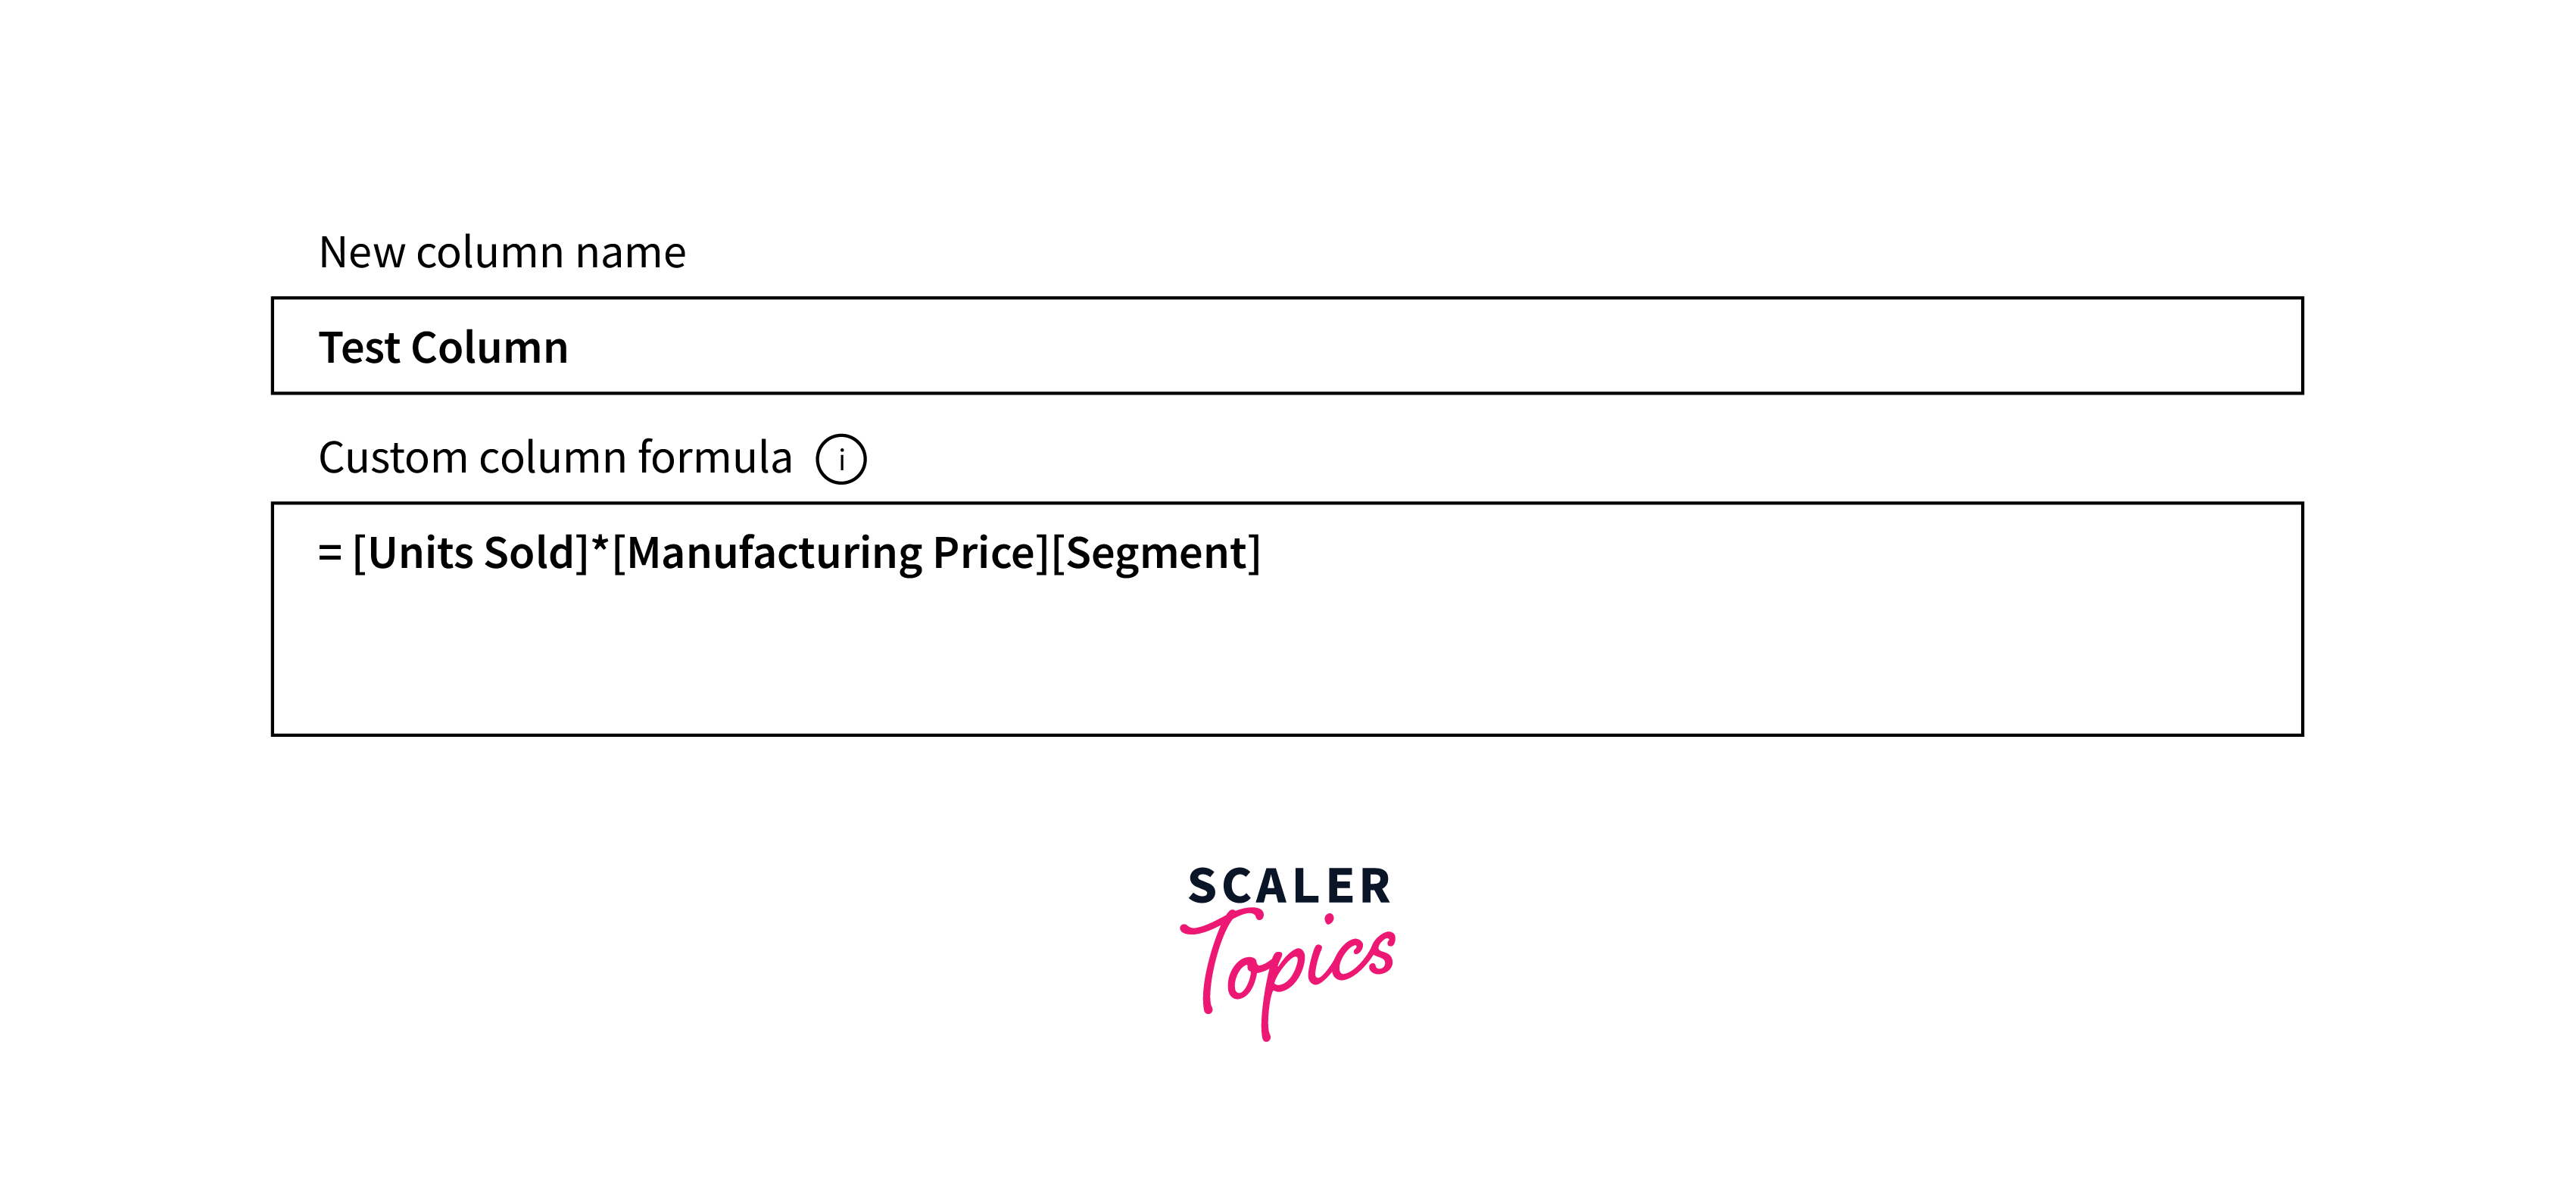
This representation depicts a custom formula designed to generate new columns by multiplying the values of two existing columns. Now, let's dissect the elements of this DAX formula to comprehend their roles -
- Test Column -
This refers to the name you assign to the new measure you're creating. - (=) Sign -
The equal sign marks the initiation of your DAX formula. - [Units Sold] and [Manufacturing Price] -
These are the arguments or columns whose values are utilized to produce the final output. - (*) -
The asterisk symbol acts as the multiplication operator, signifying the operation to be performed on the column variables. - [Segment] -
This component represents the classification associated with the resulting formula.
DAX Functions
Aggregate
MIN
- Definition -
The MIN function in DAX returns the minimum value from a column or expression. - Syntax -
MIN(column or expression) - Uses -
The MIN function is commonly used to find the smallest value within a specified column or expression for tasks like identifying the lowest sales figure, determining the earliest date, or analyzing the minimum value within a dataset.
MAX
- Definition -
The MAX function in DAX retrieves the maximum value from a specified column or expression. - Syntax -
MAX(column or expression) - Uses -
The MAX function is commonly employed to identify the largest value within a specified column or expression for tasks such as finding the highest revenue, determining the latest date, or analyzing the peak value in a dataset.
AVERAGE
- Definition -
The AVERAGE function in DAX calculates the arithmetic mean of a specified column or expression. - Syntax -
AVERAGE(column or expression) - Uses -
The AVERAGE function determines the average value of the data within a given column or expression. It's particularly useful for analyzing trends, comparing values against the mean, and understanding the central tendency of the data.
SUM
- Definition -
The SUM function in DAX calculates the sum of values within a specified column or expression. - Syntax -
SUM(column or expression) - Uses -
The SUM function is commonly used to aggregate and obtain the total of values, making it useful for tasks such as calculating total sales, expenses, or quantities in a dataset.
SUMX
- Definition -
The SUMX function in DAX calculates the sum of an expression evaluated for each row in a table and then adds up those individual sums. - Syntax -
SUMX(table, expression) - Uses -
SUMX is useful when you need to calculate each table row and sum up the results, allowing for customized calculations, such as calculating weighted sums or performing complex aggregations.
Text
REPLACE
- Definition -
The REPLACE DAX function in Power BI replaces a specified portion of text within a text string with new text. - Syntax -
REPLACE(text, start_num, num_chars, new_text) - Uses -
The REPLACE function is commonly employed to substitute a text segment in a string with new content, making it useful for data cleaning, modifying text-based data, or transforming specific parts of a text field.
SEARCH
- Definition -
The SEARCH function in DAX is used to find the starting position of a specified substring within a given text string, and it's case-insensitive. - Syntax -
SEARCH(find_text, within_text, [start_num]) - Uses -
SEARCH is commonly utilized for tasks such as extracting specific information from text fields, identifying patterns, or locating keywords within a larger text body.
UPPER
- Definition -
The UPPER function in DAX converts all characters in a text string to uppercase. - Syntax -
UPPER(text) - Uses -
The UPPER function standardizes text by converting it to uppercase, making it easier for tasks such as text comparison, data normalization, and enhancing data consistency within your dataset.
FIXED
- Definition -
The FIXED DAX function in Power BI is used to format a number as text with a fixed number of decimal places and optional thousand separators. - Syntax -
FIXED(number, decimals, comma) - Uses -
FIXED is useful for ensuring consistent formatting of numbers in reports and visualizations, making it easier for users to interpret and compare numerical data.
CONCATENATE
- Definition -
The CONCATENATE function in DAX combines multiple text strings into one text string. - Syntax -
CONCATENATE(text1, text2) - Uses -
The CONCATENATE DAX function in Power BI is commonly employed to create compound text values by merging different text components, such as names and addresses.
Date
DATE
- Definition -
The DATE function creates a date value from separate year, month, and day components. - Syntax -
DATE(year, month, day) - Uses -
DATE is essential for creating date-based calculations and comparisons.
HOUR
- Definition -
The HOUR function extracts the hour component from a given datetime value. - Syntax -
HOUR(datetime) - Uses -
HOUR is commonly utilized for time-based analysis and categorization. It helps isolate the hour portion from a datetime value, allowing you to analyze data by specific day hours, track peak activity times, or create time-based visualizations.
WEEKDAY
- Definition -
The WEEKDAY function determines the day of the week for a given date. - Syntax -
WEEKDAY(datetime) - Uses -
WEEKDAY is useful for date-based analysis and visualization. It helps identify the day of the week (e.g., Monday, Tuesday) corresponding to a given date, allowing you to analyze trends, patterns, or behaviors that are influenced by specific days.
NOW
- Definition -
The NOW function in DAX retrieves the current date and time. - Syntax -
NOW() - Uses -
NOW is often employed for real-time analysis and dynamic reporting. It provides the current date and time, allowing you to track the time of data updates, calculate time intervals, or create time-sensitive calculations.
EOMONTH
- Definition -
The EOMONTH calculates the last day of the month for a specified number of months before or after a given date. - Syntax -
EOMONTH(start_date, months) - Uses -
EOMONTH is commonly utilized for time-based calculations and reporting. It helps determine the end of a specific month relative to a given date, which is useful for tracking due dates, payment periods, or generating time-based summaries within your Power BI reports and analyses.
Logical
AND
- Definition -
The AND function in DAX is used to check if all specified conditions or expressions are true. - Syntax -
AND(logical1, logical2, ...) - Uses -
AND is commonly used for logical comparisons and data filtering. It evaluates multiple conditions and returns true if all conditions are met.
OR
- Definition -
The OR function in DAX checks if at least one of the specified conditions or expressions is true. - Syntax -
OR(logical1, logical2, ...) - Uses -
OR is commonly employed for logical comparisons and data filtering. It evaluates multiple conditions and returns true if at least one condition is true.
NOT
- Definition -
The NOT function in DAX is used to reverse the logical value of a given condition or expression. - Syntax -
NOT(logical) - Uses -
NOT is frequently used for logical negation and data filtering. It returns true if the given condition or expression is false, and vice versa.
IF
- Definition -
The IF function in DAX performs conditional branching based on a specified condition or expression. - Syntax -
IF(logical_test, value_if_true, value_if_false) - Uses -
IF is extensively used for implementing conditional logic and data transformations. It evaluates a logical test and returns different values based on whether the test is true or false.
IFERROR
- Definition -
The IFERROR function in DAX provides an alternate value or action when a specified expression results in an error. - Syntax -
IFERROR(expression, value_if_error) - Uses -
IFERROR is commonly utilized to handle errors and enhance data robustness. It evaluates an expression and returns the expression's result if it's not an error, but if the expression results in an error, it returns the specified alternative value. This function is valuable for creating error-resistant calculations.
Counting
DISTINCTCOUNT
- Definition -
The DISTINCTCOUNT function in DAX calculates the count of unique values within a specified column or expression. - Syntax -
DISTINCTCOUNT(column or expression) - Uses -
DISTINCTCOUNT is commonly used to determine the number of distinct or unique items in a dataset. It's valuable for tasks like counting the number of unique customers, products, or categories.
COUNT
- Definition -
The COUNT function in DAX calculates the number of non-blank rows within a specified column or table. - Syntax -
COUNT(column or table) - Uses -
COUNT is commonly used to determine the quantity of non-blank or non-null values in a dataset. It's valuable for tasks like counting the number of sales transactions, orders, or occurrences of specific values.
COUNTA
- Definition -
The COUNTA function in DAX calculates the count of non-blank values within a specified column or expression. Unlike COUNT, COUNTA also supports Boolean data types. - Syntax -
COUNTA(column or expression) - Uses -
COUNTA is commonly used to determine the quantity of non-blank values in a dataset, aiding in assessing data completeness for various data types within Power BI reports.
COUNTROWS
- Definition -
The COUNTROWS function in DAX calculates the number of rows within a specified table or table expression. - Syntax -
COUNTROWS(table or table expression) - Uses -
COUNTROWS determines total rows or filtered subset size in tables, aiding insights in Power BI reports.
COUNTBLANK
- Definition -
The COUNTBLANK function in DAX calculates the count of blank (empty) values within a specified column or expression. - Syntax -
COUNTBLANK(table or table expression) - Uses -
COUNTBLANK is commonly used to determine the quantity of blank (empty) values in a dataset, assess data completeness, and identify areas with missing information within Power BI reports and analyses.
Information
ISBLANK
- Definition -
The ISBLANK function in DAX checks whether a specified value or expression is blank (empty). - Syntax -
ISBLANK(value) - Uses -
ISBLANK is employed for logical tests, returning true if a value is blank and useful for handling missing data conditions in Power BI.
ISNUMBER
- Definition -
The ISNUMBER function in DAX checks if a specified value or expression is a numeric value. - Syntax -
ISNUMBER(value) - Uses -
ISNUMBER is employed for logical tests, indicating if a value is numeric or not, aiding in data validation and filtering within Power BI.
ISTEXT
- Definition -
The ISTEXT function in DAX checks if a specified value or expression is a text value. - Syntax -
ISTEXT(value)
ISNONTEXT
- Definition -
The ISNONTEXT function in DAX checks if a specified value or expression is not a text value. - Syntax -
ISNONTEXT(value)
ISERROR
- Definition -
The ISERROR function in DAX checks if a specified value or expression results in an error. - Syntax -
ISERROR(value)
DAX Calculation Types
Calculated Columns
Calculated columns in Power BI are custom fields created by applying DAX expressions to existing columns. They offer computed values for each row, enhancing data modeling and analysis. For instance, creating a calculated column named "Total Sales" by multiplying "Units Sold" with "Price Per Unit." These calculated columns aid in data transformation, aggregations, and generating new insights based on custom calculations in Power BI reports.
Calculated Measures
Calculated measures in Power BI are custom calculations using DAX expressions applied to numerical data. They offer dynamic insights by evaluating expressions across dimensions and aggregations. For instance, creating a calculated measure named "Average Revenue" by calculating the average of "Revenue" across different product categories. These calculated measures enhance analysis by providing on-the-fly computations for metrics, supporting flexible insights and dynamic reporting in Power BI.
Conclusion
- DAX functions are the backbone of Power BI, enabling users to uncover deeper insights and make data-driven decisions.
- Calculated columns and measures extend the capabilities of Power BI by allowing tailored calculations and dynamic aggregations.
- With the DAX function in Power BI, users can transform raw data into meaningful information, providing a solid foundation for robust reporting. Understanding DAX's syntax and various functions equips users to manipulate data effectively, producing impactful visualizations.