DAX Syntax and Measures in Power BI
Overview
In the realm of data analysis and visualization, Power BI, a tool developed by Microsoft, has emerged as a powerful tool. Central to its capabilities is DAX, or Data Analysis Expressions. DAX is a formula language used for creating custom calculations, measures, and aggregations in Power BI. In this article, we delve into the world of DAX measures and syntax, unlocking the key concepts that enable you to transform raw data into meaningful insights. Whether you're a beginner seeking to understand the basics or an experienced user looking to fine-tune your skills, this guide will equip you with the essential knowledge to harness the full potential of Power BI's analytical capabilities.
DAX Basics and Formulas
To start mastering DAX in Power BI, it's essential to start with the fundamentals. DAX, which stands for Data Analysis Expressions, is the backbone of Power BI's analytical capabilities. At its core, DAX is a formula language used for creating custom DAX measures, calculations, and aggregations.
Every DAX formula must commence with an equals sign (=). After the equals sign, you have the flexibility to provide an expression that either evaluates to a scalar value or can be converted into a scalar value. These expressions encompass the following elements -
- Scalar constants or expressions employing scalar operators like (+, -, *, /, >=, ...).
- References to columns or tables. DAX strictly employs tables and columns as inputs for functions.
- Inclusion of operators, constants, and values as part of an expression.
- Utilization of the outcome of a function and its mandatory arguments. Certain DAX functions yield a table rather than a scalar value, necessitating encapsulation within another function that evaluates the table and produces a scalar value. The exception is when the table is a single-column, single-row table, in which case it is treated as a scalar value.
- Most DAX functions necessitate one or more arguments, encompassing tables, columns, expressions, and values. However, a subset of functions, such as PI, demands no arguments but mandates the use of parentheses to signify a null argument. For instance, you should consistently input PI() rather than just PI. Furthermore, you can nest functions within other functions.
- Expressions can encompass any combination of the following elements - operators, constants, or references to columns.
Suppose we have a Power BI dataset with a table named "Sales" that contains two columns - "Revenue" and "Discount". We want to calculate the average revenue after applying a discount of 10%. Here's the DAX formula for this calculation:
DAX Functions and Operators
DAX functions and operators are the tools that transform data into insights within Power BI. In this section, we'll explore the world of DAX functions and operators, breaking it down into three subsections.
Common DAX Functions
Common DAX functions are the foundation of data analysis in Power BI. They allow you to perform basic yet critical operations on your data. Here are a few of the commonly used DAX functions:
- SUM:
Adds up values in a column. - AVERAGE:
Calculates the average of a column. - COUNT:
Counts the number of rows in a table or column. - MIN:
Returns the minimum value in a column. - MAX:
Returns the maximum value in a column. - COUNTROWS:
Counts the number of rows in a table. - COUNTA:
Counts the number of non-blank values in a column. - DISTINCTCOUNT:
Counts the number of distinct values in a column.
Mathematical and Statistical DAX Functions
DAX doesn't stop at basic arithmetic. It offers a rich set of mathematical and statistical functions for advanced analysis. A few of the most common mathematical and statistical DAX functions include:
- SQRT:
Calculates the square root of a number. - ROUND:
Rounds a number to a specified number of decimal places. - STDEV.P:
Computes the standard deviation of a population. - ABS:
Returns the absolute value of a number. - LOG:
Calculates the natural logarithm of a number. - EXP:
Raises the constant 'e' to a specified power. - RANKX:
Assigns a rank to values in a column based on a specified expression.
Time Intelligence Functions for Date Calculations
Time-based data requires specialized handling. DAX's time intelligence functions are designed for precisely that purpose. A few of the most common time intelligence DAX functions are:
- DATESYTD:
Summarizes values for the year-to-date period. - SAMEPERIODLASTYEAR:
Compares values with the same period in the previous year. - TOTALYTD:
Accumulates values from the start of the year until a specified date. - DATESBETWEEN:
Filters a table for a specified date range. - CALENDAR:
Generates a table of dates within a specified date range. - LASTDATE:
Returns the last date in a column. - PREVIOUSMONTH:
Returns the table of dates for the previous month. - TOTALMTD:
Calculates the total for the month-to-date period.
Working with DAX Measures
DAX measures are dynamic calculations in Power BI that allow users to perform various operations and aggregations on data. Unlike calculated columns, which add static values to the dataset, DAX measures are computed on the fly, responding to user interactions and filtering in real time. They provide a powerful way to summarize data and create custom calculations for reports and visualizations. For instance, a DAX measure could calculate the total sales revenue, average product prices, or conversion rates. These measures are flexible and adaptable, making them an essential tool for transforming raw data into actionable insights within Power BI dashboards and reports.
Creating Simple Measures with DAX
Creating Simple Measures with DAX in Power BI is a fundamental step in transforming raw data into meaningful insights. Here's a step-by-step guide on how to create simple DAX measures in Power BI:
-
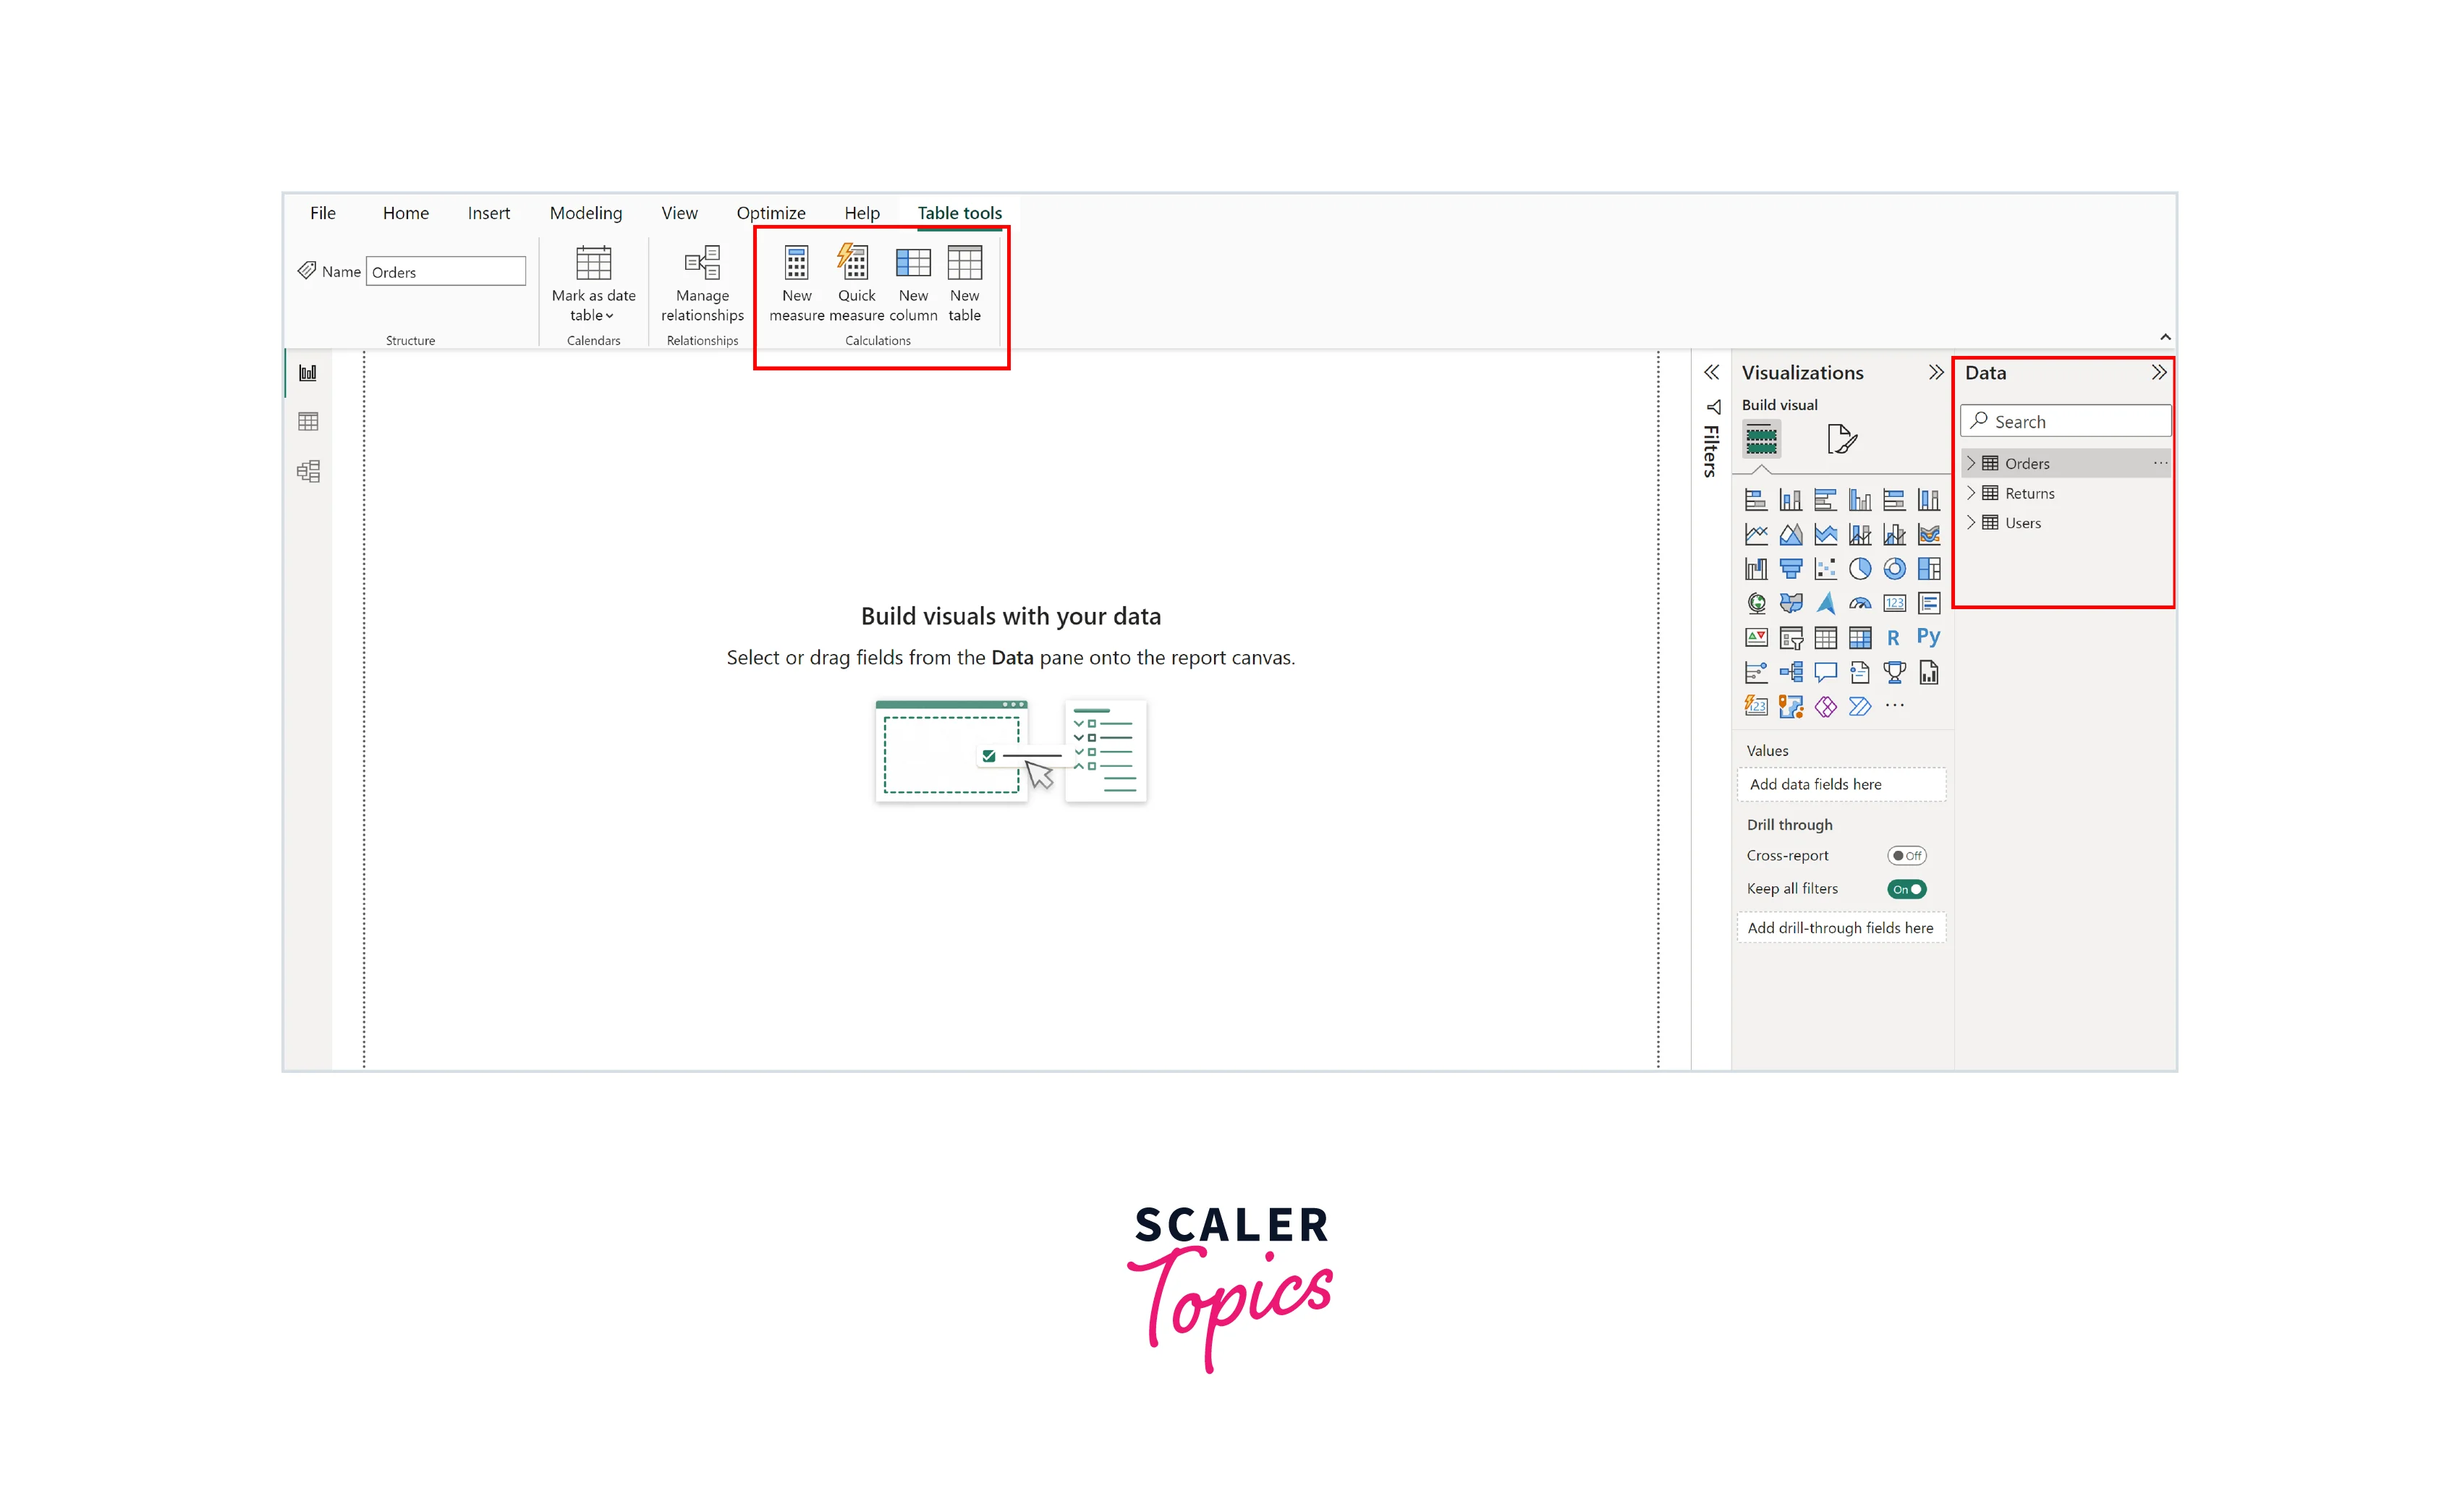
Open your Power BI report and select the table for which you want to create a measure. For example, if you're working with order data, you might choose a table named "Orders".
-
To create a new measure, click on the "New Measure" button in the toolbar at the top of the screen.
-
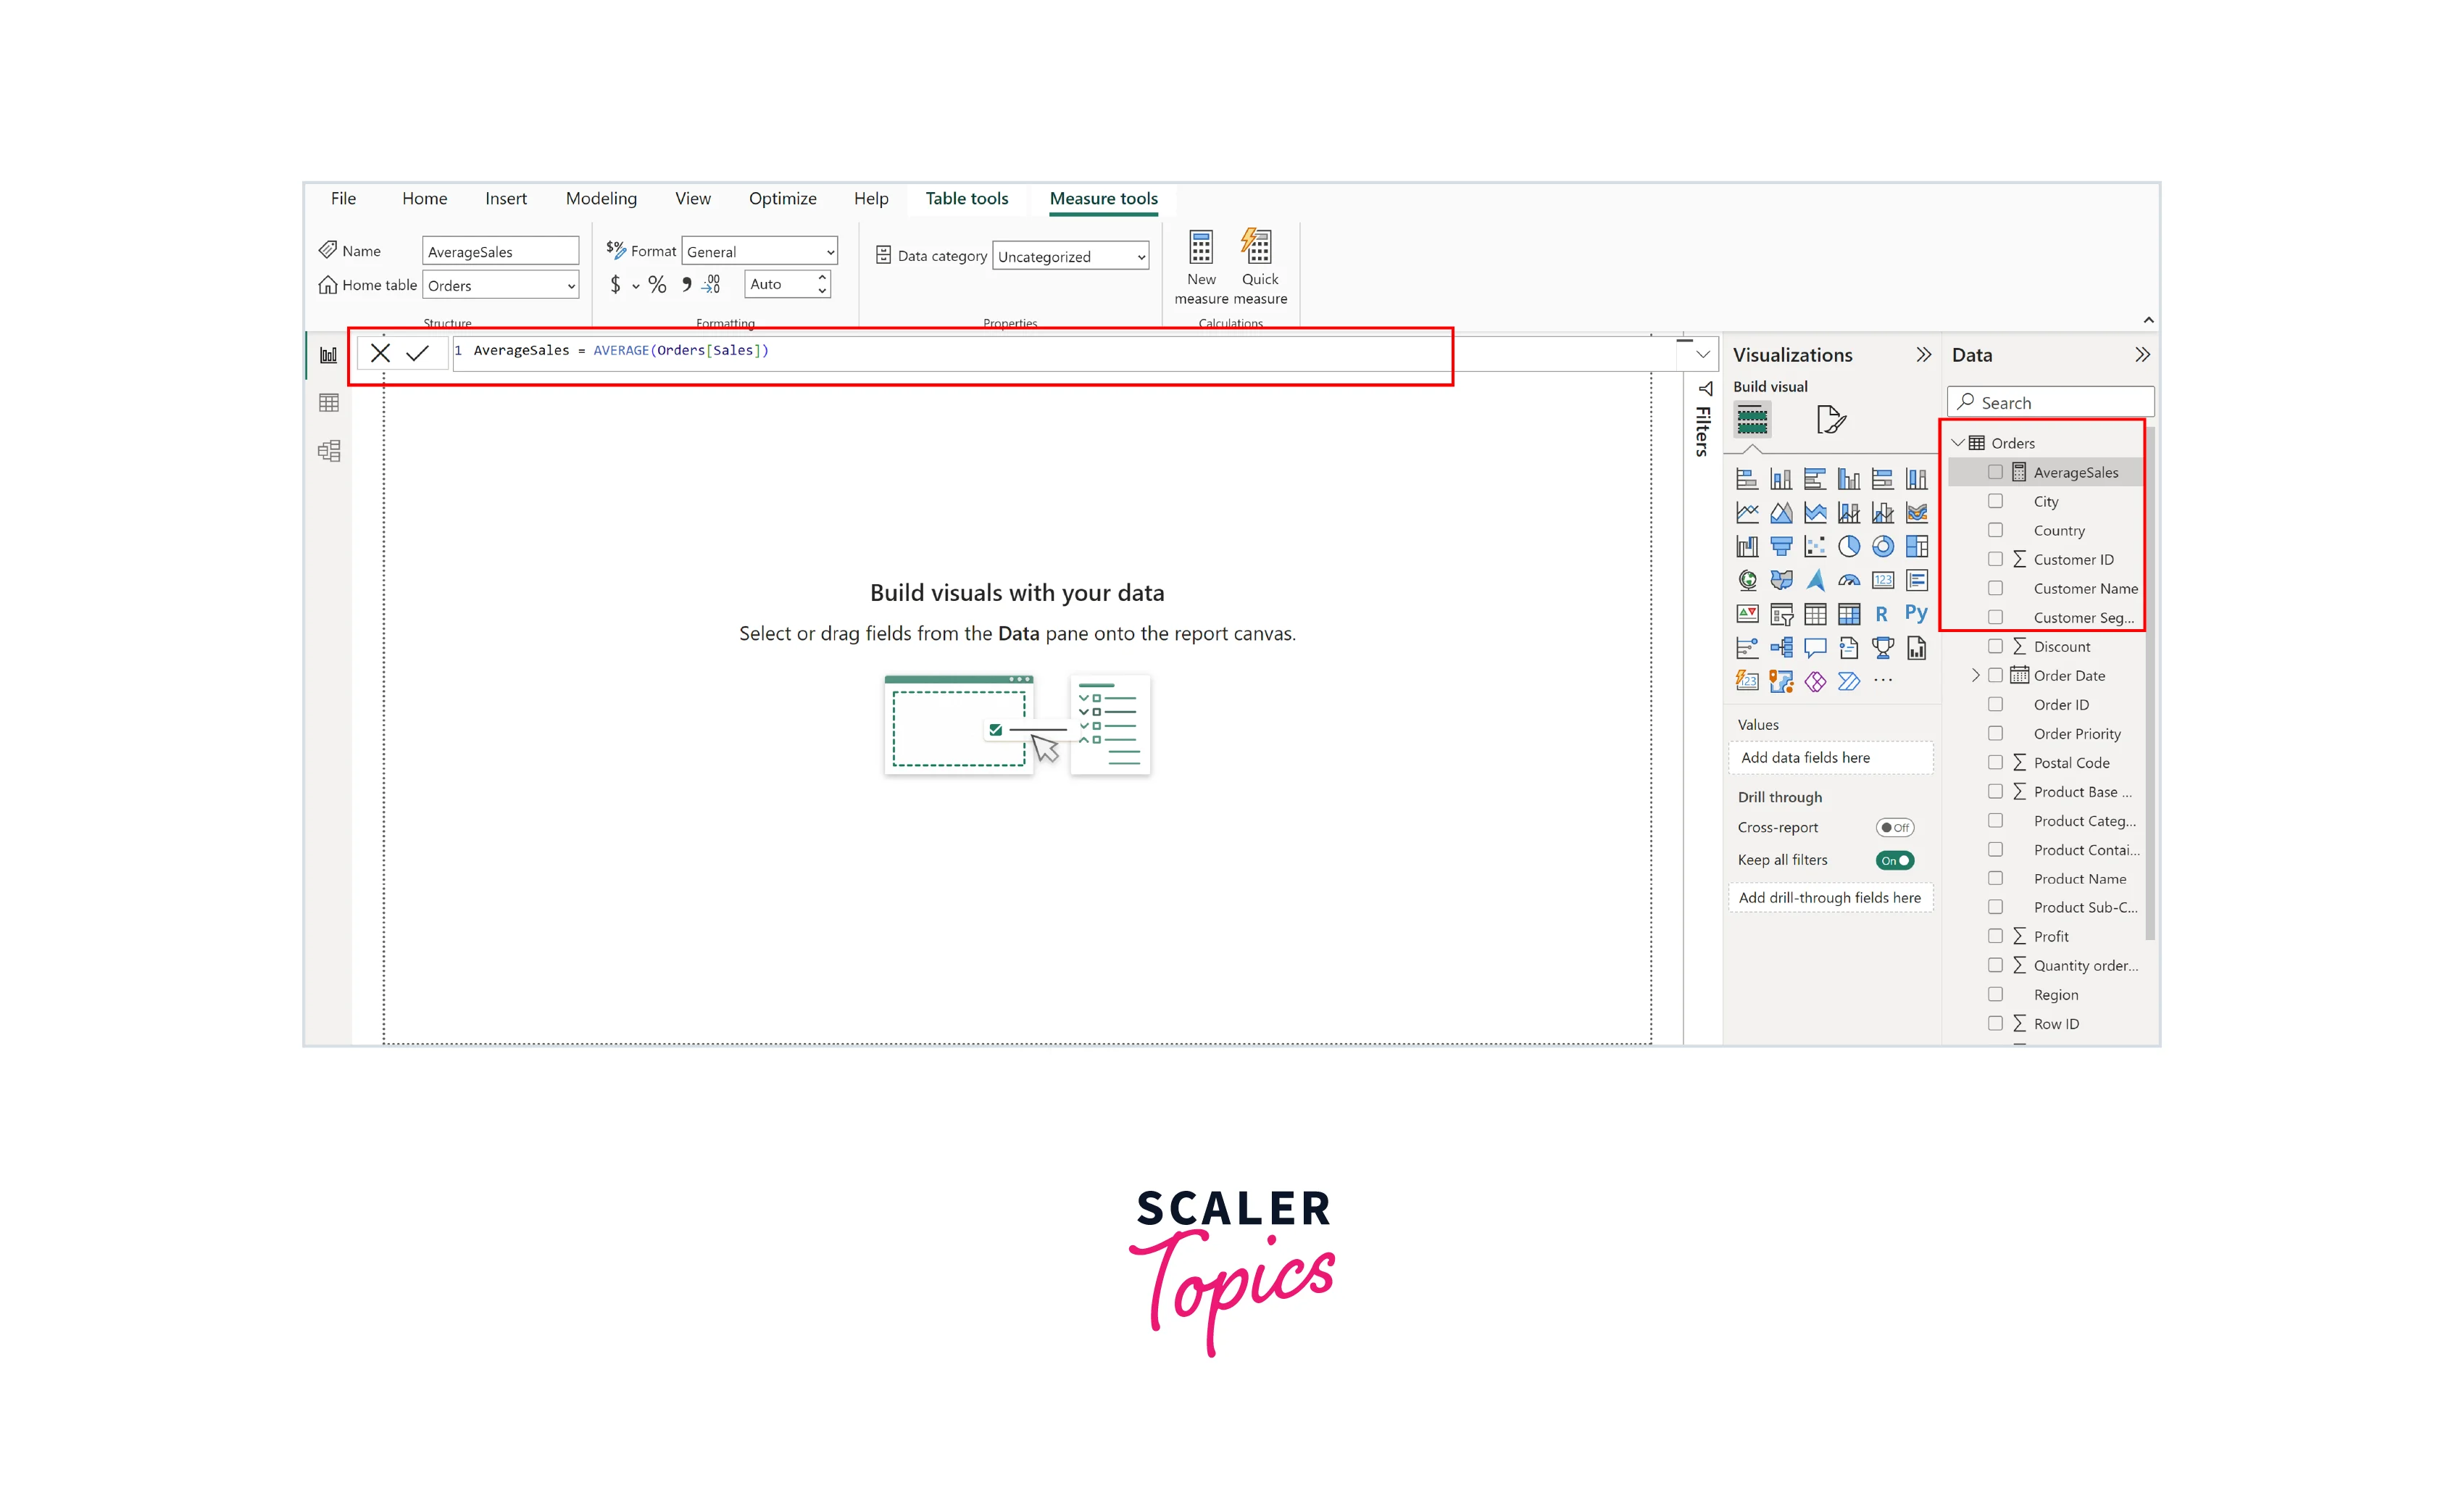
In the formula bar that appears at the top of the screen, you can start typing your DAX expression. For example, let's create a simple measure to calculate the average sales. After entering your DAX expression, press Enter. Power BI will validate the expression, and if there are no errors, it will create the measure.
-
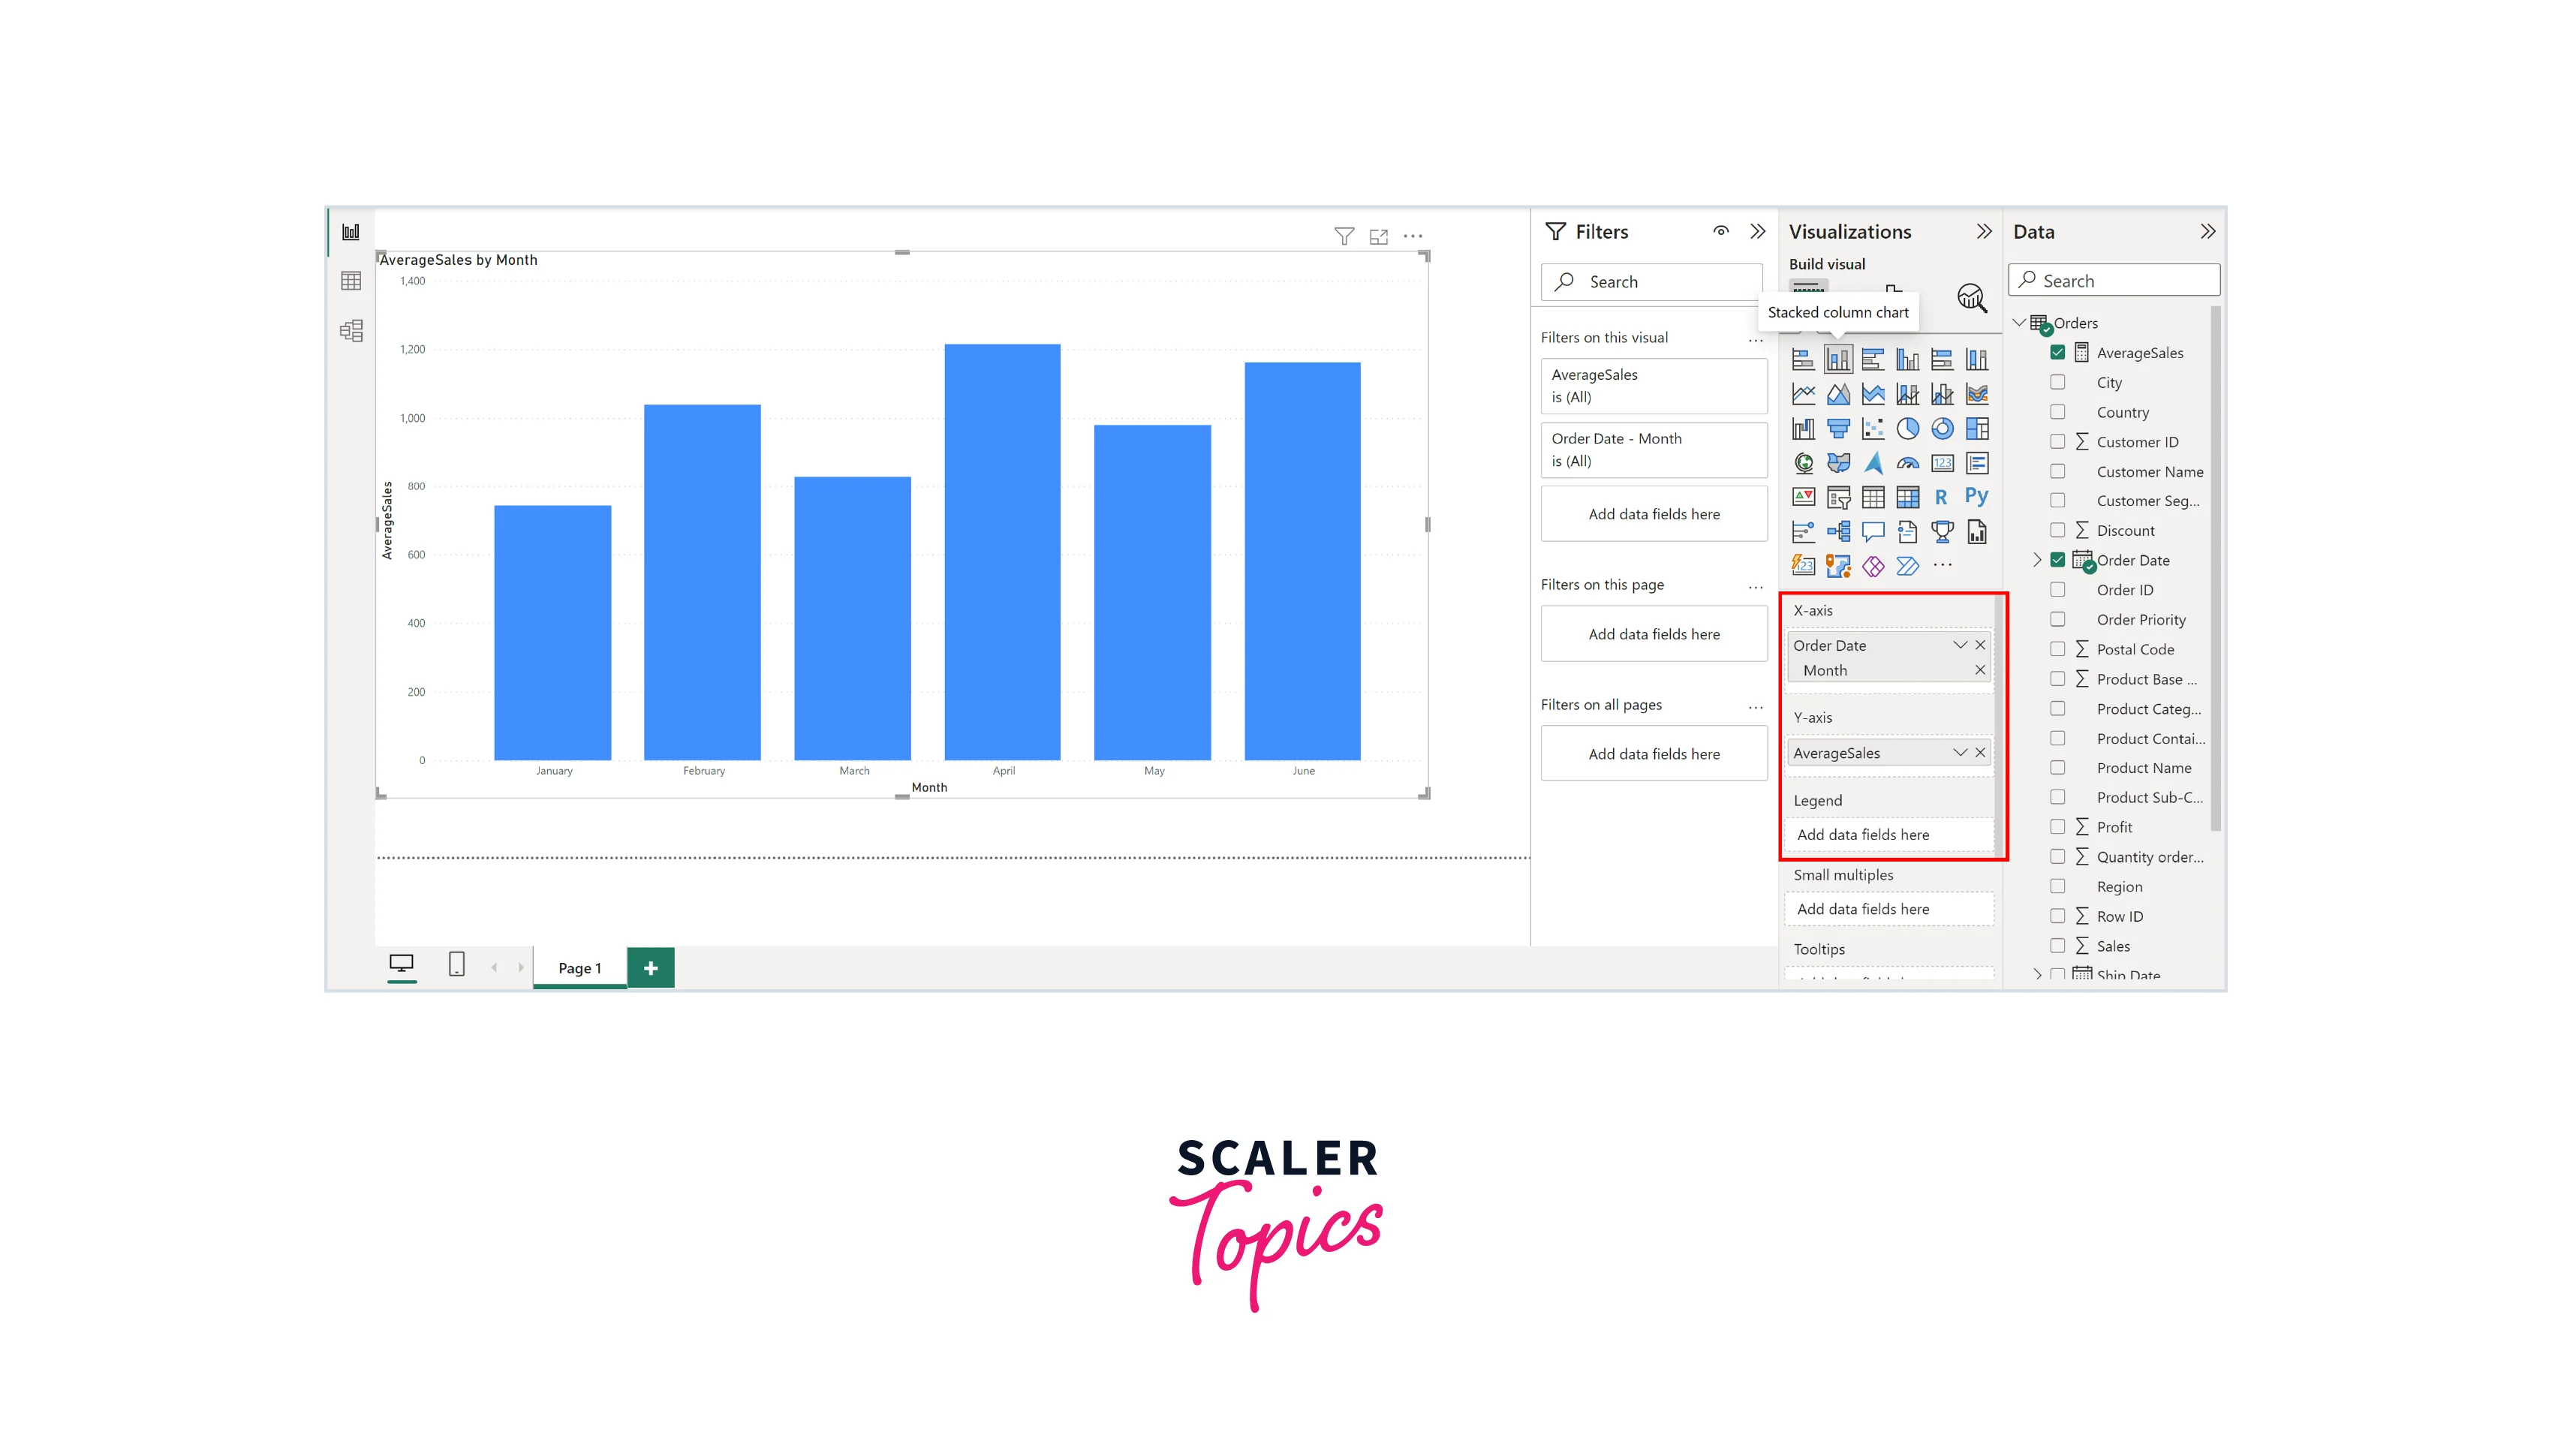
With your measure created, you can now use it in visualizations within the "Report View". Drag and drop the "AverageSales" measure into a visual, such as a table or a chart, to display the calculated results.
Understanding Measure Context and Row Context
In Power BI and DAX, comprehending measure context and row context is pivotal for creating sophisticated calculations that respond dynamically to user interactions. Measure context is the environment in which a measure operates, while row context pertains to the current row being evaluated in a table or visualization.
For example, imagine you have an orders dataset with a "Orders" table and a measure named "Average Sales". When you place "Average Sales" in a visualization, it operates in the measured context, calculating the average sales for the entire dataset. However, if you introduce a dimension like "Region", "Month", or"Customer Segment" into the visualization, row context comes into play. Now, "Average Sales" calculates sales averages within each category/value of the new dimension, adapting its computation for each row. The below figure illustrates this concept by plotting a bar chart for average sales for each month, where our average sales measure adapts its computation for each row.
Applying DAX Measures to Visualizations
Once you've created DAX measures, the next step is to apply them effectively in your Power BI visualizations. Measures are the engine that powers your charts, tables, and graphs. By simply dragging and dropping measures into visualizations in the "Report View," you can instantly generate dynamic insights. For instance, you can use a measure to display total revenue, average ratings, or year-to-date sales in your charts and tables. Furthermore, you can interact with these visualizations by applying filters, slicers, and drill-through actions to explore data from various angles.
DAX Aggregations and Filter Context
In the world of Power BI and DAX, the interplay between aggregations and filter context is a critical concept that significantly influences your data analysis. Aggregations are how you summarize and condense large datasets into more manageable insights, whether it's calculating sums, averages, counts, or other aggregations. Filter context, on the other hand, defines the conditions or filters applied to your data when a user interacts with a report.
For instance, consider a scenario where you want to calculate the total sales for a specific product category within a particular time frame. The aggregation, in this case, is the total sales calculation, while the filter context is defined by the selected product category and time frame. DAX measures and functions take both these aspects into account to provide accurate and dynamic results.
DAX Calculated Columns vs. Measures
Calculated columns are best suited for static, predefined calculations, while measures are designed for dynamic and interactive data analysis. Here's a tabular format illustrating the key differences between DAX calculated columns and measures:
| Factor | DAX Calculated Columns | DAX Measures |
| Computation | Computed during data model. | Calculated on-the-fly. |
| Data Storage | Stored as part of the data model. | Not stored in the data model |
| Purpose | For static, reusable calculations. | For dynamic, context-aware calculations. |
| Use in Visualizations | Used directly in visuals. | Used as fields in visuals. |
| Impact on Model Size | Can increase model size. | Does not significantly impact model size. |
| Interactivity | Limited by predefined calculations. | Highly interactive and responsive. |
| Examples | Adding a tax rate to a sales table. | Calculating total sales, average values, ratios, etc. |
Conclusion
- DAX, or Data Analysis Expressions, serves as the bridge between raw data and actionable insights in Power BI. It allows you to create custom calculations, aggregations, and dynamic measures, turning data into decisions.
- DAX offers a wide range of functions and operators, from simple aggregations like SUM and AVERAGE to advanced time intelligence functions. These tools enable users to perform diverse calculations, from basic arithmetic to complex conditional logic.
- DAX measures are the dynamic engine behind interactive reports and visualizations, responding to user interactions and filters in real time.