Filters in Power BI
Overview
Power BI, Microsoft's leading business intelligence and data visualization tool, empowers businesses to make data-driven decisions with its user-friendly interface and robust features. One of the core features that contribute to its analytical capabilities is the efficient use of filters. Filters in Power BI enable users to focus on specific subsets of data, uncover hidden patterns, and gain deeper insights into their datasets. In this article, we will explore the various types of filters in Power BI, how to apply them, and how they enable data-driven decision-making.
Filter Type Comparison in Power BI
The table mentioned below compares the various actions users can perform using different types of filters in Power BI -
| Filter Type | Edit | Clear | Delete | Hide | Lock | Sort | Rename |
| Automatic Filters | Y | Y | N | Y | Y | Y | Y |
| Manual Filters | Y | Y | Y | Y | Y | Y | Y |
| Drill-down Filters | Y | Y | N | N | N | N | N |
| Cross-drill Filters | N | N | N | N | N | N | N |
| Include/Exclude Filters | N | N | Y | Y | Y | Y | N |
| Drillthrough Filters (Invokes Drill-through) | Y | Y | Y | Y | Y | N | N |
| Drillthrough Filters (Transient) | Y | Y | Y | N | N | N | N |
| Pass-through Filters | N | N | Y | Y | N | Y | N |
| URL Filters - Transient | Y | Y | Y | N | N | N | N |
Finding The Right Filter For Your Needs In Power BI
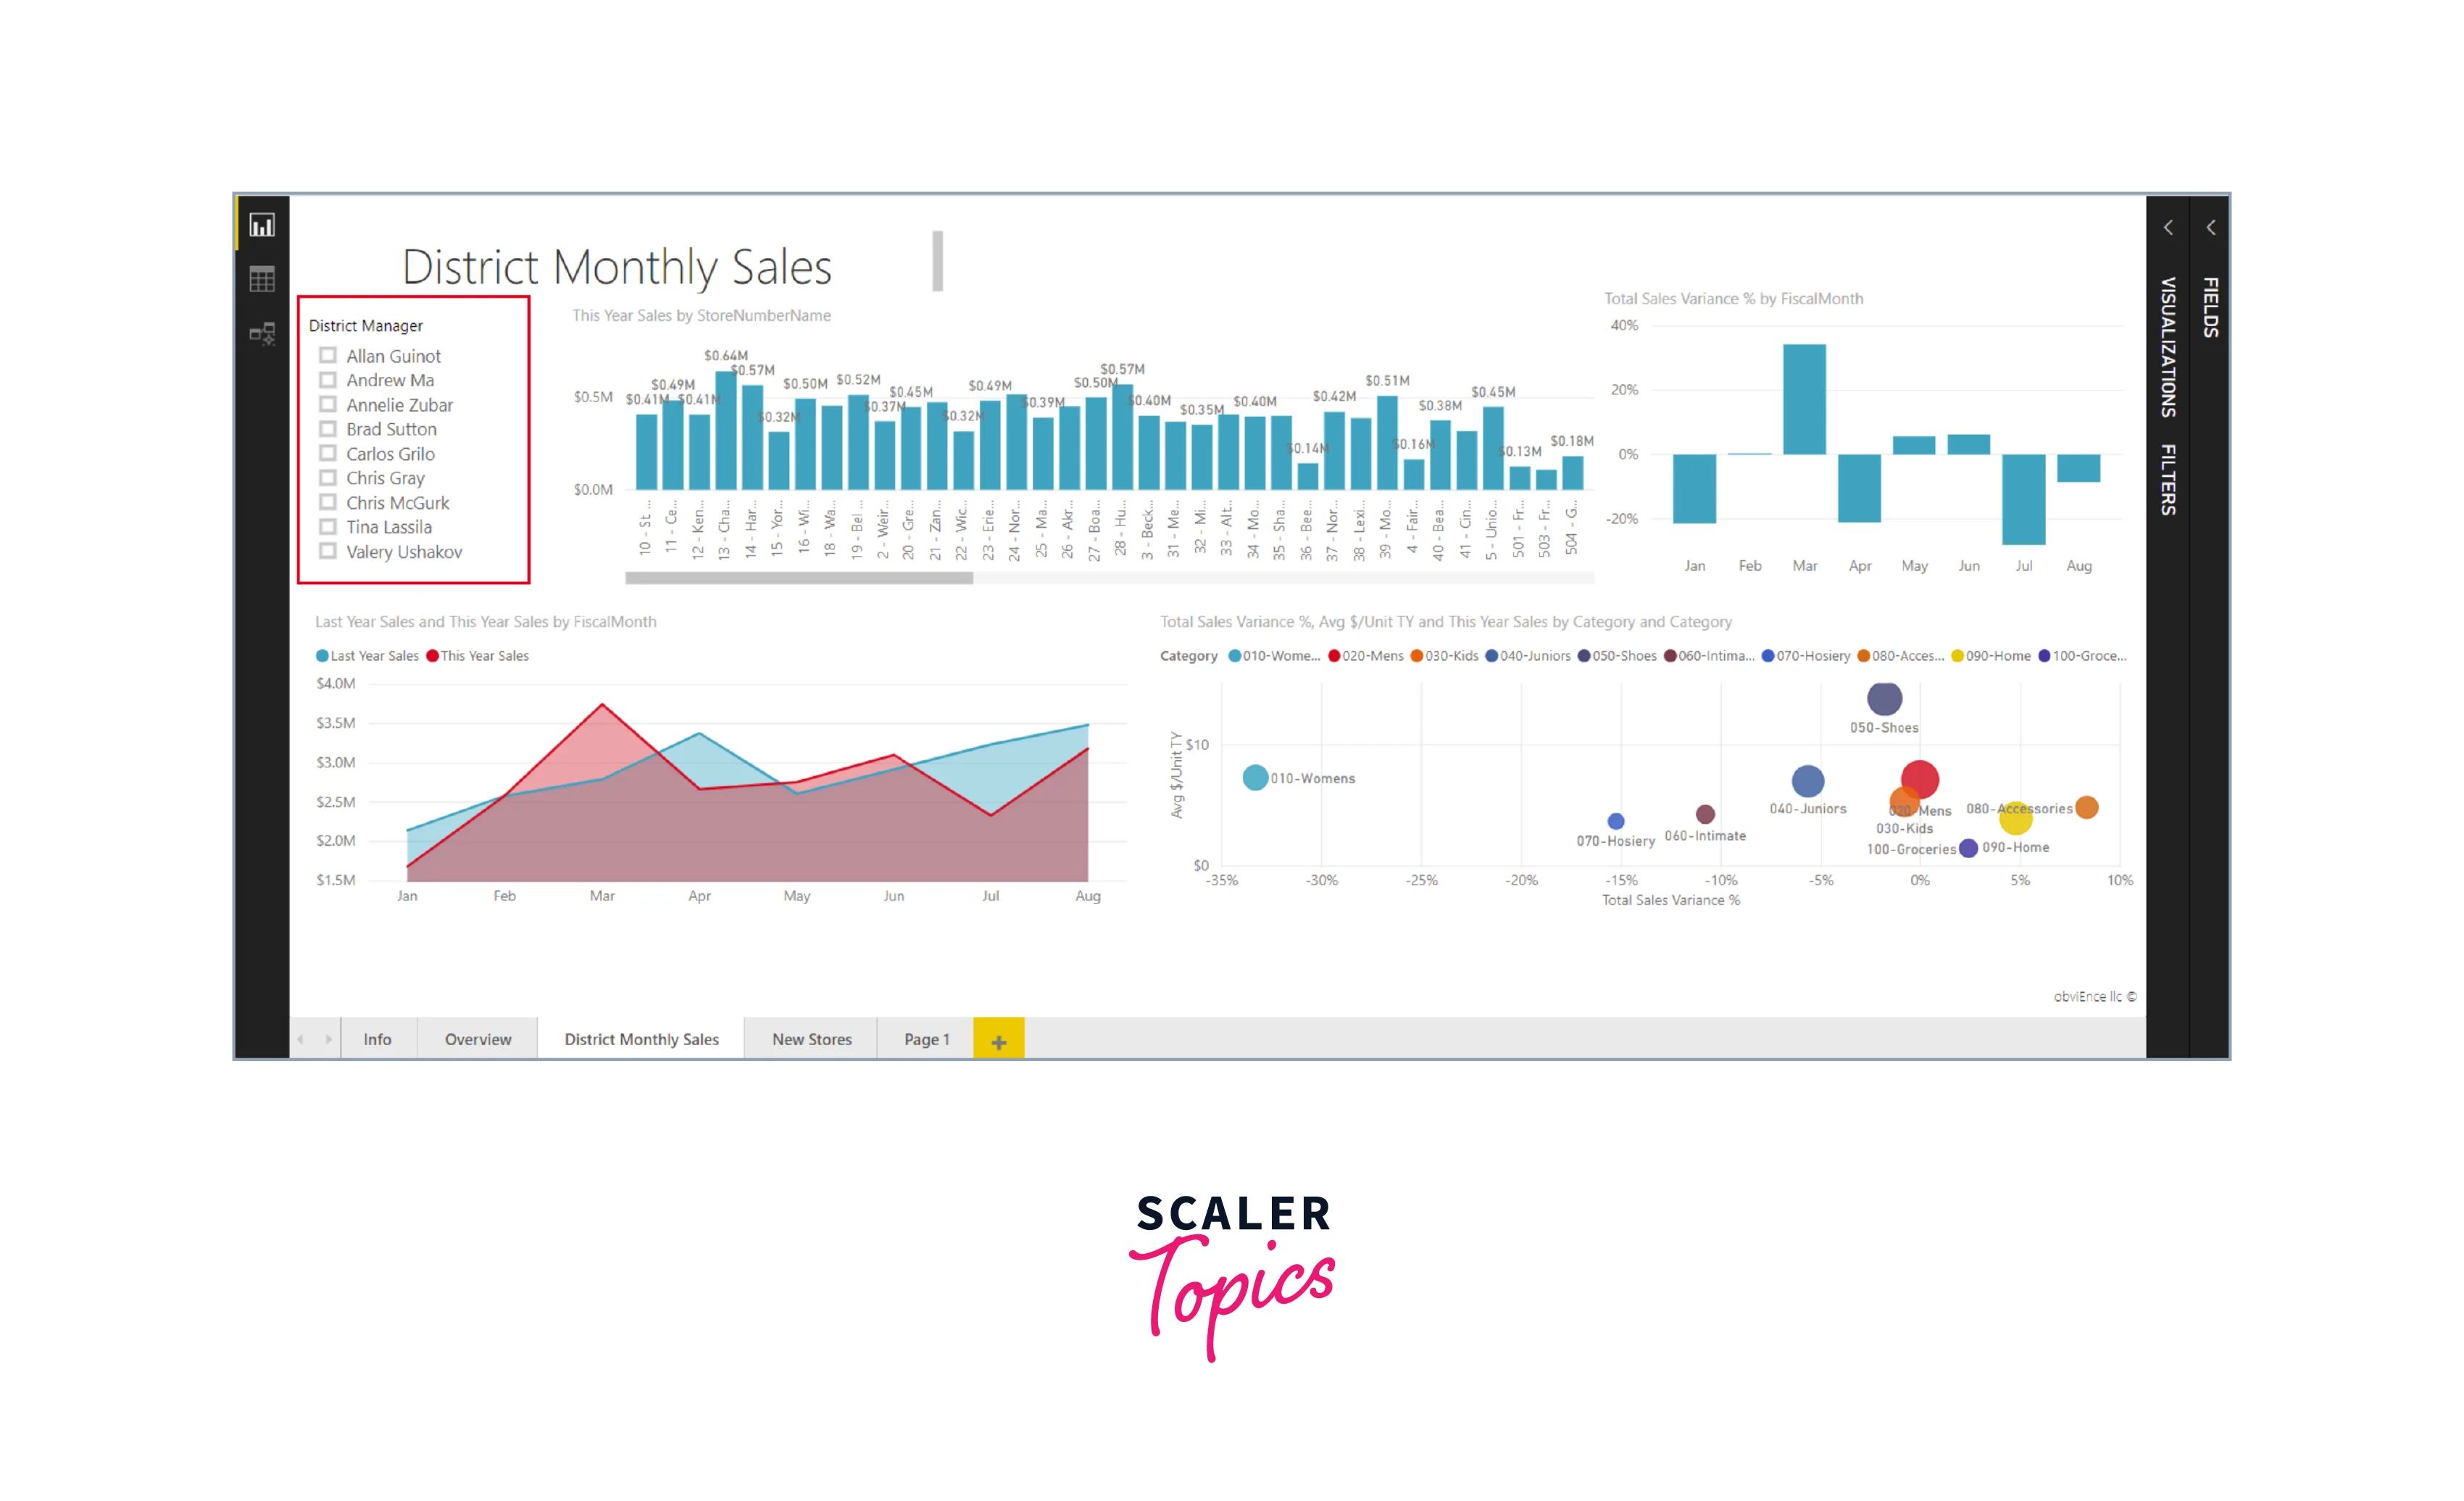
Visual-Level Filters
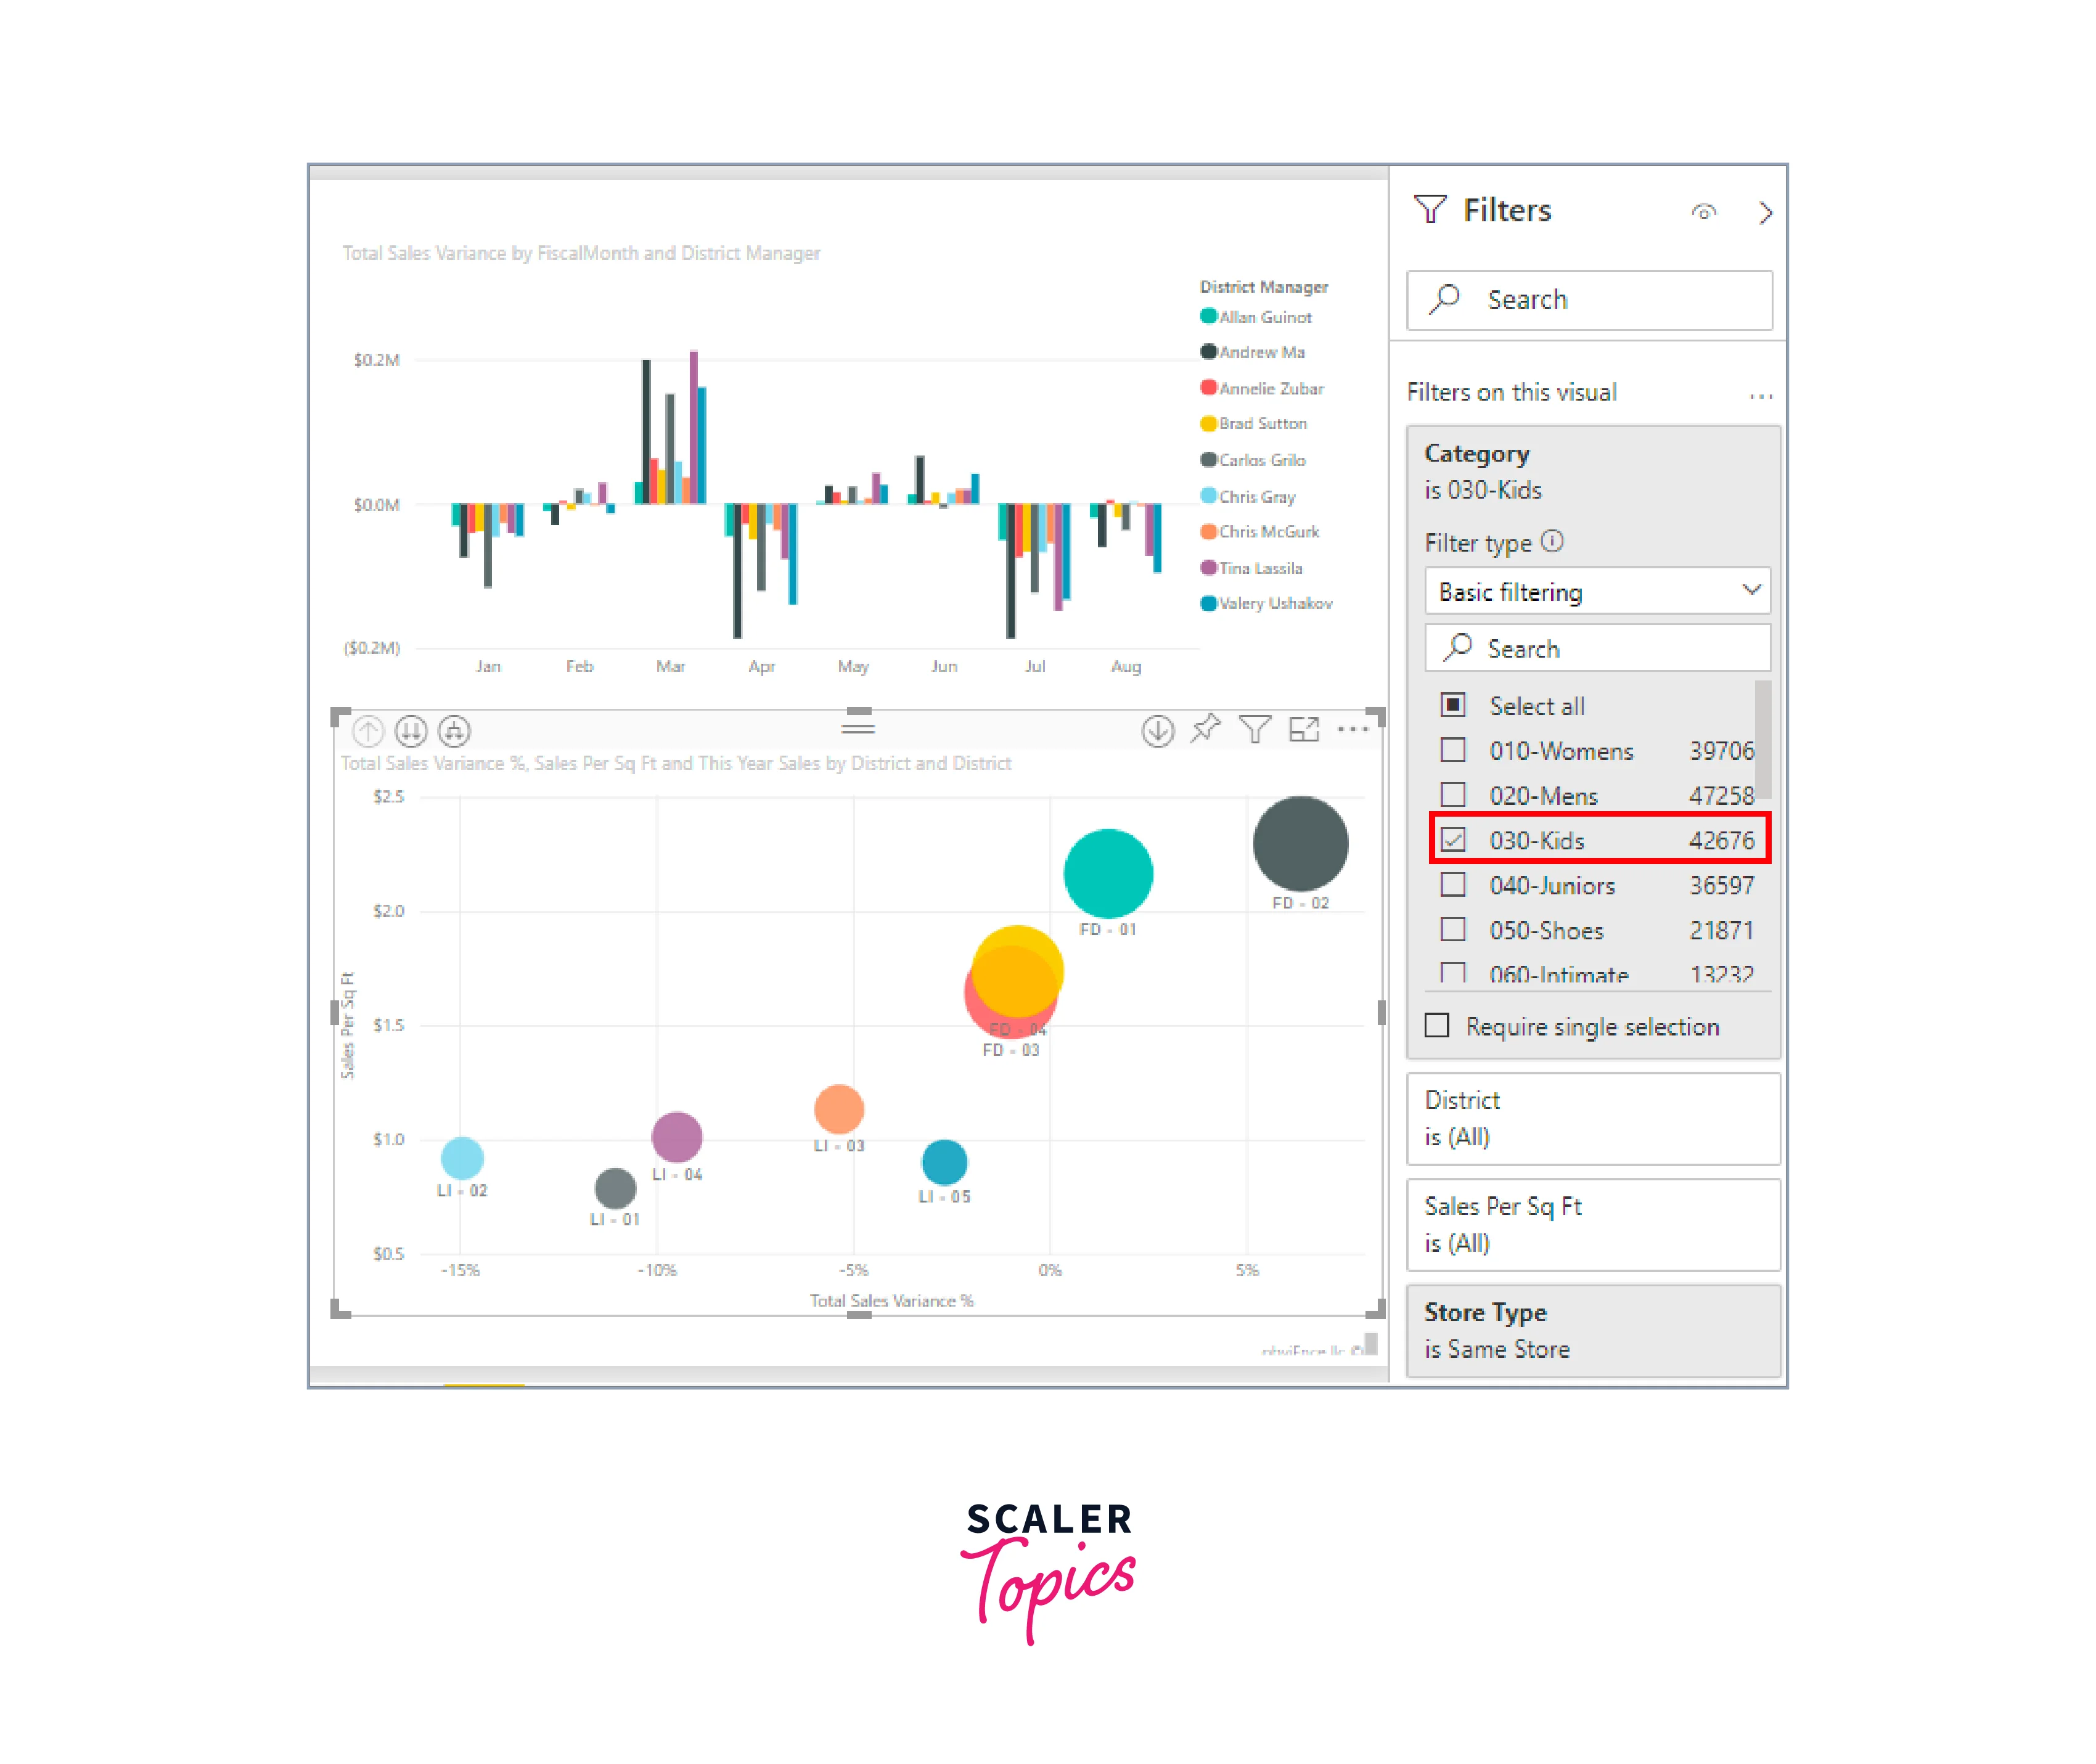
Visual-level filters in Power BI allow you to apply filters specifically to individual visualizations within a report. These filters enable you to control the data displayed in a single visual without affecting other visuals in the same report. Visual-level filters allow you to customize the insights presented in each visual, providing a more focused and tailored view of your data for better analysis and interpretation.
Suppose you have a sales dashboard with multiple visualizations, including a bar chart showing sales data by product category and a line chart displaying sales trends over time. With visual-level filters, you can apply a filter to the bar chart to show data only for a particular product category, such as "Electronics." This will update the bar chart to display sales information exclusively for electronics, while the line chart and other visuals in the report will continue to show data for all product categories, preserving the comprehensive view of the overall sales trends.
Page-Level Filters
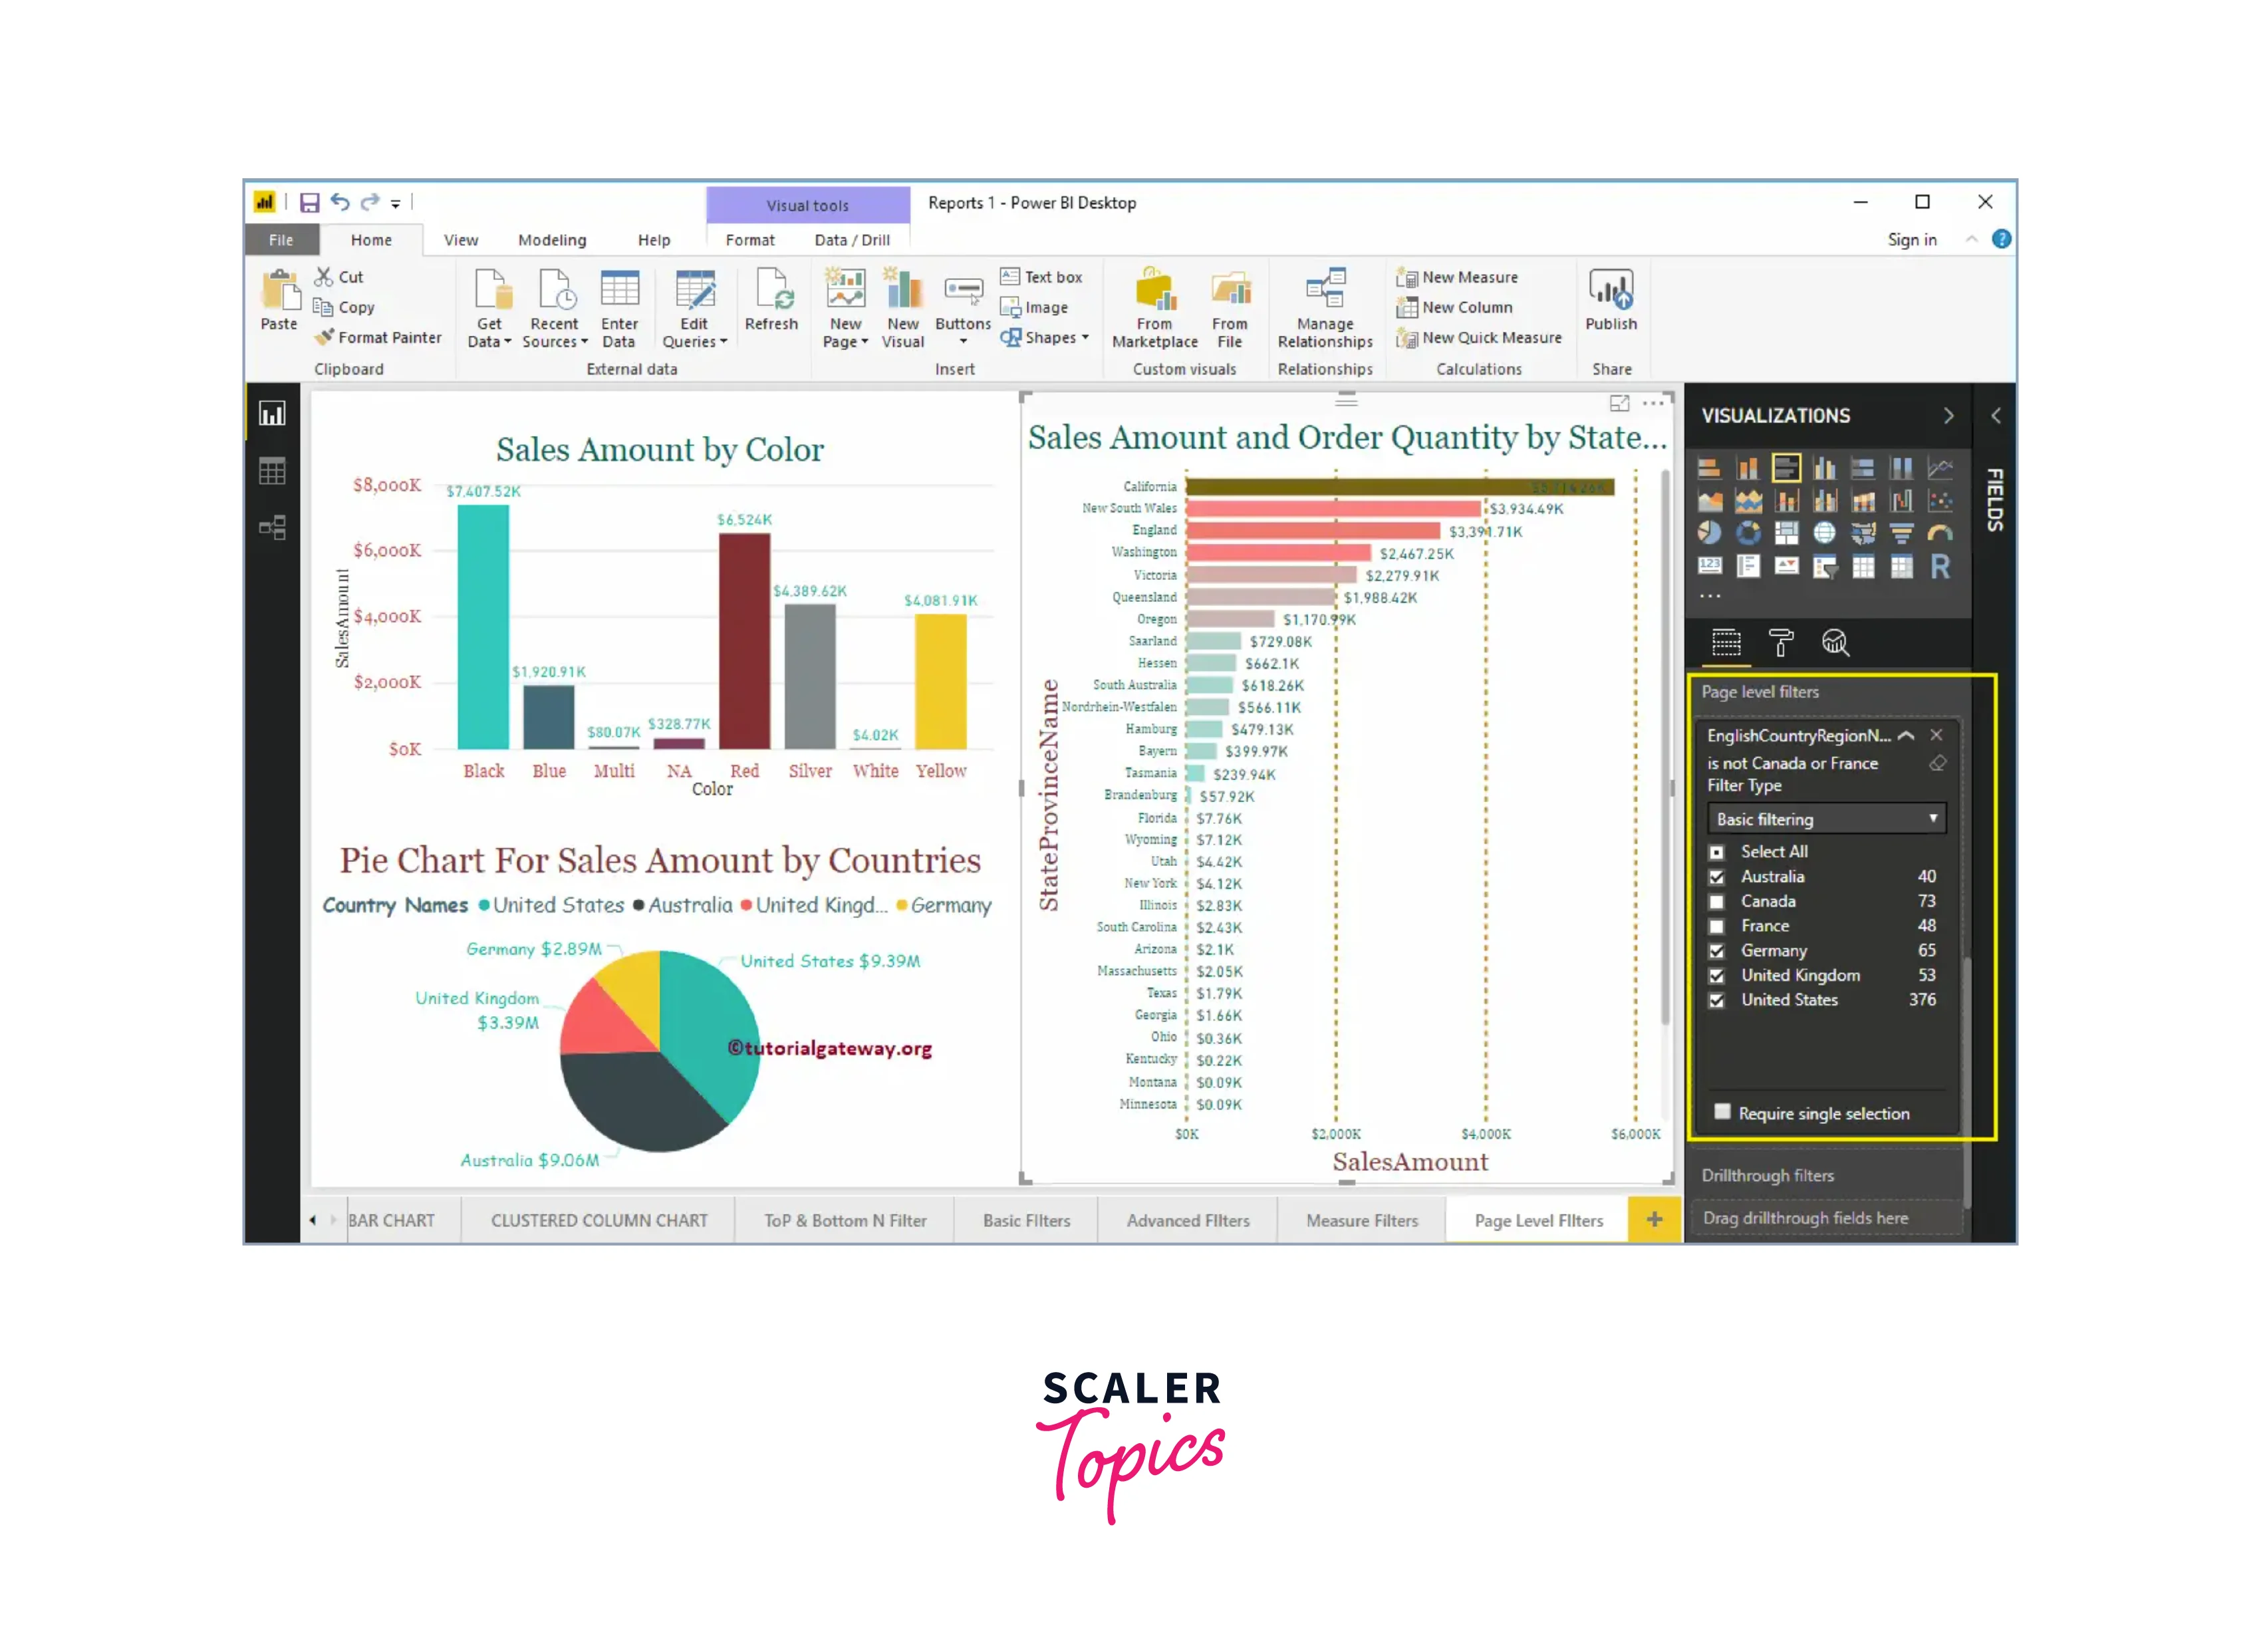
Page-level filters in Power BI allow users to apply filters that impact an entire page of a report. These filters remain consistent across all visualizations on the page, providing a unified view of the data displayed throughout the page. For example, in a multiple-page sales dashboard, you can use a page-level filter to focus on a specific region, such as "India". Applying this filter will ensure that all visualizations on that page, including bar charts, pie charts, and tables, show data only for the selected region, giving you a cohesive overview of sales performance in India across different visuals on the page.
Report-Level Filters
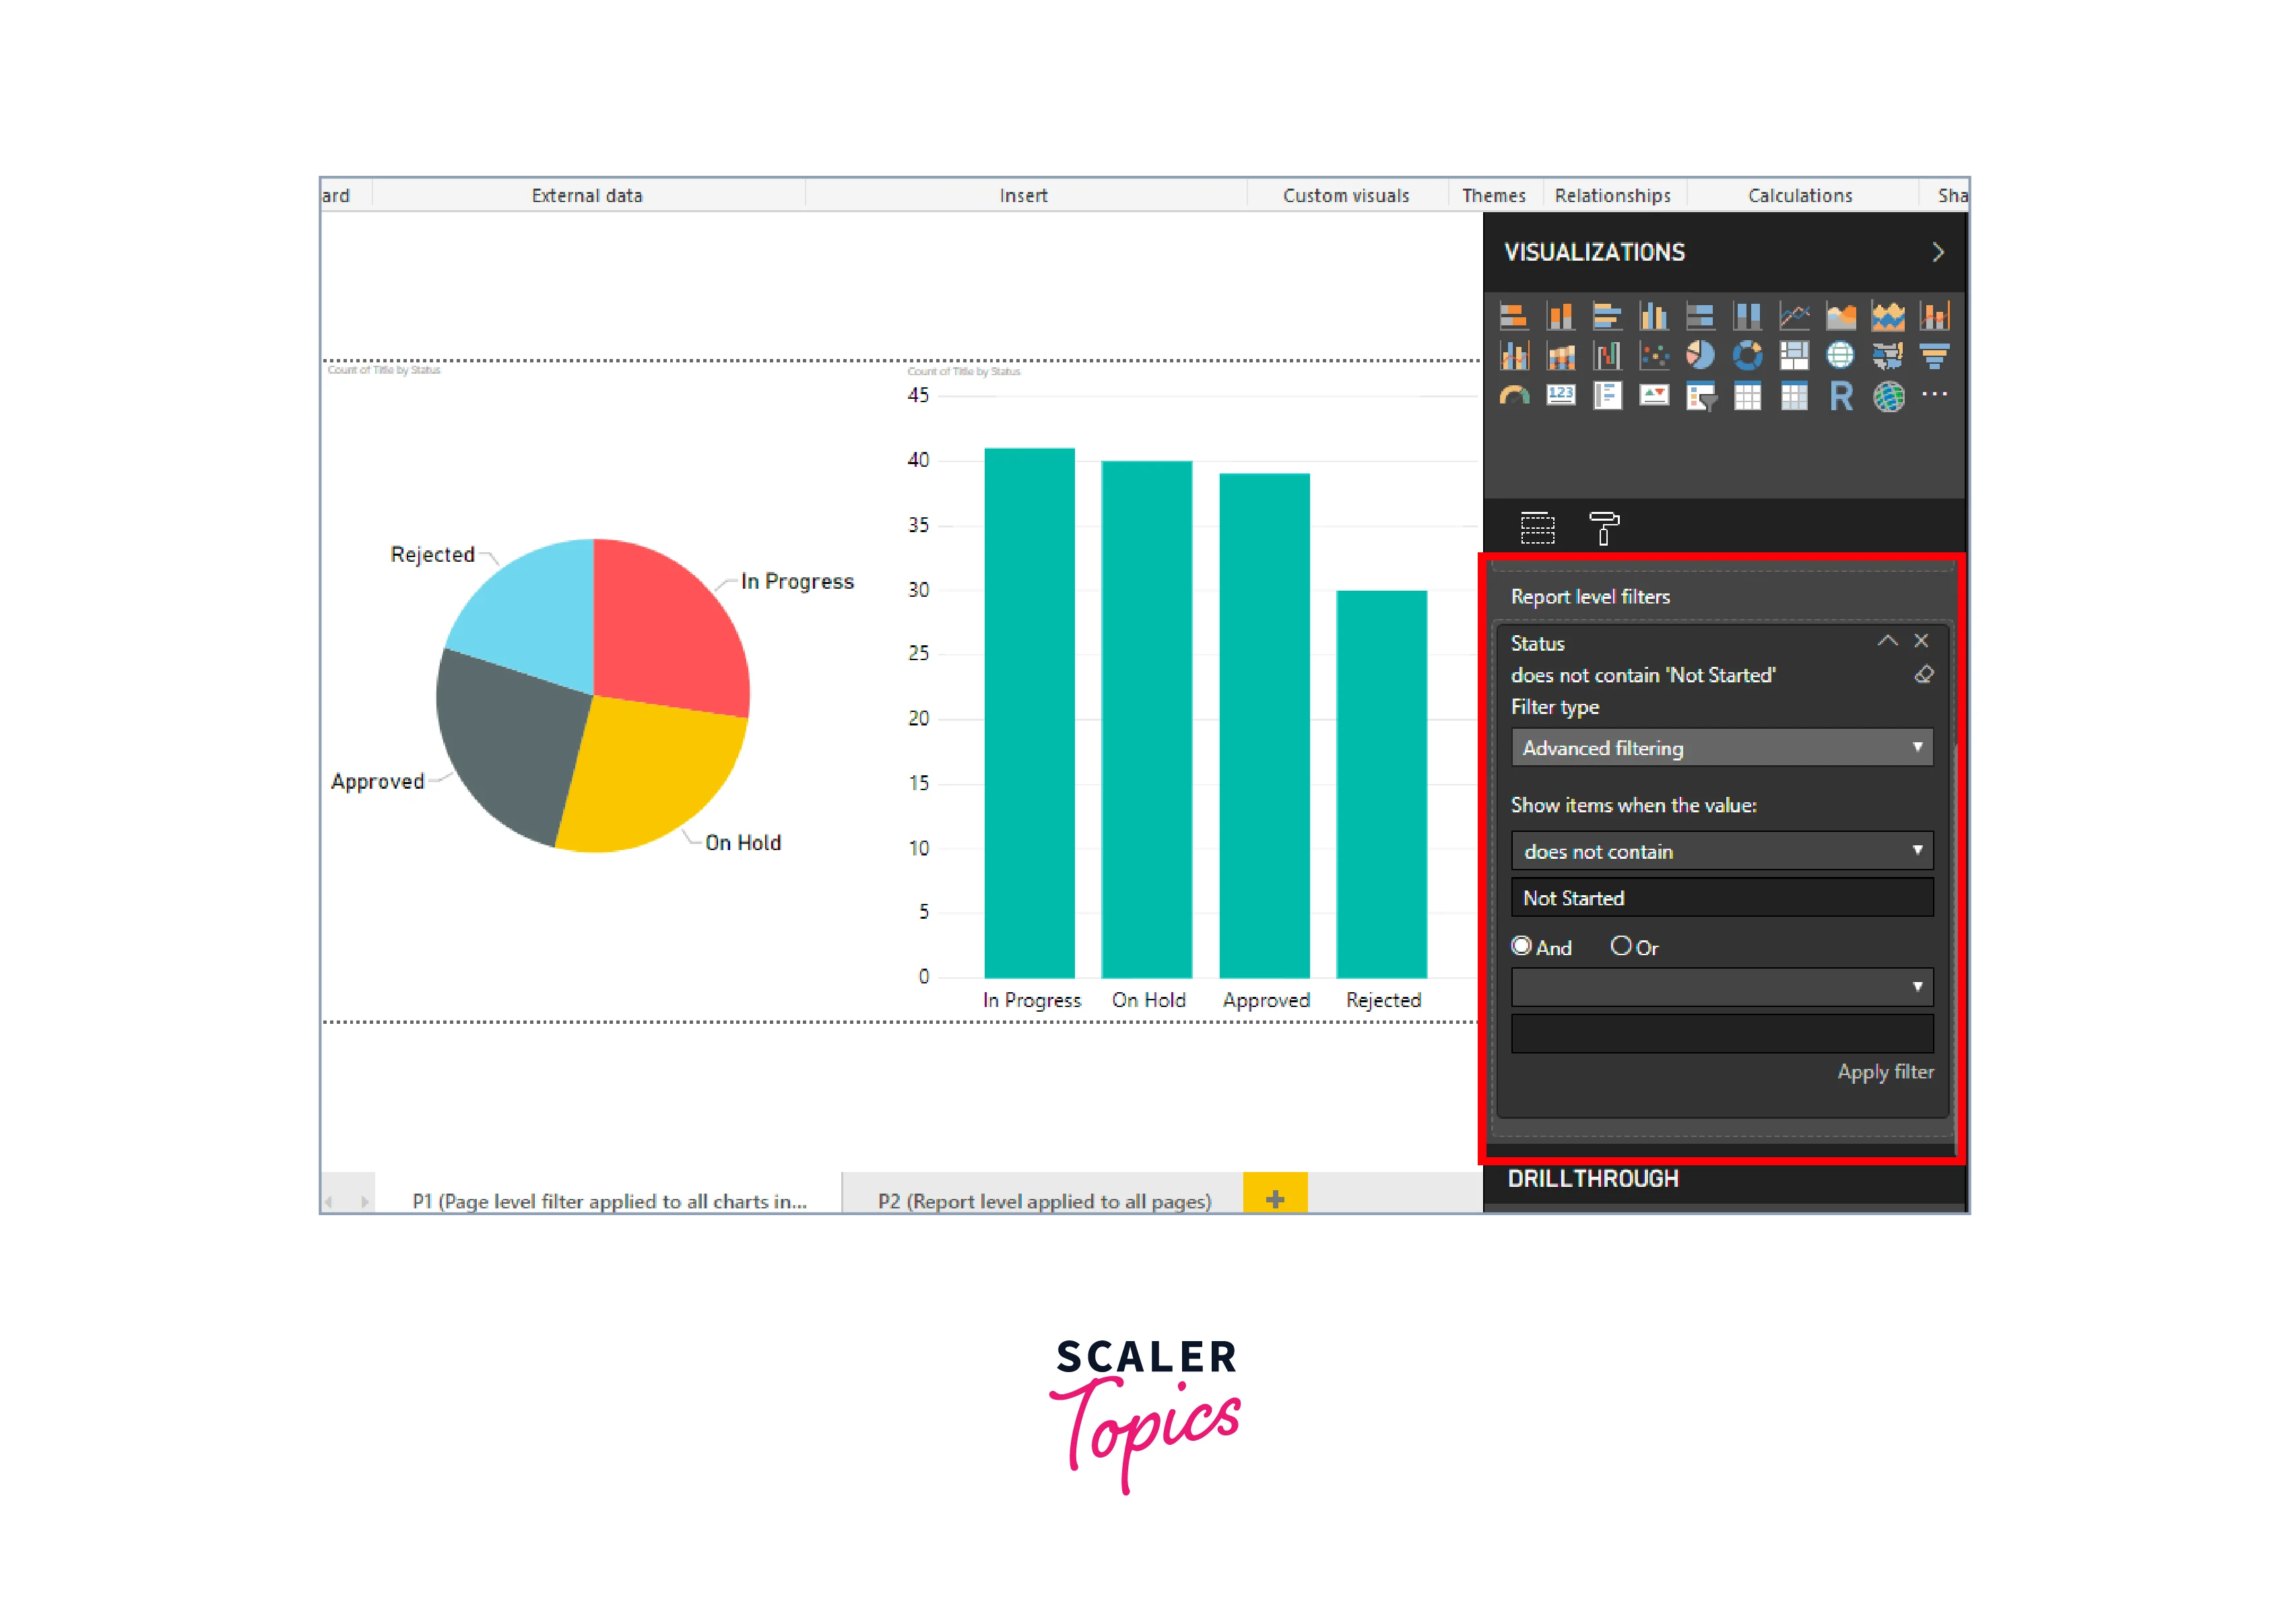
Report-level filters in Power BI allow users to apply filters that impact the entire report. When a report-level filter is applied, it affects all visuals and pages within the report, creating a consistent and streamlined view of the data throughout the report. For example, in a financial report containing multiple pages with visuals for revenue, expenses, and profits, a report-level filter can be applied to show data only for a specific year, such as "2022." Once the filter is set, all charts and pages in the report will display financial data for the year 2022, offering a comprehensive view of the financial performance for that year 2022 across the entire report.
Drill-Through Filters
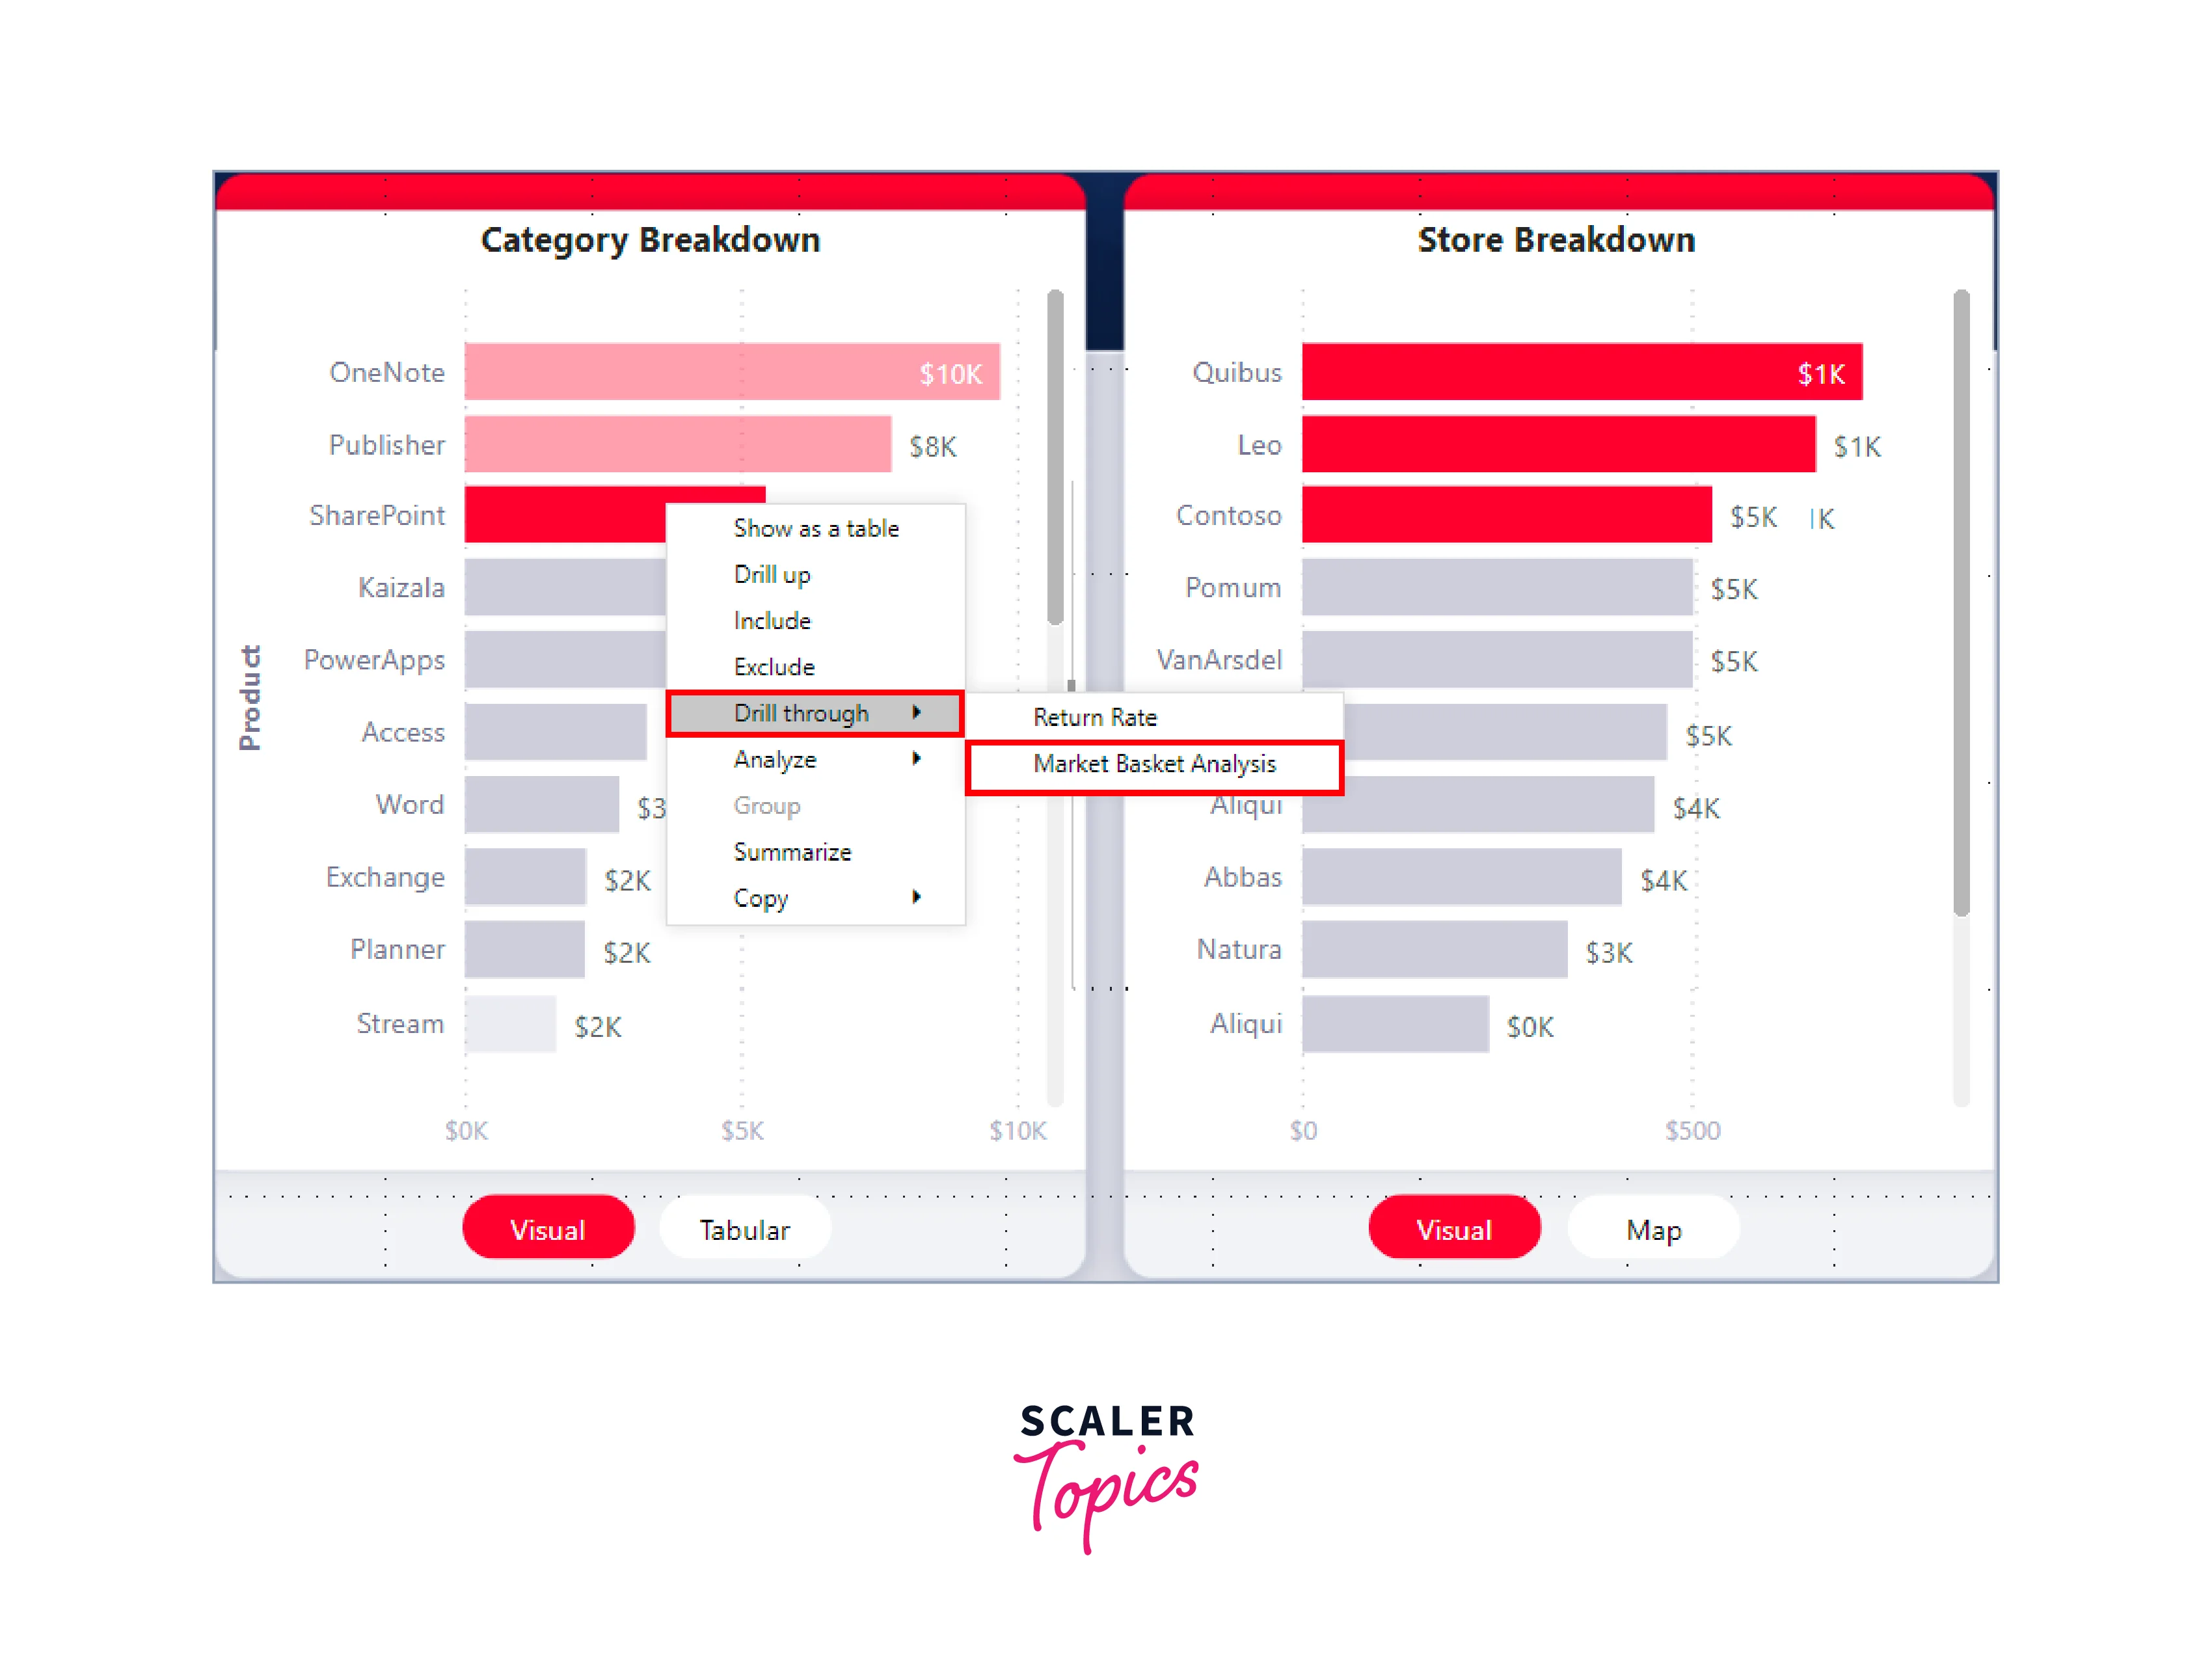
Drill-through filters in Power BI enable users to create a hierarchical navigation experience, allowing them to focus on specific details within a report. By defining drill-through paths, users can click on data points in a visualization to "drill through" to another page or report, displaying more detailed information about the selected data. For instance, in a sales report, users can set up a drill-through filter for the "Product Category" field. When they click on a specific product category, such as "Electronics," Power BI will navigate them to another page that shows a detailed sales analysis exclusively for electronics.
Slicer Filters
Slicer filters in Power BI are interactive visual controls that allow users to filter data within a report. They provide a user-friendly way to select specific values or ranges, and by using slicers, users can easily change the data displayed in the entire report or on specific visuals.
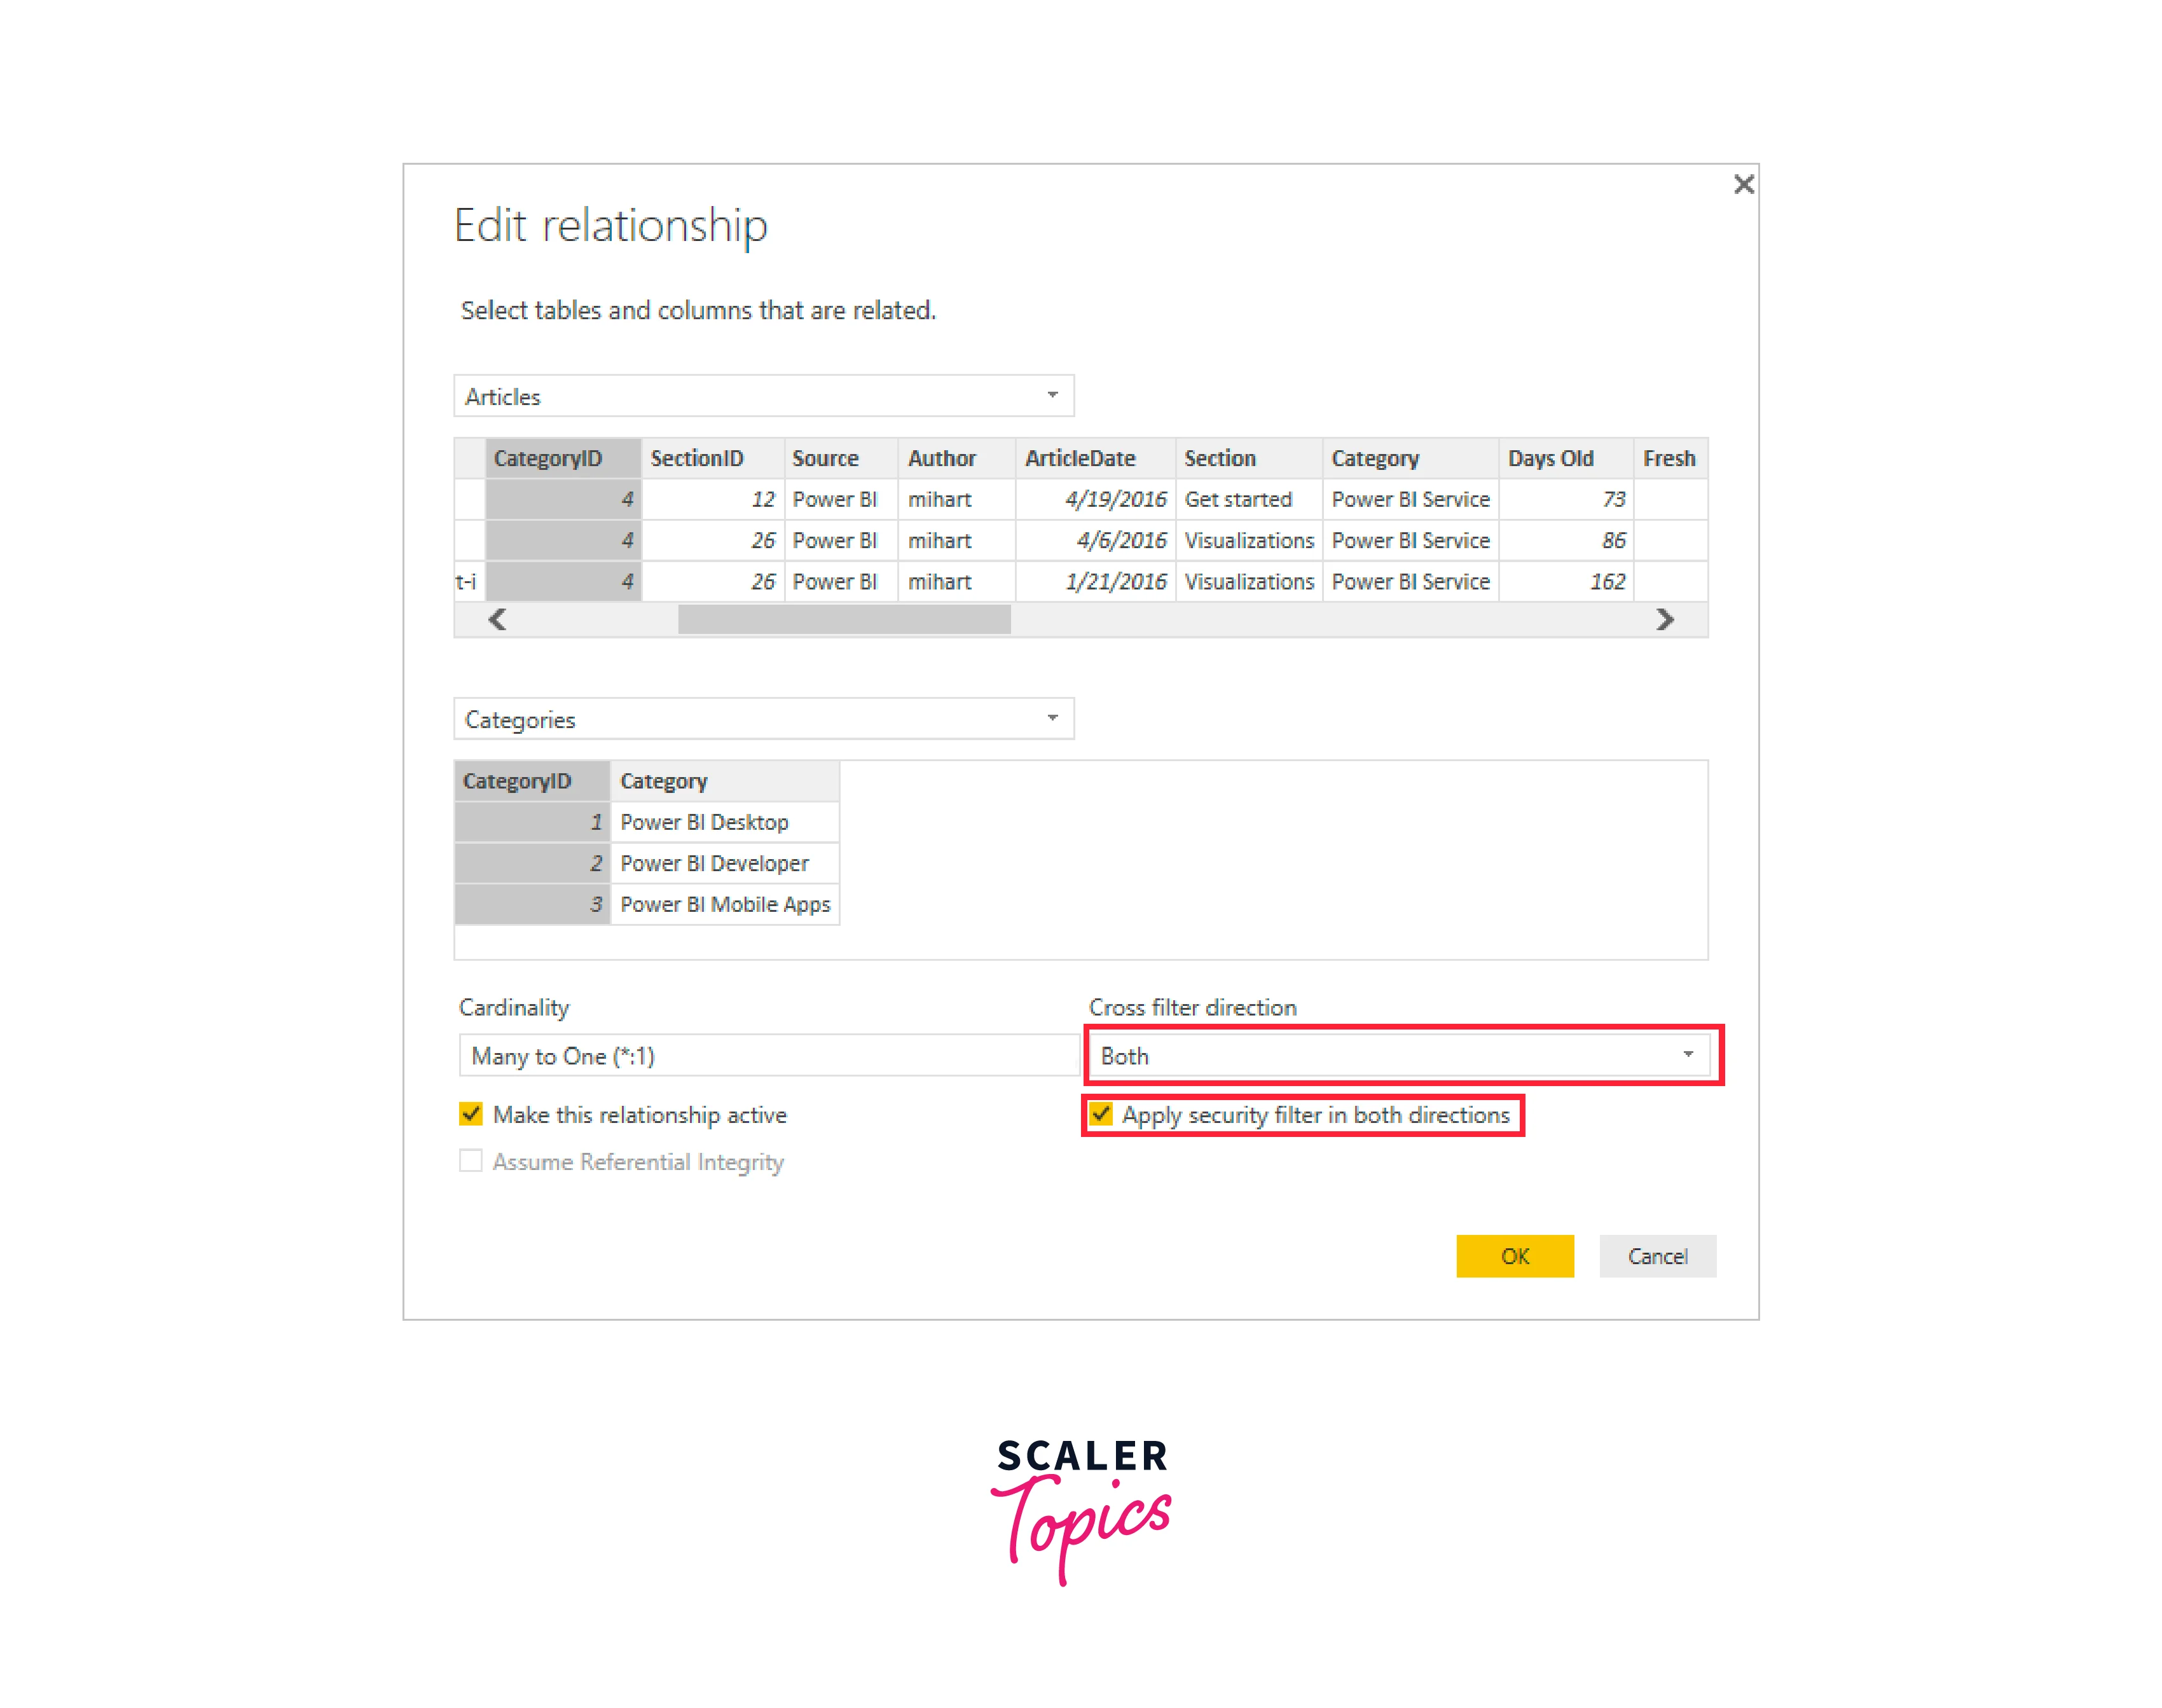
Cross-Filtering
Cross-filtering in Power BI allows for a dynamic relationship between visuals, where selecting data points in one visualization filters data in other visuals. This bidirectional filtering ensures that as users interact with one visual element, the rest of the report updates accordingly, providing a cohesive and responsive data exploration experience. For example, in a customer analytics report, selecting a specific customer segment from a bar chart will cross-filter other visuals, such as a line chart showing sales trends and a table displaying customer details. This allows users to gain immediate insights into the sales behavior of the chosen customer segment and explore related customer data without needing separate filter adjustments.
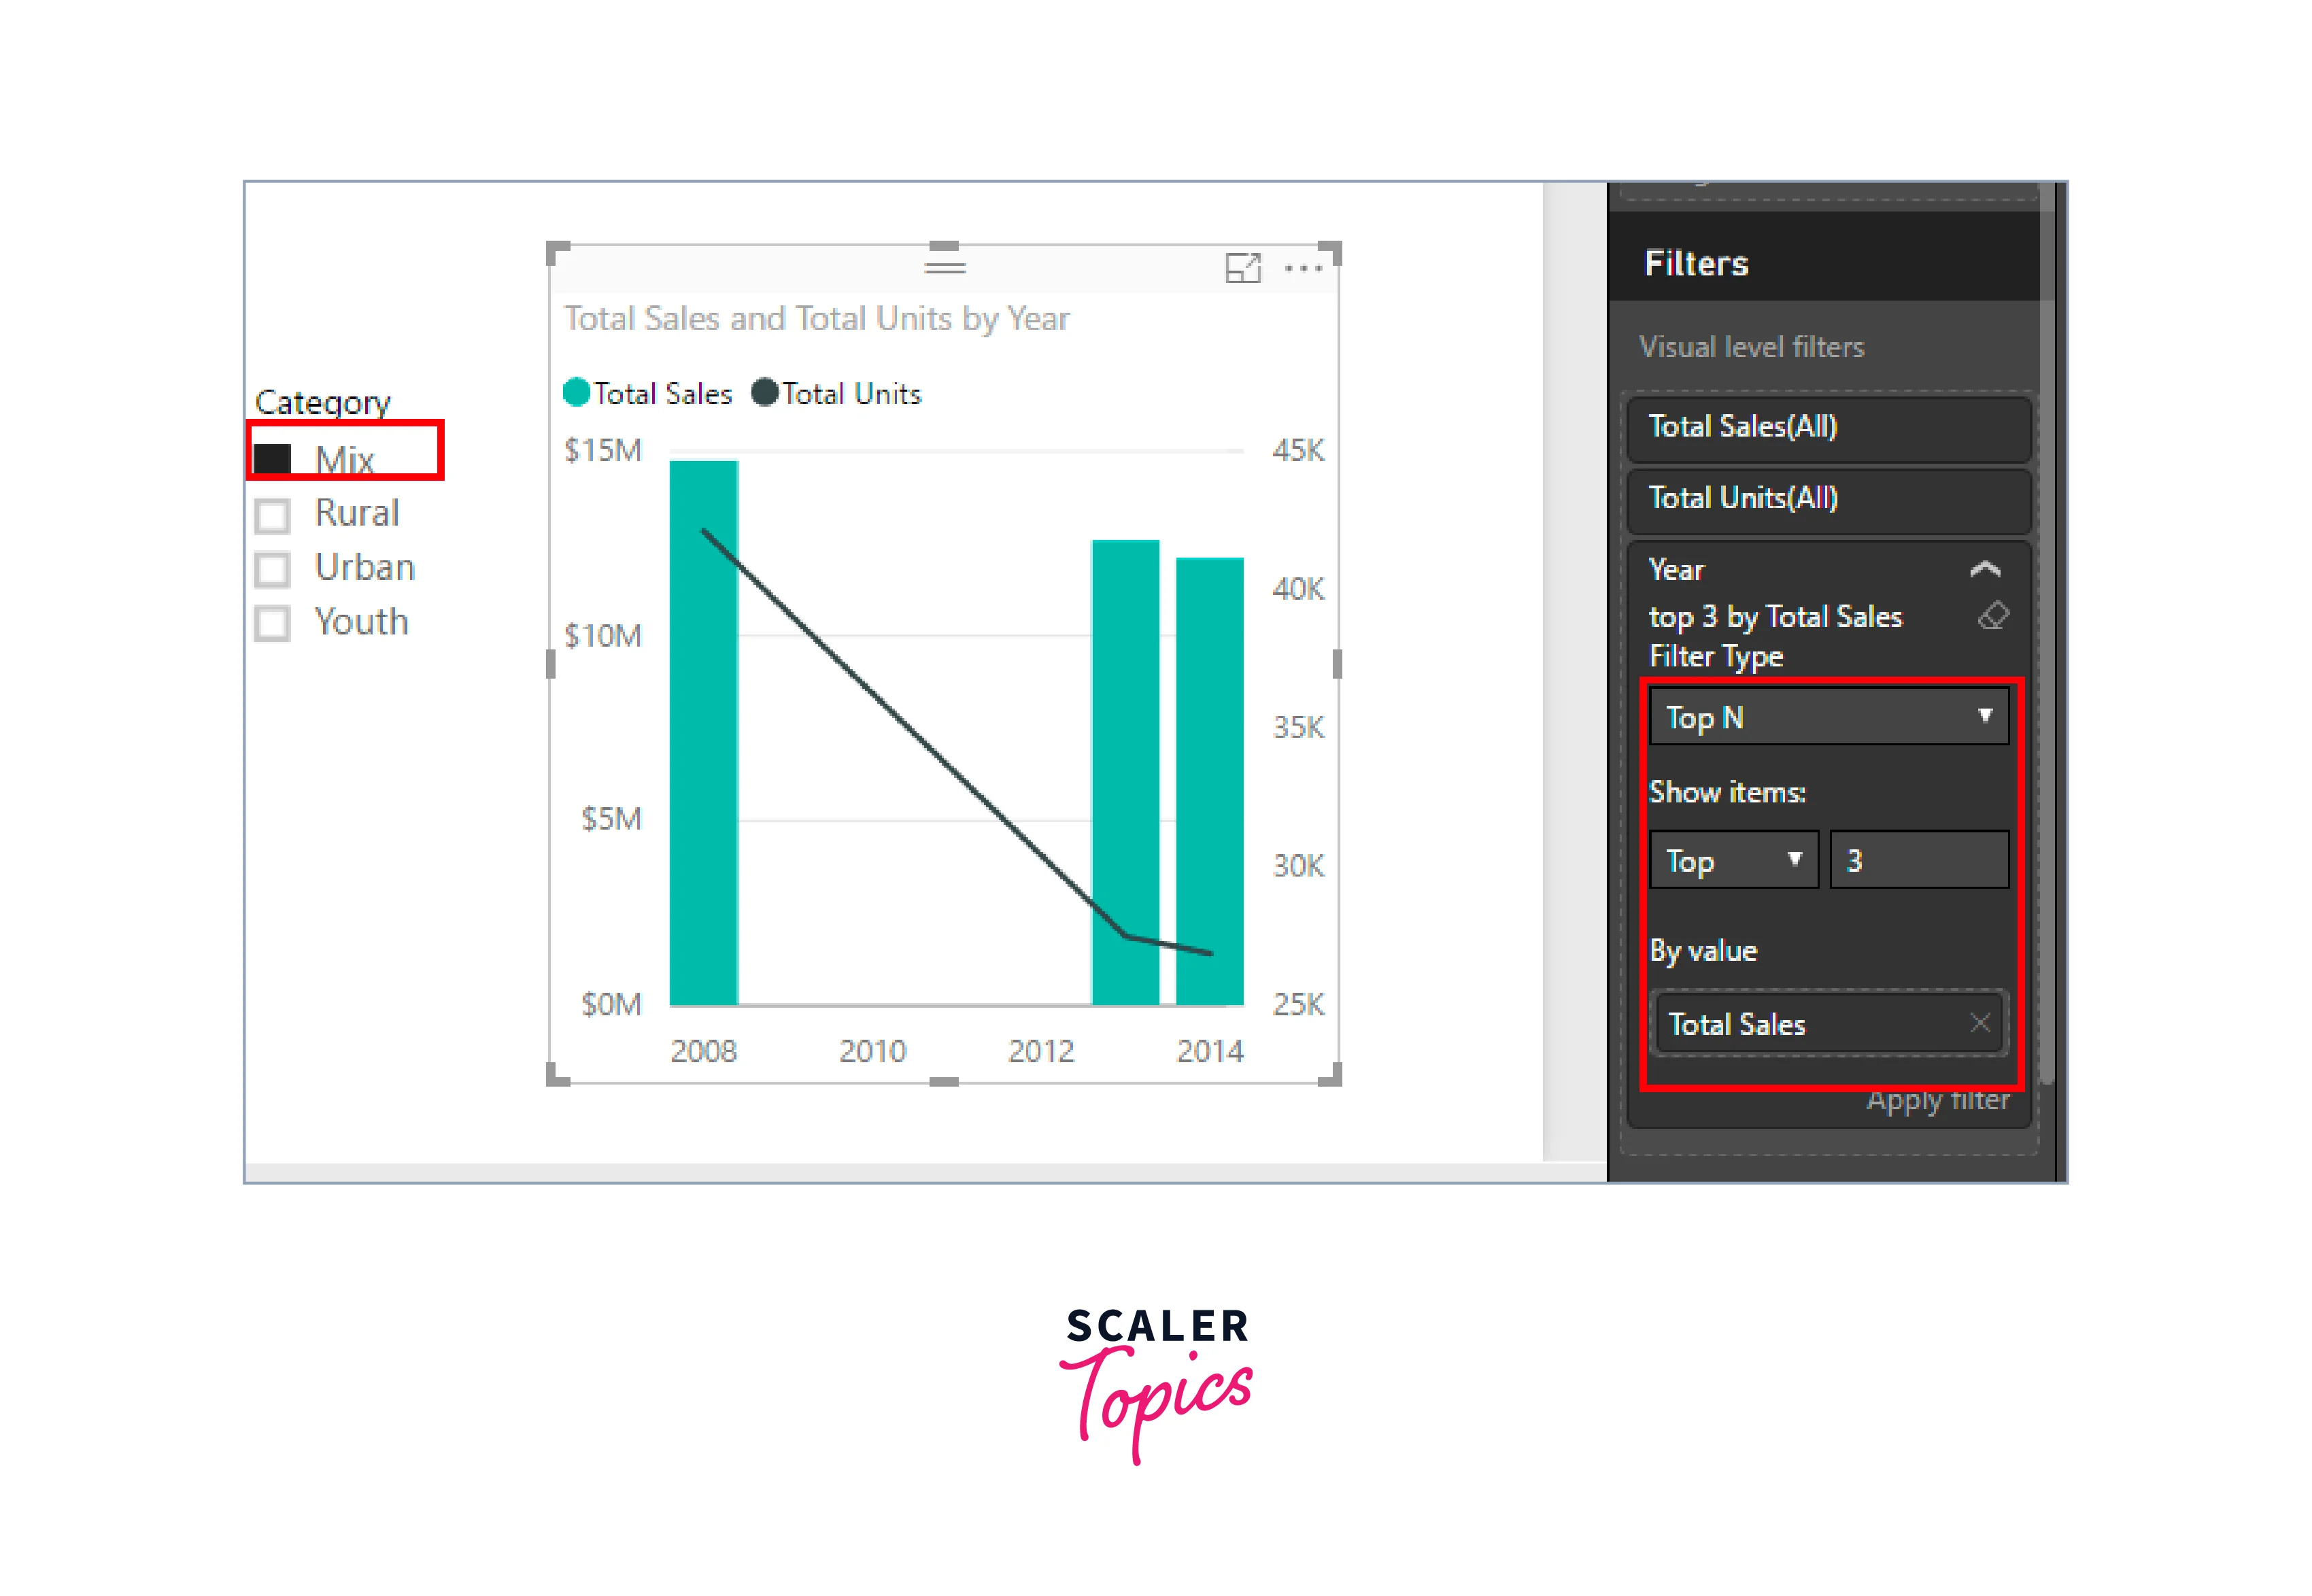
Top N Filters
Top N filters in Power BI allow users to focus on the top or bottom N items based on a selected measure. This filter helps highlight the most significant data points, such as top-selling products, highest revenue regions, or bottom-performing sales representatives, simplifying data interpretation and decision-making.
Relative Date Filters
Relative date filters in Power BI offer a dynamic way to filter data based on relative time periods, such as the last seven days, last month, or next quarter. Unlike other filters that require specific start and end dates, relative date filters provide greater flexibility as they can be applied at any time, automatically adapting to the current date. This empowers users to easily analyze data for recent or future periods, ensuring that reports and visuals are always up-to-date and relevant to the latest data trends.
Advanced Filters
Advanced Filters in Power BI offer the ability to construct complex filter expressions by utilizing multiple conditions and logical operators. These filters enable users to combine various conditions, simplifying the creation of complex rules that match specific data patterns. For instance, if custom logic needs to be applied to a subset of data, advanced filters are instrumental in achieving this. They prove beneficial when implementing specific, tailored rules, such as allowing certain customers in while excluding others, thus enhancing data analysis and decision-making precision.
How To Apply Report Filter In Power BI Desktop? (Step By Step)
Applying a report filter in Power BI Desktop allows you to focus on specific data in your visualizations for more targeted analysis. Follow these step-by-step instructions to apply a report filter in Power BI Desktop -
Step 1 - Open the report page you want to filter.
Step 2 - Click on the visualization you want to filter.
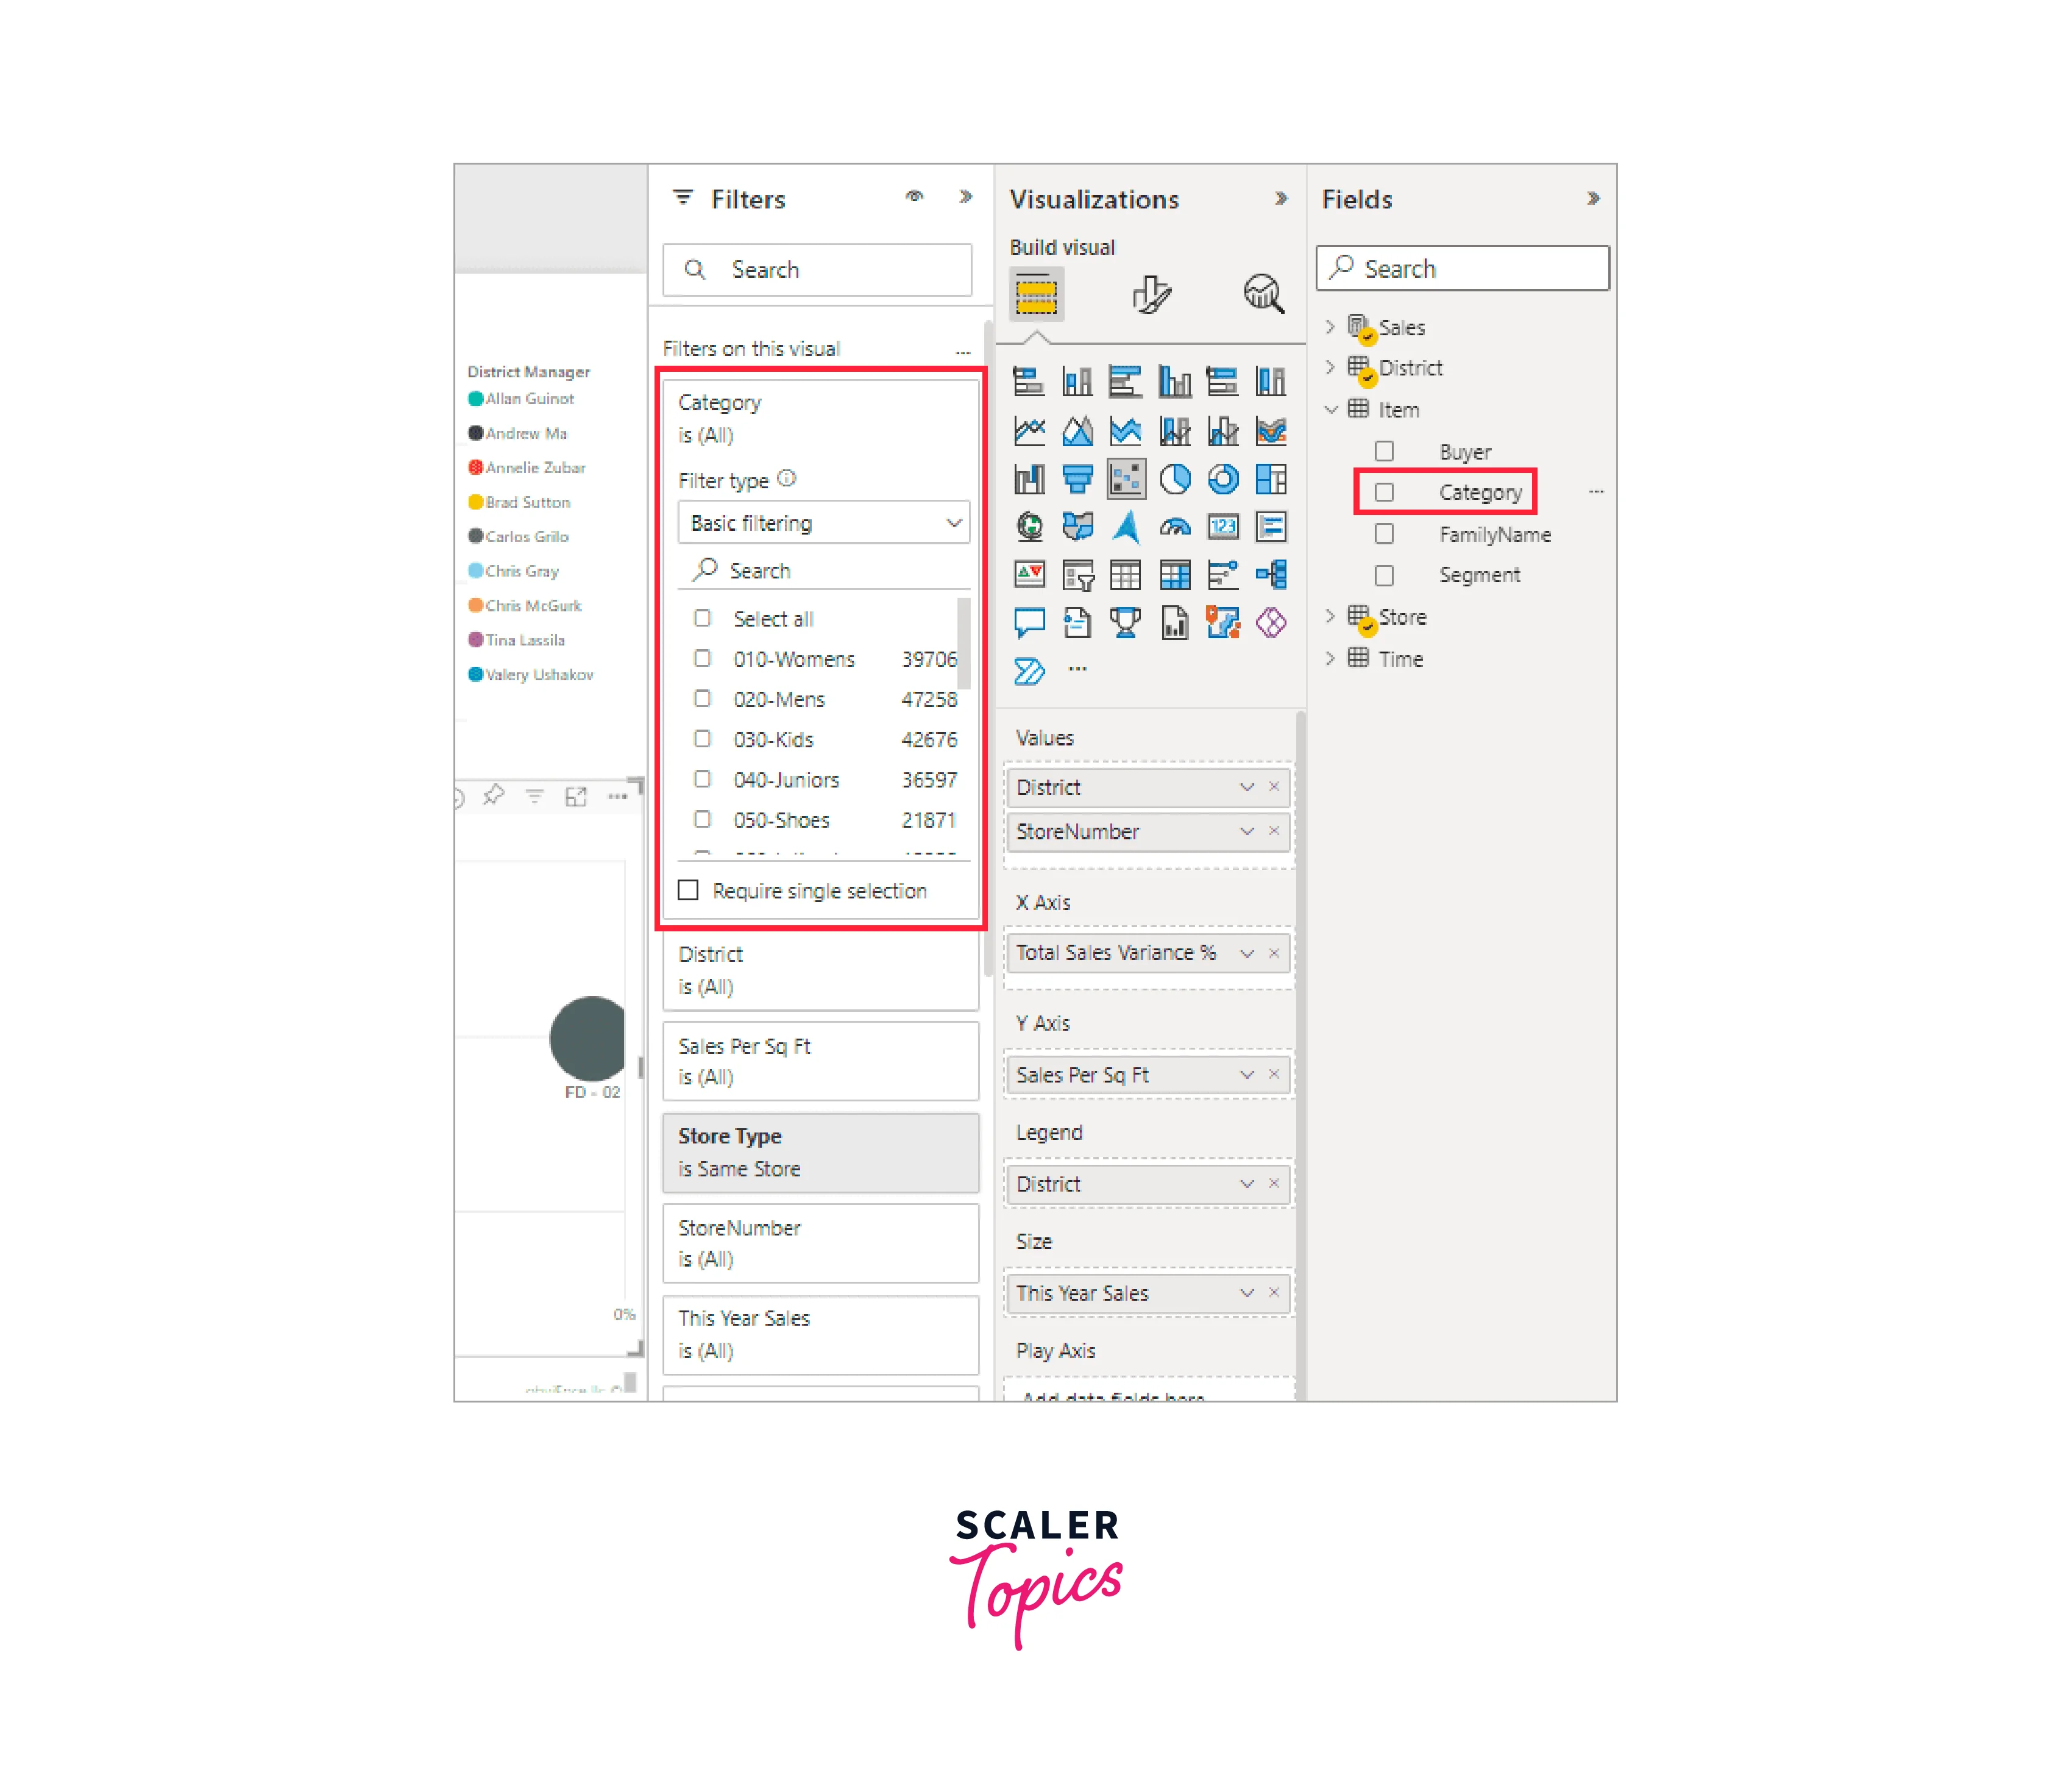
Step 3 - In the Visualizations pane, click the "Filters" icon (a funnel-shaped icon) to open the Filters pane.
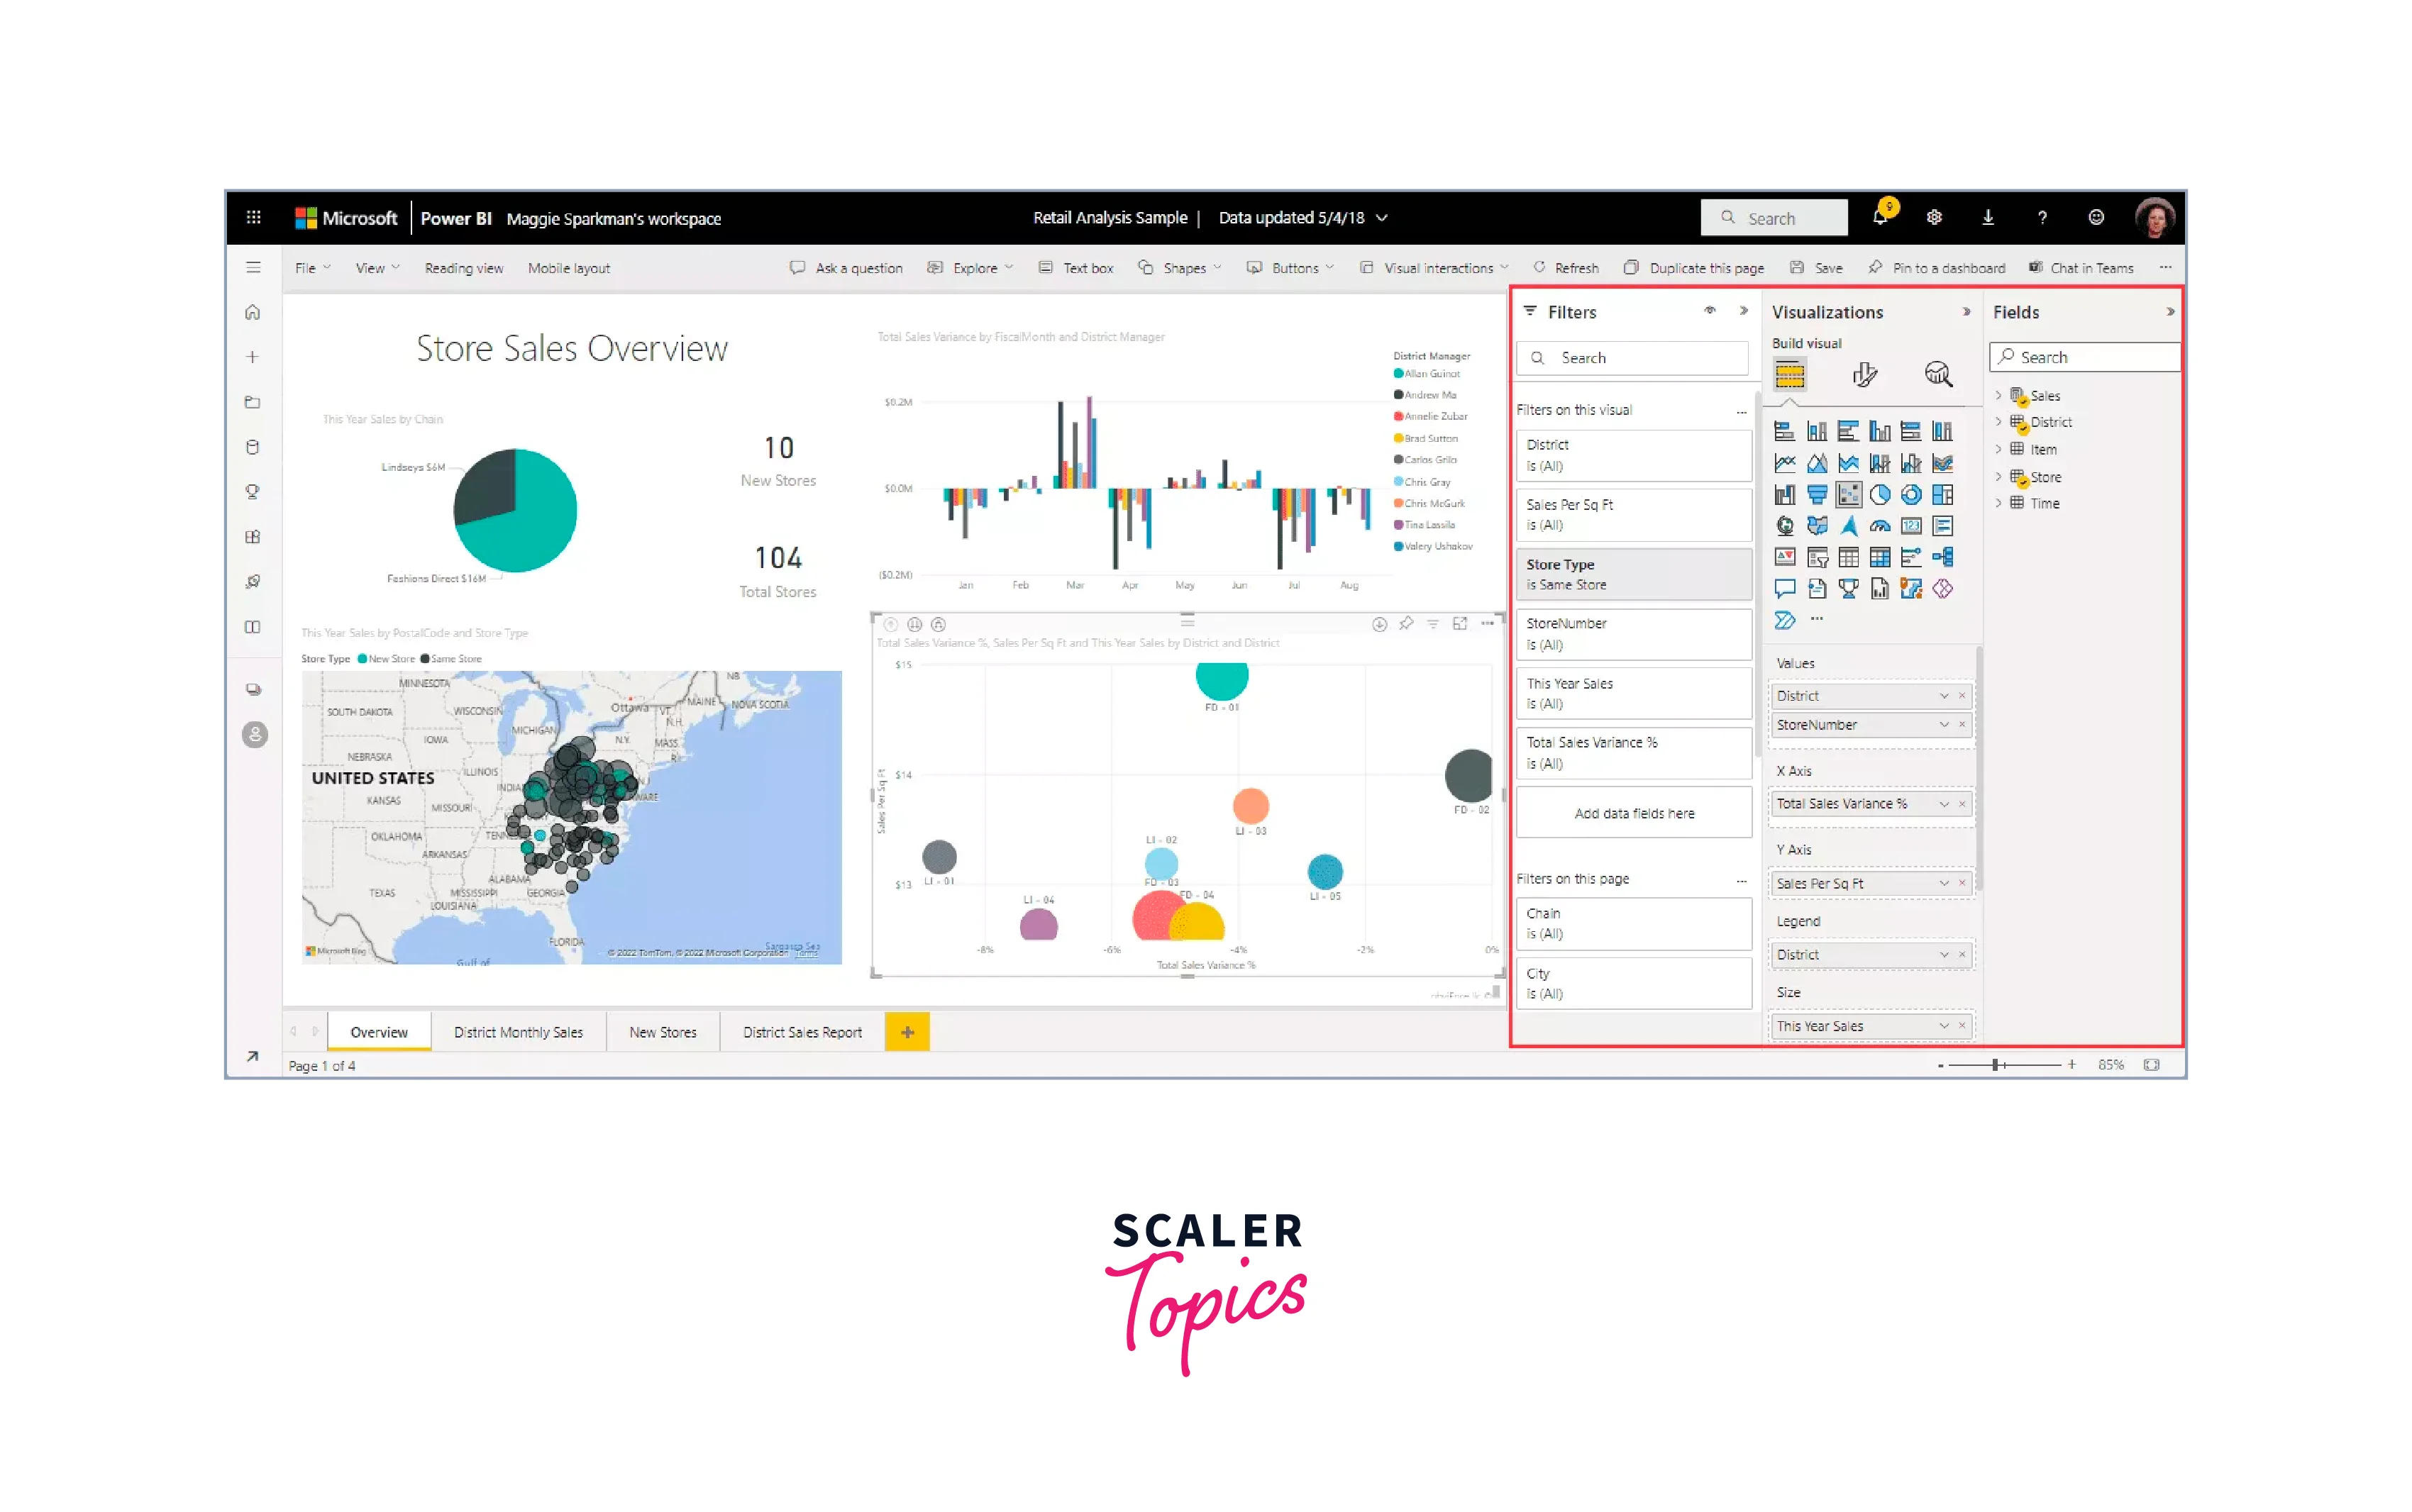
Step 4 - In the Filters pane, choose the field you want to use as a filter.
Step 5 - Select the type of filter you want from the drop-down list, such as "Basic filtering," "Advanced filtering," "Relative date filtering," or "Top N filtering."
Step 6 - Set the filter criteria by selecting the values you want to include or exclude from the visualization.
Step 7 - Click "Apply Filter" to implement the filter on the visualization.
What Are The Different Kinds Of Filtering Methods
A filter is a valuable tool to limit the displayed data in a visual or chart based on specific criteria. Various filtering methods are available for data analysis, as mentioned below. Different filtering methods cater to specific analysis needs, and in Power BI, users can employ various filtering techniques to explore and analyze data efficiently.
- Ascending/Descending sorting - Sorts data based on a particular column in ascending or descending order.
- Alphabetical/Numerical sorting - Sorts data in alphabetical or numerical order using a chosen column.
- Custom sorting - Sorts data based on a custom-defined order, like arranging countries by a specific region.
- Top/Bottom sorting - Sorts data based on a measure, such as highest or lowest sales figures.
- Interactive sorting - Enables dynamic sorting by clicking on a data point or column heading in a chart or table.
- Multi-column sorting - Sorts data based on multiple columns, such as by date and sales figures.
- Advanced sorting - This involves sorting data based on complex expressions or conditions, like sorting by the sum of sales figures for a specific region and product category.
What’s The Difference Between A Slicer And A Filter?
The main difference between a slicer and a filter lies in their functionality, user interface, interactivity, and scope within Power BI -
- Functionality - Filters can apply specific conditions to include or exclude data based on dates, values, or categories. Slicers offer an interactive drop-down menu for users to choose one or more values to filter data.
- User Interface - Filters are typically found in the filter pane and can filter the entire report or specific visuals. Slicers are visual elements added to a report page, allowing interactive data filtering.
- Interactivity - Slicers are more interactive, updating visuals automatically when users make selections. Filters require manual adjustments to update the report.
- Scope - Filters can be applied to unique visuals, pages, or reports. Slicers are commonly used to filter data within a single report page.
Conclusion
- Power BI offers a range of filtering methods, such as visual-level, page-level, report-level, drill-through, slicer, top N, and relative date filters, enabling users to tailor their data analysis to specific needs and gain deeper insights.
- Each filtering method serves a unique purpose: visual-level and page-level filters provide targeted data exploration, report-level filters offer consistent data filtering across the entire report, slicers provide an interactive visual interface for data selection, and advanced filters allow for complex filtering rules.
- By understanding and effectively using various filters in Power BI, users can create dynamic and interactive reports, uncover valuable insights, and make data-driven decisions with precision and clarity. These filtering capabilities empower users to harness the full potential of Power BI for comprehensive data analysis and reporting.