Financial Dashboard with Power BI
Overview
In today's data-driven business landscape, having a comprehensive view of your finances is crucial. In this article, we delve into the world of financial dashboards powered by Microsoft Power BI. We'll explore the benefits, key components, and step-by-step guidance on creating an insightful financial dashboard Power BI that empowers decision-makers with real-time data insights. Whether you're a finance professional or a business owner, harnessing the power of Power BI can transform the way you manage and analyze financial information. Let's embark on this journey to unlock the potential of data-driven financial decision-making.
What Are We Building?
In this article, we will guide you through the process of creating a dynamic financial dashboard utilizing the capabilities of Power BI. This dashboard is specifically tailored to offer an intuitive overview of the credit card spending patterns among Indian consumers. We will walk you through the steps, from initial design to data integration, providing you with the tools to gain valuable insights into the financial behavior of credit card users in India.
Pre-requisites
Before starting the project of designing and building a dynamic financial dashboard Power BI to analyze the credit card spending habits of Indian consumers, there are several prerequisites to consider. These prerequisites will help ensure a smooth and successful project execution -
- Power BI Desktop - Ensure you have access to Power BI Desktop or Power BI Pro, depending on your project's scale and requirements. You can download Power BI Desktop for free from the official Microsoft website.
- Familiarity with Data Analysis - A basic understanding of data analysis concepts, such as data types, aggregation, and trends, will be helpful.
- Basic Excel Skills - A foundational knowledge of Excel is beneficial for data preprocessing and manipulation before importing into Power BI.
- Visualization Concepts - Familiarize yourself with the various visualizations available in Power BI, such as charts, tables, and graphs. Consider which visualizations are most suitable for presenting credit card spending insights.
How Are We Going To Build This?
First, we'll begin by importing the dataset, ensuring that the data is in a format compatible with Power BI. This dataset will serve as the foundation for our financial dashboard, containing valuable information about credit card spending among Indian consumers. Next, we'll preprocess data by removing unnecessary columns and performing any required data cleaning and transformation. This step is crucial to ensure the data is concise, accurate, and ready for analysis.
We'll leverage Power BI's rich array of visualization tools to gain deep insights into spending habits and patterns. We'll create line, pie, and bar charts to get deep insights into spending patterns. We'll integrate slicers into our dashboard to enhance user interactivity and usability. Slicers act as filters, enabling users to dynamically explore the data by selecting specific criteria, such as time ranges or demographic segments. This interactive feature will empower users to tailor their analysis to their unique needs, making the dashboard a powerful decision-support tool.
By following these steps, we will harness the capabilities of Power BI to design and build an insightful financial dashboard that provides a comprehensive view of credit card spending habits among Indian consumers, making data-driven financial analysis accessible and actionable.
Building Financial Dashboard with Power BI
Let’s explore the various steps involved in creating a financial dashboard using the Power BI -
Data Connection
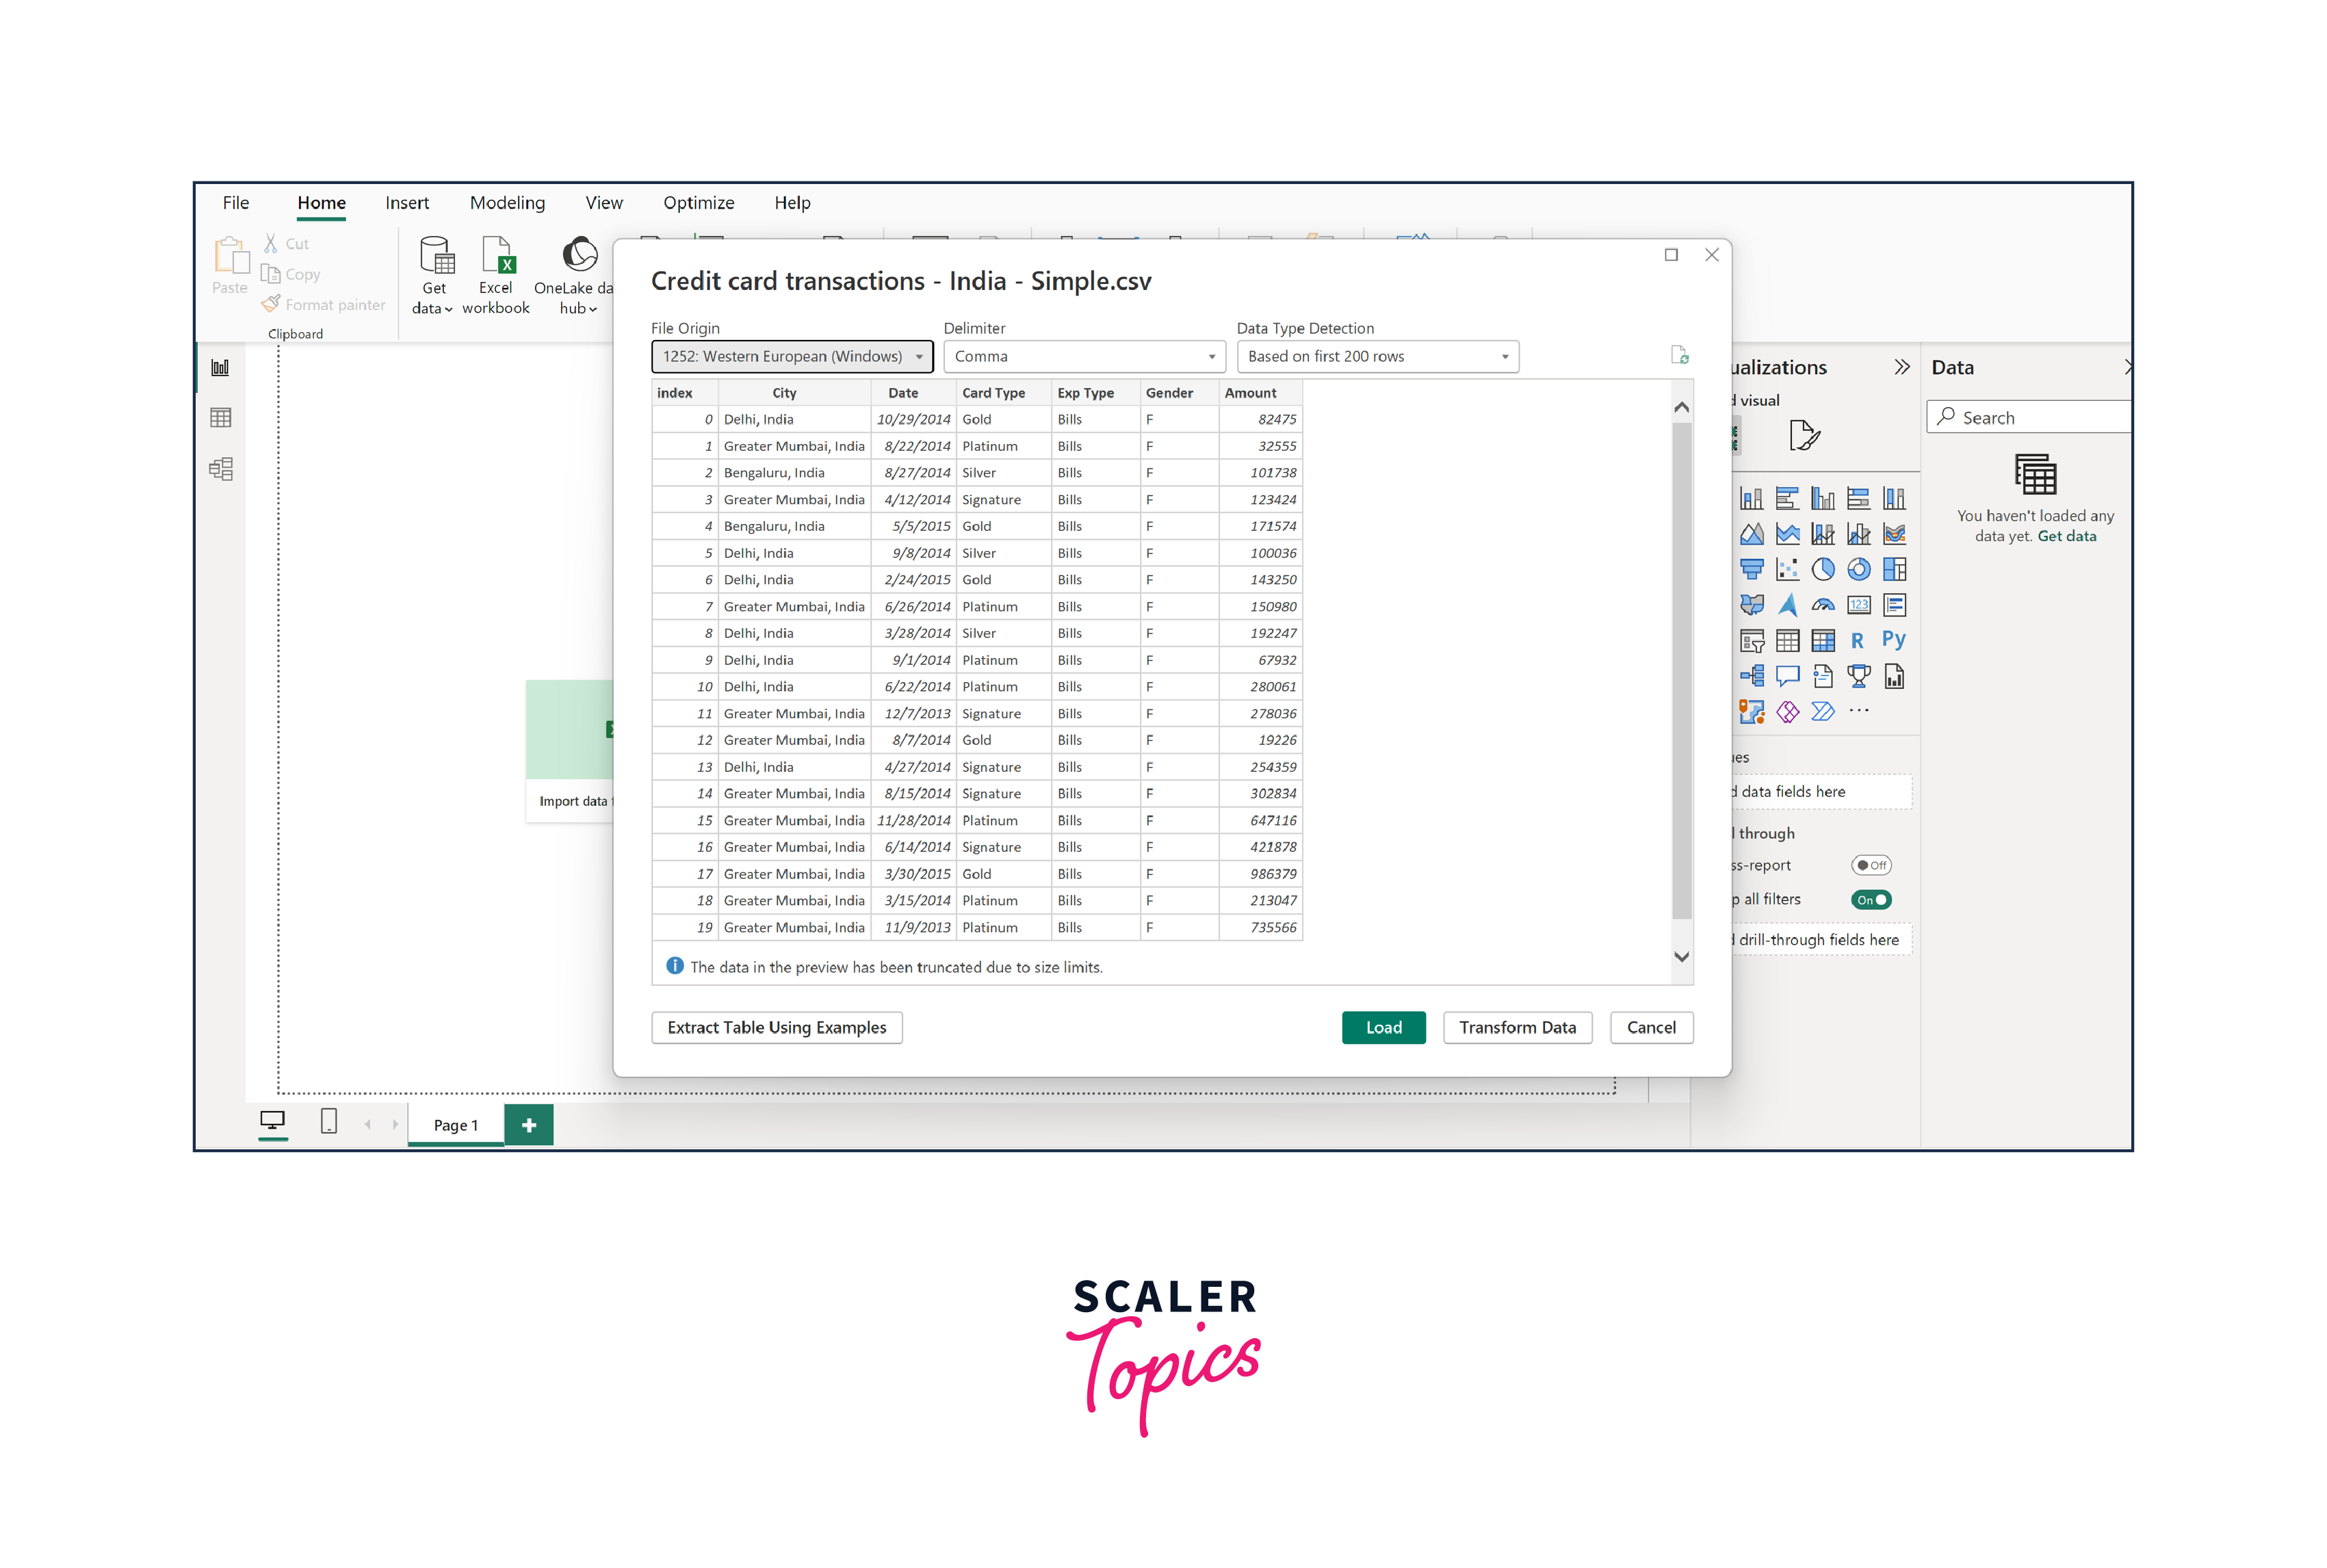
The first crucial step in our project is establishing a Data Connection. We will initiate this process by importing data from Kaggle, specifically a dataset encompassing credit card spending of Indian consumers for the time span from January 2014 to April 2015. This dataset has various attributes, including city, transaction amount, spending category, gender, date, and more. You can also download this dataset from here.
To connect to a data store using Power BI -
- Open Power BI Desktop.
- Click "Home" > "Get Data" > select your data source (e.g., Excel, CSV, database).
- Browse and select your dataset, then follow the prompts to configure the connection and load data into Power BI.
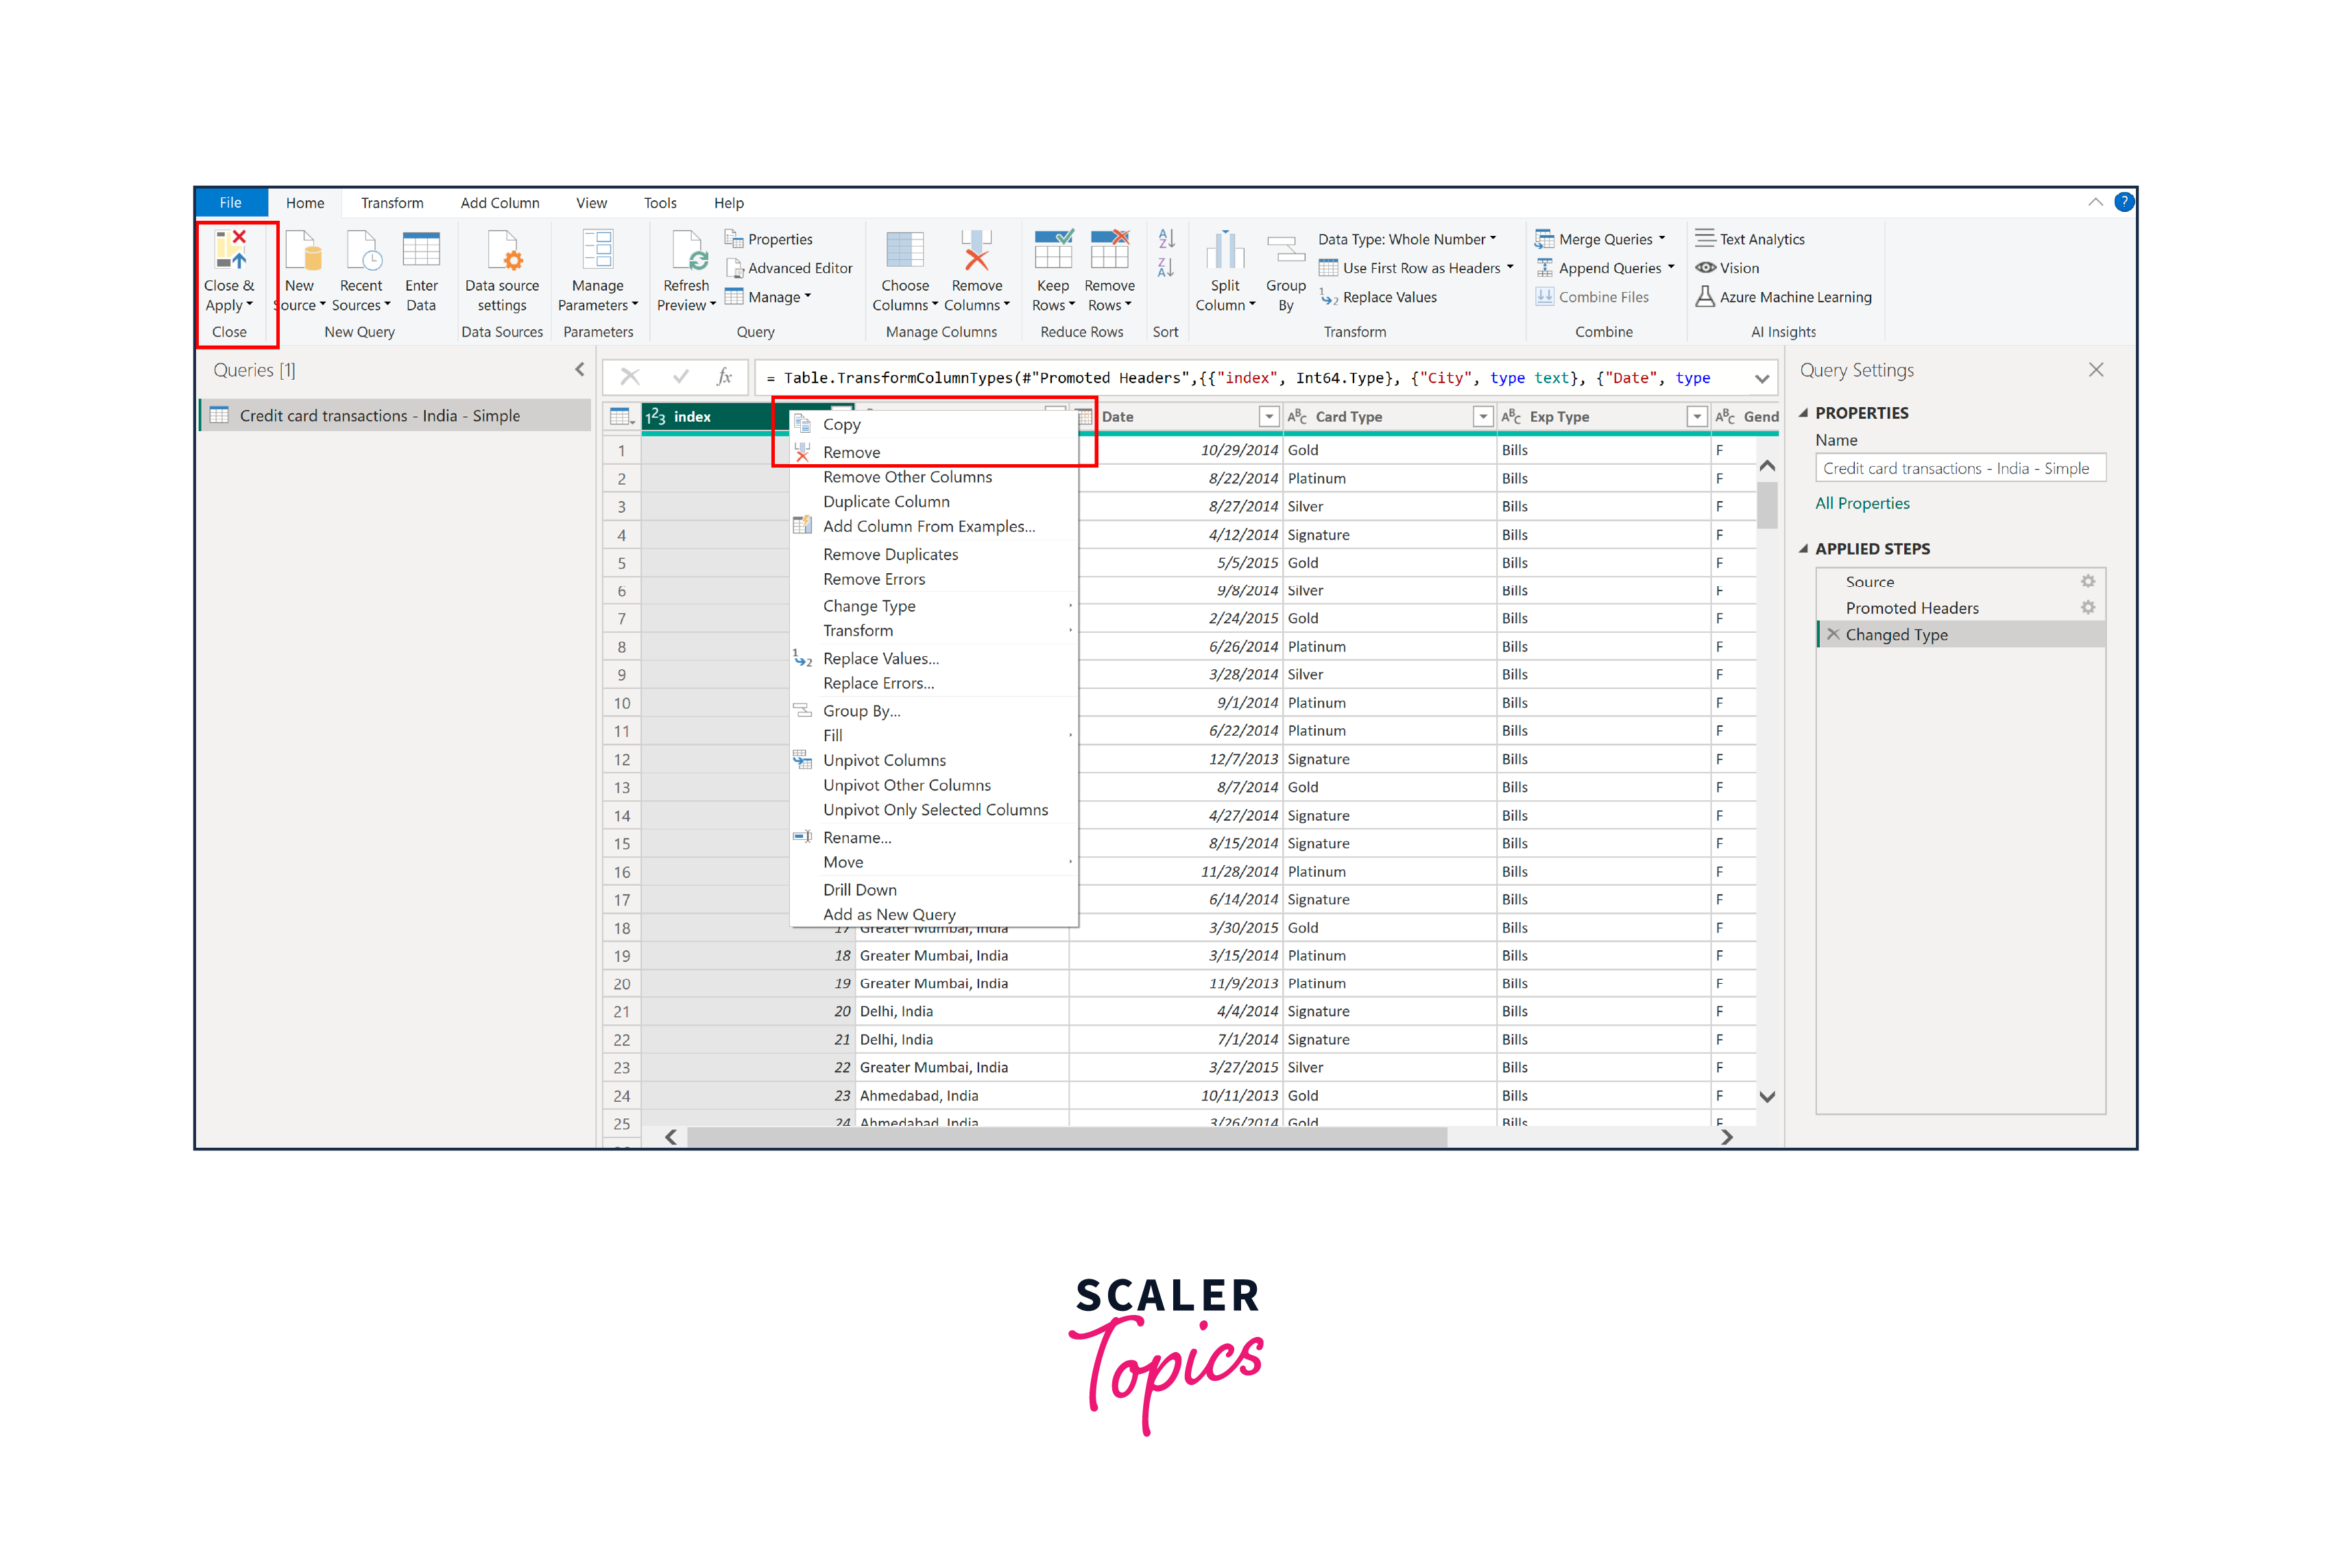
Data Transformation
We will meticulously prepare our dataset for analysis and visualization in the Data Transformation step. Here's how we will accomplish this -
- We'll begin by validating that all data types in the dataset are correct and aligned with the nature of the information they represent. This ensures that our subsequent calculations and visualizations will be accurate and meaningful.
- Our next priority is thoroughly addressing errors and missing values in the dataset. Any inconsistencies or gaps in the data can significantly impact the reliability of our financial dashboard. Therefore, depending on the specific context, we will implement appropriate error-handling techniques and handle missing data through methods like imputation or removal.
- To enhance the analytical power of our dashboard, we may introduce new features if necessary. Feature engineering involves creating calculated columns or aggregations that provide additional insights into the spending habits of Indian consumers.
- We will identify and remove unnecessary columns to streamline our dataset and optimize its relevance to the financial dashboard. For instance, in our dataset, the index column serves no analytical purpose, we will eliminate it to simplify the dataset and make it more user-friendly.
We will perform all these steps in the Power BI Query Editor, and once the steps are executed, we will click on close and apply to execute the transformation changes.
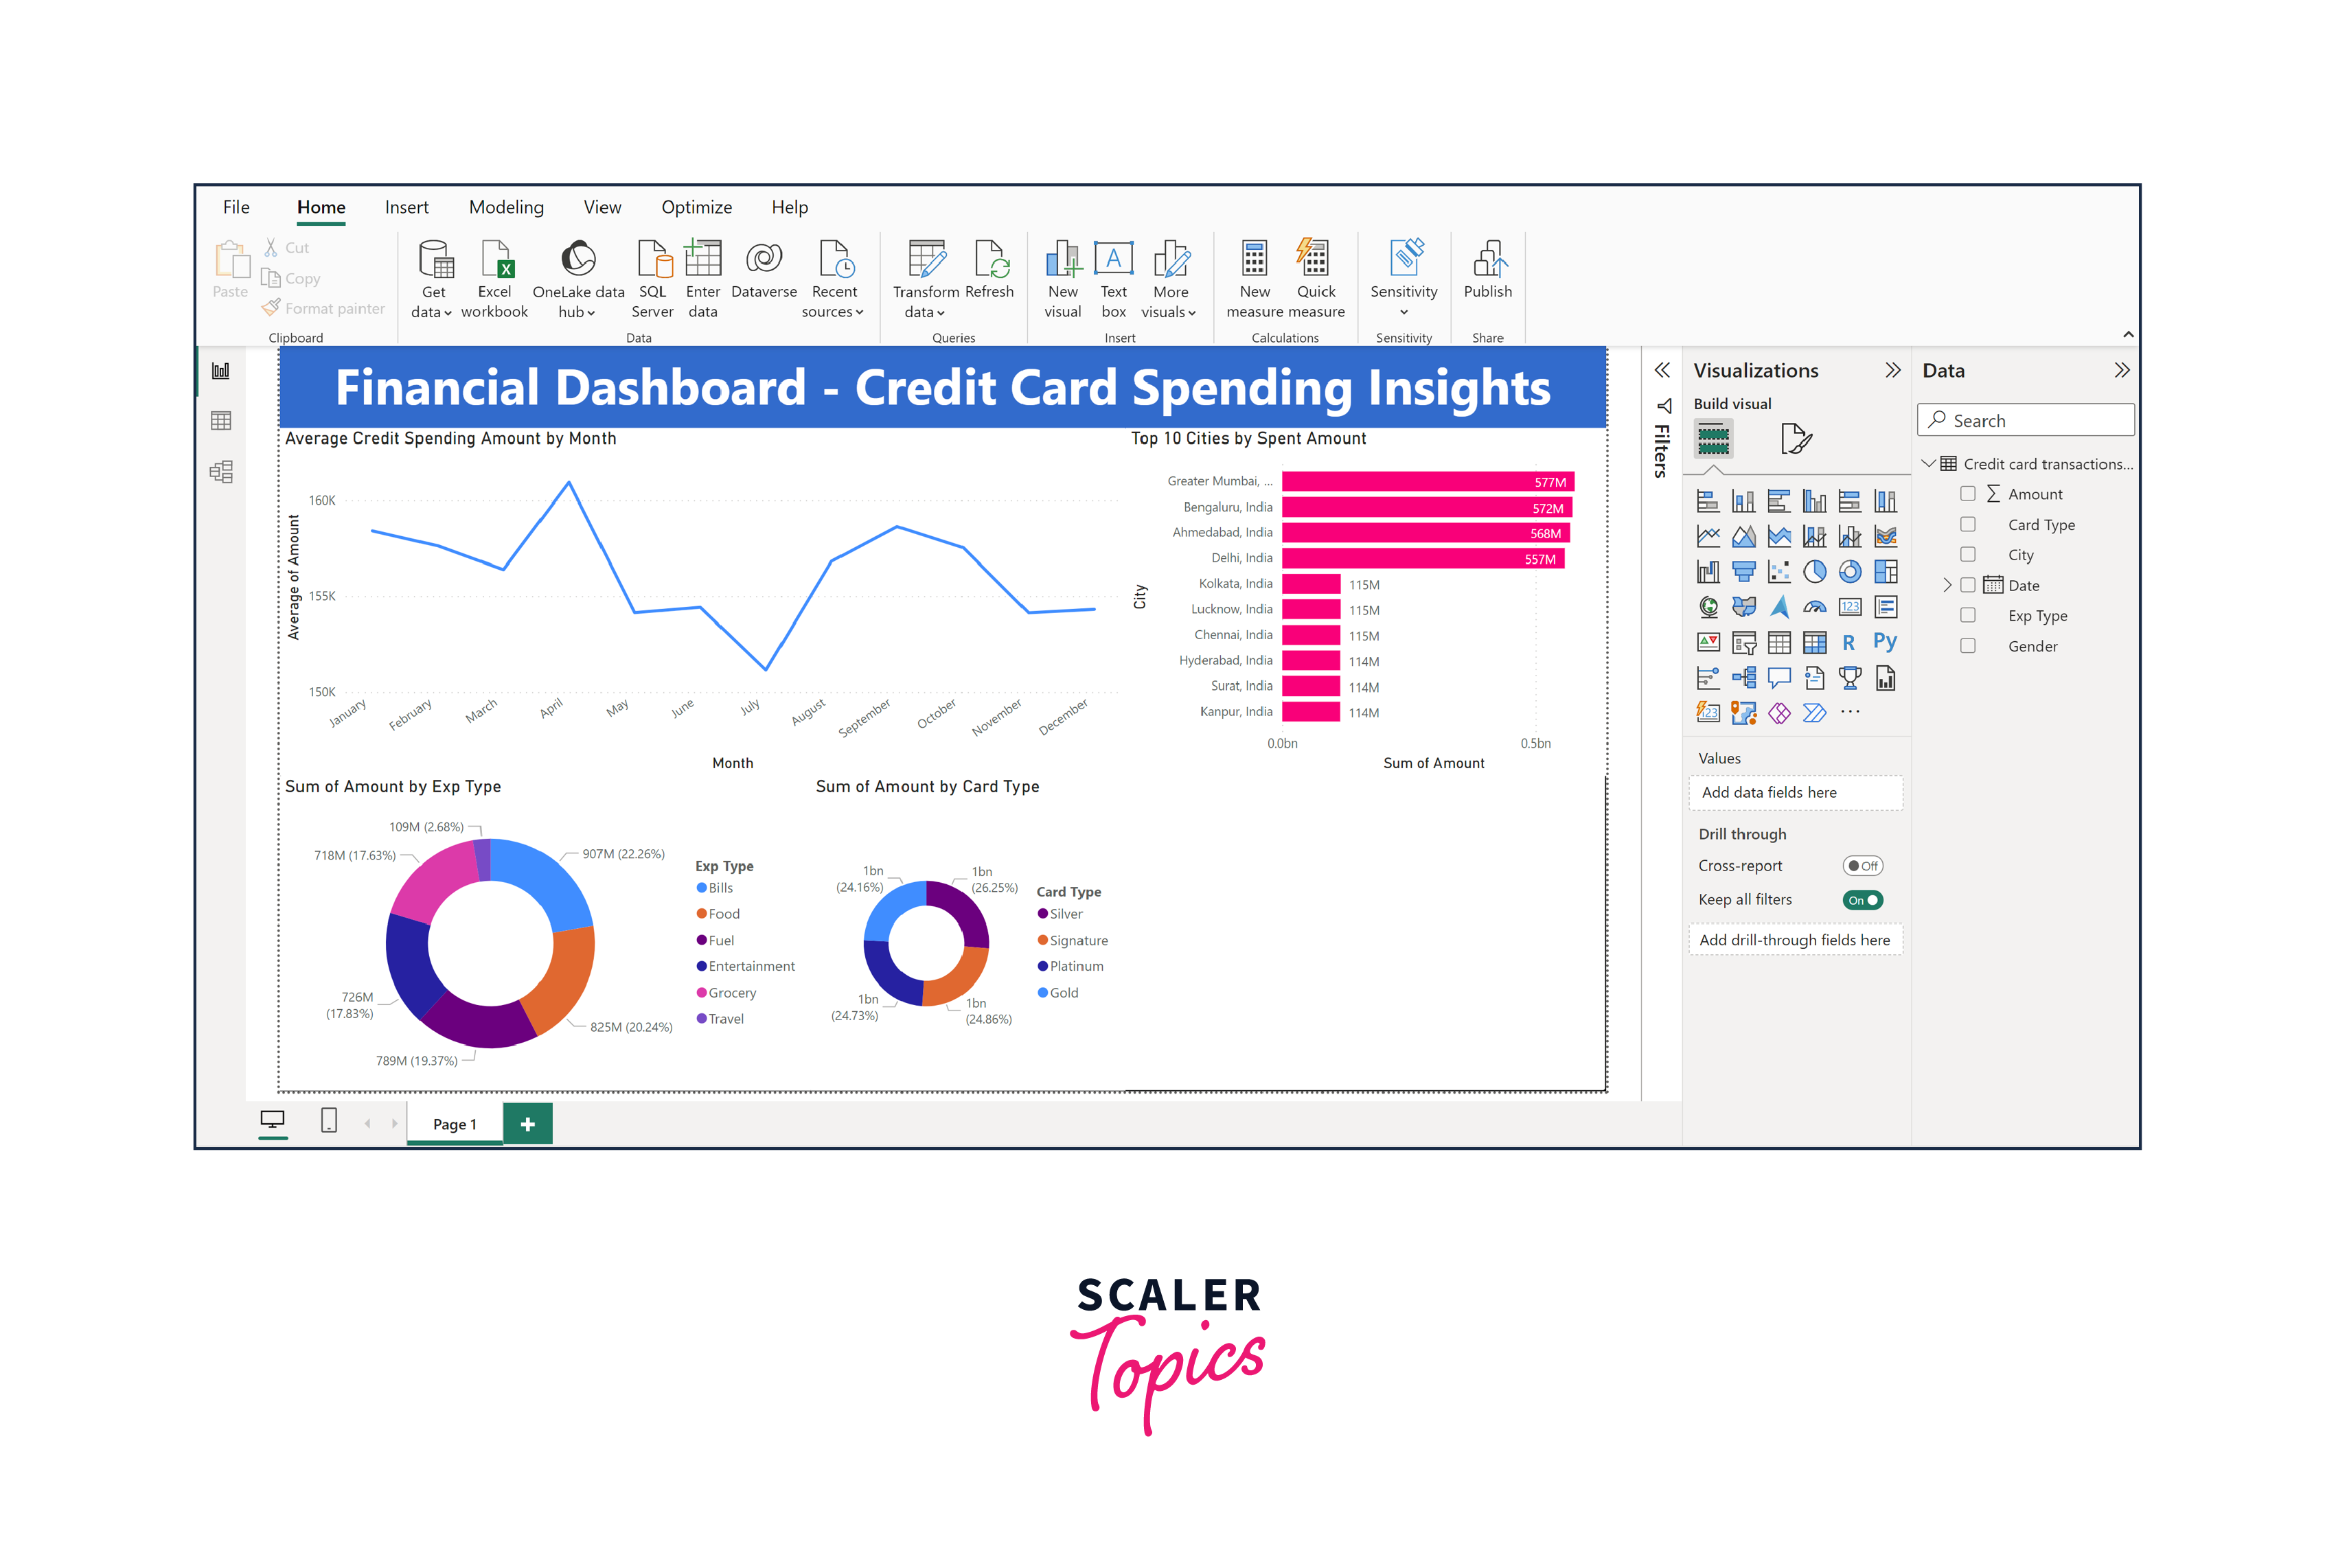
Creating Visualizations
In the "Creating Visualizations" step of our Power BI financial dashboard project, we'll craft various visual elements to provide a comprehensive understanding of credit card spending data. To create these visualizations in Power BI -
- Drag and drop the required fields onto the visualization area.
- Choose the appropriate visualization type (bar, line, or pie chart).
- Customize the visualizations by configuring labels, colors, and other settings.
In this project, we will focus on the following visualizations -
- Line Chart for Average Monthly Spending - This line chart allows us to visualize the trend in average spending over time. By plotting the monthly averages, we can identify spending peaks and valleys, providing insights into seasonal or long-term spending patterns. This is particularly useful for financial planning and understanding consumer behavior fluctuations throughout the year.
- Pie Chart for Expense Type Distribution - The pie chart displaying the distribution of transaction expenses by category (e.g., food, bills, entertainment) offers a clear snapshot of where consumers allocate their credit card expenditures. It highlights which expense categories dominate the spending landscape, helping businesses tailor their services or marketing strategies accordingly.
- Pie Chart for Credit Card Type Distribution - This pie chart showcases the distribution of spending based on credit card types (e.g., gold, silver, platinum). It reveals which credit card tiers are most commonly used for transactions. This information can be valuable for credit card companies, assisting them in refining their card offerings and benefits based on consumer preferences.
- Top 10 Cities by Total Amount Spent - Identifying the top 10 cities in India with the highest total amount spent offers geographical insights into consumer spending behaviors. This information benefits businesses and financial institutions targeting specific regions for marketing campaigns or expansion. It helps allocate resources effectively and tailor services to regional preferences.
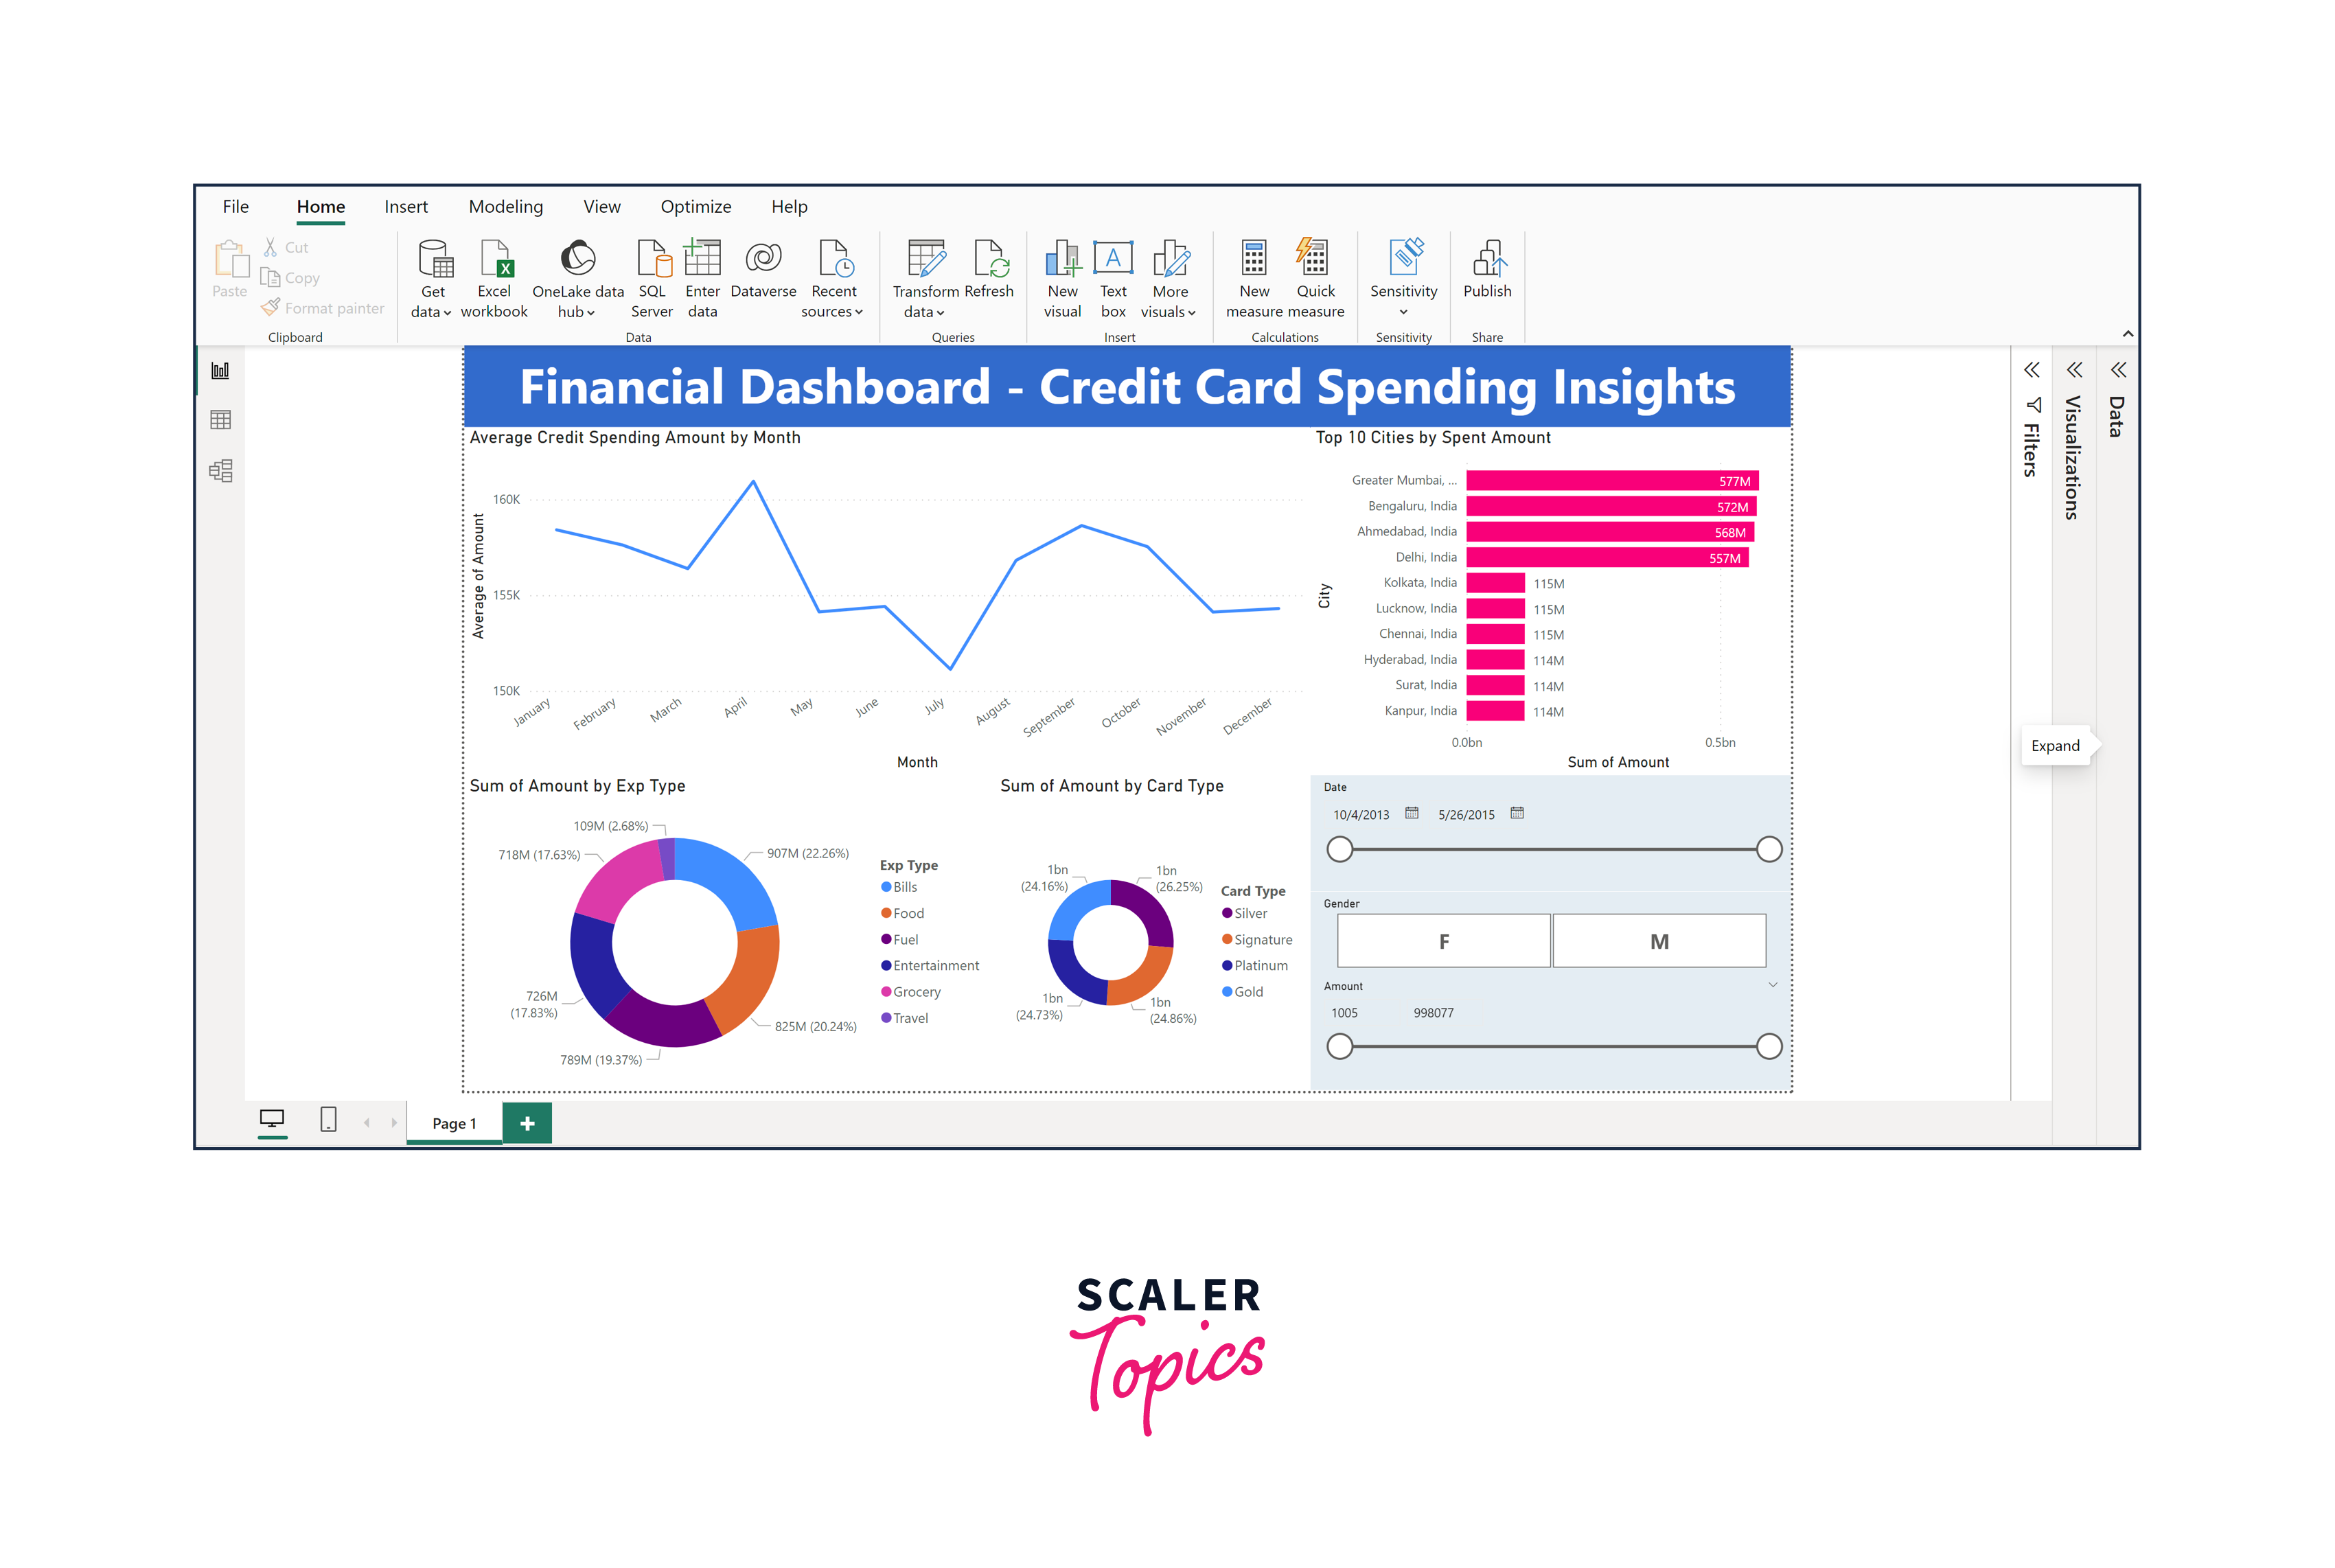
Incorporating slicers into our financial dashboard adds a layer of interactivity that empowers users to customize their data analysis. We'll expand our financial dashboard with additional components -
- Date Range Slicer - The date range slicer allows users to select a specific time frame for their analysis. This is significant because it enables users to zoom in on particular periods of interest, such as specific months, quarters, or years. Users can assess spending trends, compare different time periods, and gain insights into seasonality or cyclical patterns in credit card expenditures. It's a valuable tool for tracking changes over time and making informed decisions based on historical data.
- Gender Slicer - The gender slicer permits users to filter the data based on gender. This is significant as it enables gender-based segmentation of spending habits. Businesses and advertisers can leverage this slicer to tailor marketing campaigns or product offerings to specific gender demographics. It also allows for gender-based comparisons of spending patterns, offering insights into consumer preferences and behaviors.
- Amount Slicer - The amount slicer provides users with the ability to set spending thresholds or ranges. This is significant because it allows users to focus their analysis on transactions falling within specific budget constraints. It's useful for identifying high-value transactions, outliers, or analyzing spending behavior within predefined budget limits. This slicer facilitates fine-grained control over the data analysis process, aiding in targeted decision-making.
These slicers enhance the interactivity of the financial dashboard, enabling users to explore the data from different angles and extract insights that are relevant to their specific needs and objectives. Combining these slicers with the previously created visualizations allows users to conduct in-depth, customized analyses of credit card spending habits among Indian consumers, ultimately leading to more informed decision-making.
Dashboard Reporting
Publishing and sharing the dashboard is crucial, allowing stakeholders to access insights and collaborate seamlessly. Here's how to do it -
- Click "Publish" in Power BI Desktop.
- Choose Power BI Service workspace to publish to.
- In Power BI Service, open the report, click "Share," and specify recipients' email addresses.
- Set permissions (view or edit).
- Recipients receive an email invitation with a link to the shared dashboard.
Conclusion
- The financial dashboard revealed distinct seasonal spending trends among Indian consumers. This insight is invaluable for businesses and financial institutions, enabling them to strategically plan promotions and offerings during peak spending periods to maximize revenue.
- The pie chart visualizing the distribution of transaction expenses by category highlighted that a significant portion of credit card spending is allocated to "bills" and "food." Businesses can leverage this information to tailor financial products and services that align with these spending preferences, potentially introducing rewards or discounts in these categories to attract and retain customers.
- The dashboard shed light on regional spending variations by identifying the top 10 cities in India with the highest total amount spent. Businesses can use this information to target specific regions for marketing campaigns and tailor their services to each city's preferences and economic conditions, optimizing resource allocation and expansion strategies.