An Introduction to Power BI Dashboard
Overview
In today's data-driven world, effective data visualization is crucial for making informed and data-driven business decisions. Power BI, a powerful business analytics tool developed by Microsoft, offers a comprehensive platform for creating interactive and insightful dashboards. This article provides a beginner-friendly introduction to Power BI Dashboards, exploring their features, advantages, and steps to create a Power BI dashboard. Whether you're a business analyst, data professional, or decision-maker, understanding Power BI dashboards can unlock the potential of your data-driven strategies.
What is Power BI?
Power BI is a business intelligence platform developed by Microsoft that empowers individuals and organizations to connect to various data sources, transform raw data into meaningful insights, and create interactive, visually appealing reports and dashboards. It offers a comprehensive suite of data preparation, exploration, modeling, and visualization tools, enabling users to make informed decisions based on real-time and historical data. With its user-friendly interface and robust capabilities, Power BI bridges the gap between technical and non-technical users, democratizing data analytics and fostering a data-driven culture within enterprises.
Features of Power BI
Here are some of the key features offered by Power BI:
- Data Connectivity:
Power BI seamlessly connects to a wide range of data sources, from spreadsheets and databases to cloud services, allowing you to gather data from various platforms. - Data Transformation:
It offers intuitive tools to clean, shape, transform, and prepare data, ensuring that your information is accurate and ready for analysis. - Rich Visualization:
Power BI provides a vast collection of customizable visualizations, enabling you to create compelling charts, graphs, maps, and more. - Interactive Dashboards:
You can design interactive Power BI dashboards that update in real-time, allowing users to explore data and gain insights on the fly. - Natural Language Queries:
Users can ask questions using natural language, and Power BI generates relevant visualizations and insights, simplifying data exploration. - Collaboration:
The platform facilitates collaborative analytics by allowing users to share reports and dashboards securely with colleagues. - Mobile Accessibility:
Power BI offers mobile apps for iOS and Android, ensuring data access and interactivity on the go.
What is a Power BI Dashboard?
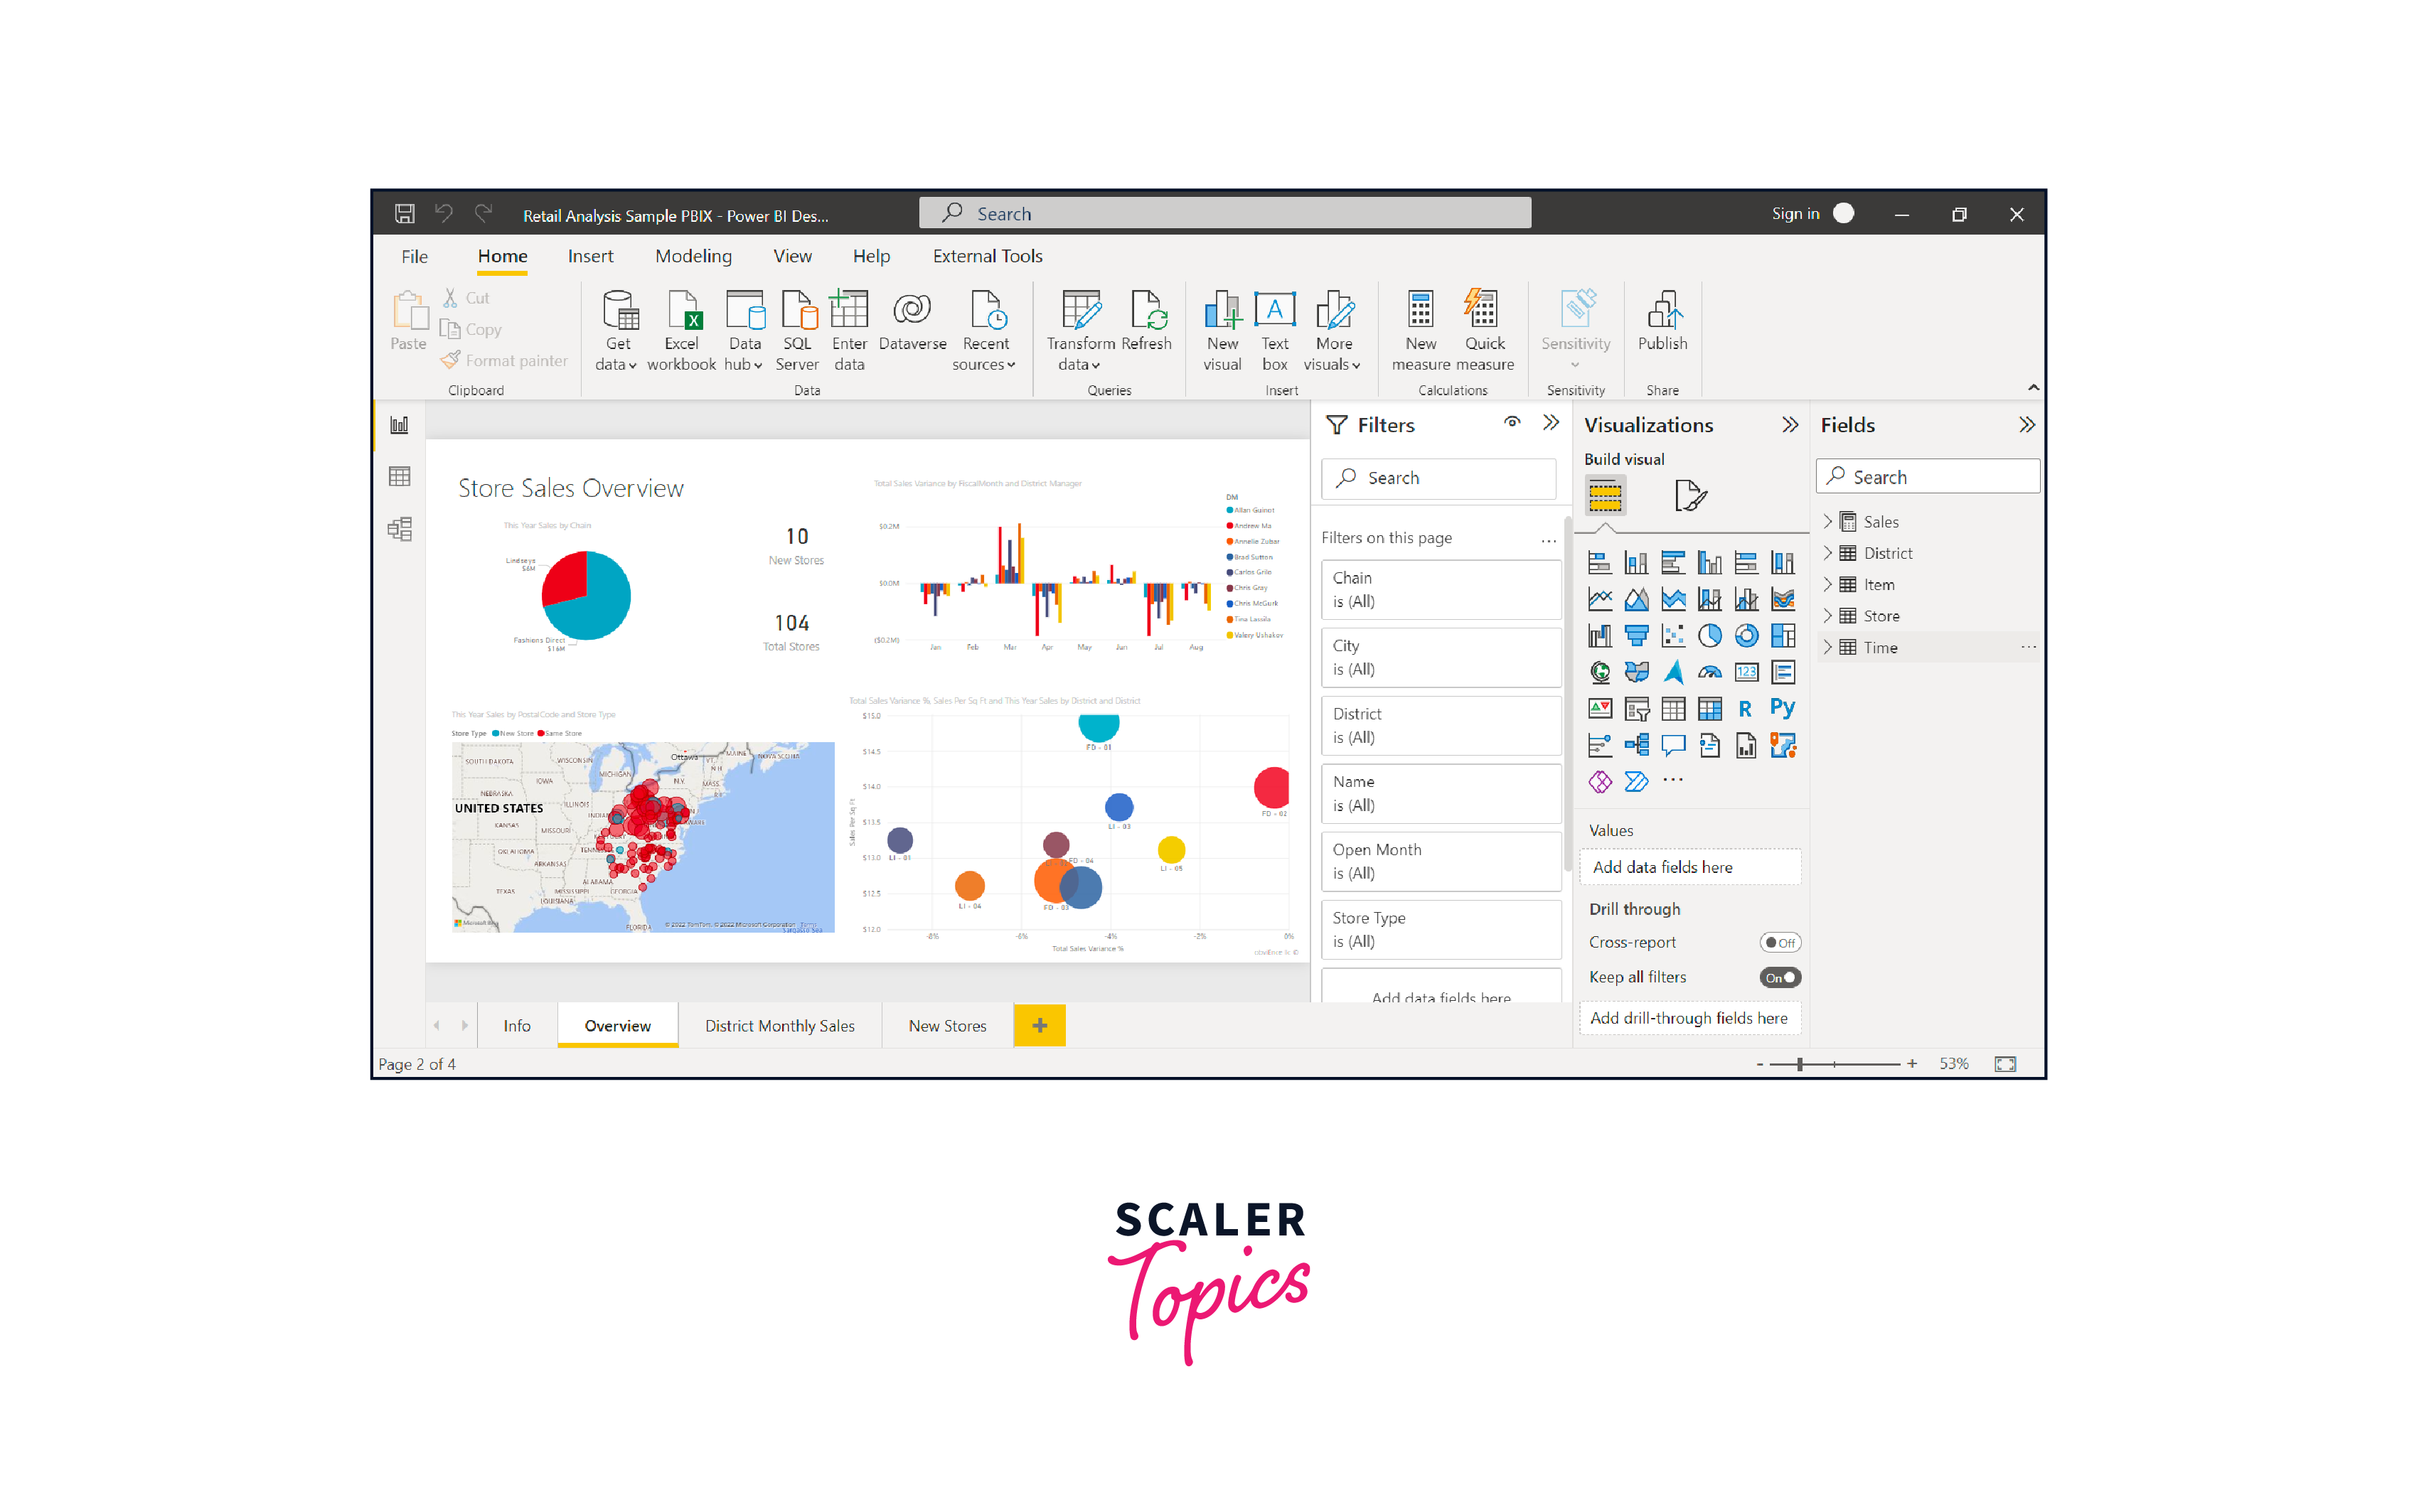
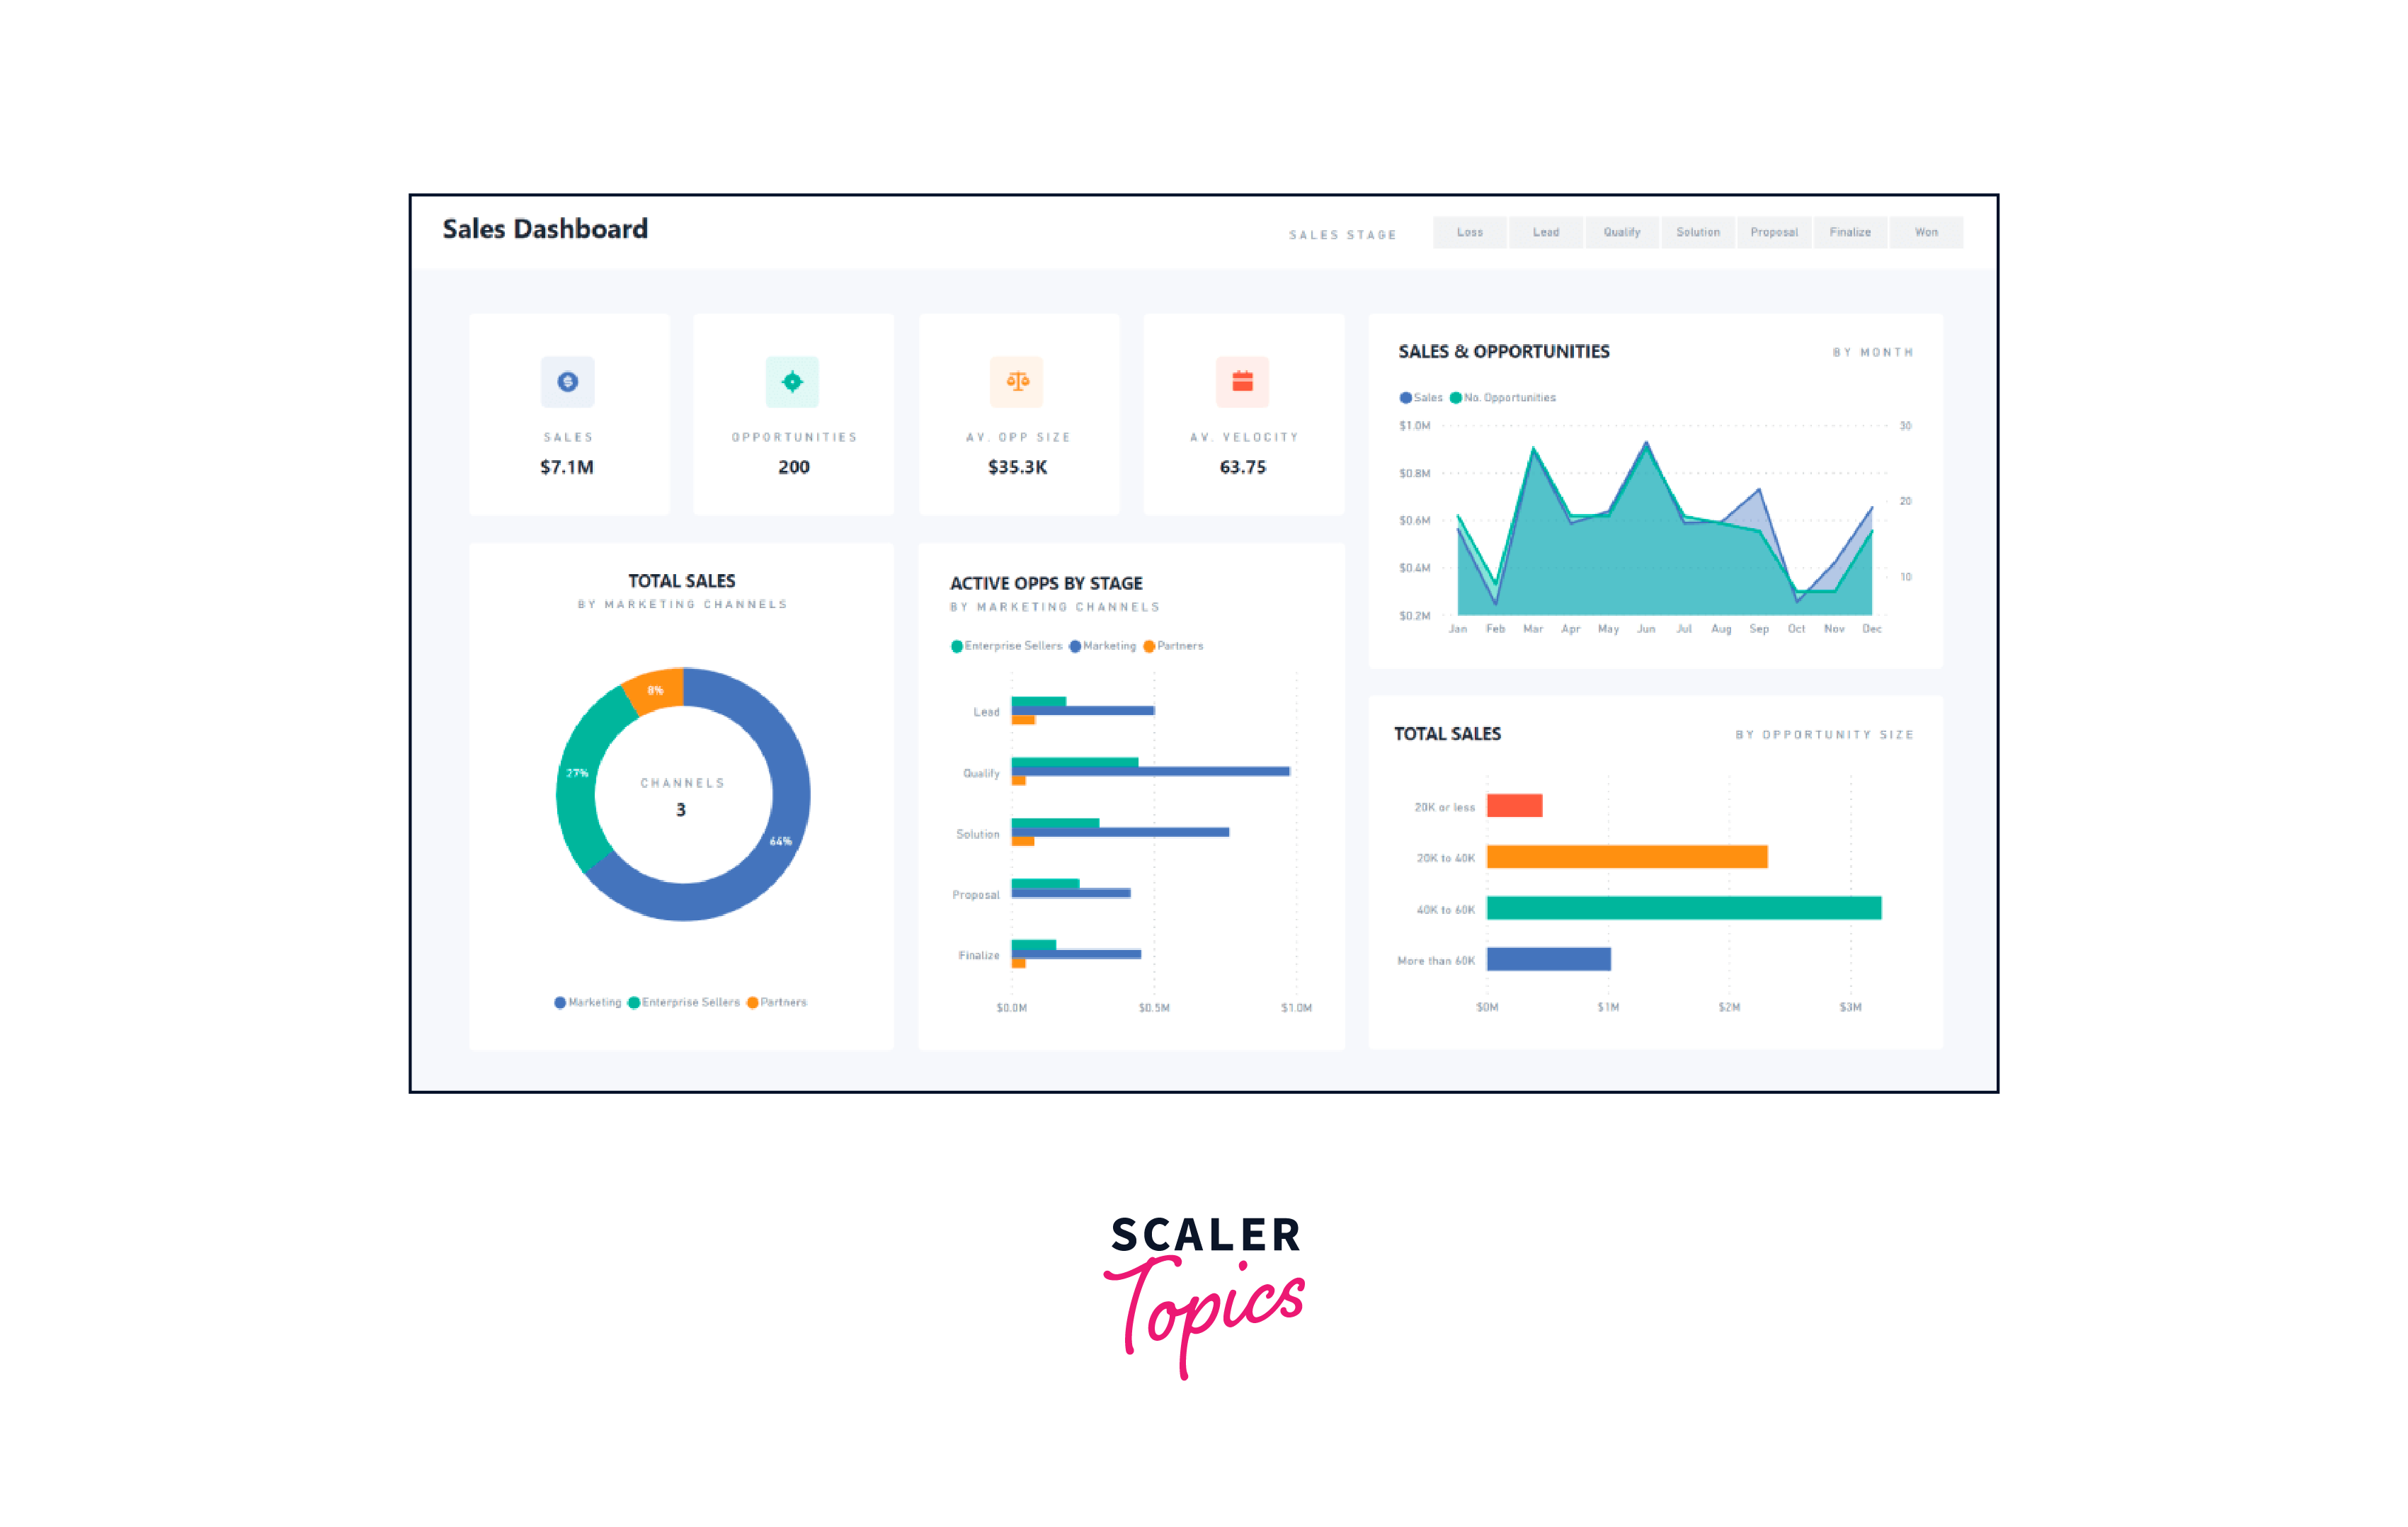
A Power BI dashboard is a consolidated display of key metrics, insights, and visualizations that provide a comprehensive overview of your data-driven objectives. It serves as a dynamic, real-time interface that allows you to monitor performance, track trends, and make informed decisions. By combining various visual elements such as charts, graphs, and maps, Power BI dashboards transform complex datasets into easily comprehensible insights, fostering a deeper understanding of your organization's data landscape. Power BI dashboards offer a centralized hub to transform raw data into actionable intelligence, whether used for sales tracking, operational analysis, or strategic planning.
A Power BI dashboard is a consolidated interface that combines various data visualizations, reports, and key performance indicators (KPIs) in a single, interactive interface. It provides a high-level overview of the most crucial insights from your data, allowing users to quickly grasp trends, patterns, and important metrics at a glance. For instance, imagine a retail company aiming to monitor its sales performance. A Power BI dashboard could showcase real-time sales figures, top-selling products, geographic distribution of sales, and year-over-year growth. Color-coded charts, graphs, and maps could visually represent this information, making it easy for executives to assess performance and make strategic decisions promptly.
Advantages of a Power BI Dashboard
Here are some of the key advantages of Power BI dashboards, as mentioned below -
- Data Clarity:
Power BI dashboards transform complex datasets into visually intuitive representations, enabling users and business executives to comprehend information quickly and make data-driven decisions. - Real-time Insights:
By connecting to live data sources, Power BI dashboards provide real-time updates, ensuring that your decisions are based on the most current information available. - Interactivity:
Users can interact with the dashboard, applying filters, drilling down into details, and asking questions, fostering a deeper understanding of the data. - Customization:
Individuals can tailor dashboards to their specific needs with a variety of customizable visualizations, colors, and layouts, ensuring that the information presented aligns with the organization’s goals. - Accessibility:
With mobile apps and online sharing capabilities, Power BI dashboards enable users to access and explore data from anywhere, facilitating collaboration and on-the-go decision-making. - Centralized Reporting:
Power BI dashboards centralize multiple reports and visualizations in one location, streamlining data analysis and reducing the need to navigate through multiple sources. - Decision Agility:
Empowered by actionable insights, stakeholders can swiftly respond to changing market conditions, emerging trends, and business opportunities, gaining a competitive edge.
Power BI Dashboard vs. Reports
Here is the comparison of Power BI dashboards and Power BI reports in a tabular format:
| Factor | Power BI Dashboards | Power BI Reports |
| Pages | Comprises a single page | Contains one or more pages |
| Data Sources | Incorporates one or more reports and datasets per dashboard | Utilizes a single dataset per report |
| Filter | Lacks the ability to filter or slice the view | Enables filtering, highlighting, and slicing of the view in various ways |
| Availability on Power BI Desktop | Unavailable in Power BI Desktop | Report creation possible within Power BI Desktop |
| Data Scope | Displays summarized data for quick insights | Presents in-depth data with detailed analysis |
| Navigation | Limited navigation, focused on specific insights | Allows flexible exploration of various aspects |
How to Create a Dashboard in Power BI?
Creating a dashboard in Power BI involves a series of steps that blend data preparation, visualization design, and interactivity. Here's a step-by-step guide to help you build your own Power BI dashboard:
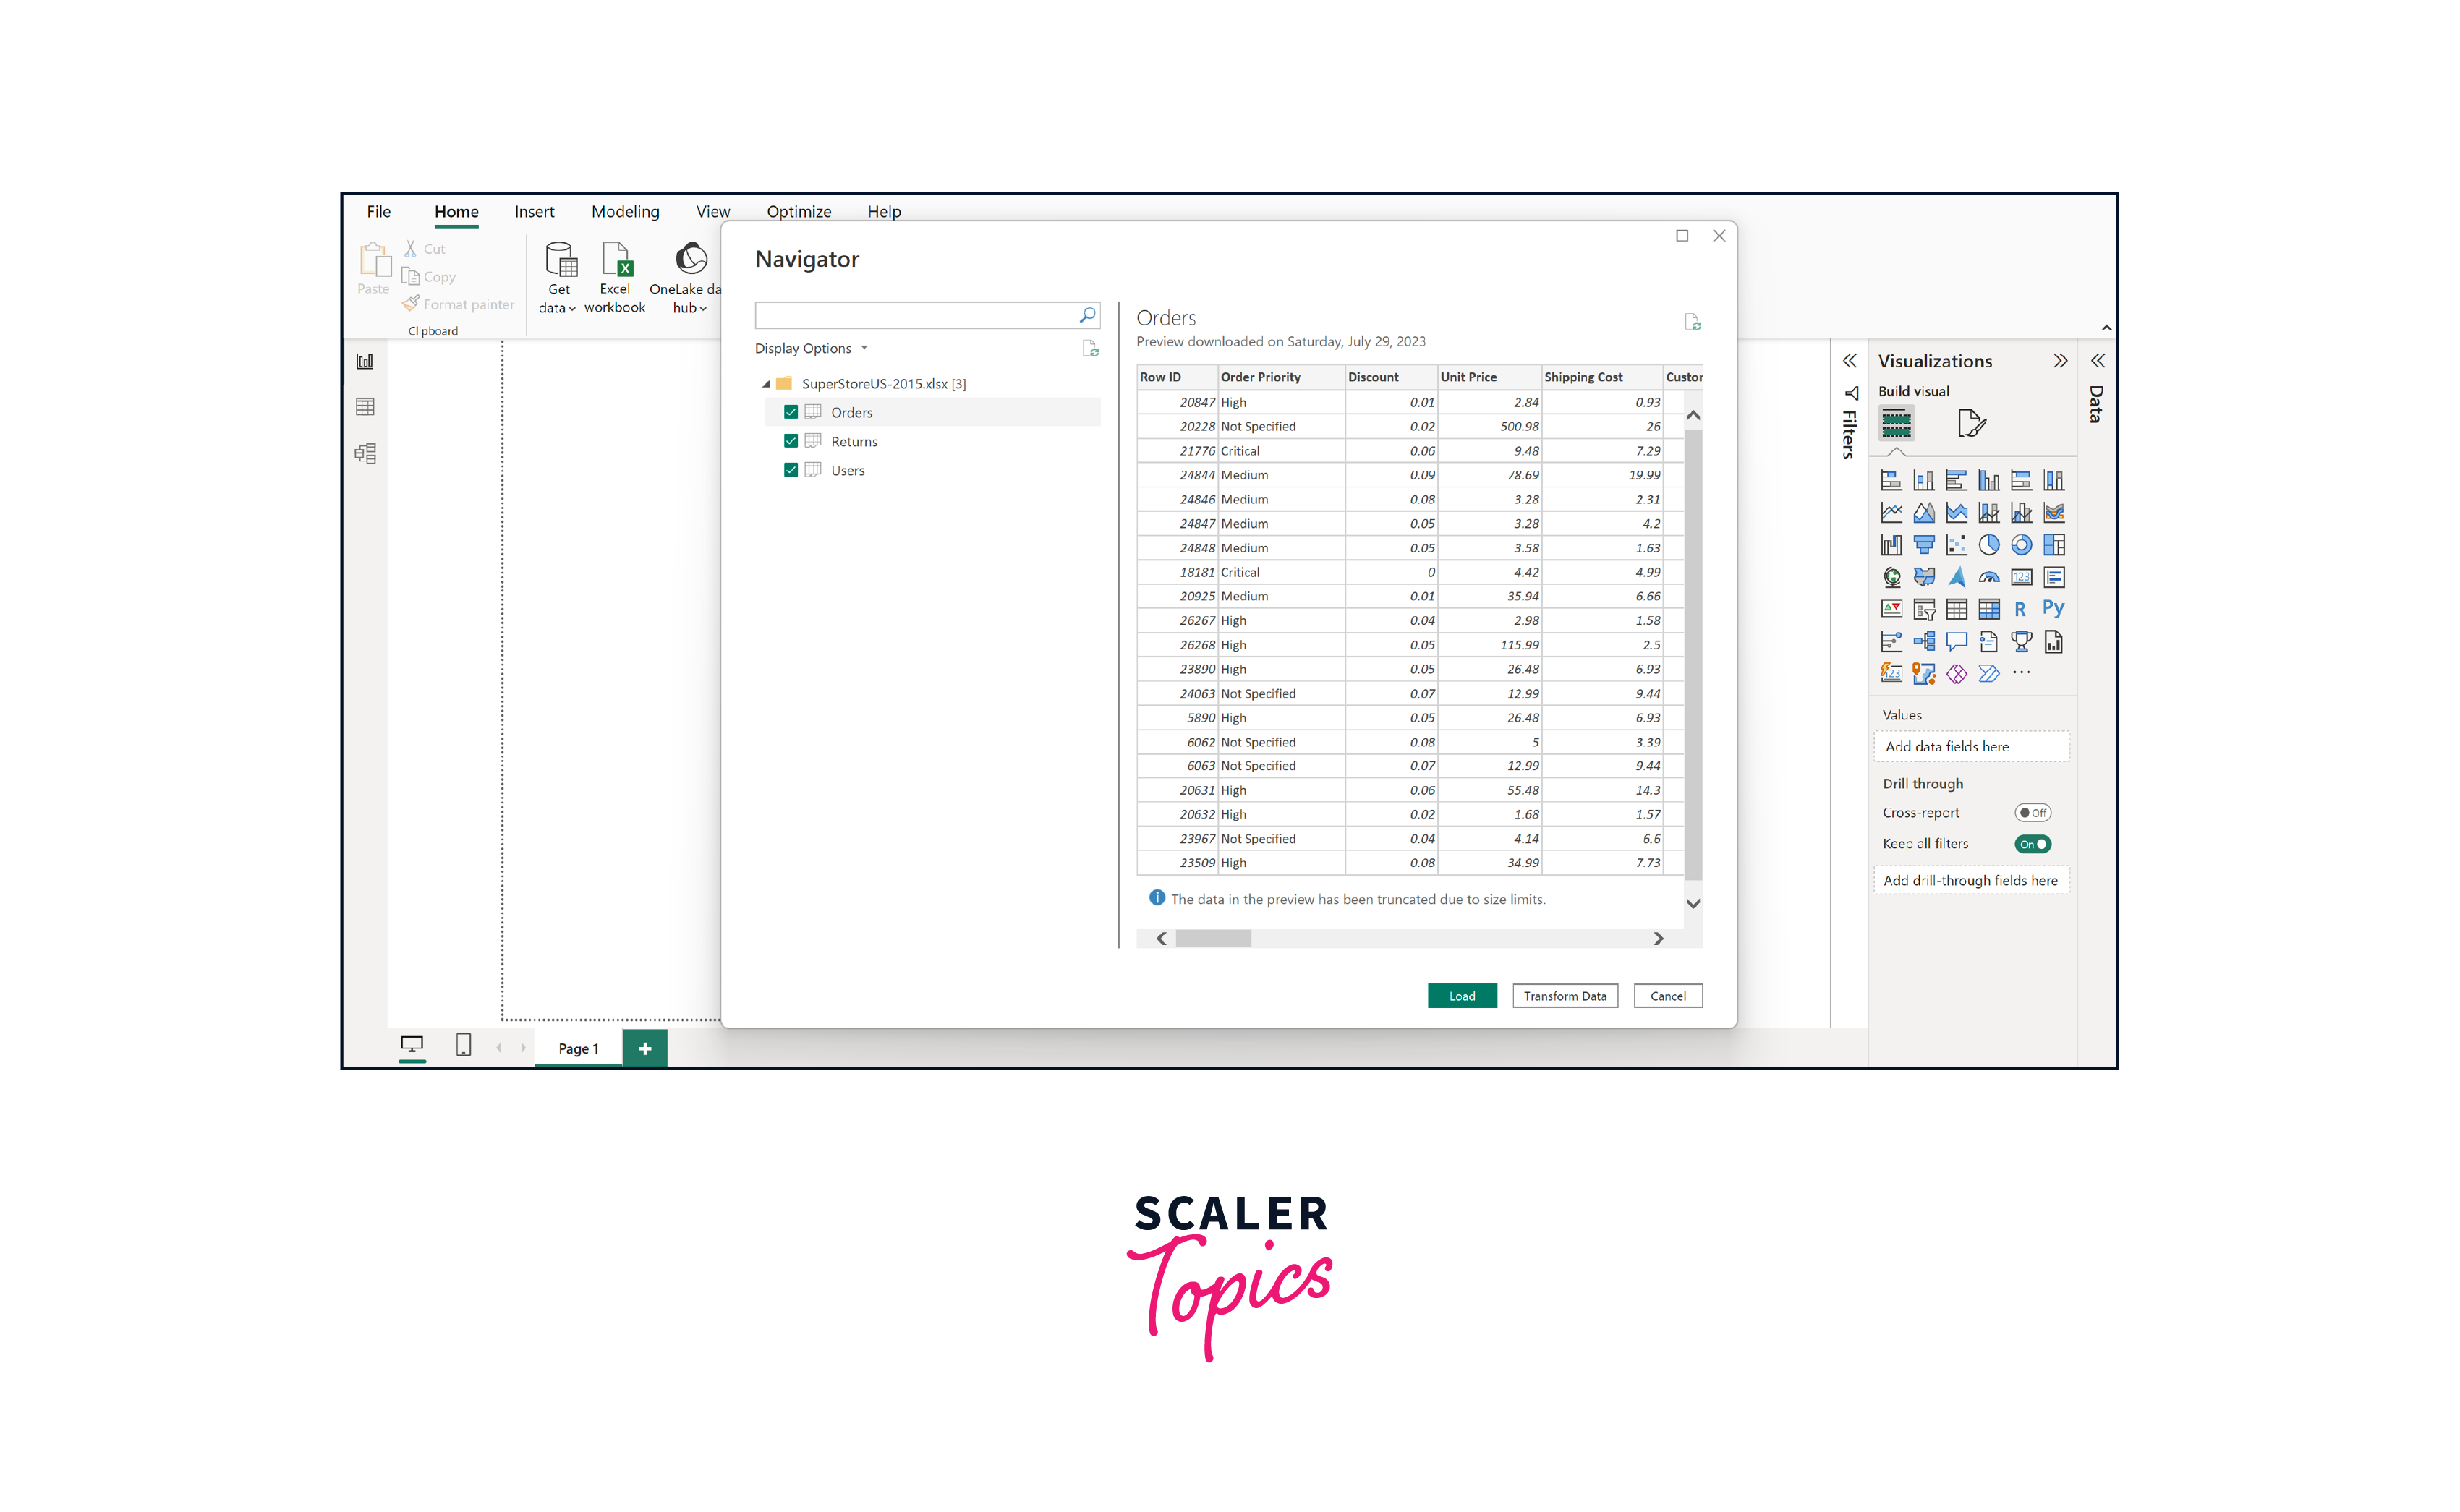
Step - 1:
Launch Power BI Desktop, click "Home," and select "Get Data" to connect to your data sources, such as Excel, SQL Server, or cloud services like Azure. In this illustration, we will employ an Excel spreadsheet encompassing a sales dataset from US superstores in 2015, as shown in the figure below. Once data is loaded, you can also clean and transform your data as needed using the Power Query Editor. This may involve filtering, merging, or reshaping data.
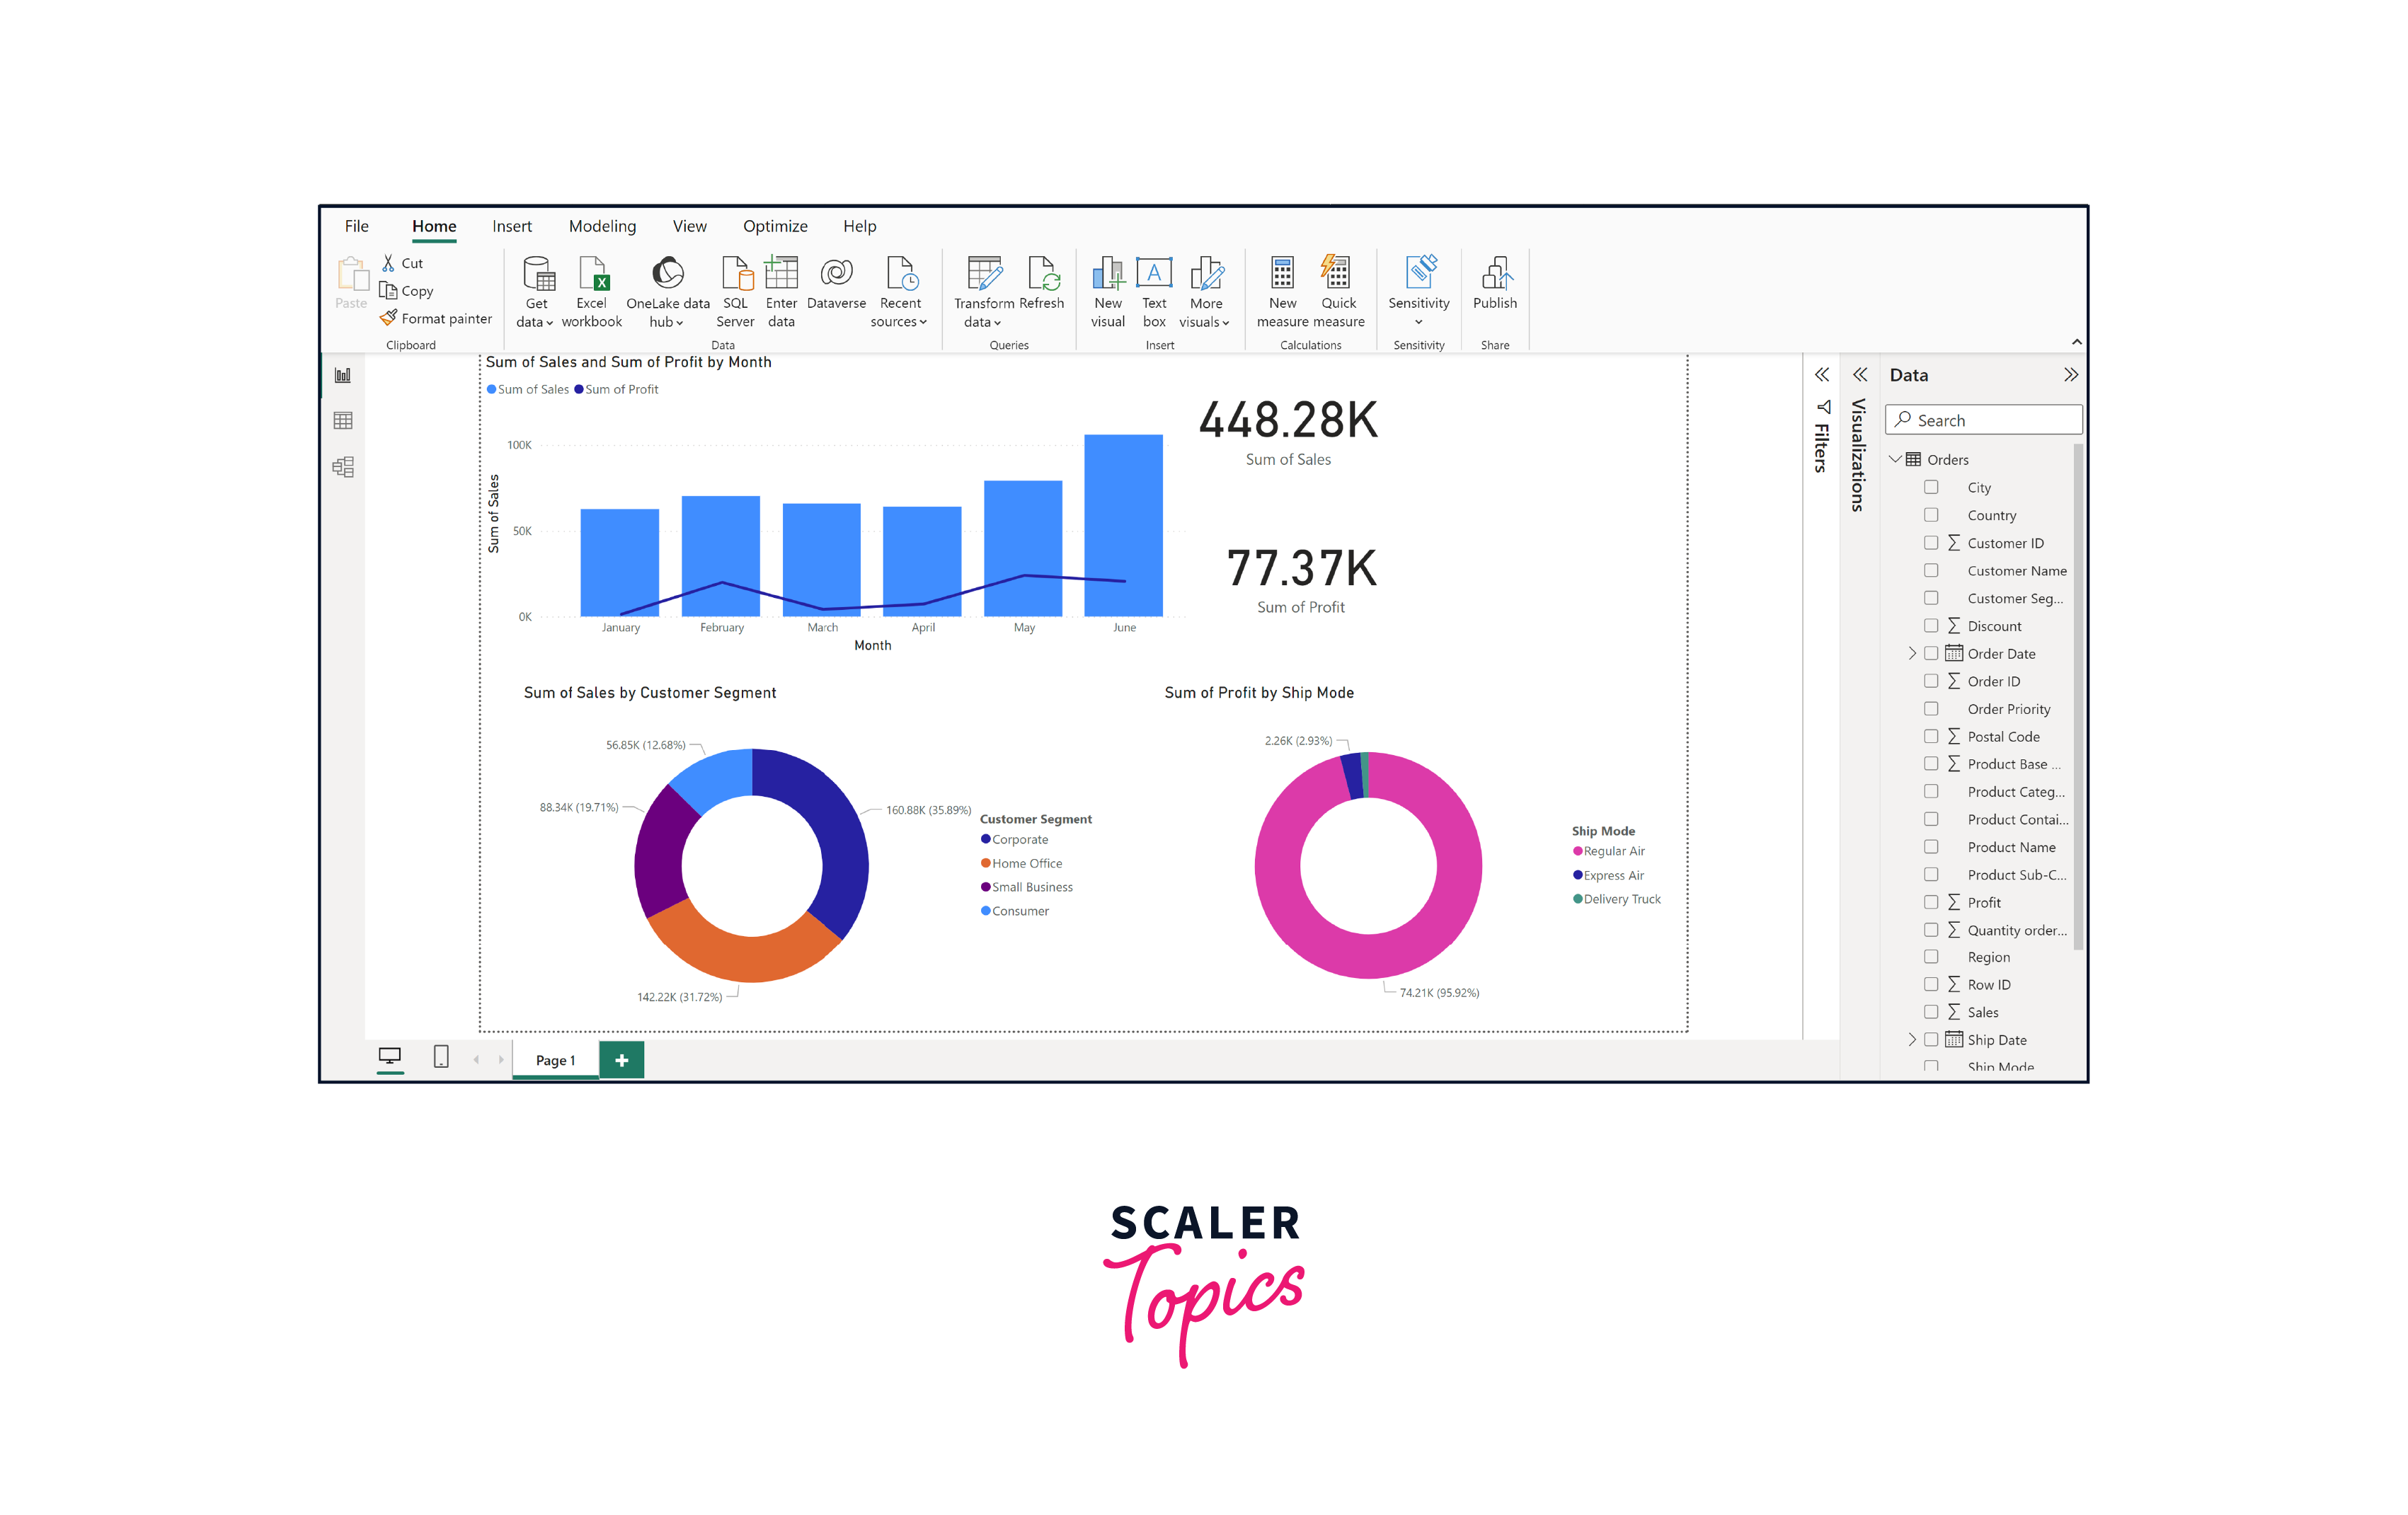
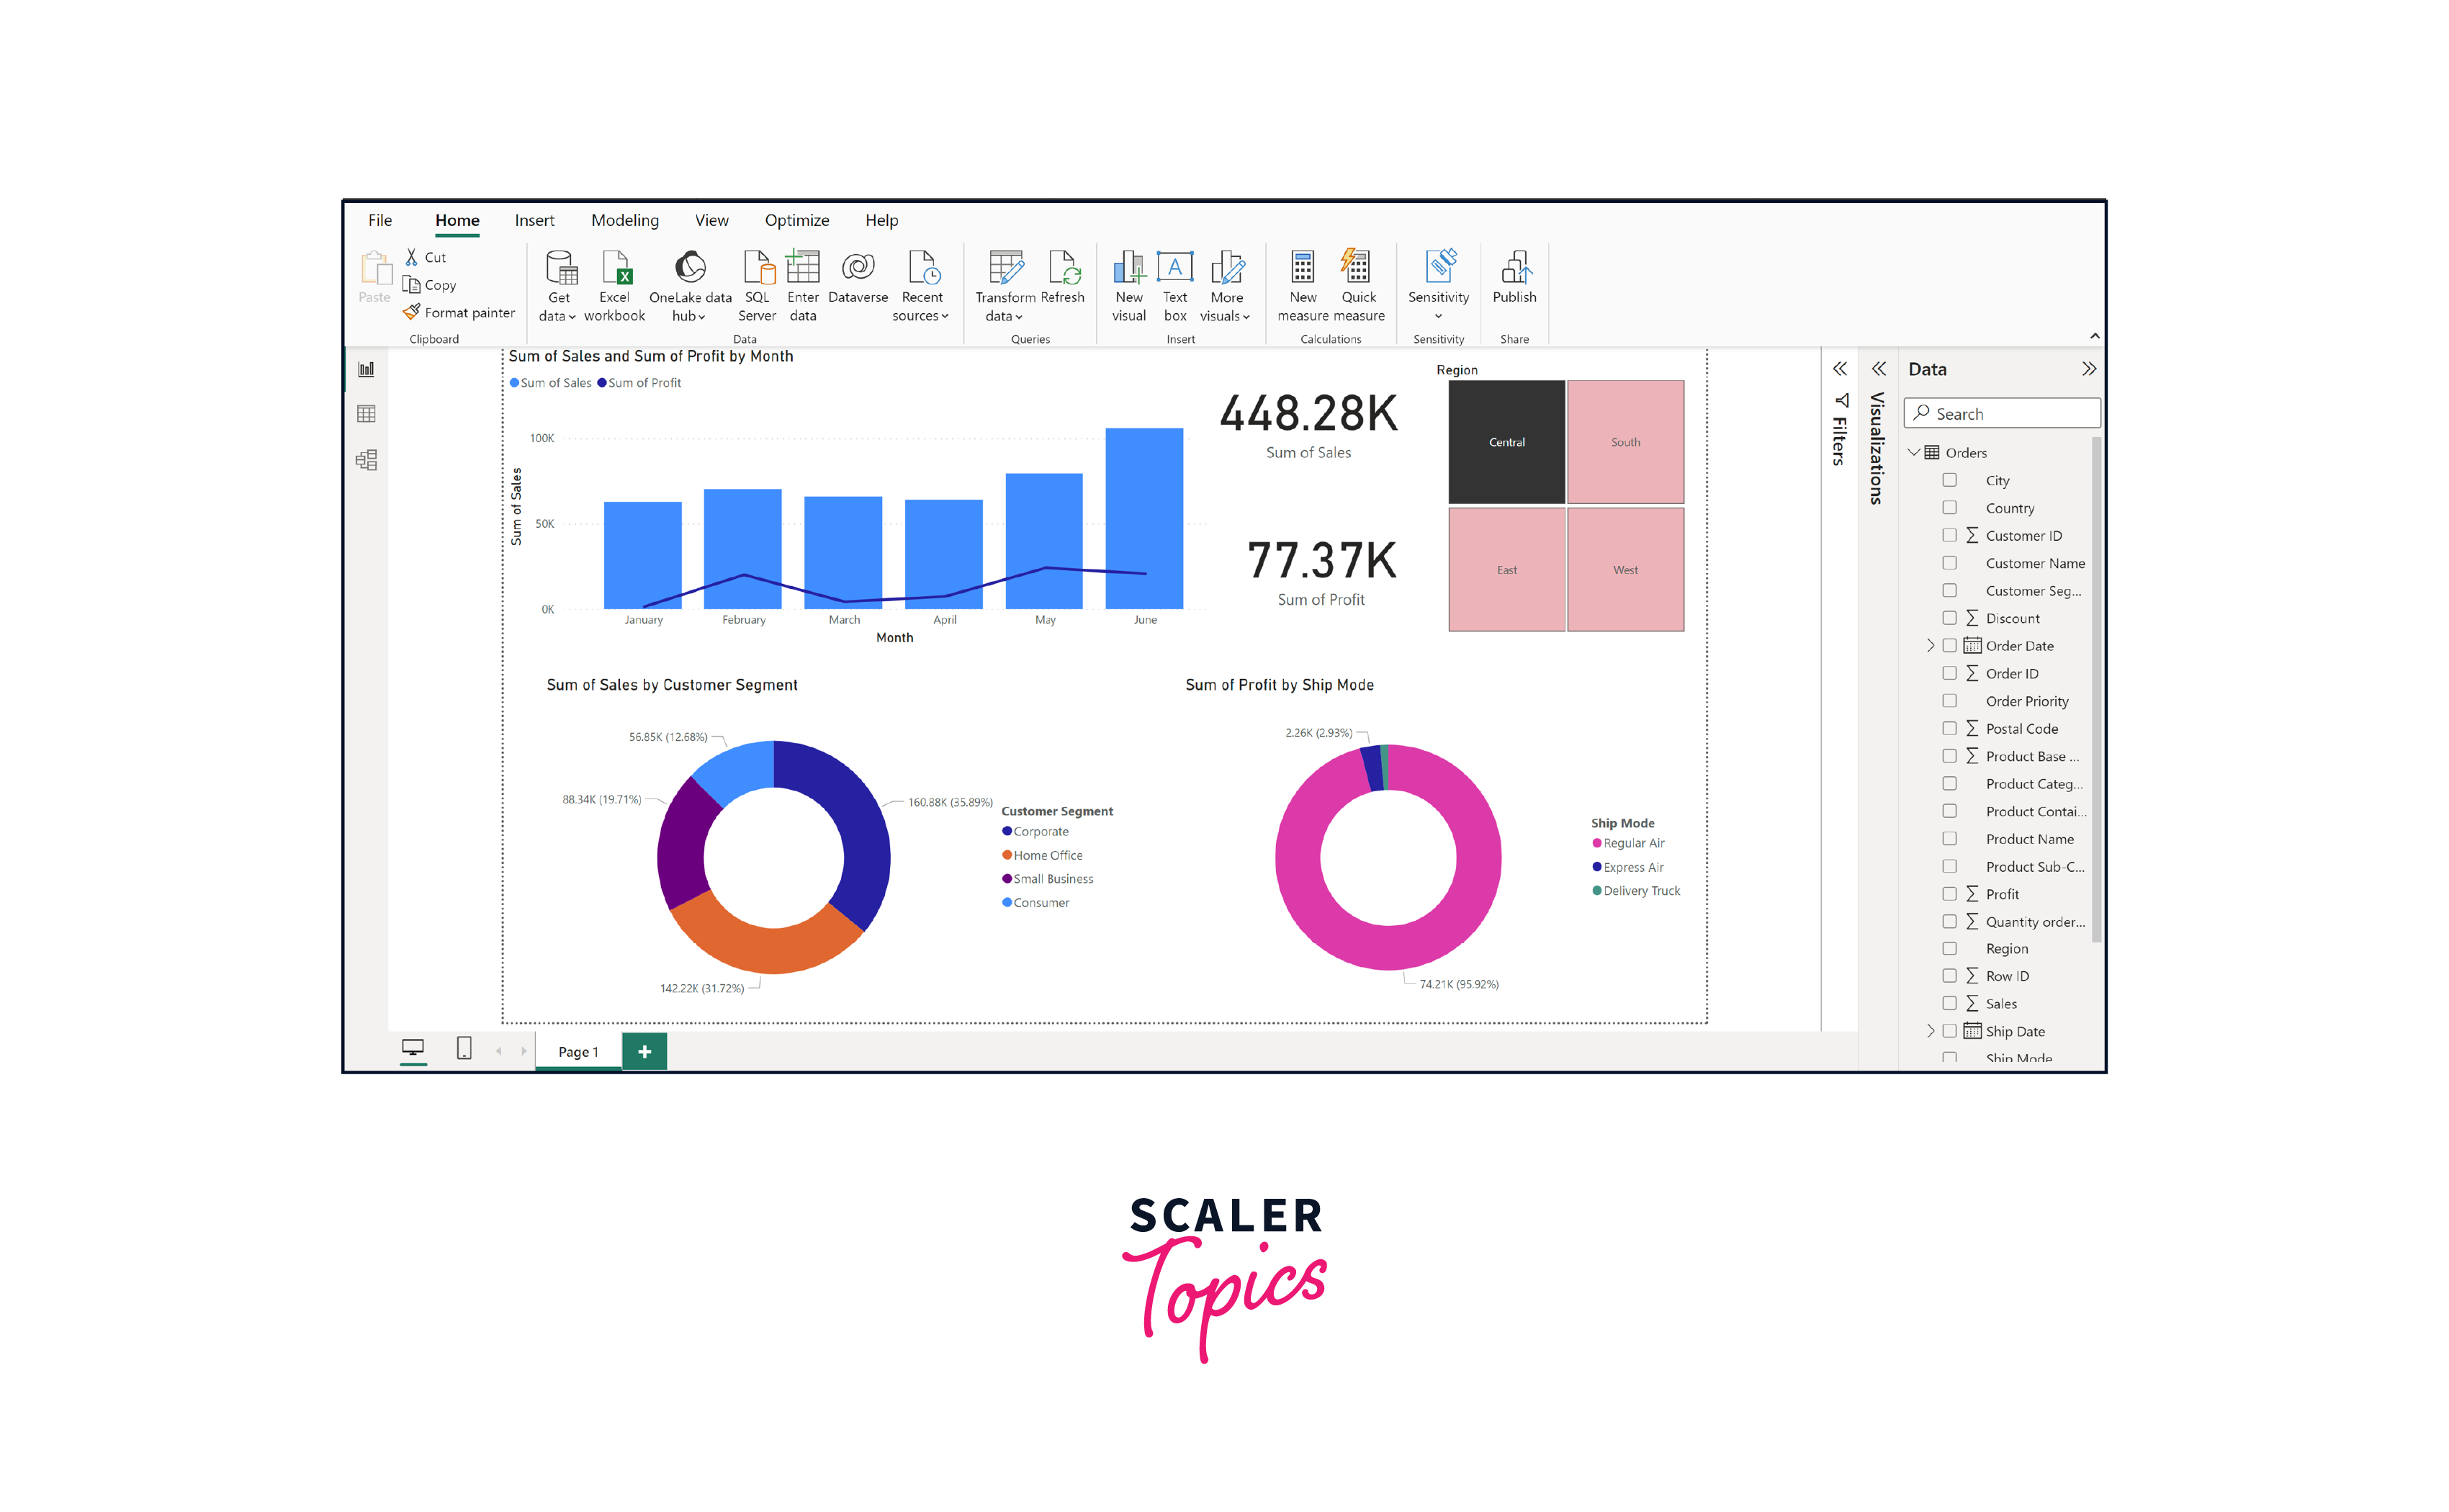
Step - 2:
After loading and transforming your dataset into Power BI, go to the Visualizations pane on the right, select the desired visualization type (e.g., bar chart, pie chart, map), and drag and drop fields from your dataset to the appropriate areas in the Power BI visualization canvas. In this instance, we've created a line and stacked bar chart to depict monthly profits and sales, respectively. Additionally, there are two donut charts portraying the combined sales based on customer segments and total profit categorized by shipping modes. Furthermore, the dashboard incorporates two cards detailing the overall sales and profits. You can also choose to personalize your visualizations, including aspects like font choice and color palette.
Step - 3:
You can also add interactive elements like slicers, filters, and drill-through options to the Power BI report. These interactive elements empower users to dynamically explore and analyze data, enabling focused insights and customized views for more informed decision-making. For instance, we have applied a slicer to filter reports/visualizations based on the region attribute, as shown in the figure below. Before proceeding to the next step to build and publish your dashboard, ensure you save your report onto your local disk.
Step - 4:
Up to this point, you were using Power BI Desktop to design and craft various visualizations in your report. To build the dashboard, you will require Power BI Service (Online). Click the "Publish" option located in the Home tab's ribbon to save your report to the Power BI service (online platform), as shown in the figure below.
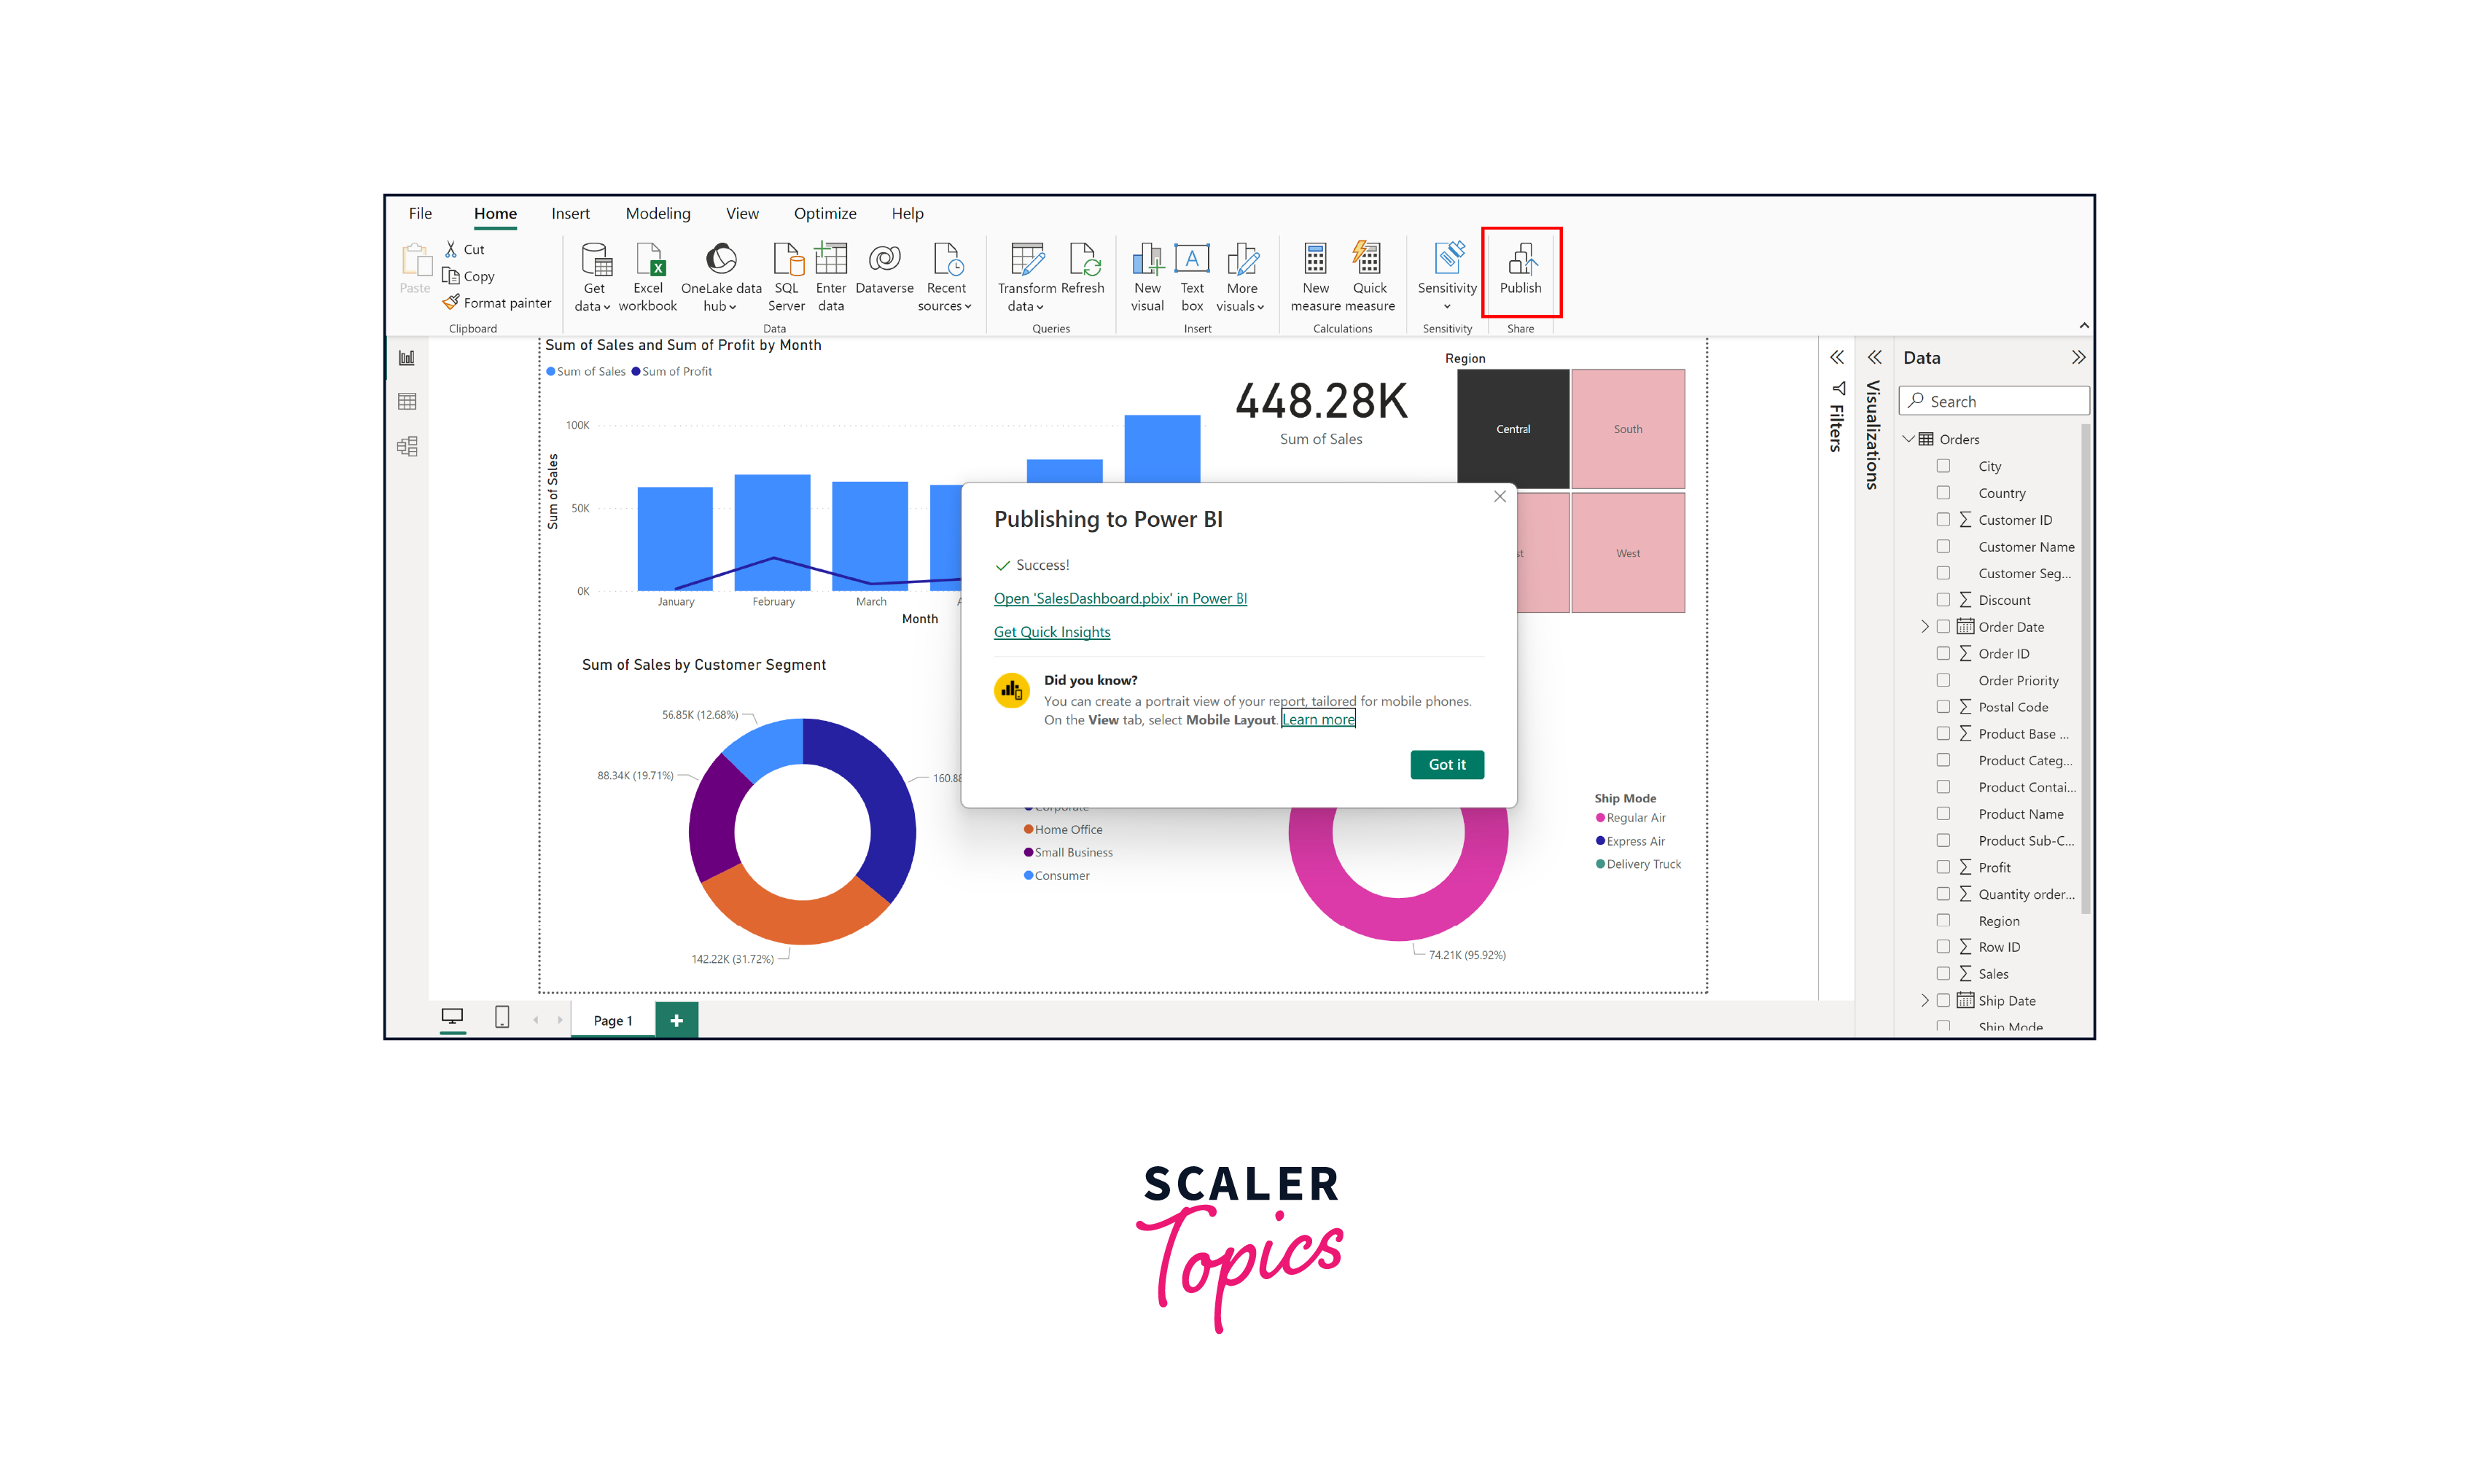
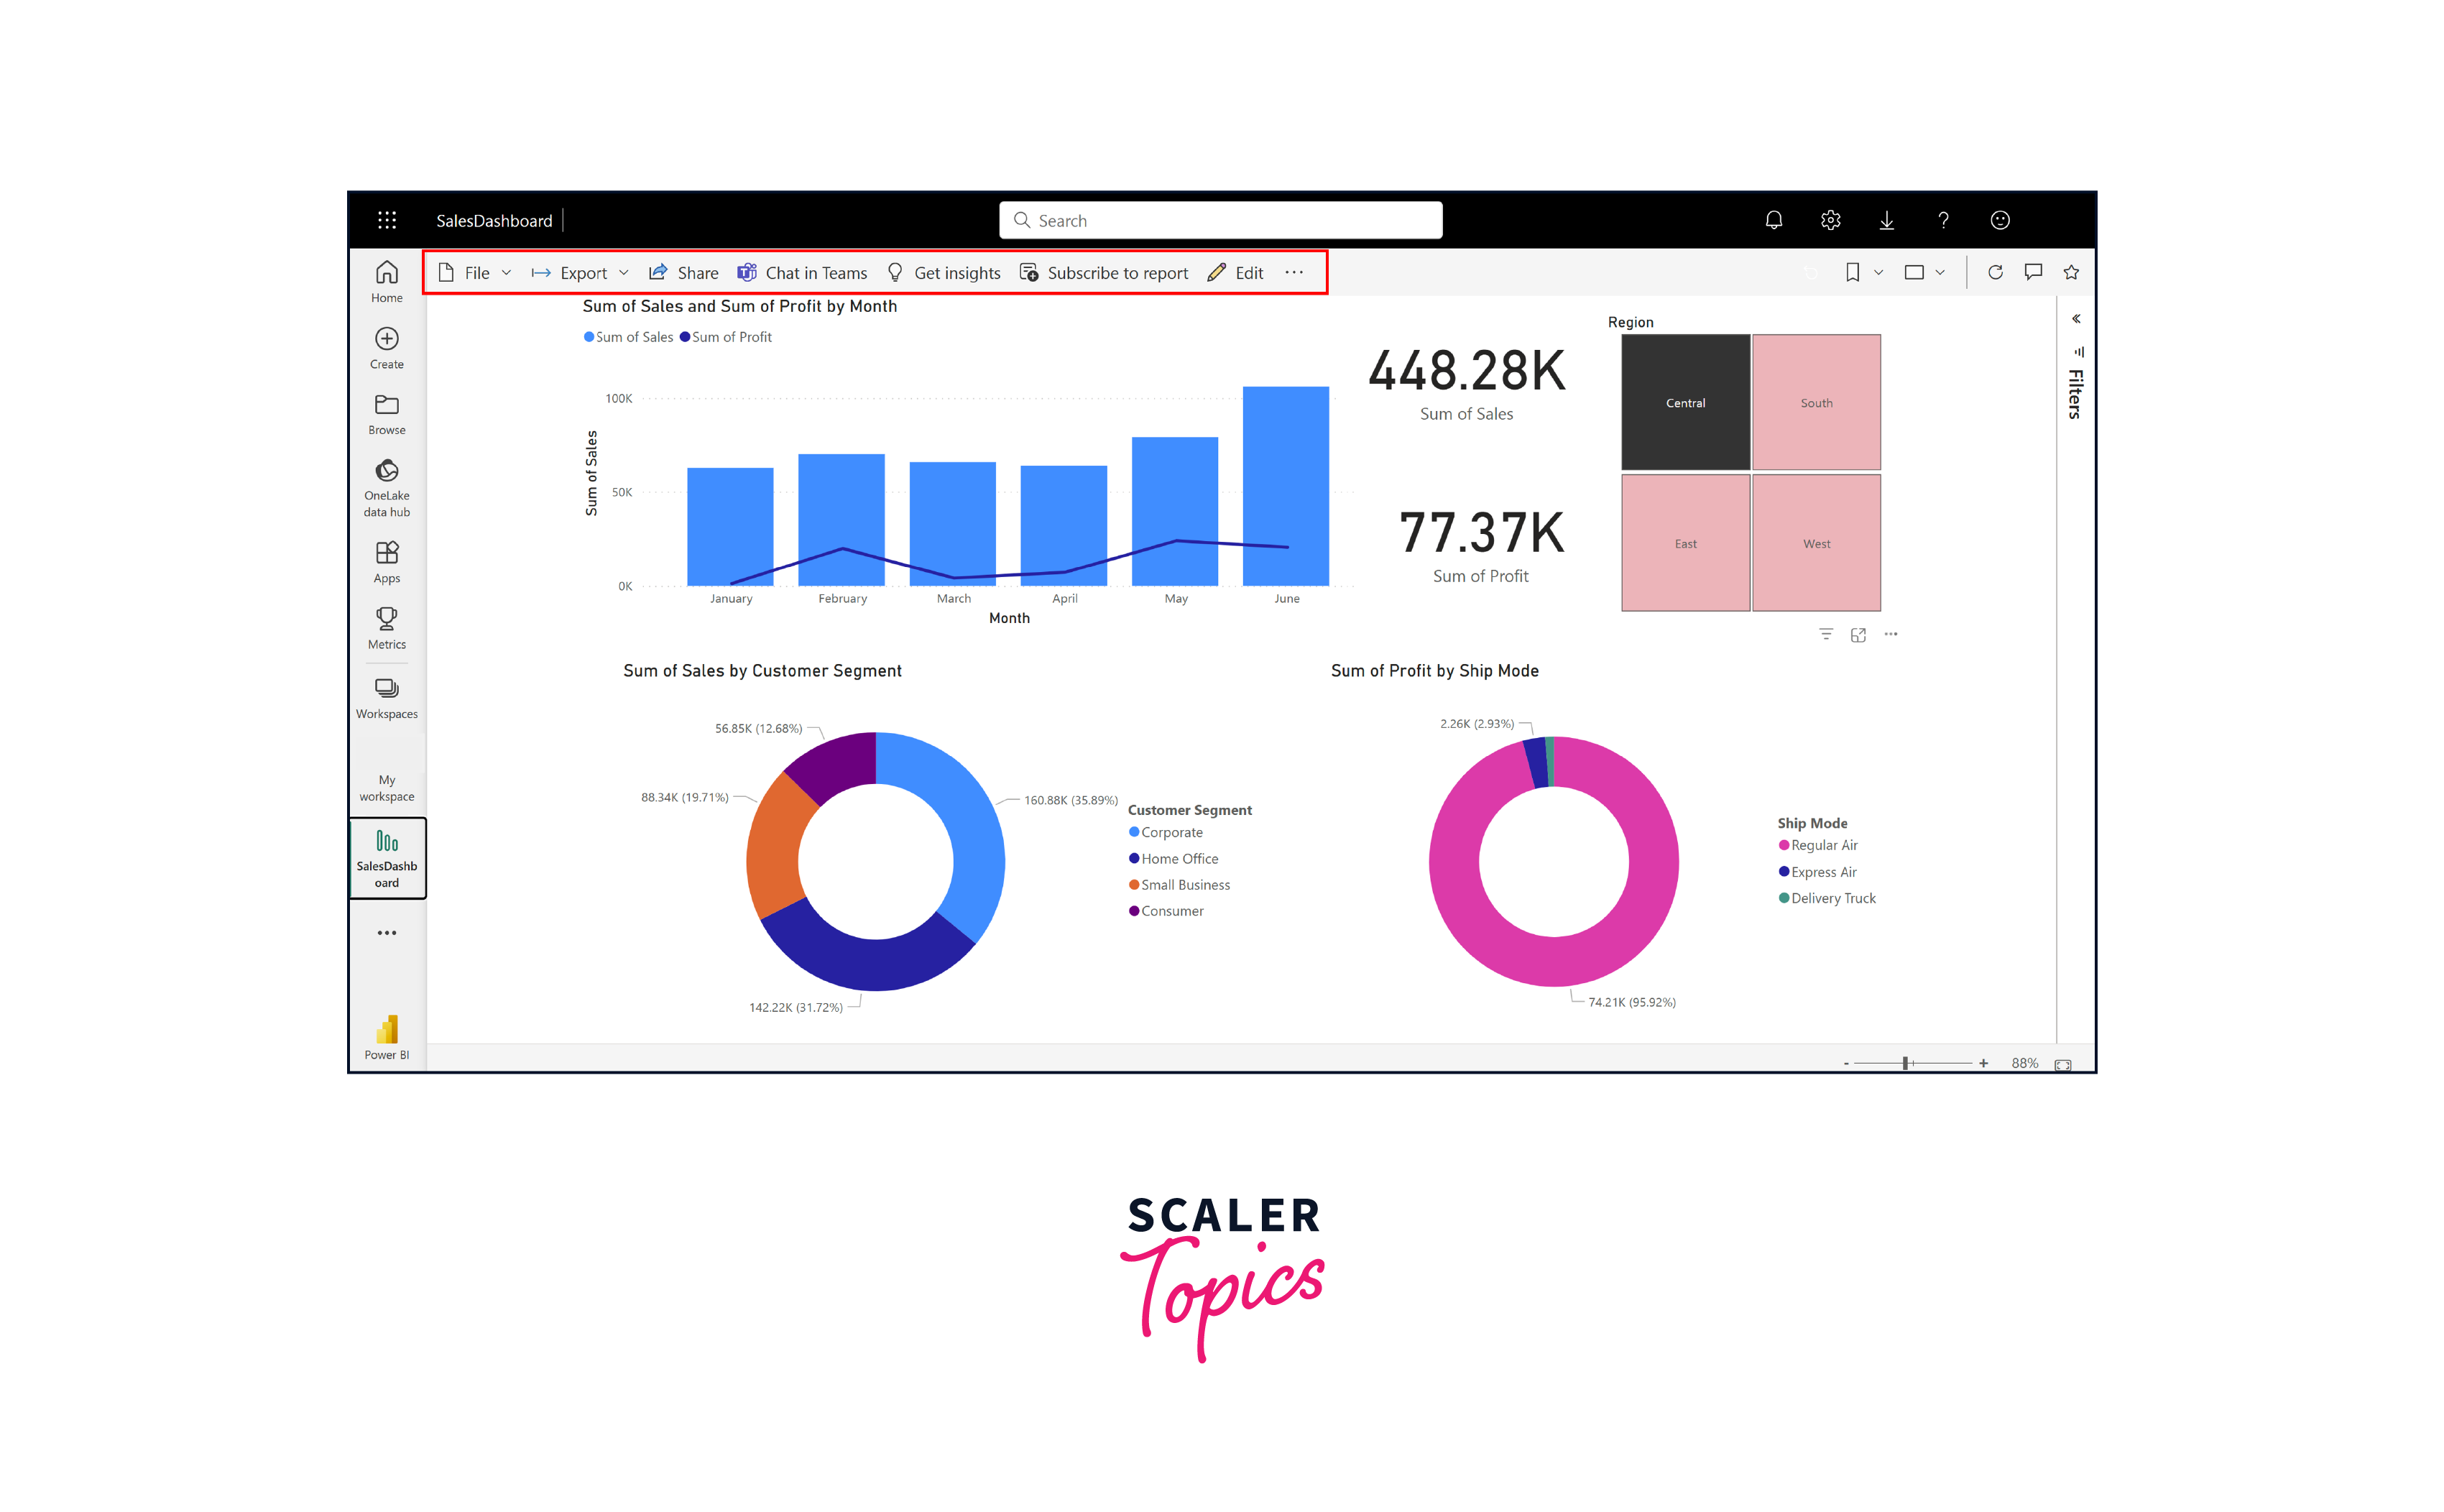
Step - 5:
By clicking the link shown in the above figure, it will redirect to your web browser, and you can access your dashboard in the Power BI service (online). Once there, you have the option to export the dashboard to formats such as PPTs, PDFs, etc., along with the ability to share it with colleagues and teams, as shown in the figure below.
Exploring the Features of Power BI Service
The Power BI Service offers a range of robust features that enhance the capabilities of your dashboards and reports, fostering efficient data analysis and collaboration. To access the Power BI Service, simply login to app.powerbi.com using your account credentials. Let's explore some of the key features that the Power BI Service brings to the table:
- App Workspaces:
Workspaces in Power BI Service are dedicated areas where you can organize, manage, and collaborate on reports, dashboards, and datasets. You can go to the Workspaces section to gain visibility into all your published reports, streamlining content management and collaboration. - Creating Dashboards:
You can customize the dashboard by pinning visualizations according to your specific requirements. - Web Accessibility:
You can access your Power BI dashboards and reports from any web-enabled device, promoting seamless collaboration and on-the-go insights. - Scheduled Refresh:
You can keep your data up-to-date by scheduling automatic refreshes, ensuring that your dashboards always reflect the latest information. - Publishing and Sharing:
You can easily publish your reports and Power BI dashboards to the Power BI Service, enabling secure sharing with stakeholders both inside and outside your organization. - Collaboration:
Power BI service enables real-time collaboration by allowing team members to edit and co-author reports, facilitating collective data analysis. - Q&A Natural Language Queries:
It allows you to utilize the power of natural language to interact with your data through the Q&A feature, generating insights without the need for complex queries. - Embedding and APIs:
You can integrate Power BI content into custom applications or websites using APIs, expanding the reach of your data insights.
Conclusion
- Power BI Dashboards distill complex data into visually intuitive representations, empowering users to extract actionable insights swiftly.
- Slicers, filters, and interactivity enhance data exploration, allowing users to delve deeper into trends and patterns.
- Power BI Service enables seamless collaboration and easy accessibility to dashboards, fostering teamwork and informed discussions.
- You can tailor your dashboards to fit your needs, from visual aesthetics to data organization, ensuring your insights align with your goals.
- By harnessing the power of Power BI Dashboards, you equip yourself with a valuable tool to make data-driven decisions that can shape the future of your organization.