Data Transformation in Power BI
Overview
In the ever-evolving data analytics landscape, Power BI stands out as a powerful tool for business intelligence. One of its key strengths lies in its ability to transform raw data into actionable insights. In this article, we'll explore the vital Power BI data transformation process, diving into its significance, methods, and best practices. In this blog, we'll guide you through the steps to harness the full potential of your data and drive your decision-making processes.
What is Power BI Power Query Editor?
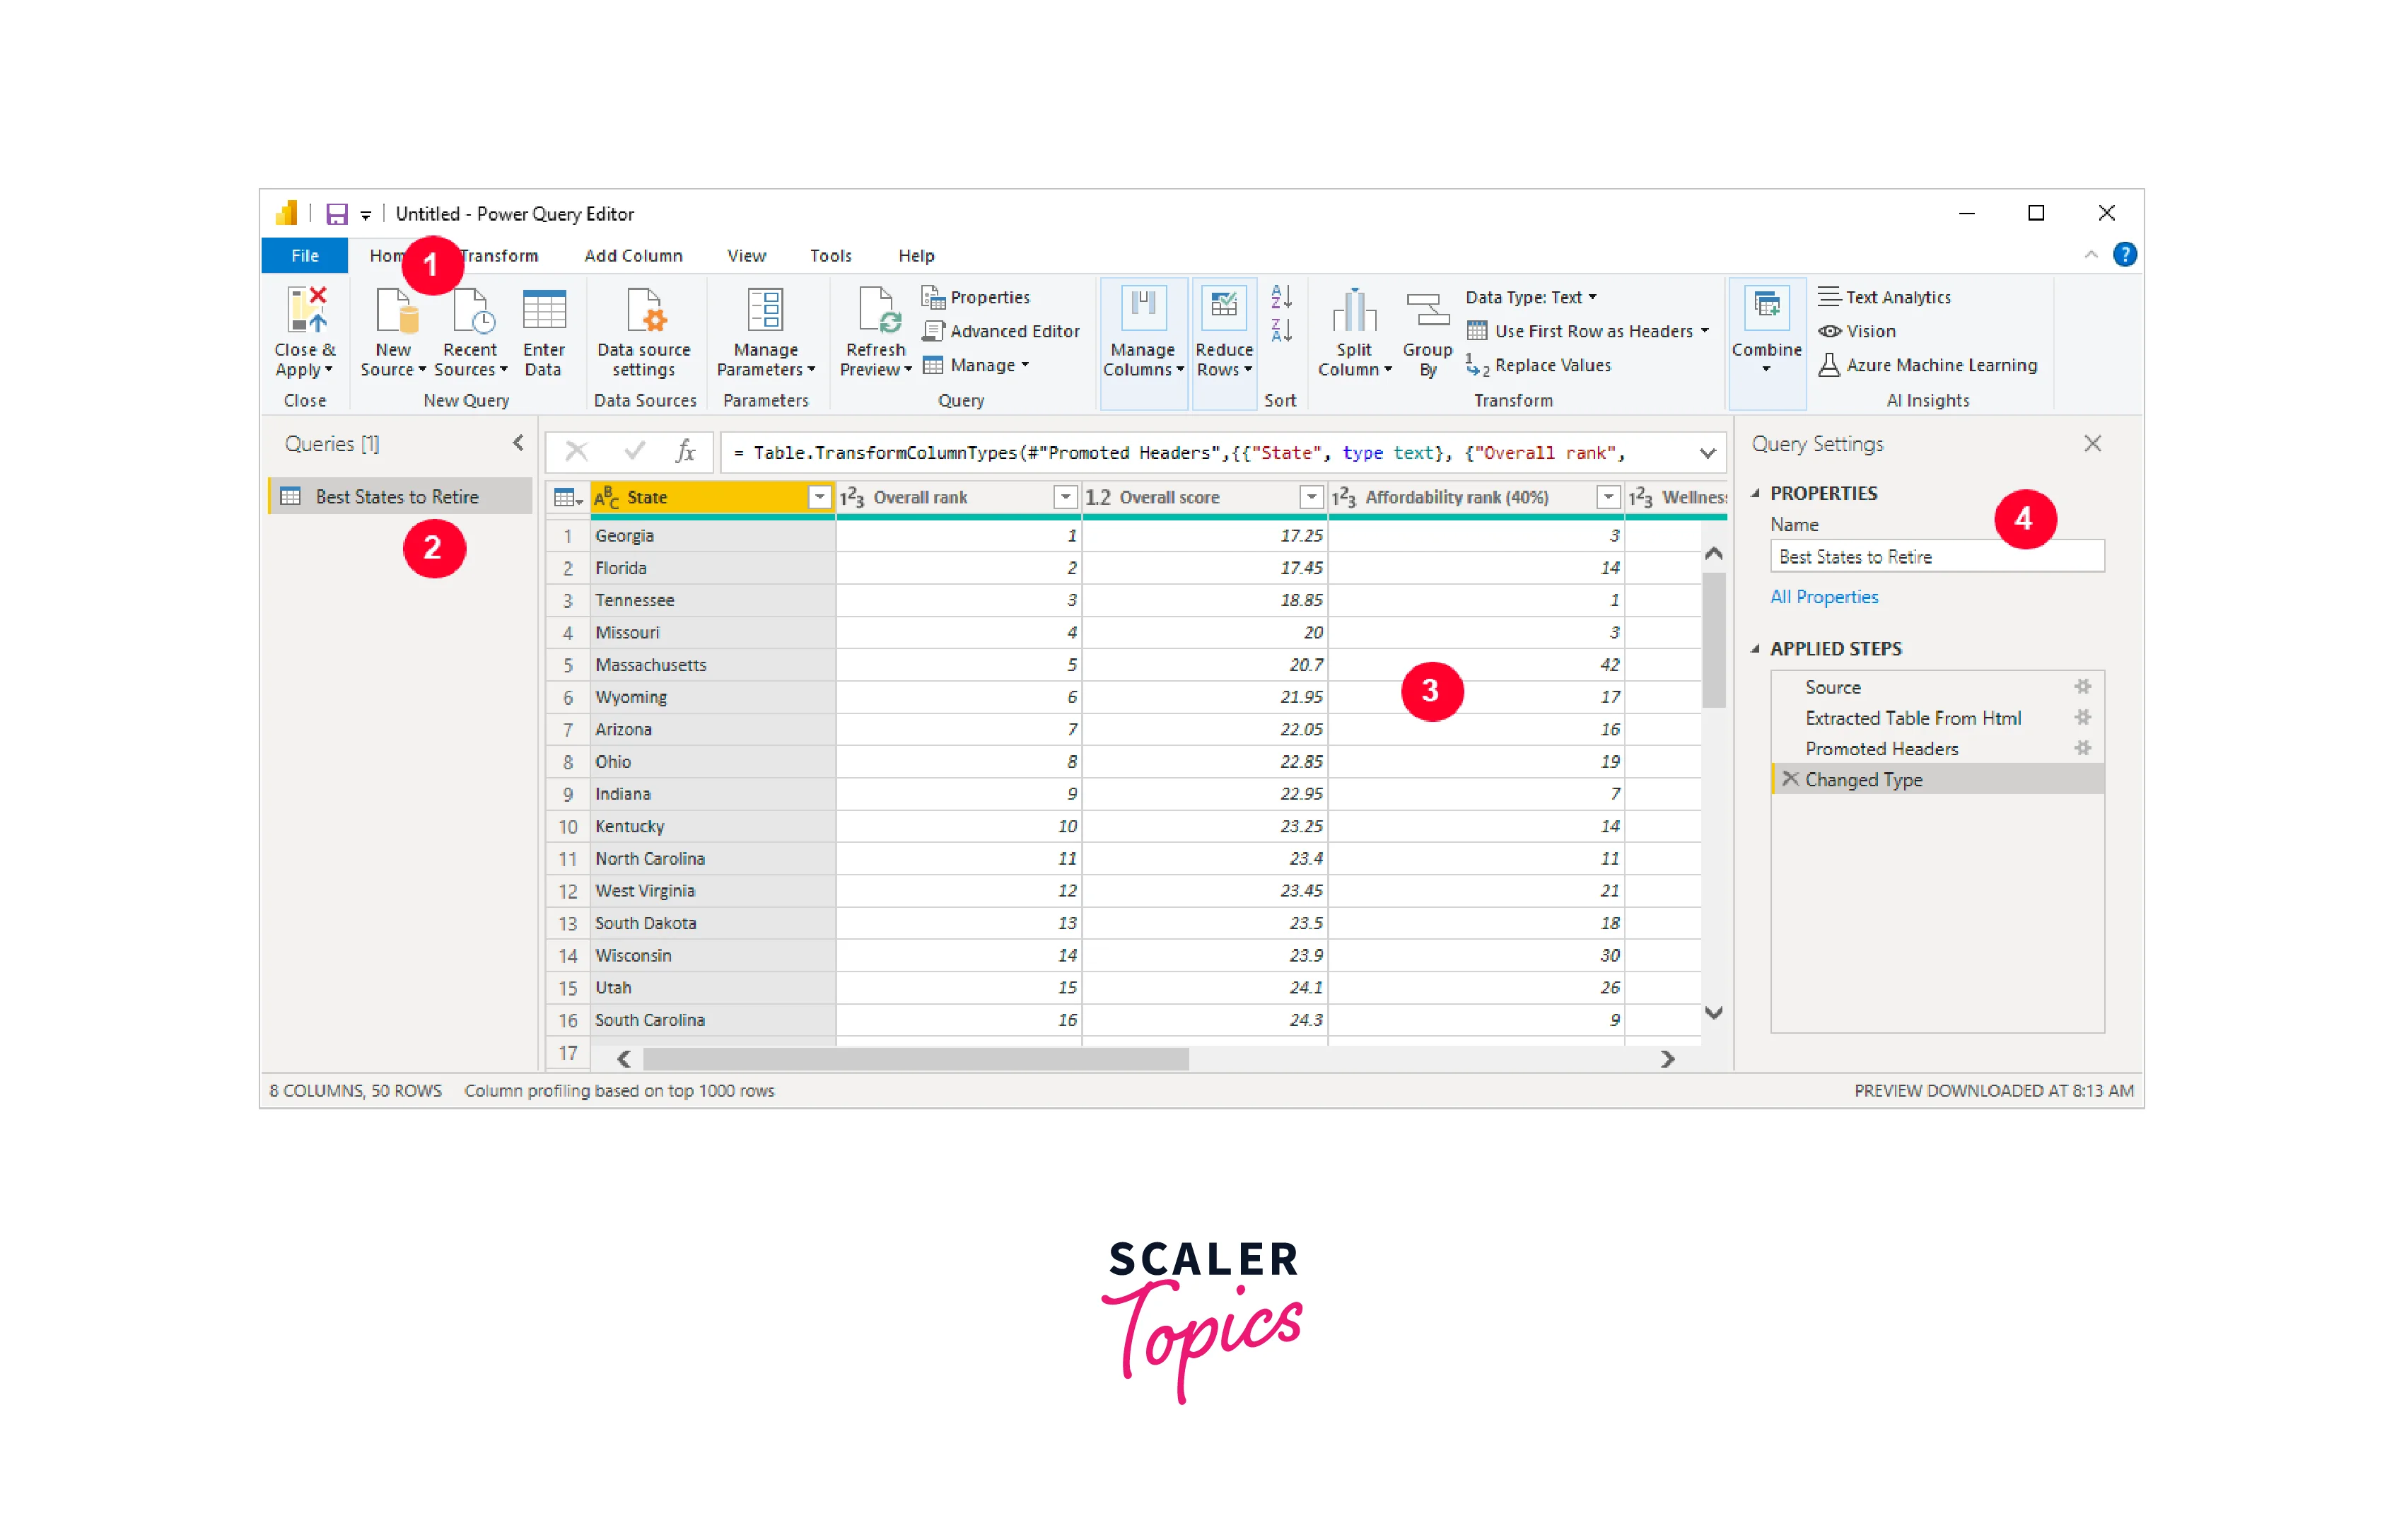
Power Query Editor is the data transformation and manipulation tool within Microsoft Power BI, an integral part of the Power BI ecosystem. It serves as the gateway to accessing, cleaning, and shaping data from diverse sources before it's visualized in Power BI reports and dashboards.
Power Query Editor empowers users with a user-friendly visual interface to perform a wide range of data transformation tasks. It offers a comprehensive set of tools, from removing duplicates and handling missing values to merging tables and creating calculated columns. Its ability to seamlessly work with data from various sources like databases, spreadsheets, cloud services, and web APIs sets it apart.
It's important to note that any alterations made in the Query Editor do not directly impact the original dataset. After you've completed the necessary data preprocessing and shaped it to your desired format, you can seamlessly import the transformed data into the Power BI environment for further analysis and visualization.
Need to Transform Data in Power BI
In essence, Power BI data transformation is the key to turning raw data into actionable insights. Transforming data in Power BI is crucial for several reasons, as mentioned below:
- Data Quality:
It helps clean and enhance data quality by handling missing values, removing duplicates, and correcting errors. - Data Integration:
It allows you to combine data from various sources, enabling comprehensive analysis. - Customization:
You can tailor data to specific business needs, creating calculated columns, aggregations, and custom measures. - Performance:
Data transformation optimizes data models, improving query and report performance.
How to Transform Power BI Data?
After importing data into Power BI Query Editor, the transformation steps discussed in this section can be executed in any sequence. To bring data into the query editor, you can follow the steps mentioned below:
Step - 1:
To access data from various platforms, navigate to the "Home" tab on the ribbon section and select "Get Data". This will present you with multiple data source options to choose from.

Step - 2:
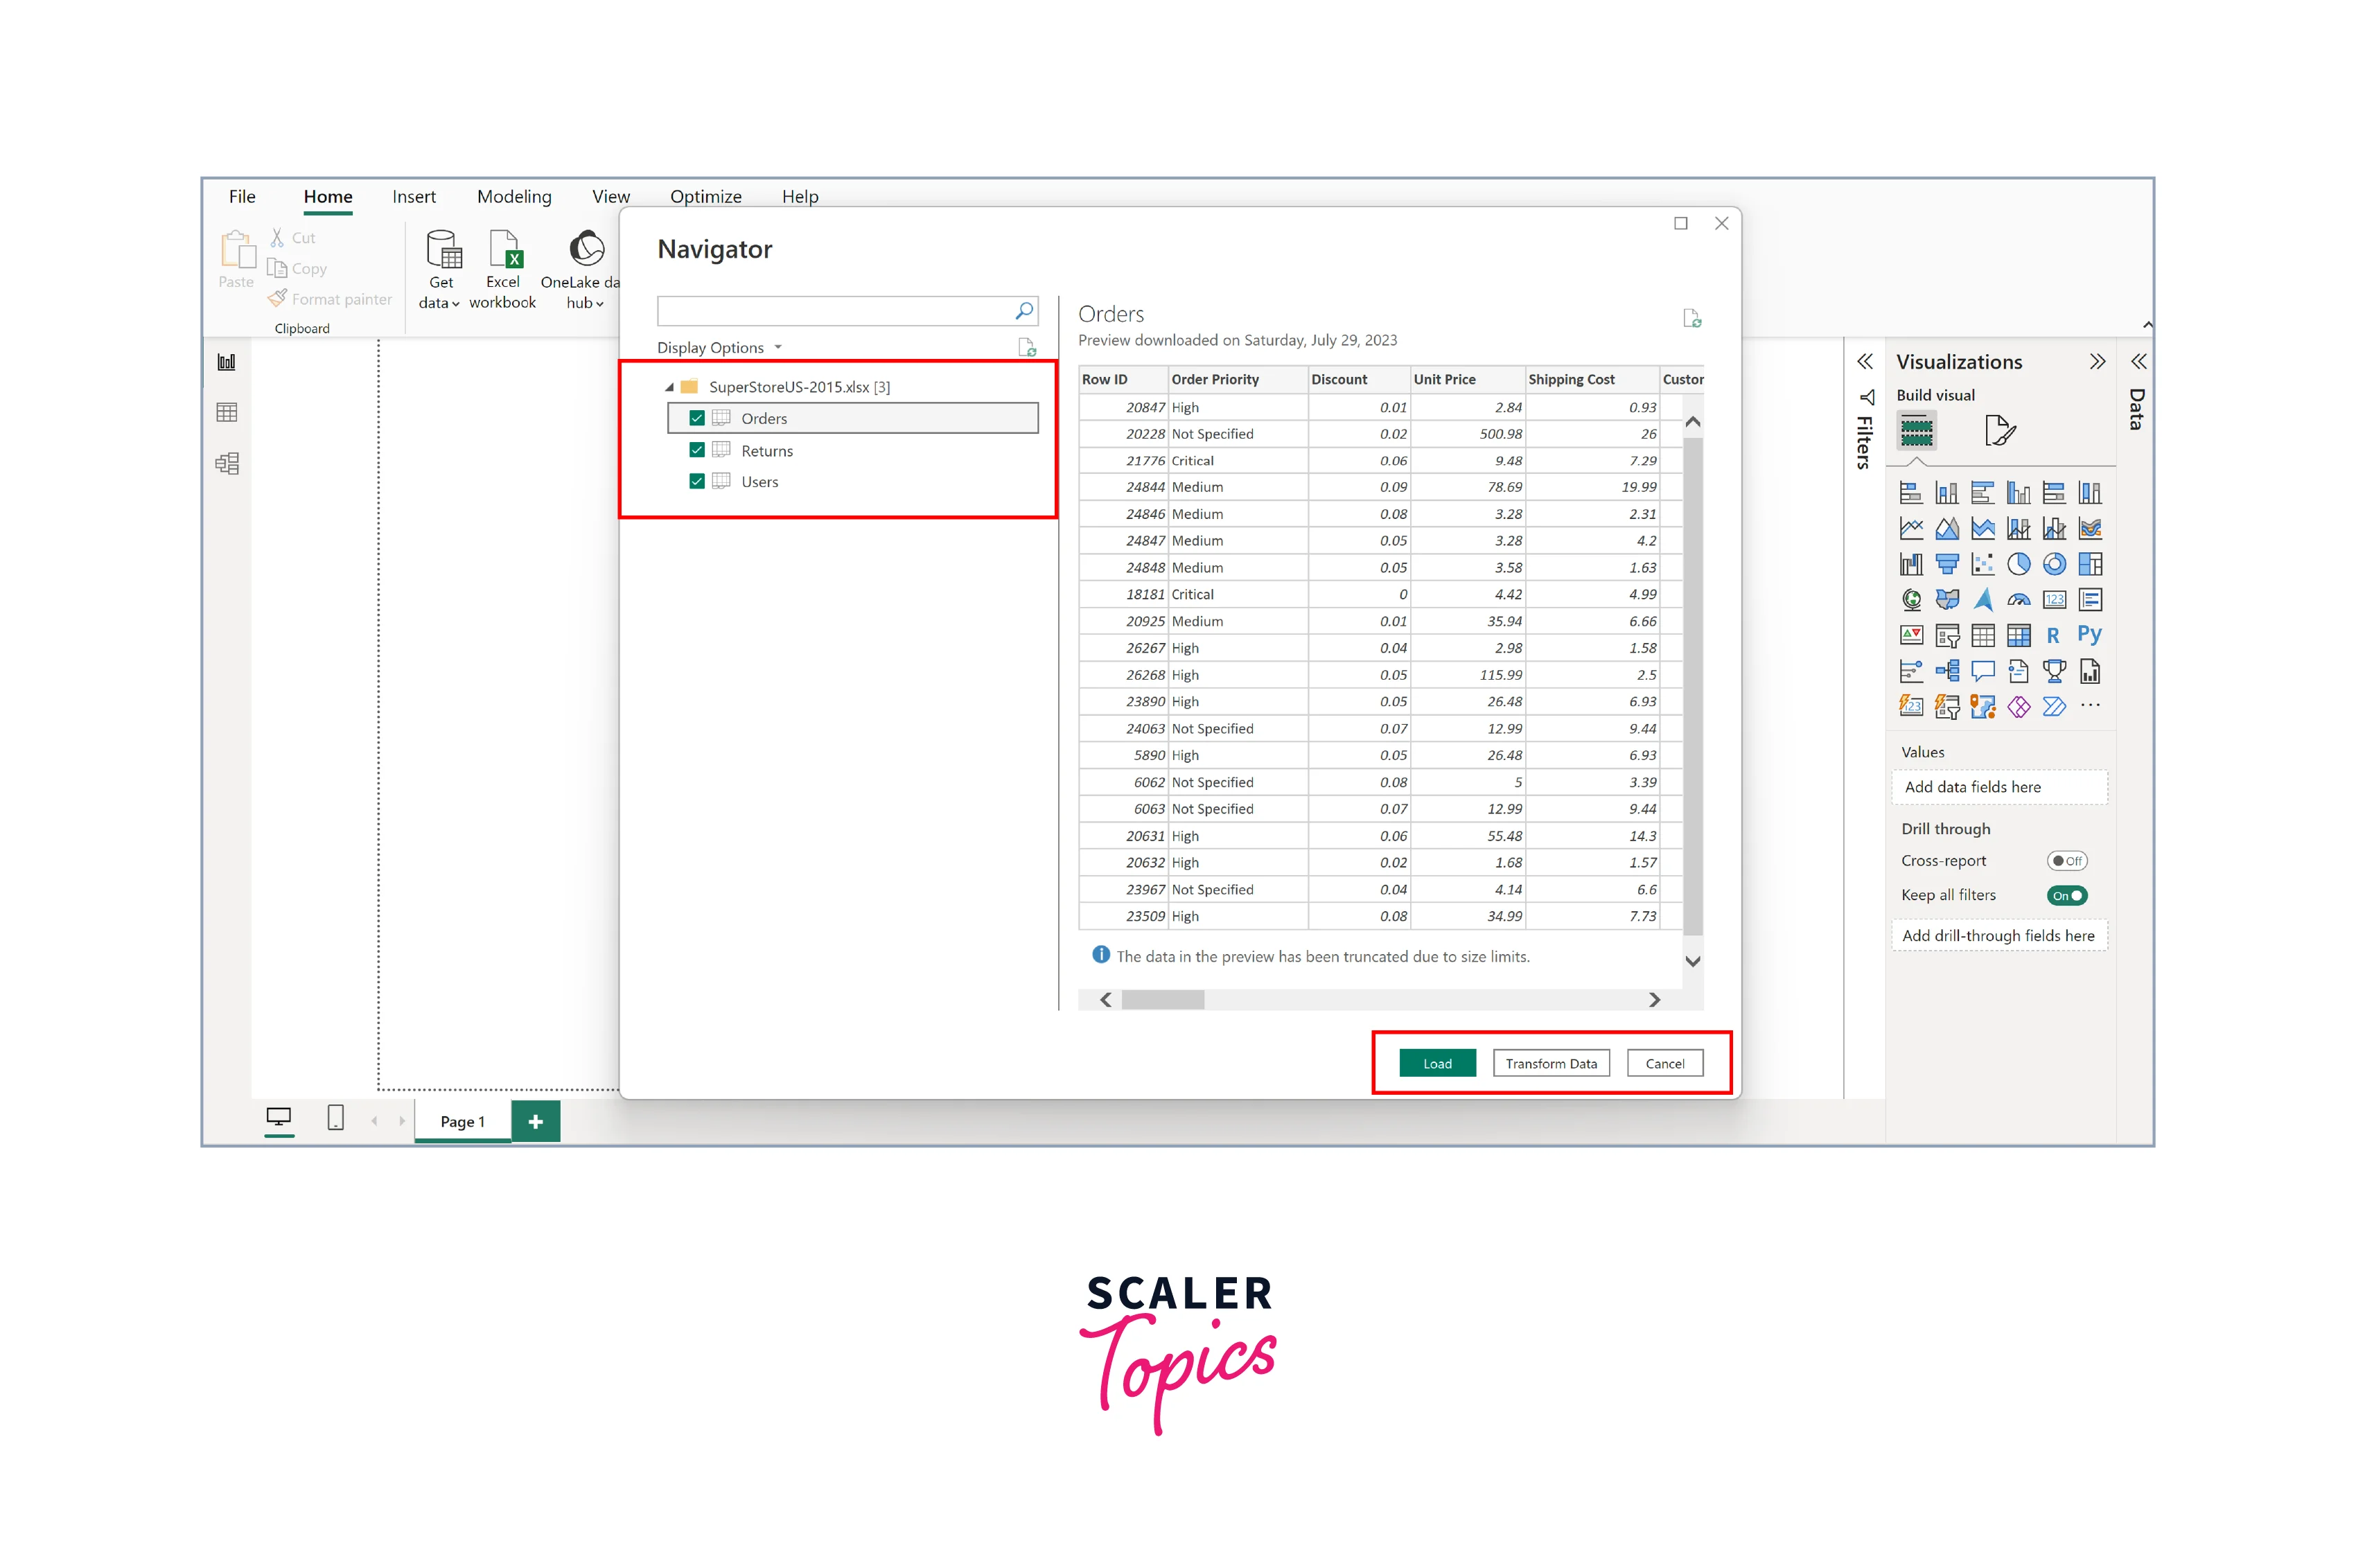
Select "Excel" to initiate a window where you can locate the specific file you want to upload from your device. Following this, on the Navigator page, you can choose the datasheets you want to load by checking the relevant boxes. To perform Power BI data transformation, click "Transform Data". Alternatively, you can simply click "Load" to upload the file without applying any transformations.
Step - 3:
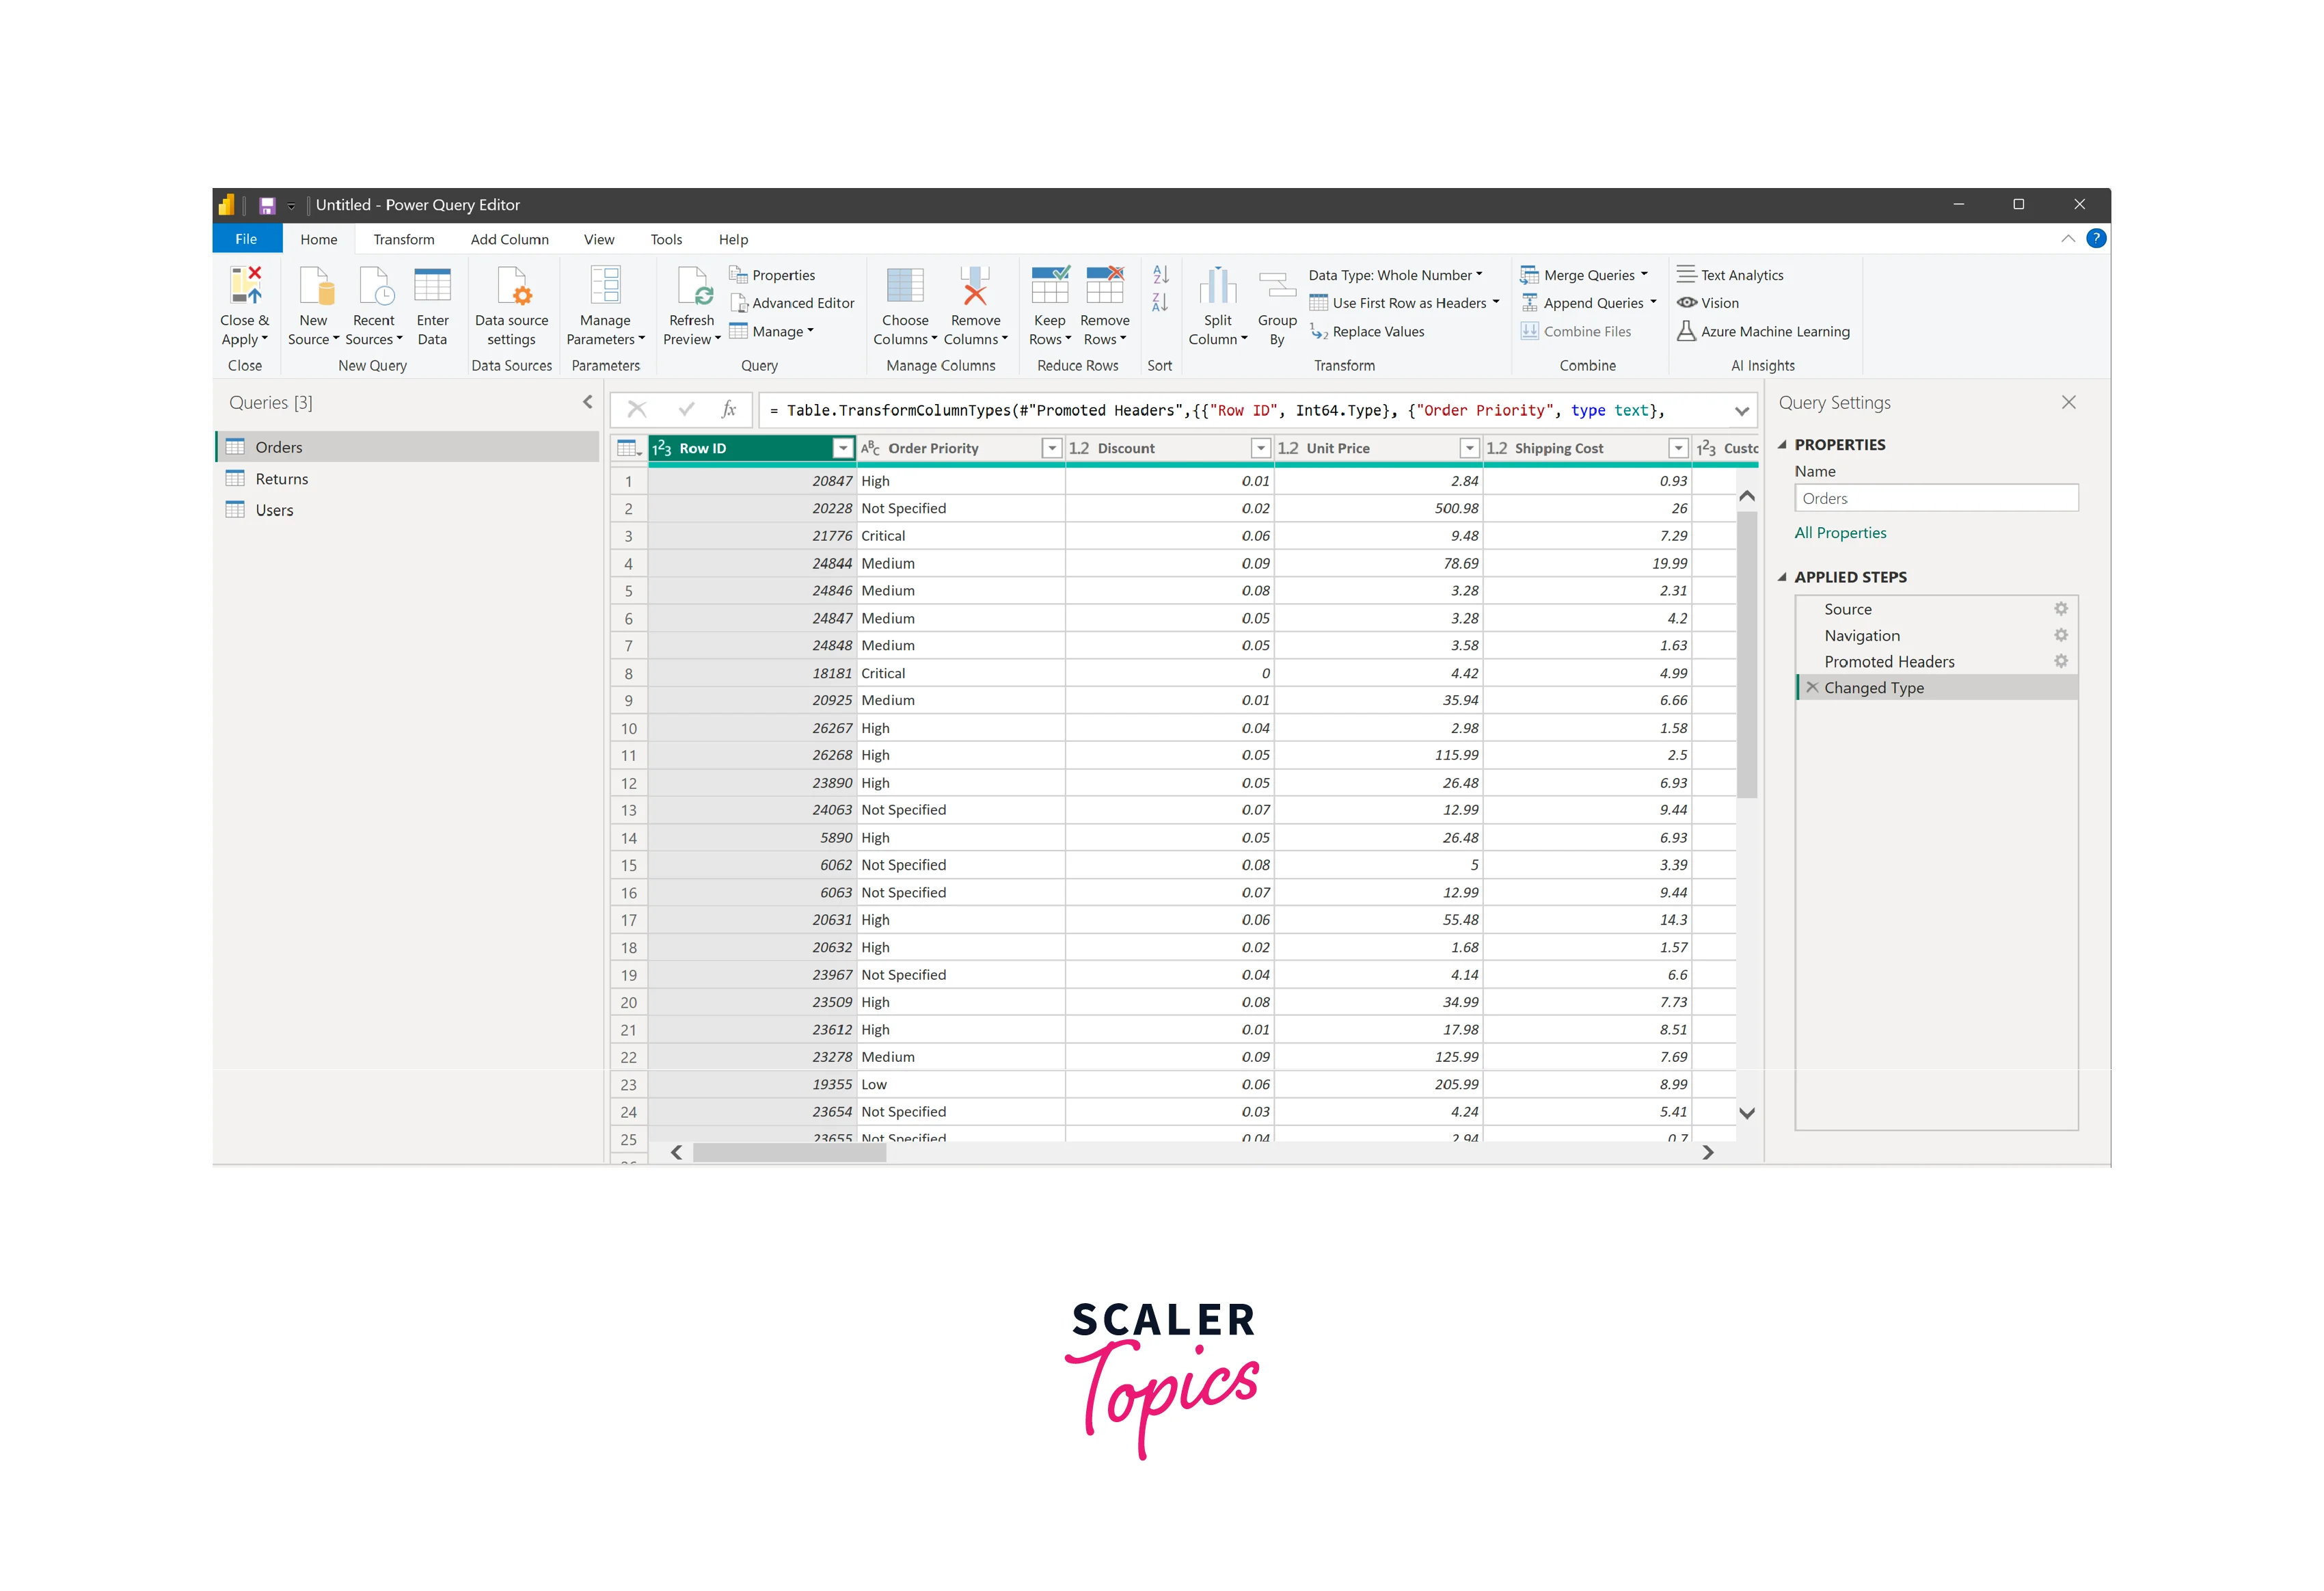
Selecting "Transform Data" leads you to another window, referred to as the Power BI Power Query Editor, for data transformation and cleansing.
How to Perform Renaming Operations in Power BI?
-
Renaming Tables or Data Sources in Power BI:
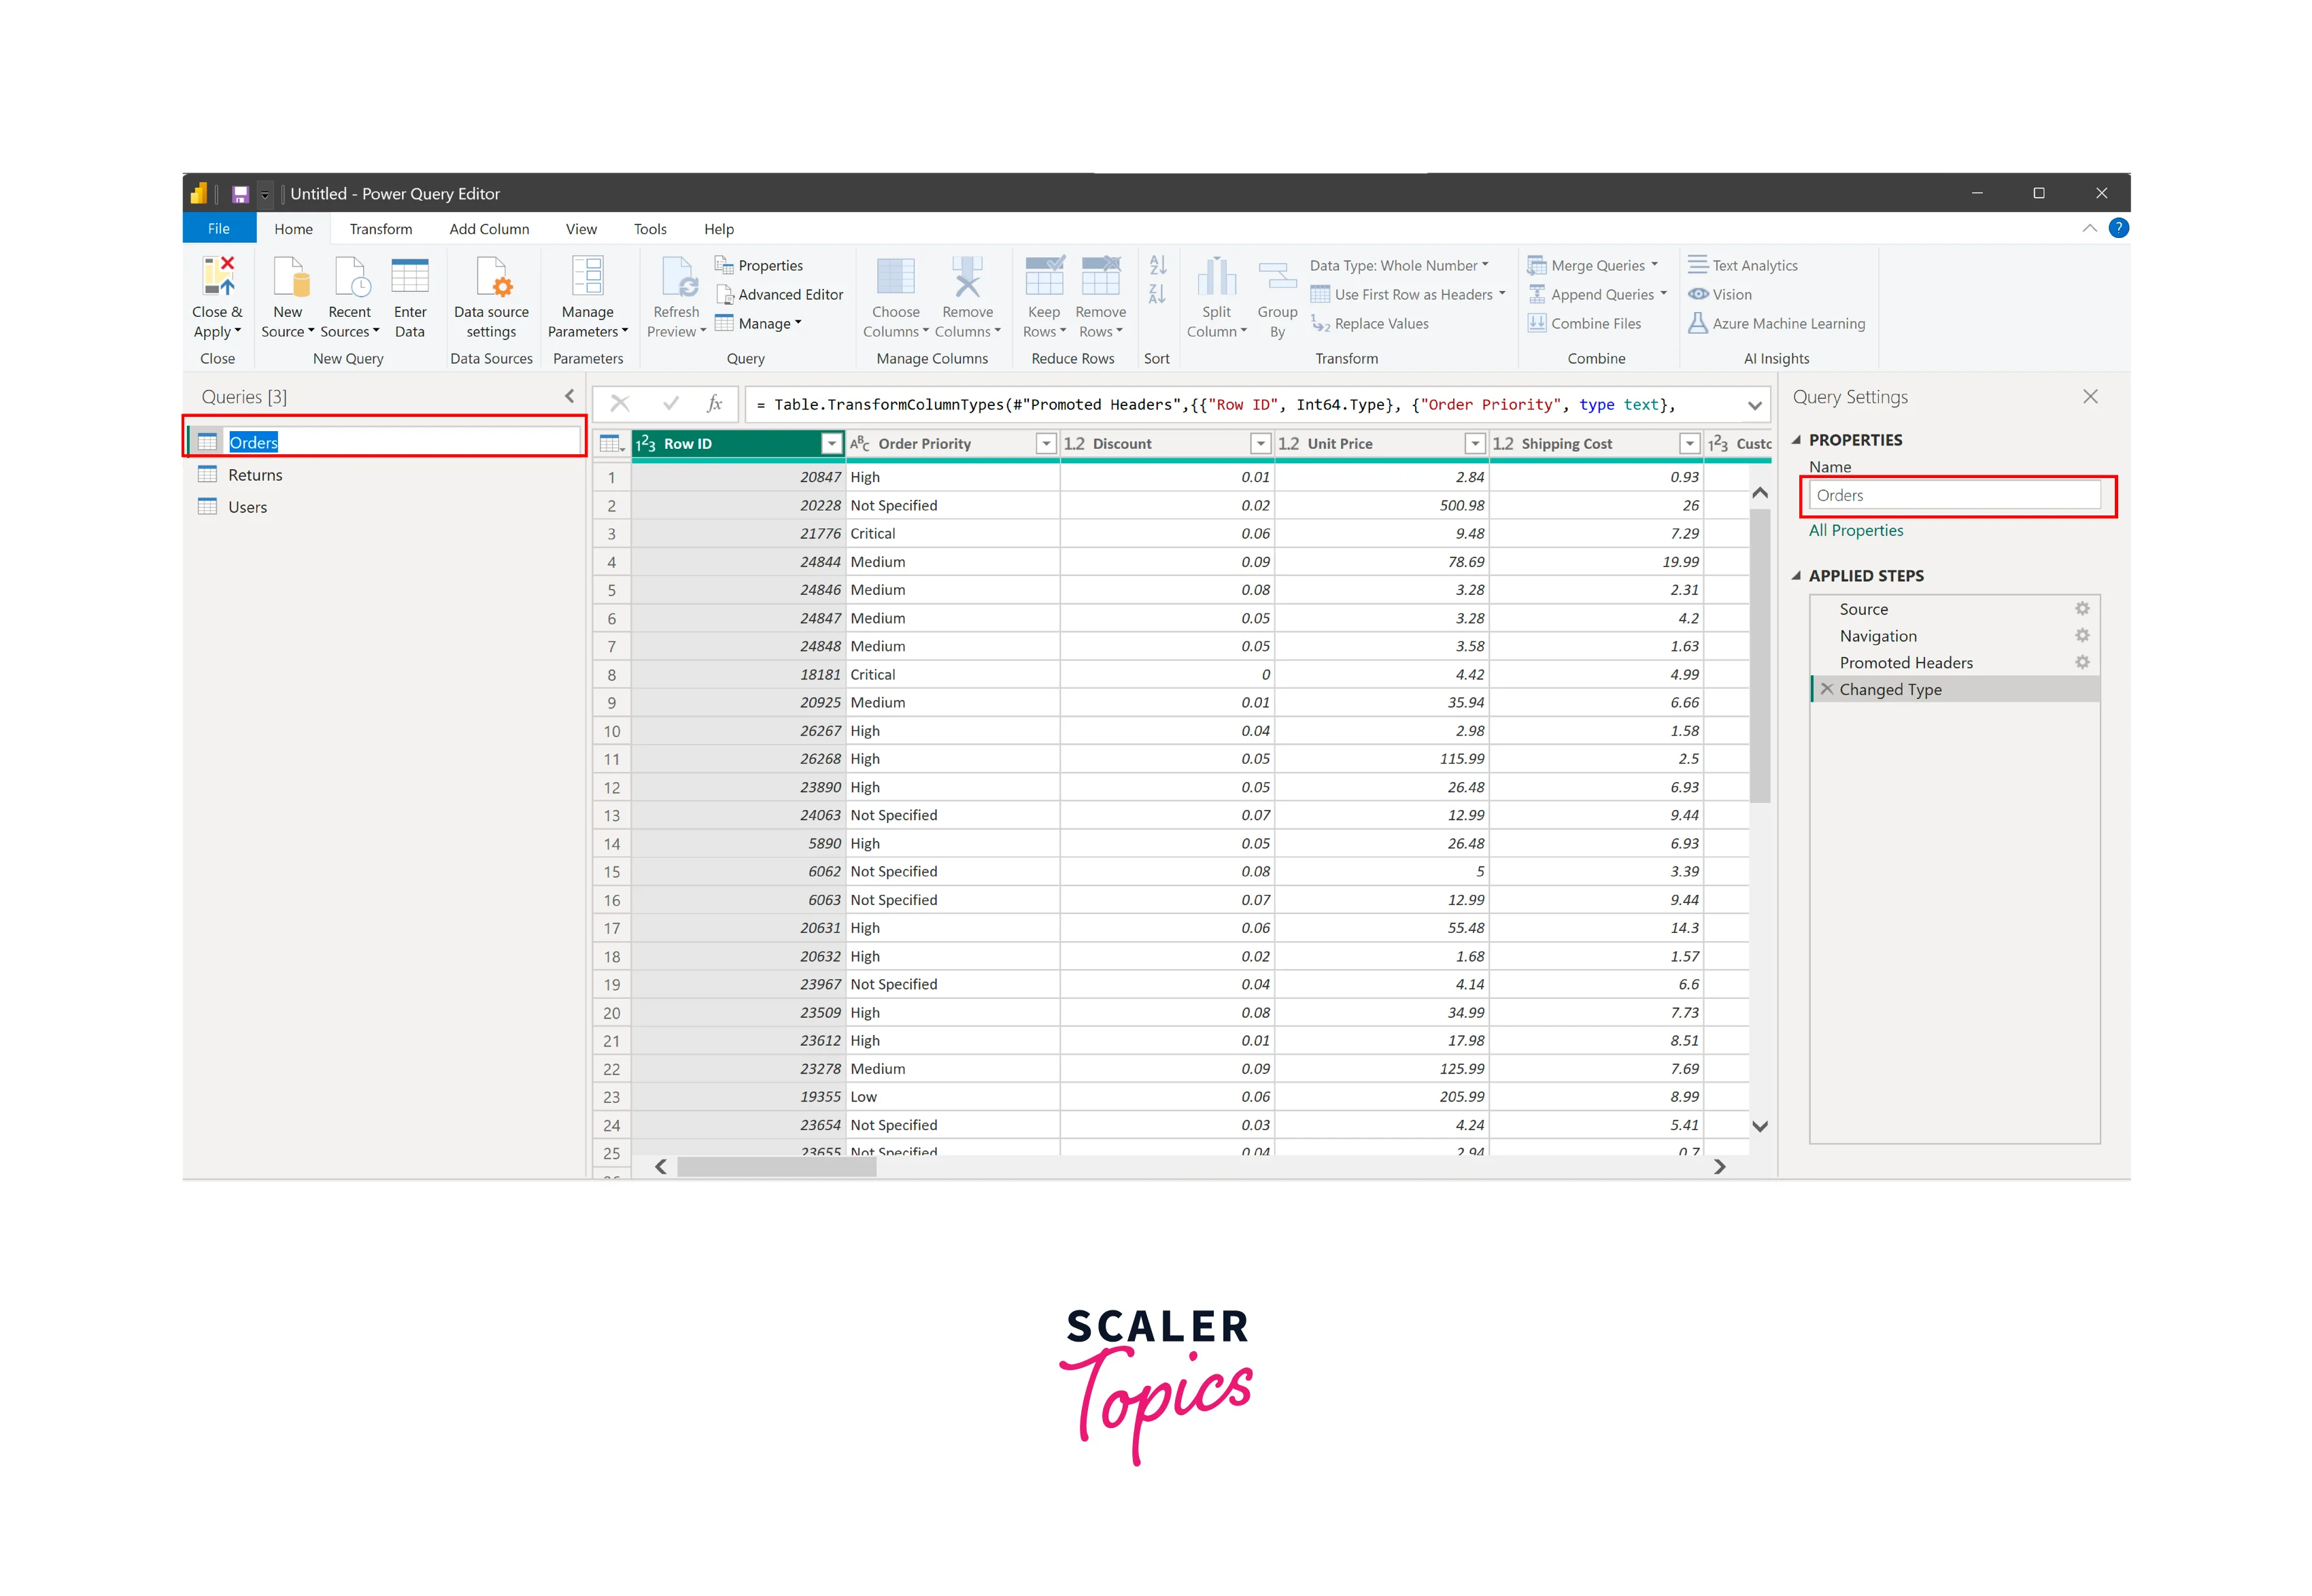
On the left corner of the Power BI Query Editor window, you'll find the "Queries" option. In this section, different data sources are displayed, initially with their default file names. For instance, when loading an SQL table, the table's name is listed, and for Excel files, the file name appears.
Managing multiple data sources within a single Power BI Transform Data instance can become challenging. In such cases, you can easily rename a data source by double-clicking on it and specifying your preferred name. You also have the option to change the table's name from the properties section on the right side or by right-clicking on the table and selecting "rename".
-
Renaming Power BI Columns:
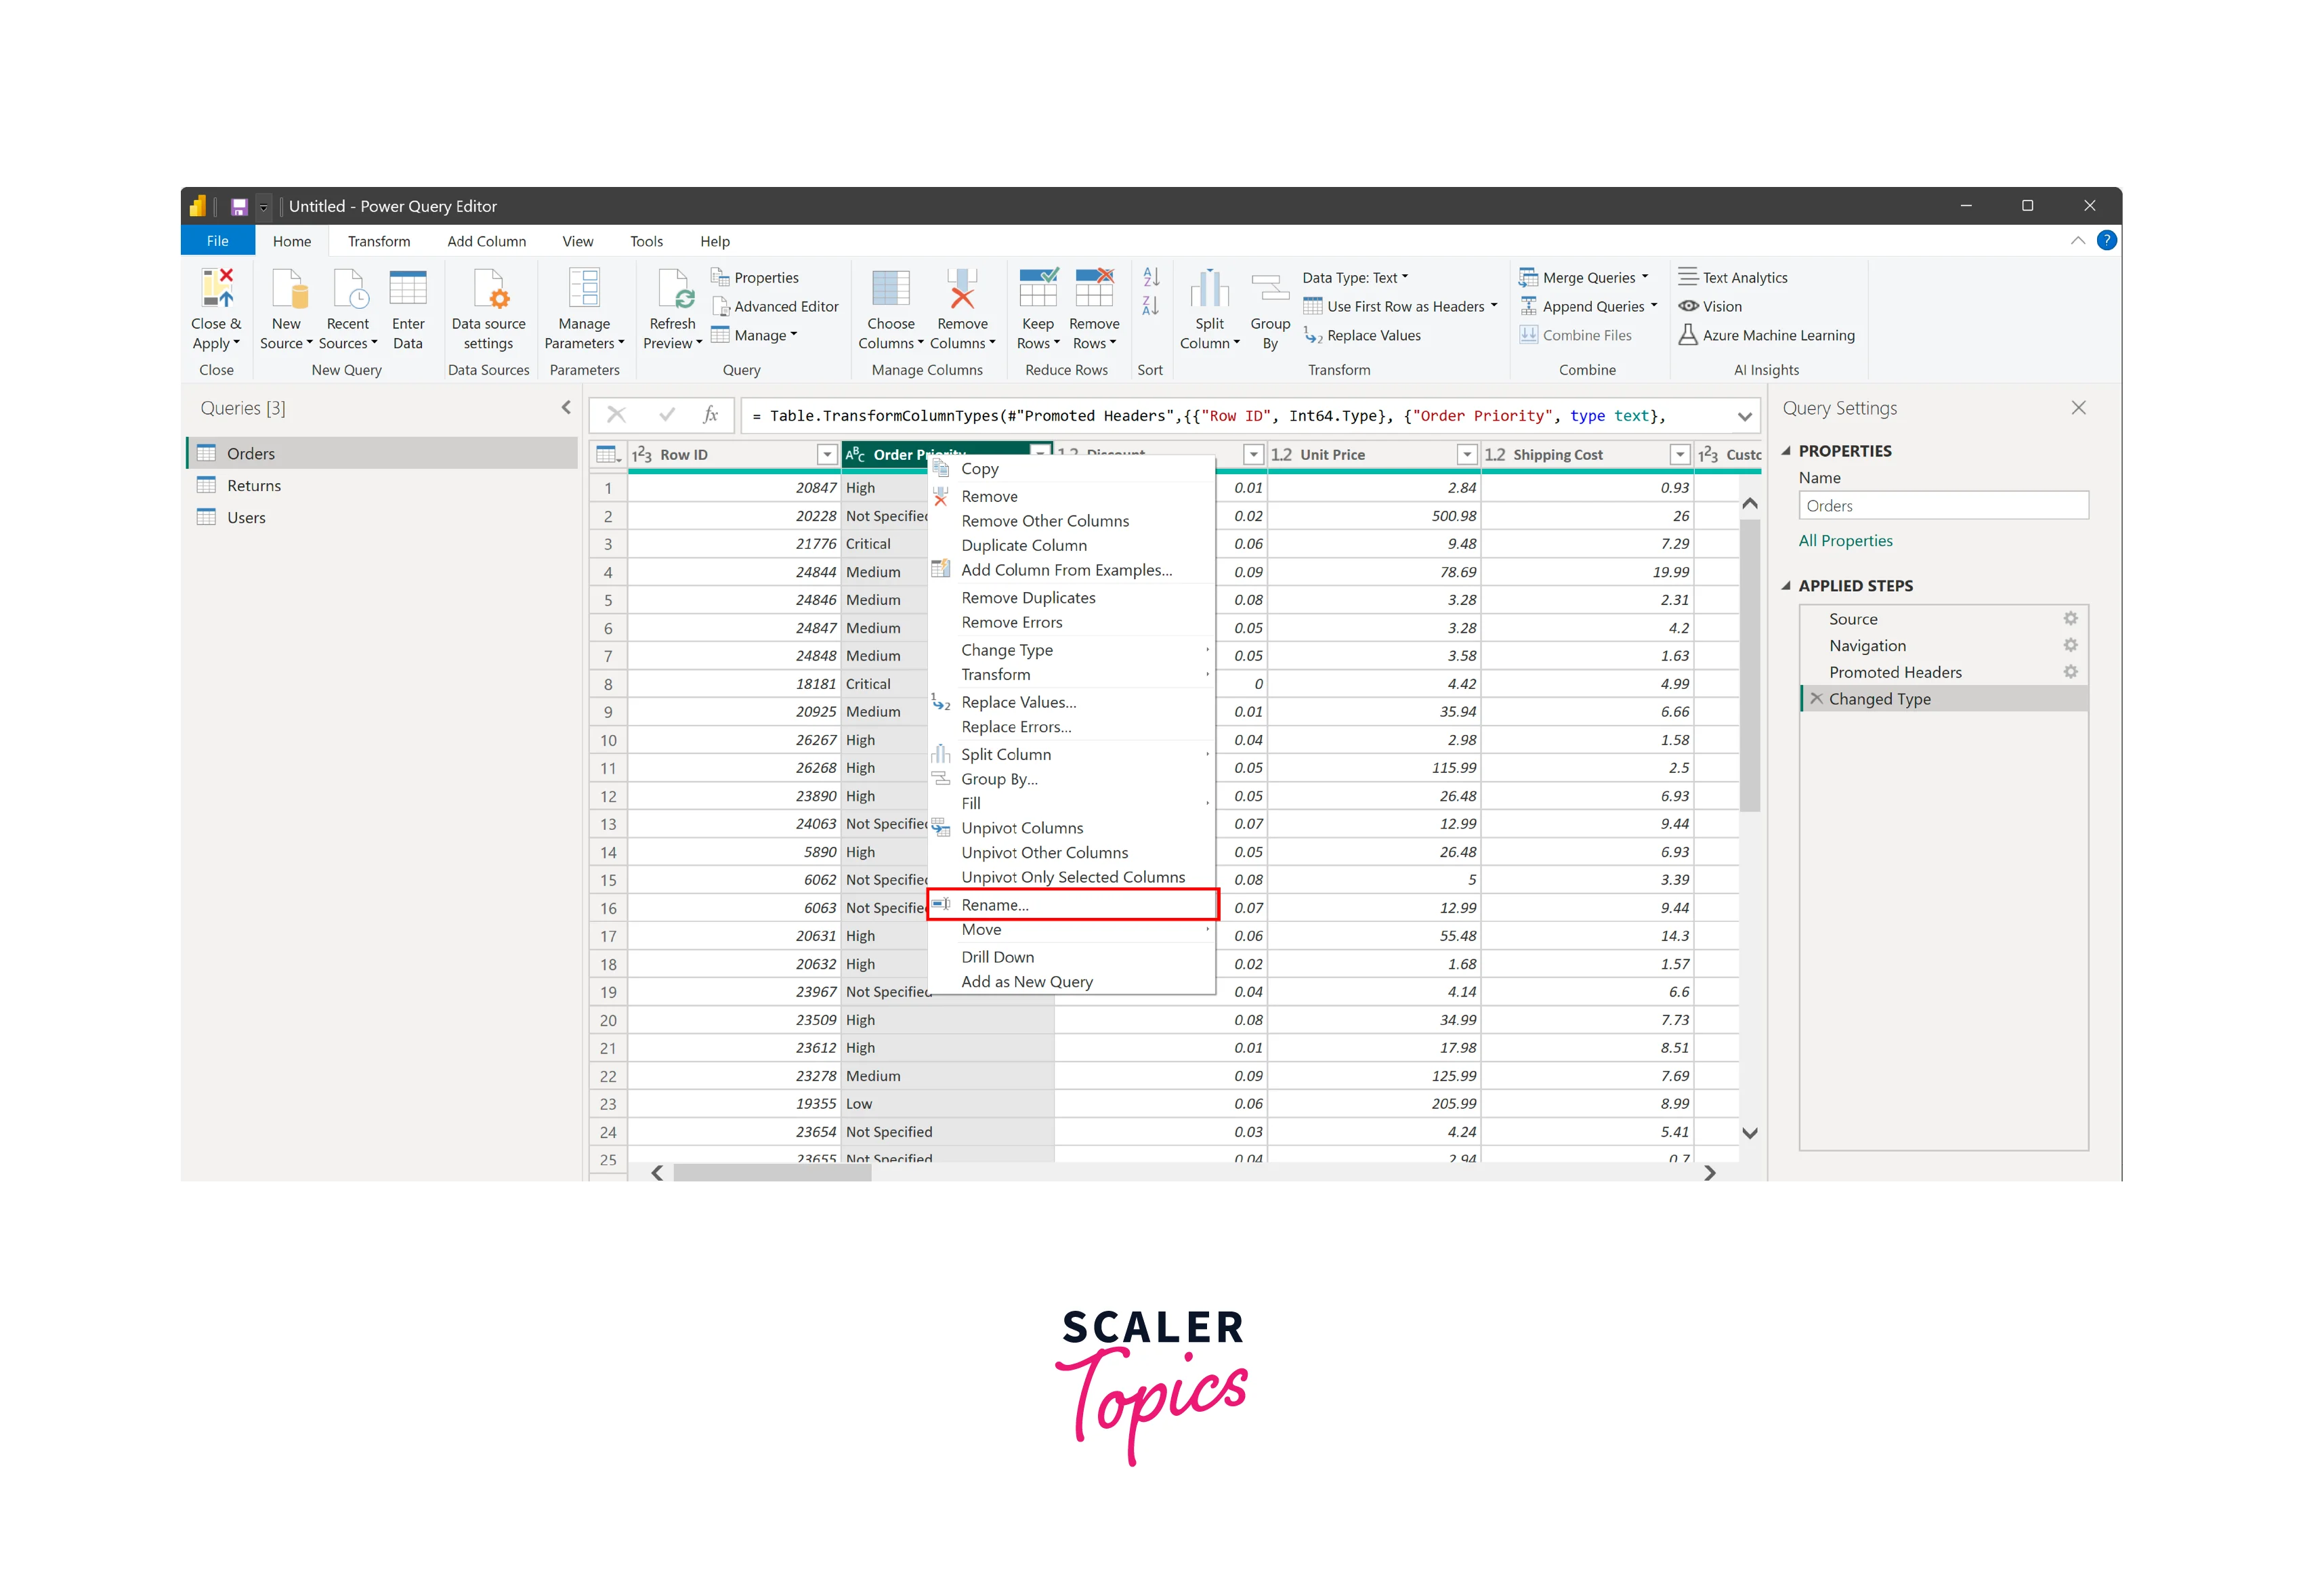
In Power BI's Transform Data, renaming a column header is straightforward. Simply double-click on the column heading, then replace it with a new name. Alternatively, you can right-click on the column and choose "rename" to achieve the same result.
How to Perform Removal Operations in Power BI?
-
Removing Columns & Rows in Power BI:
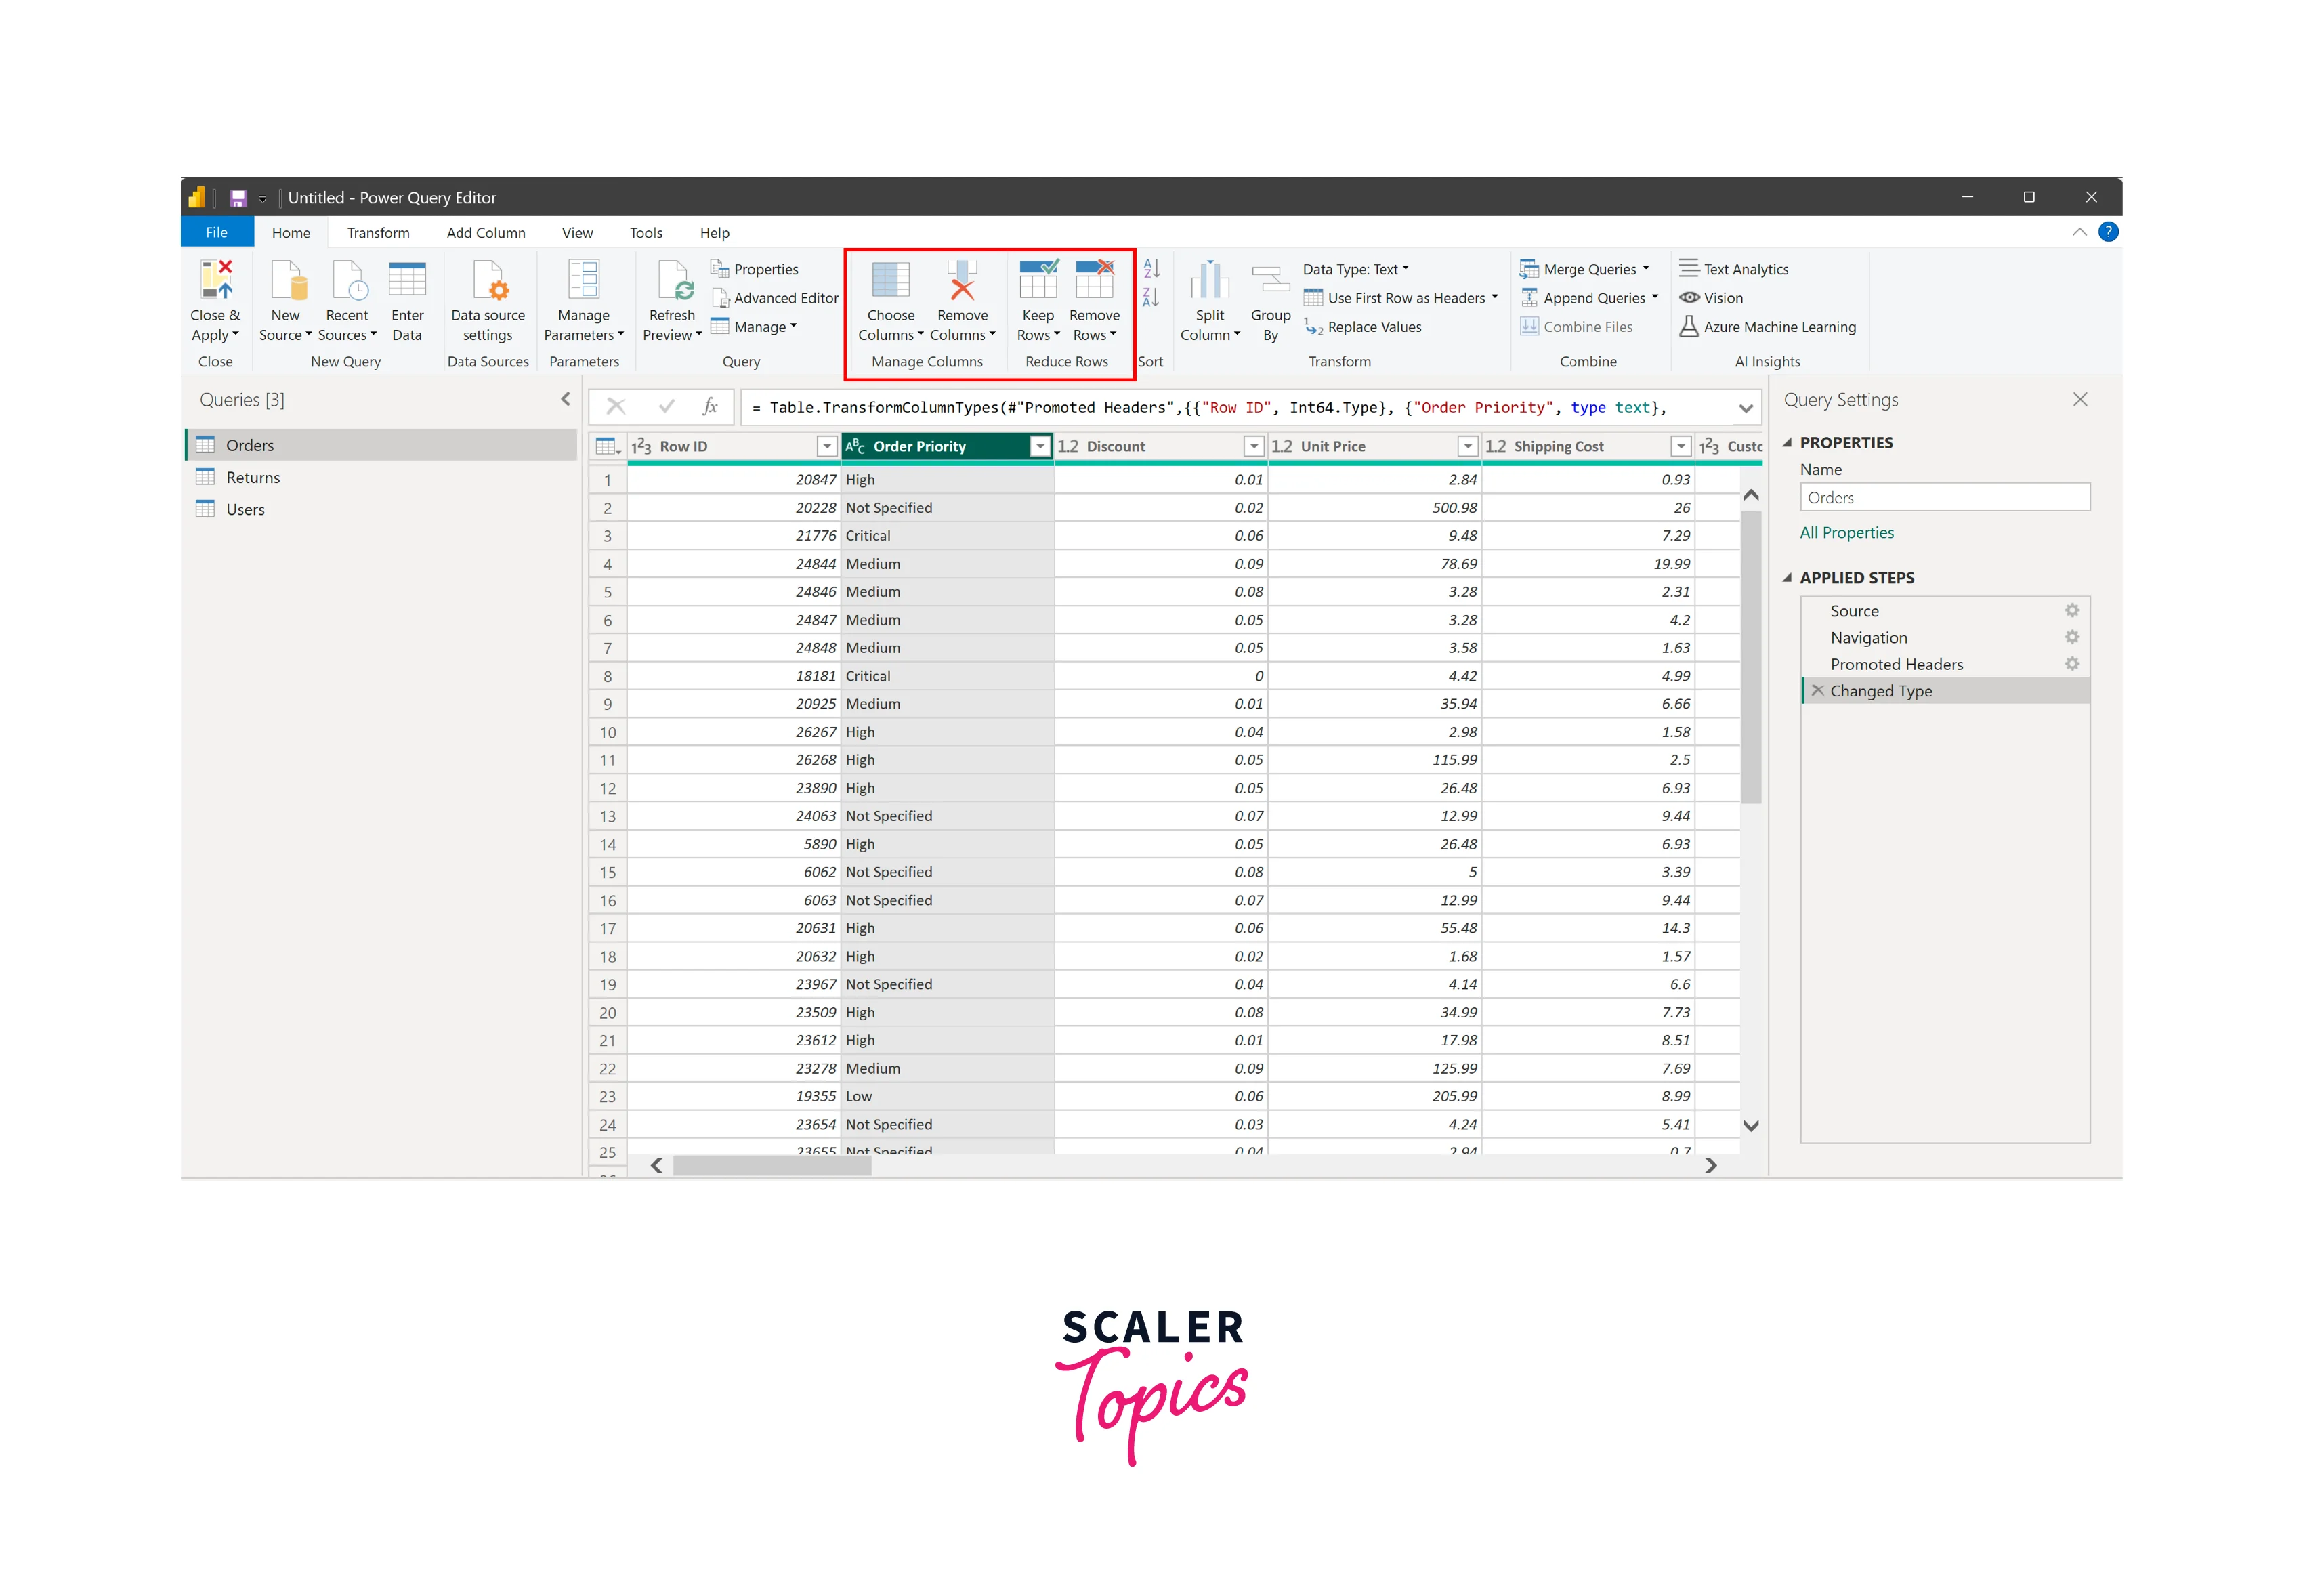
When dealing with large datasets, it's often necessary to refine the data by removing unnecessary columns and rows. In Power BI Data Transformation through the Power Query Editor, you can achieve this by accessing the options found under the Home tab, such as Choose Columns, Remove Columns, Keep Rows, and Remove Rows. These Power BI Data Transformation tools empower you to remove unwanted data from your dataset efficiently.
-
Removing Records with Power BI Data Filters:
You can refine your dataset further by using a row filter to remove specific unnecessary rows effortlessly. This filter can assist in removing columns that are empty or start/end with particular values. Like the data cleaning process, this Power BI Data Transformation step enhances user navigation and expedites the process of answering their queries.

-
Removing Duplicates from Power BI Datasets:
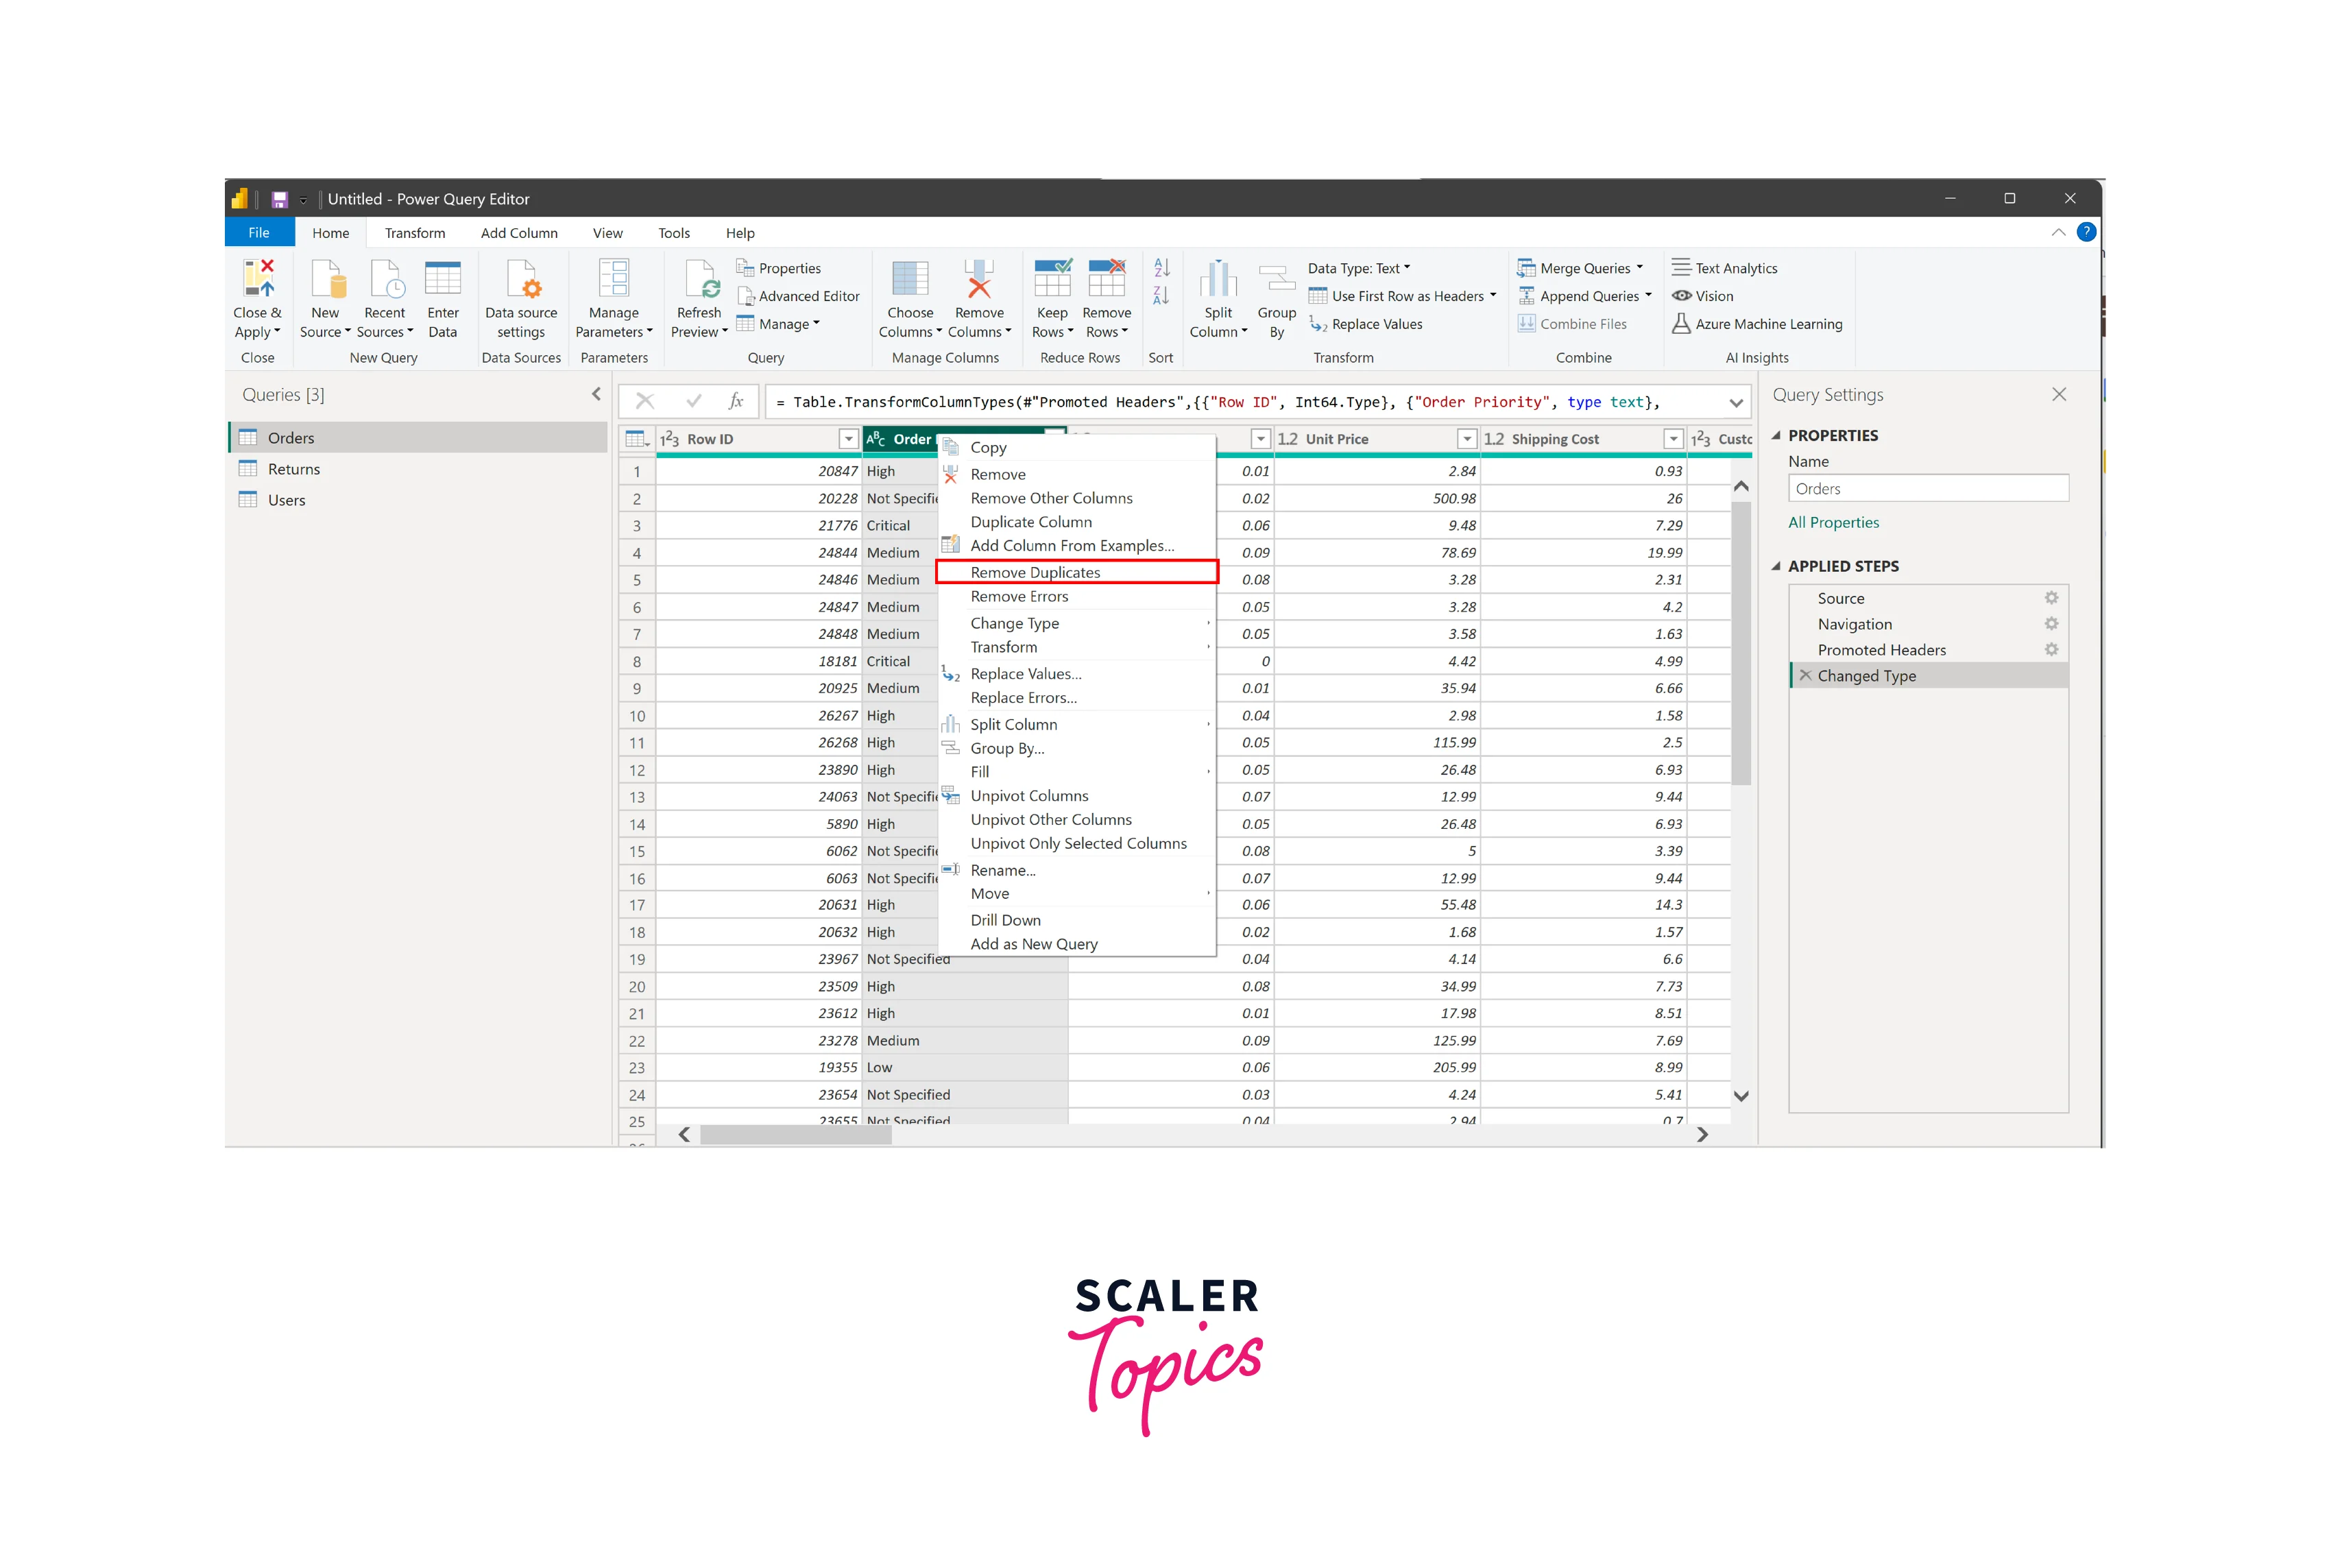
To remove duplicates, simply right-click on a column and select the 'remove duplicates' option to clean your dataset of any redundant entries.
Data Filtering and Merging in Power BI
-
Merging Columns in Power BI:
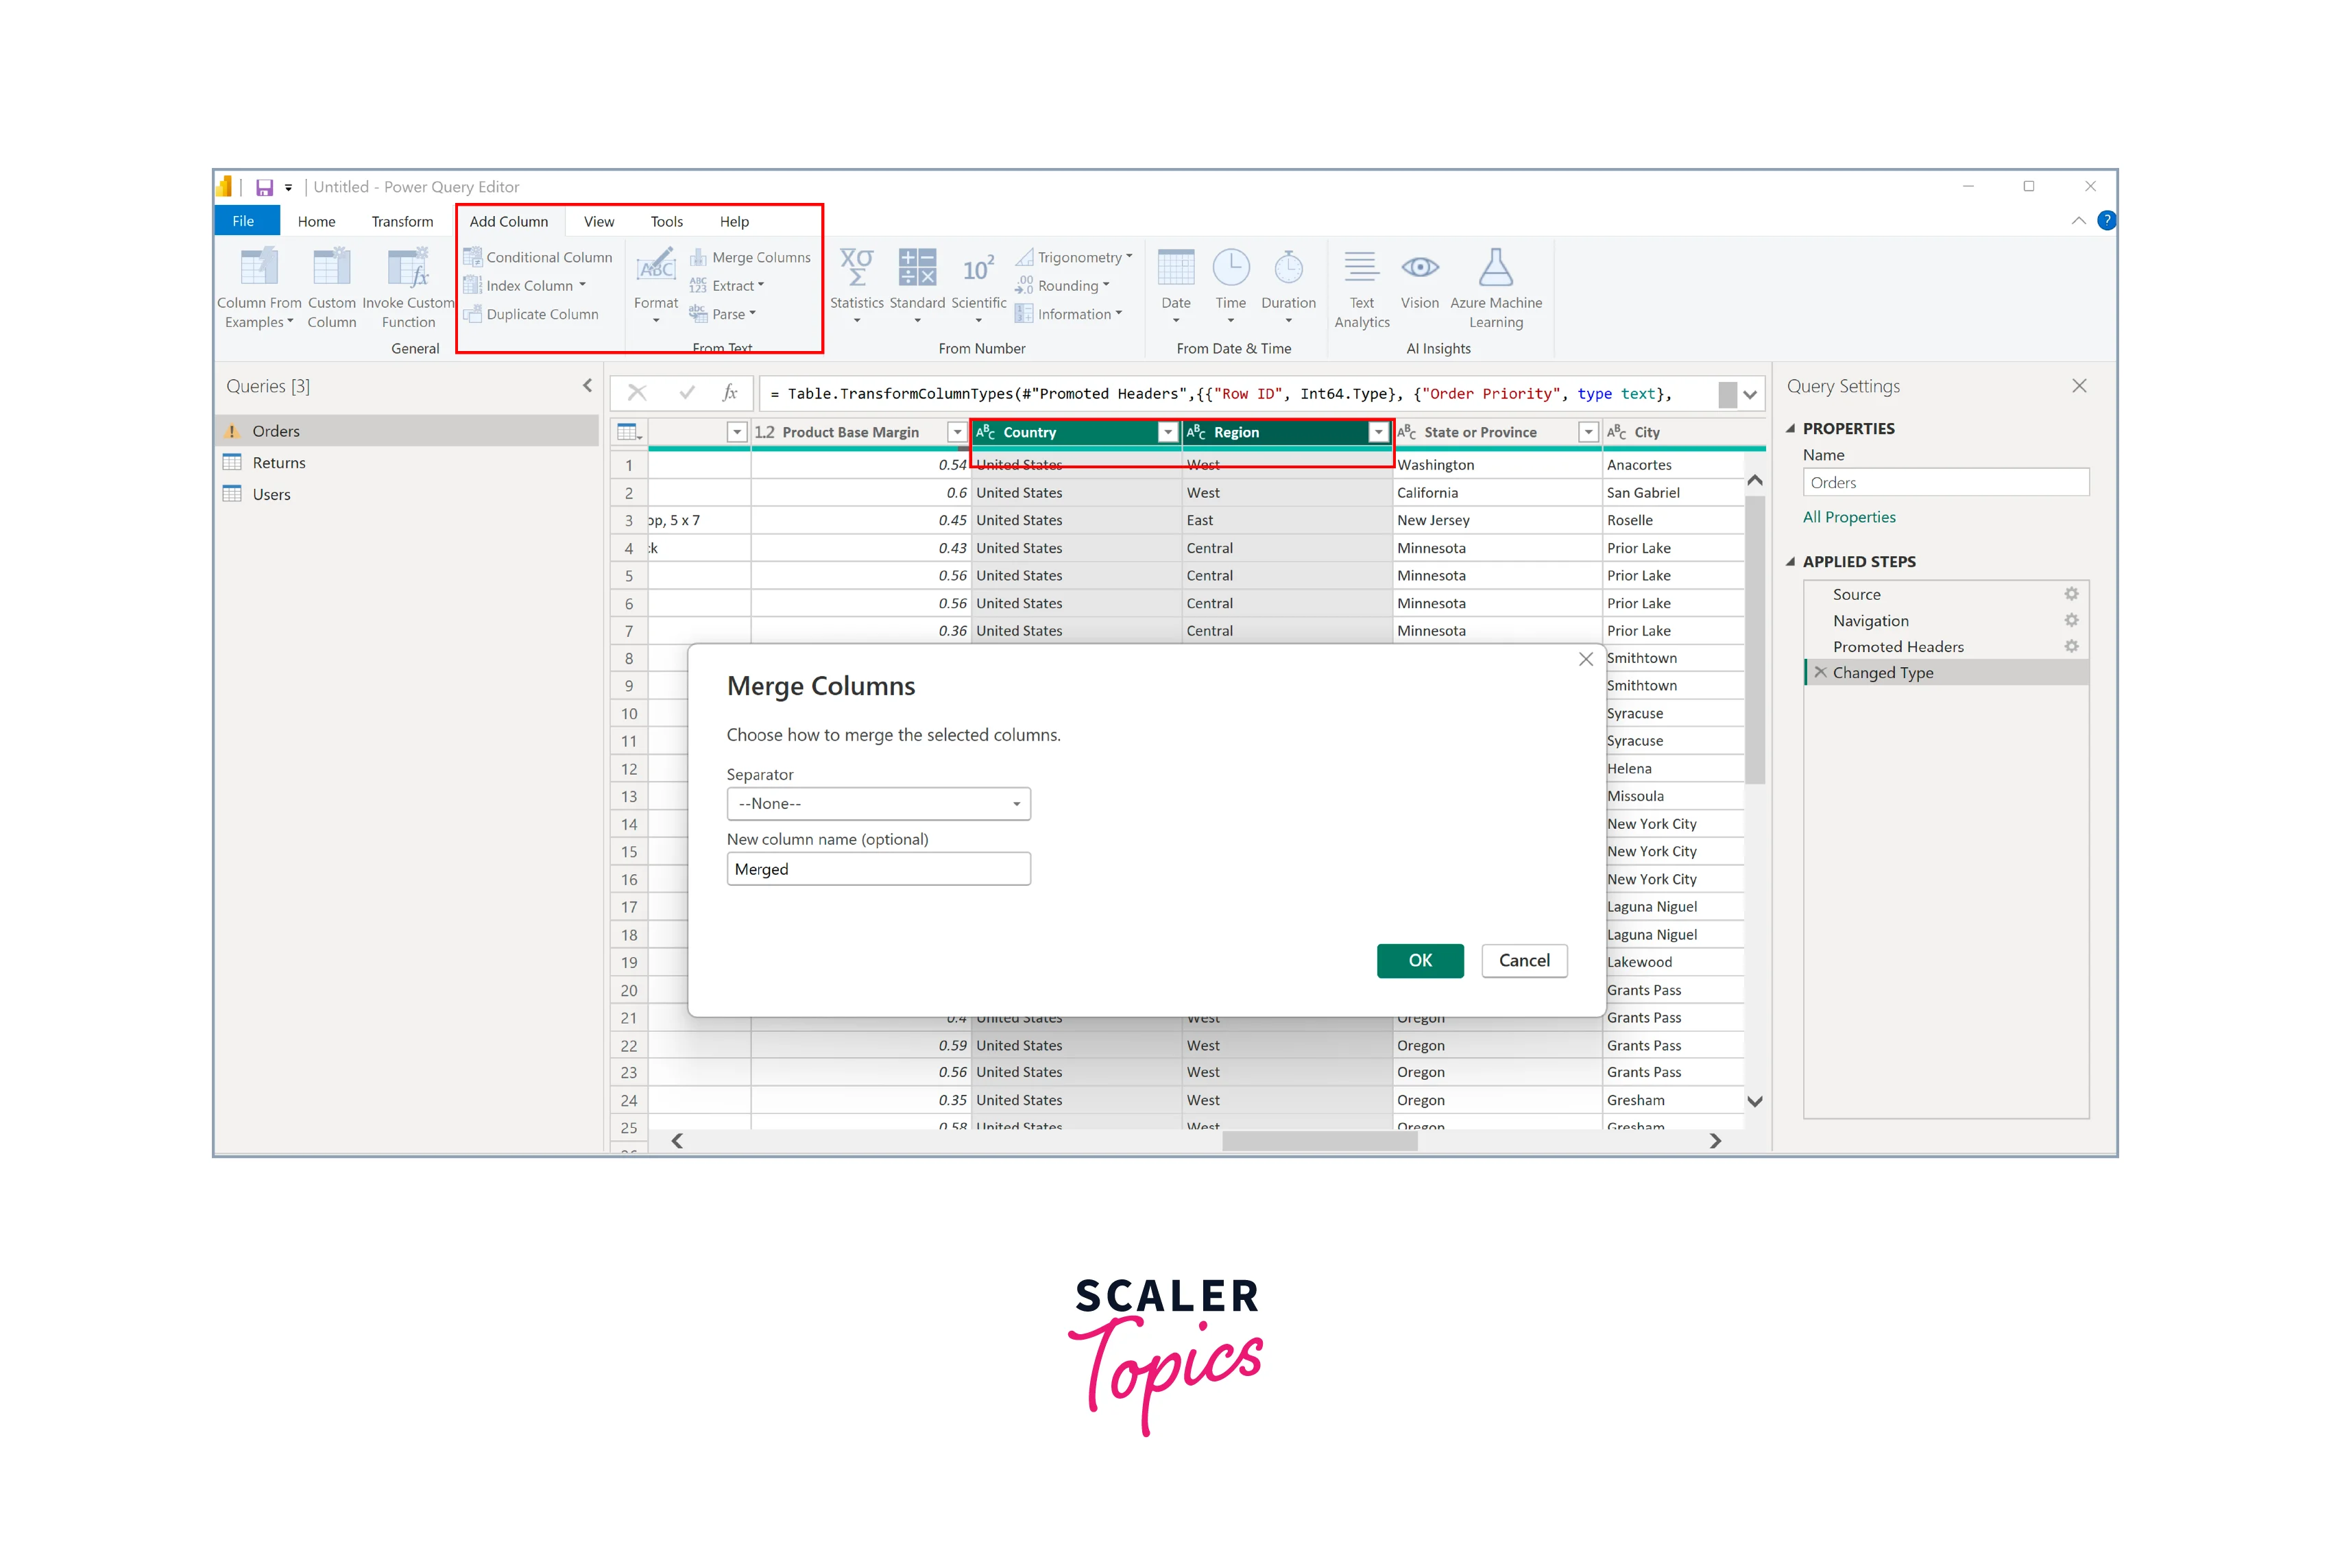
To merge two columns in Power BI, follow these steps:
- Select the two columns you want to merge and navigate to "Add Column".
- Choose the "Merge Columns" option.
- This action will open the Merge Columns page, allowing you to define the separator for the columns. Click "OK" to complete this Power BI Transform Data operation.
-
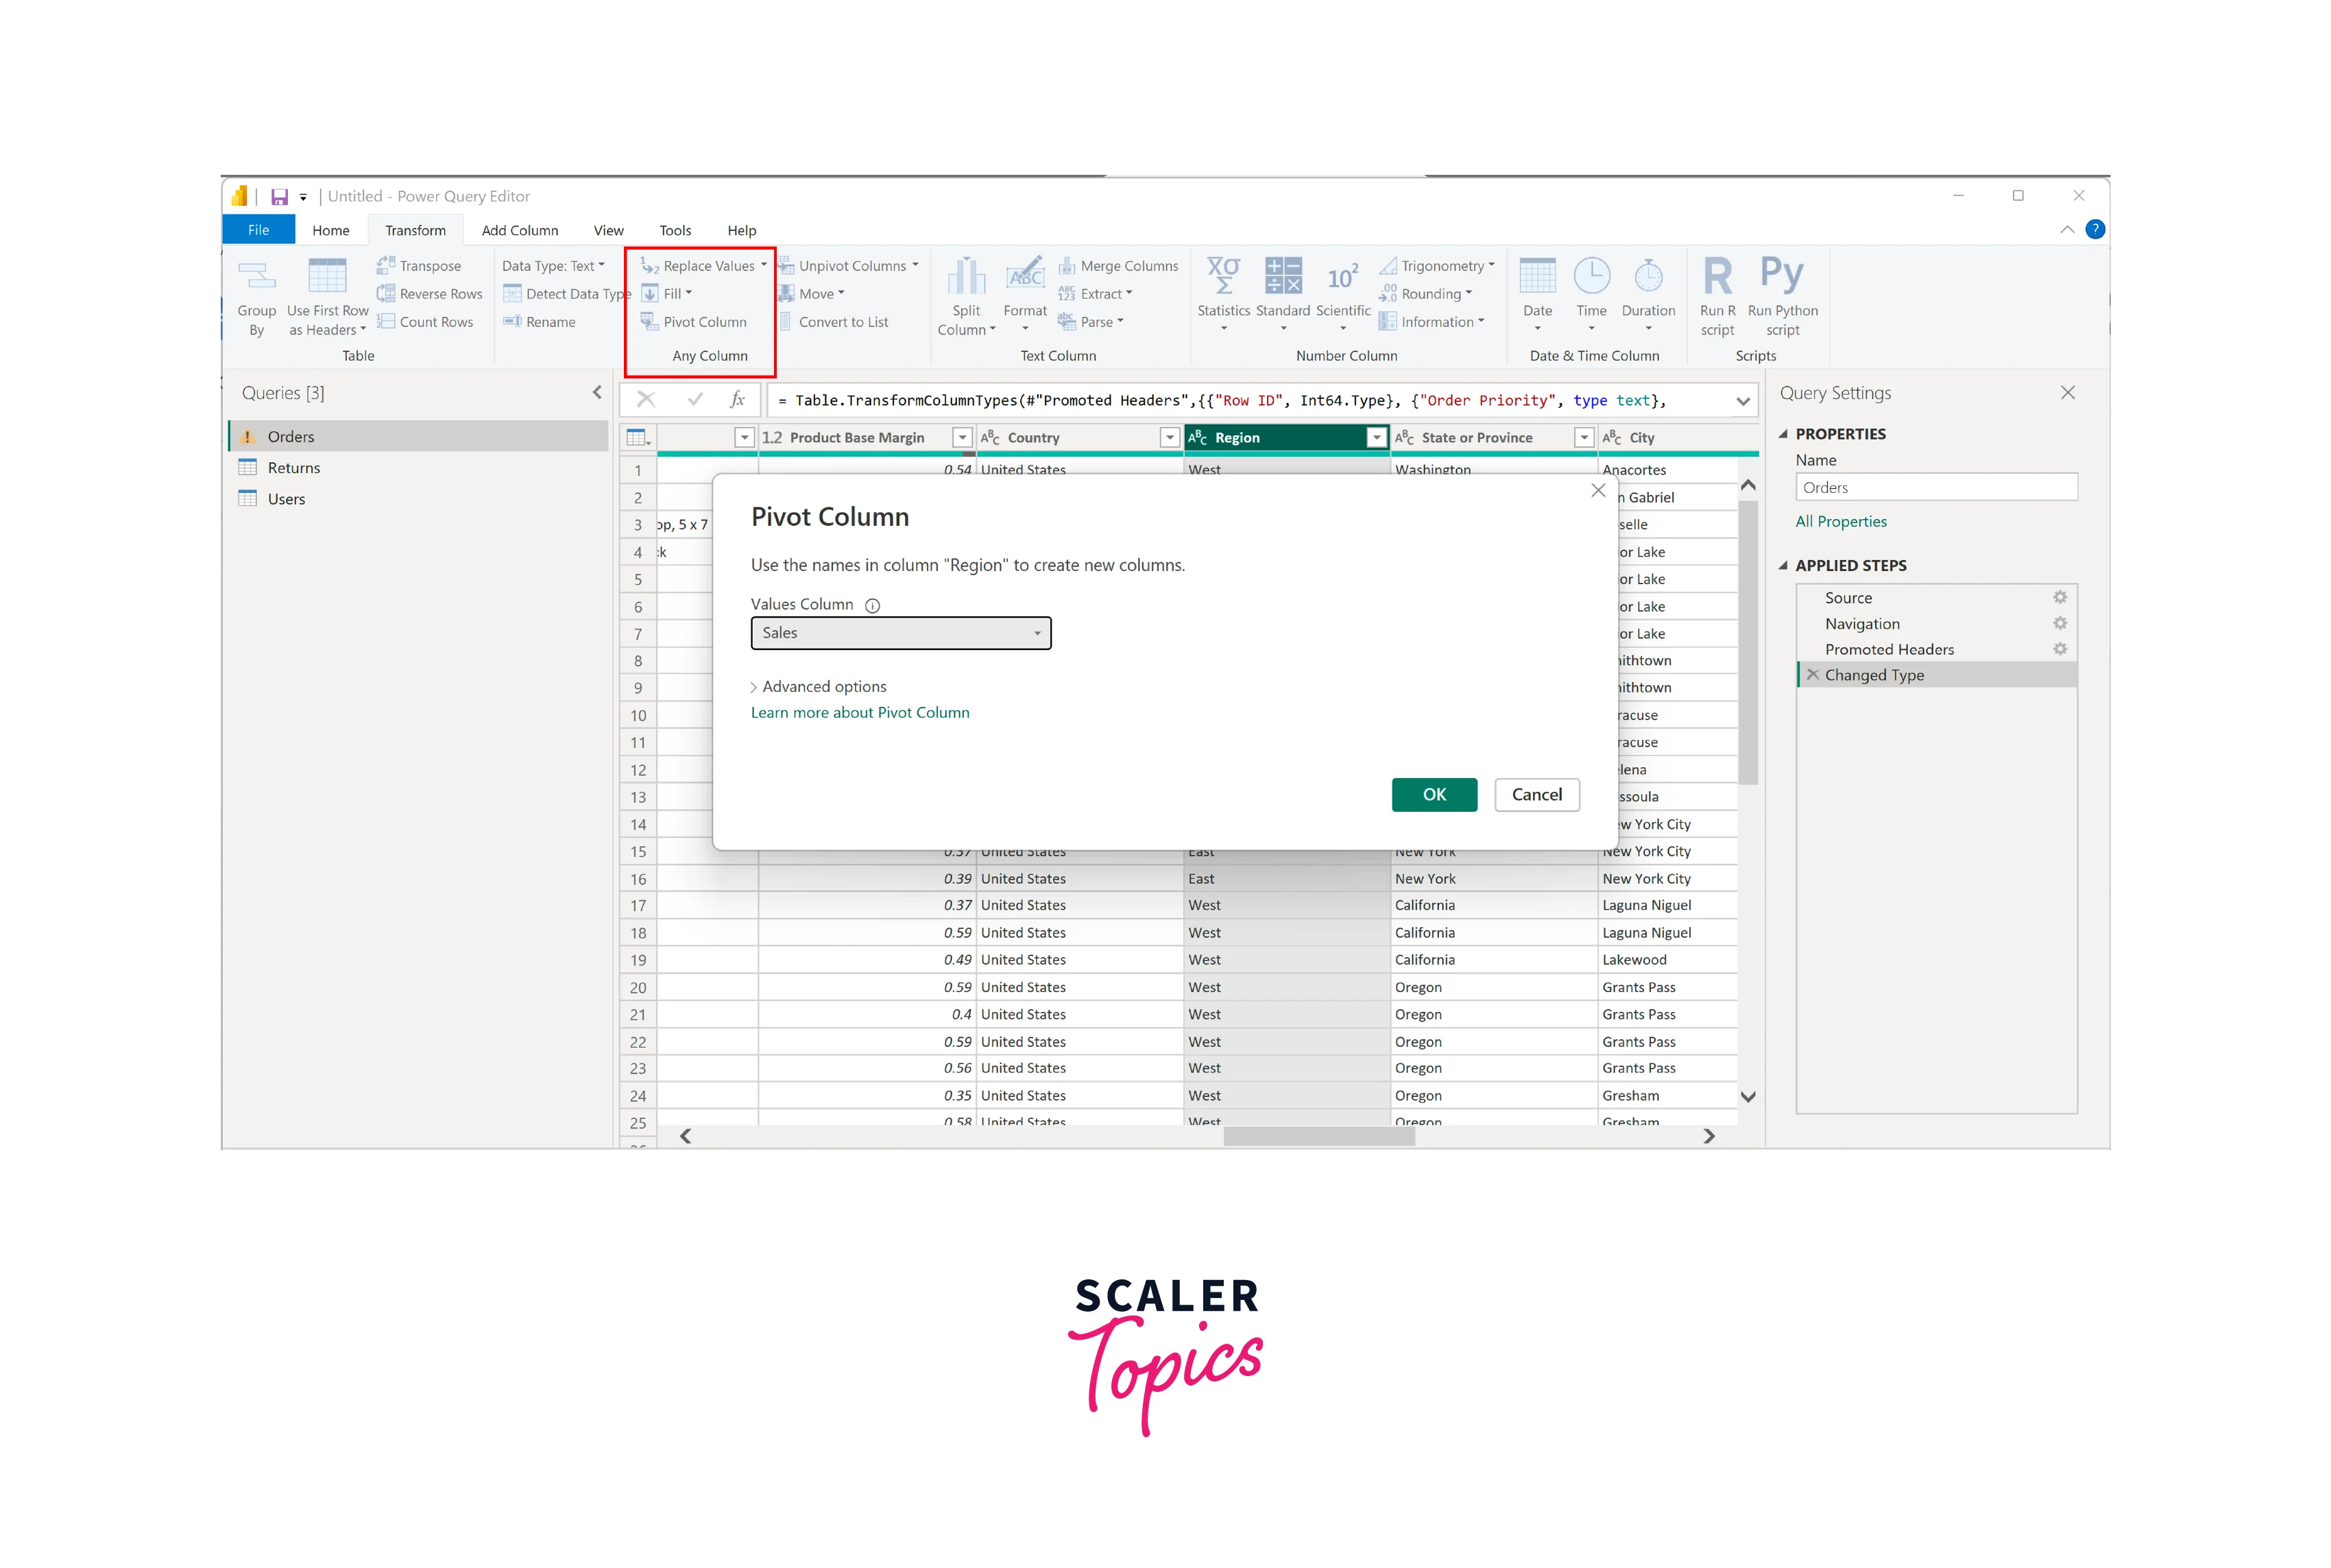
Pivoting Columns in Power BI:
To pivot a column in Power BI, use the following steps:
- Choose the column you want to pivot.
- On the Transform tab within the Any column group, select "Pivot column".
- In the pivot dialog box, under the Value column list, choose the value column. Power Query defaults to using the sum as the aggregation method, but you can opt for the Advanced option to explore other available aggregations before selecting. You can unpivot the columns by right-clicking them and selecting "Unpivot".
How to Change/Modify Data Types in Power BI?
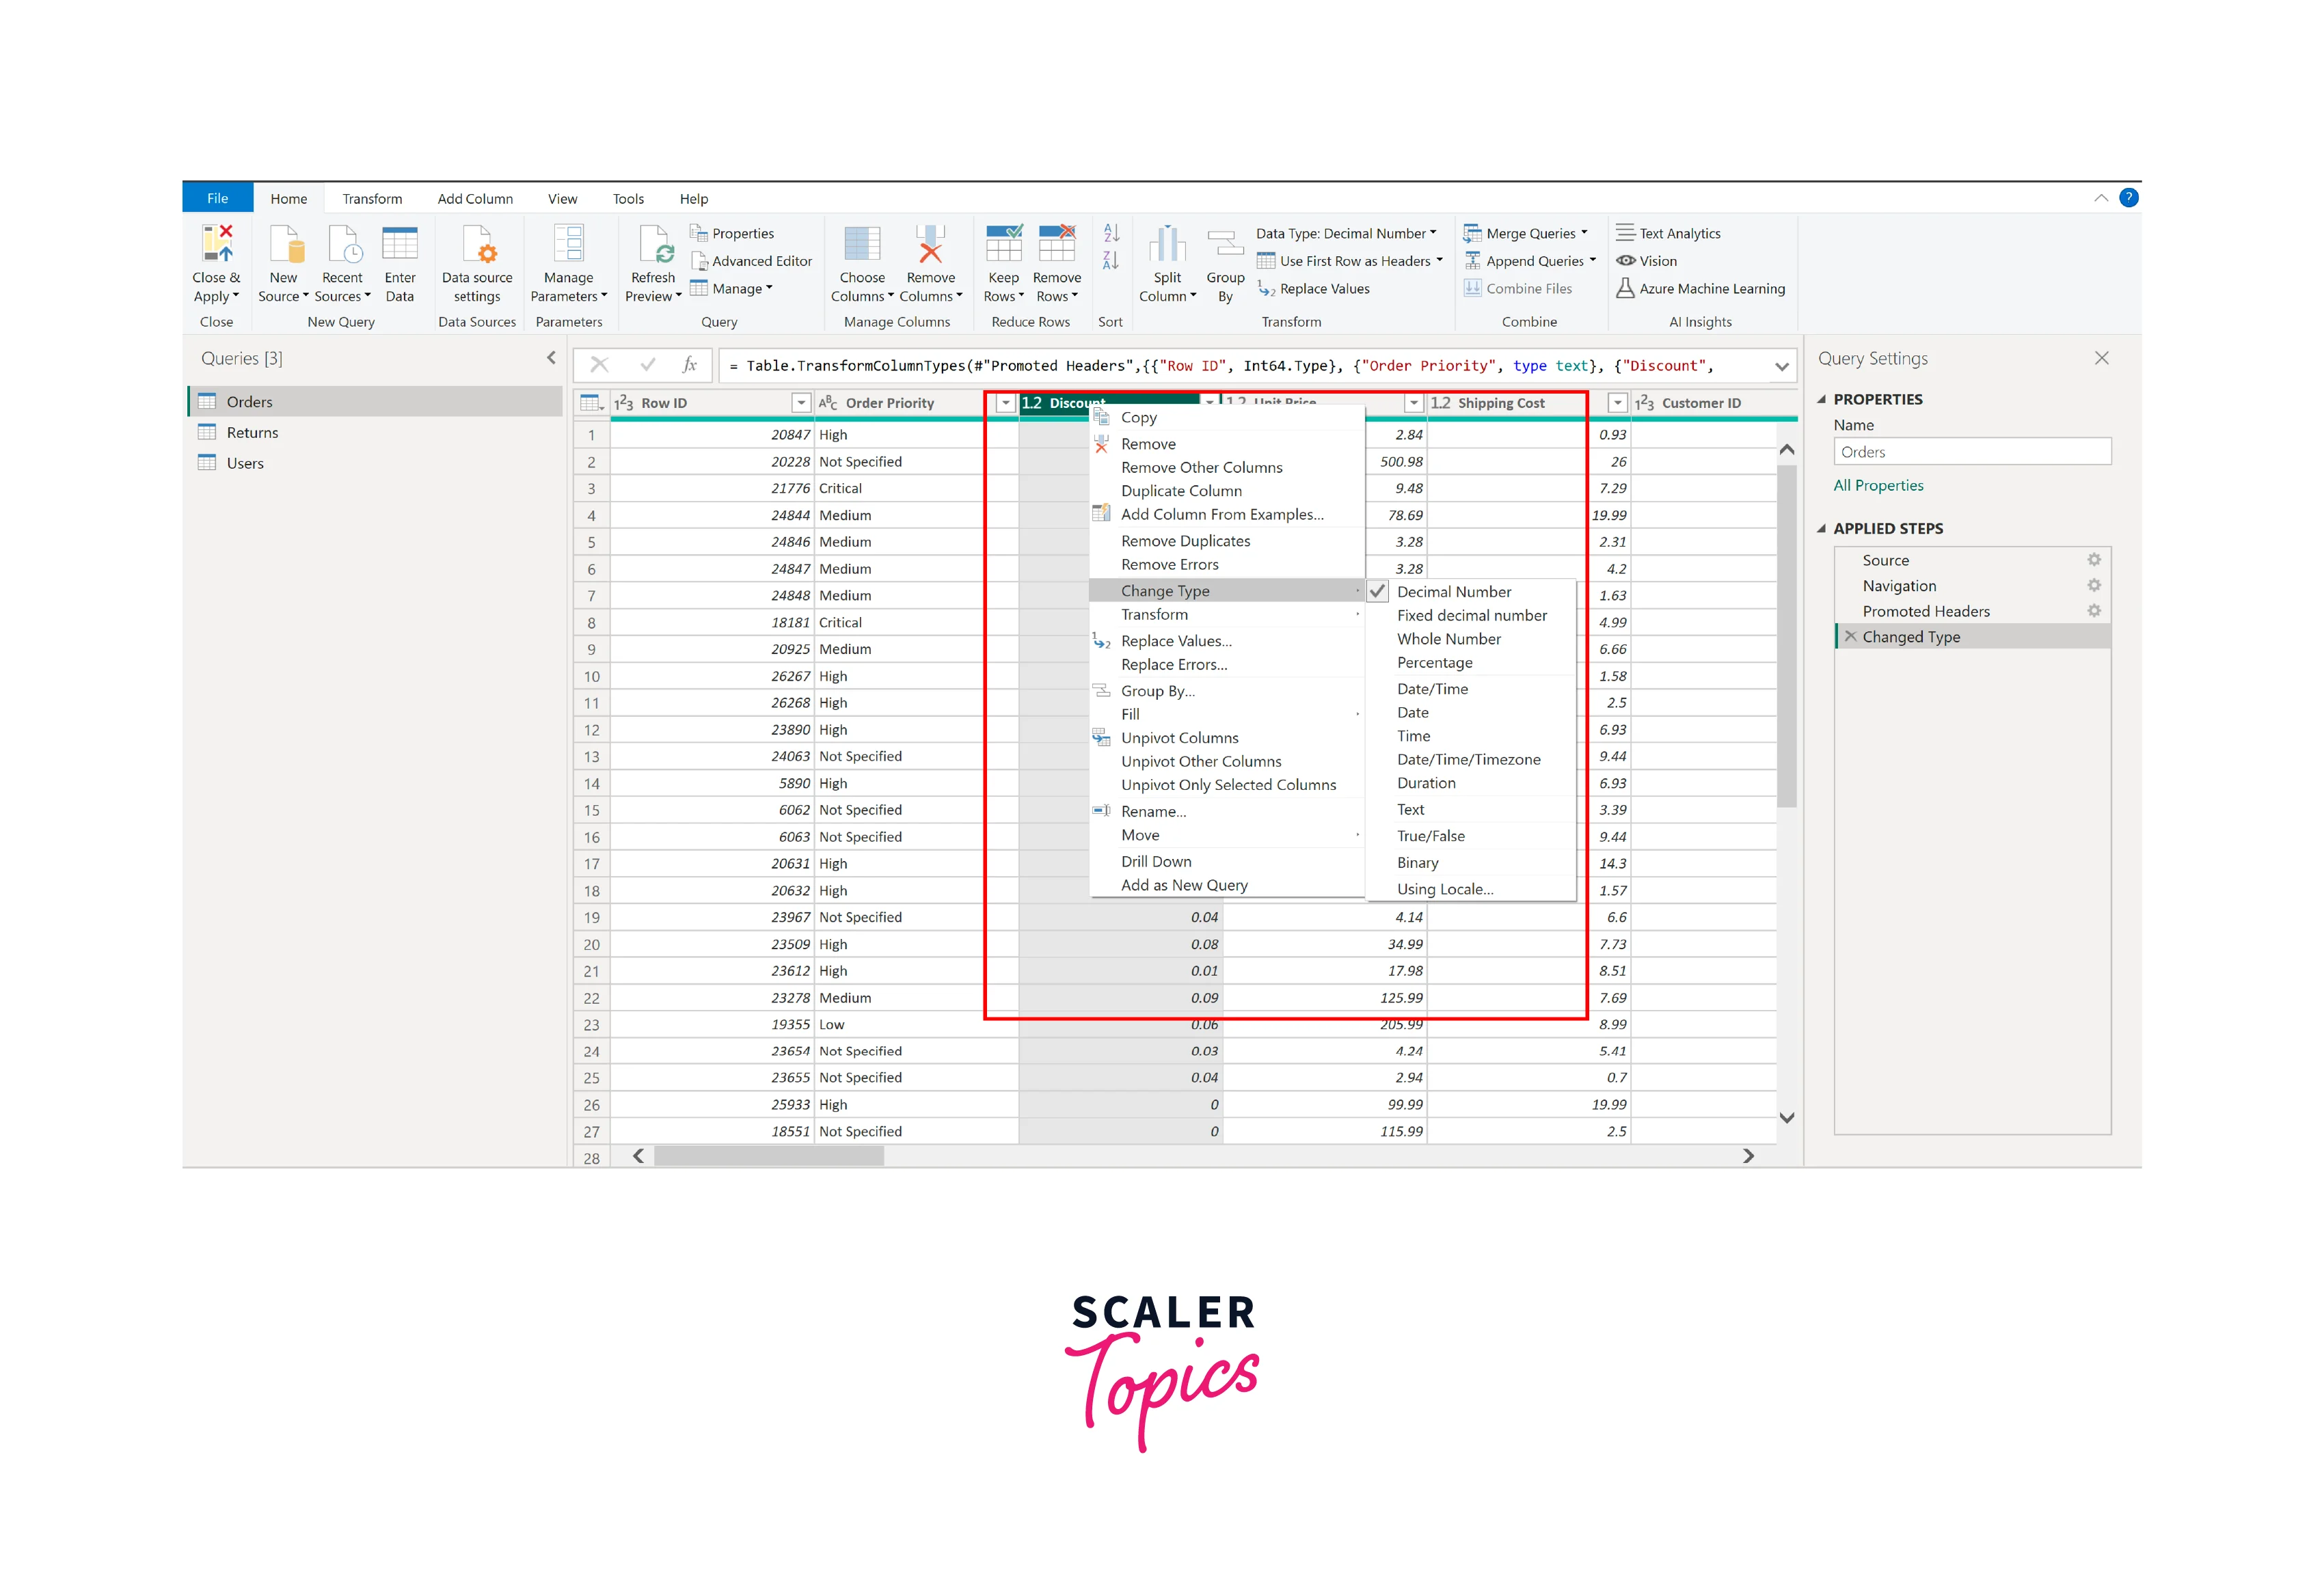
To modify the data type within Power BI's data transformation process, follow these steps:
- Choose the column and "Right Click" on the column header.
- This action triggers a dropdown menu where you can opt for "Change Type".
- Upon selection, a dropdown list presents various data types to choose from, such as Fixed Decimal Number, Text, Date, etc.
How to Format Text & Replace Values in Power BI?
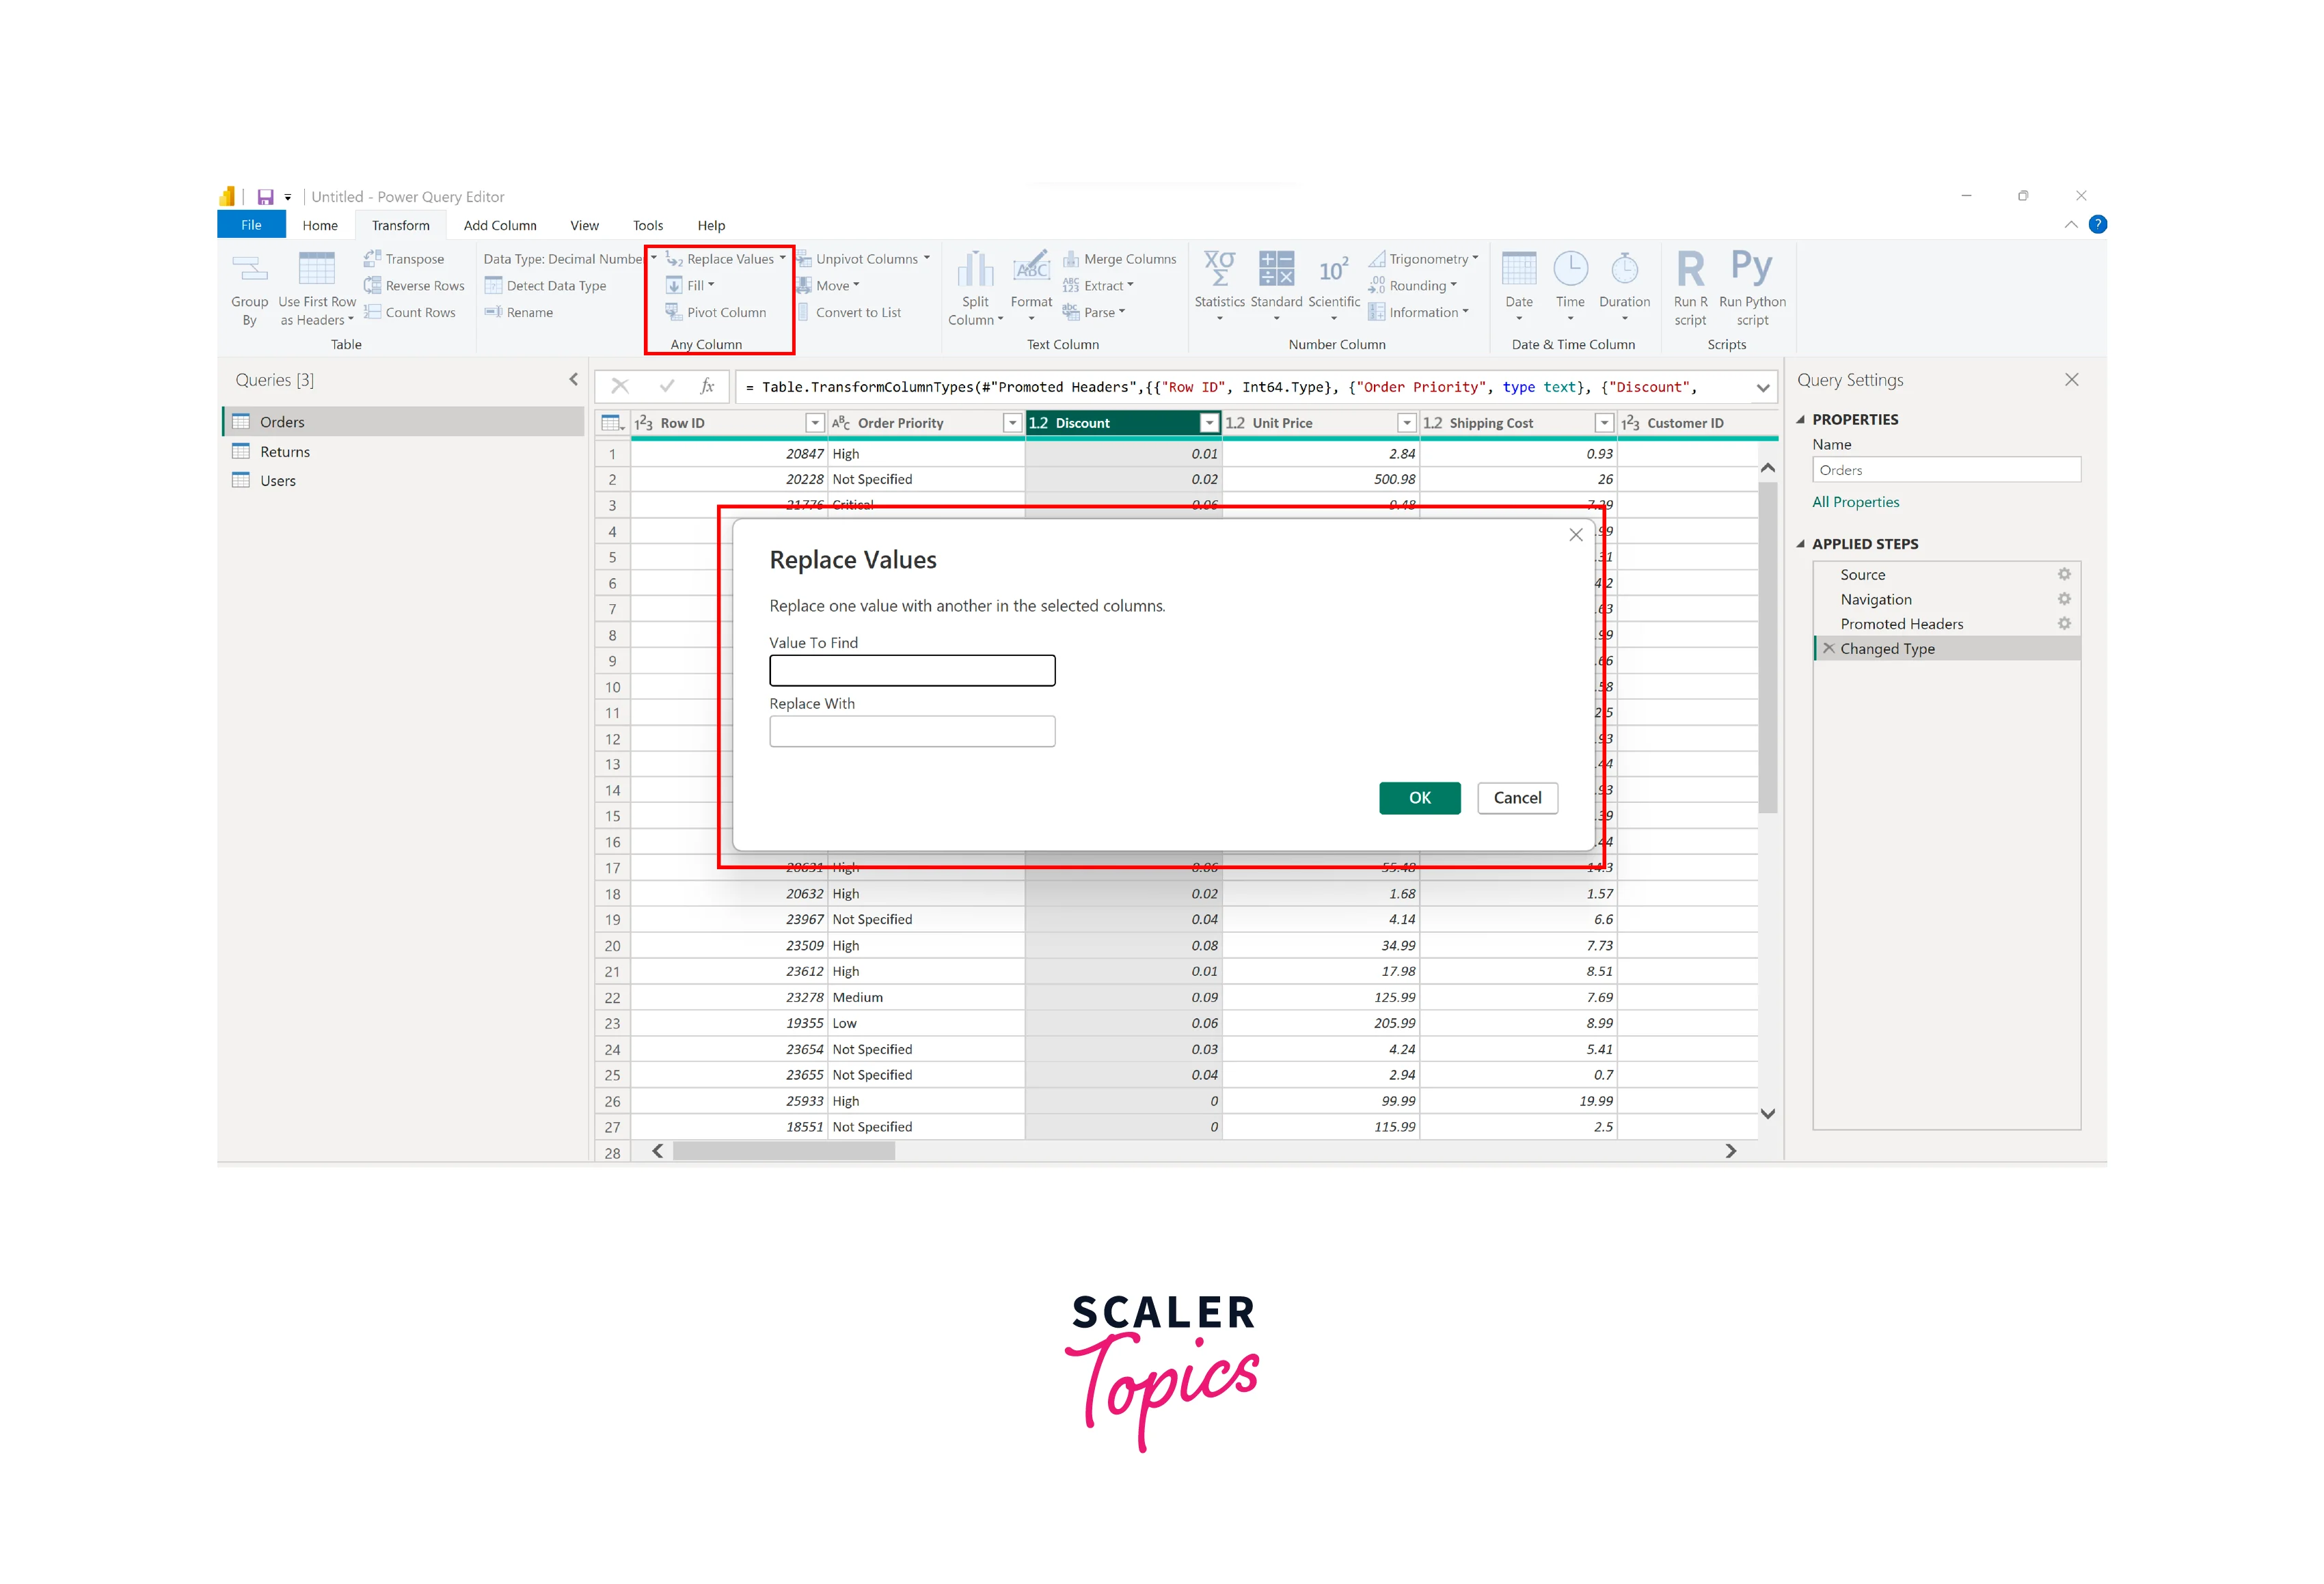
The "Replace Values" option is located on the 'Transform' tab of the ribbon. Within the advanced menu, you can introduce special characters for matching entire cell contents. This feature is valuable for cleaning up datasets plagued by typos or values needing more detail.
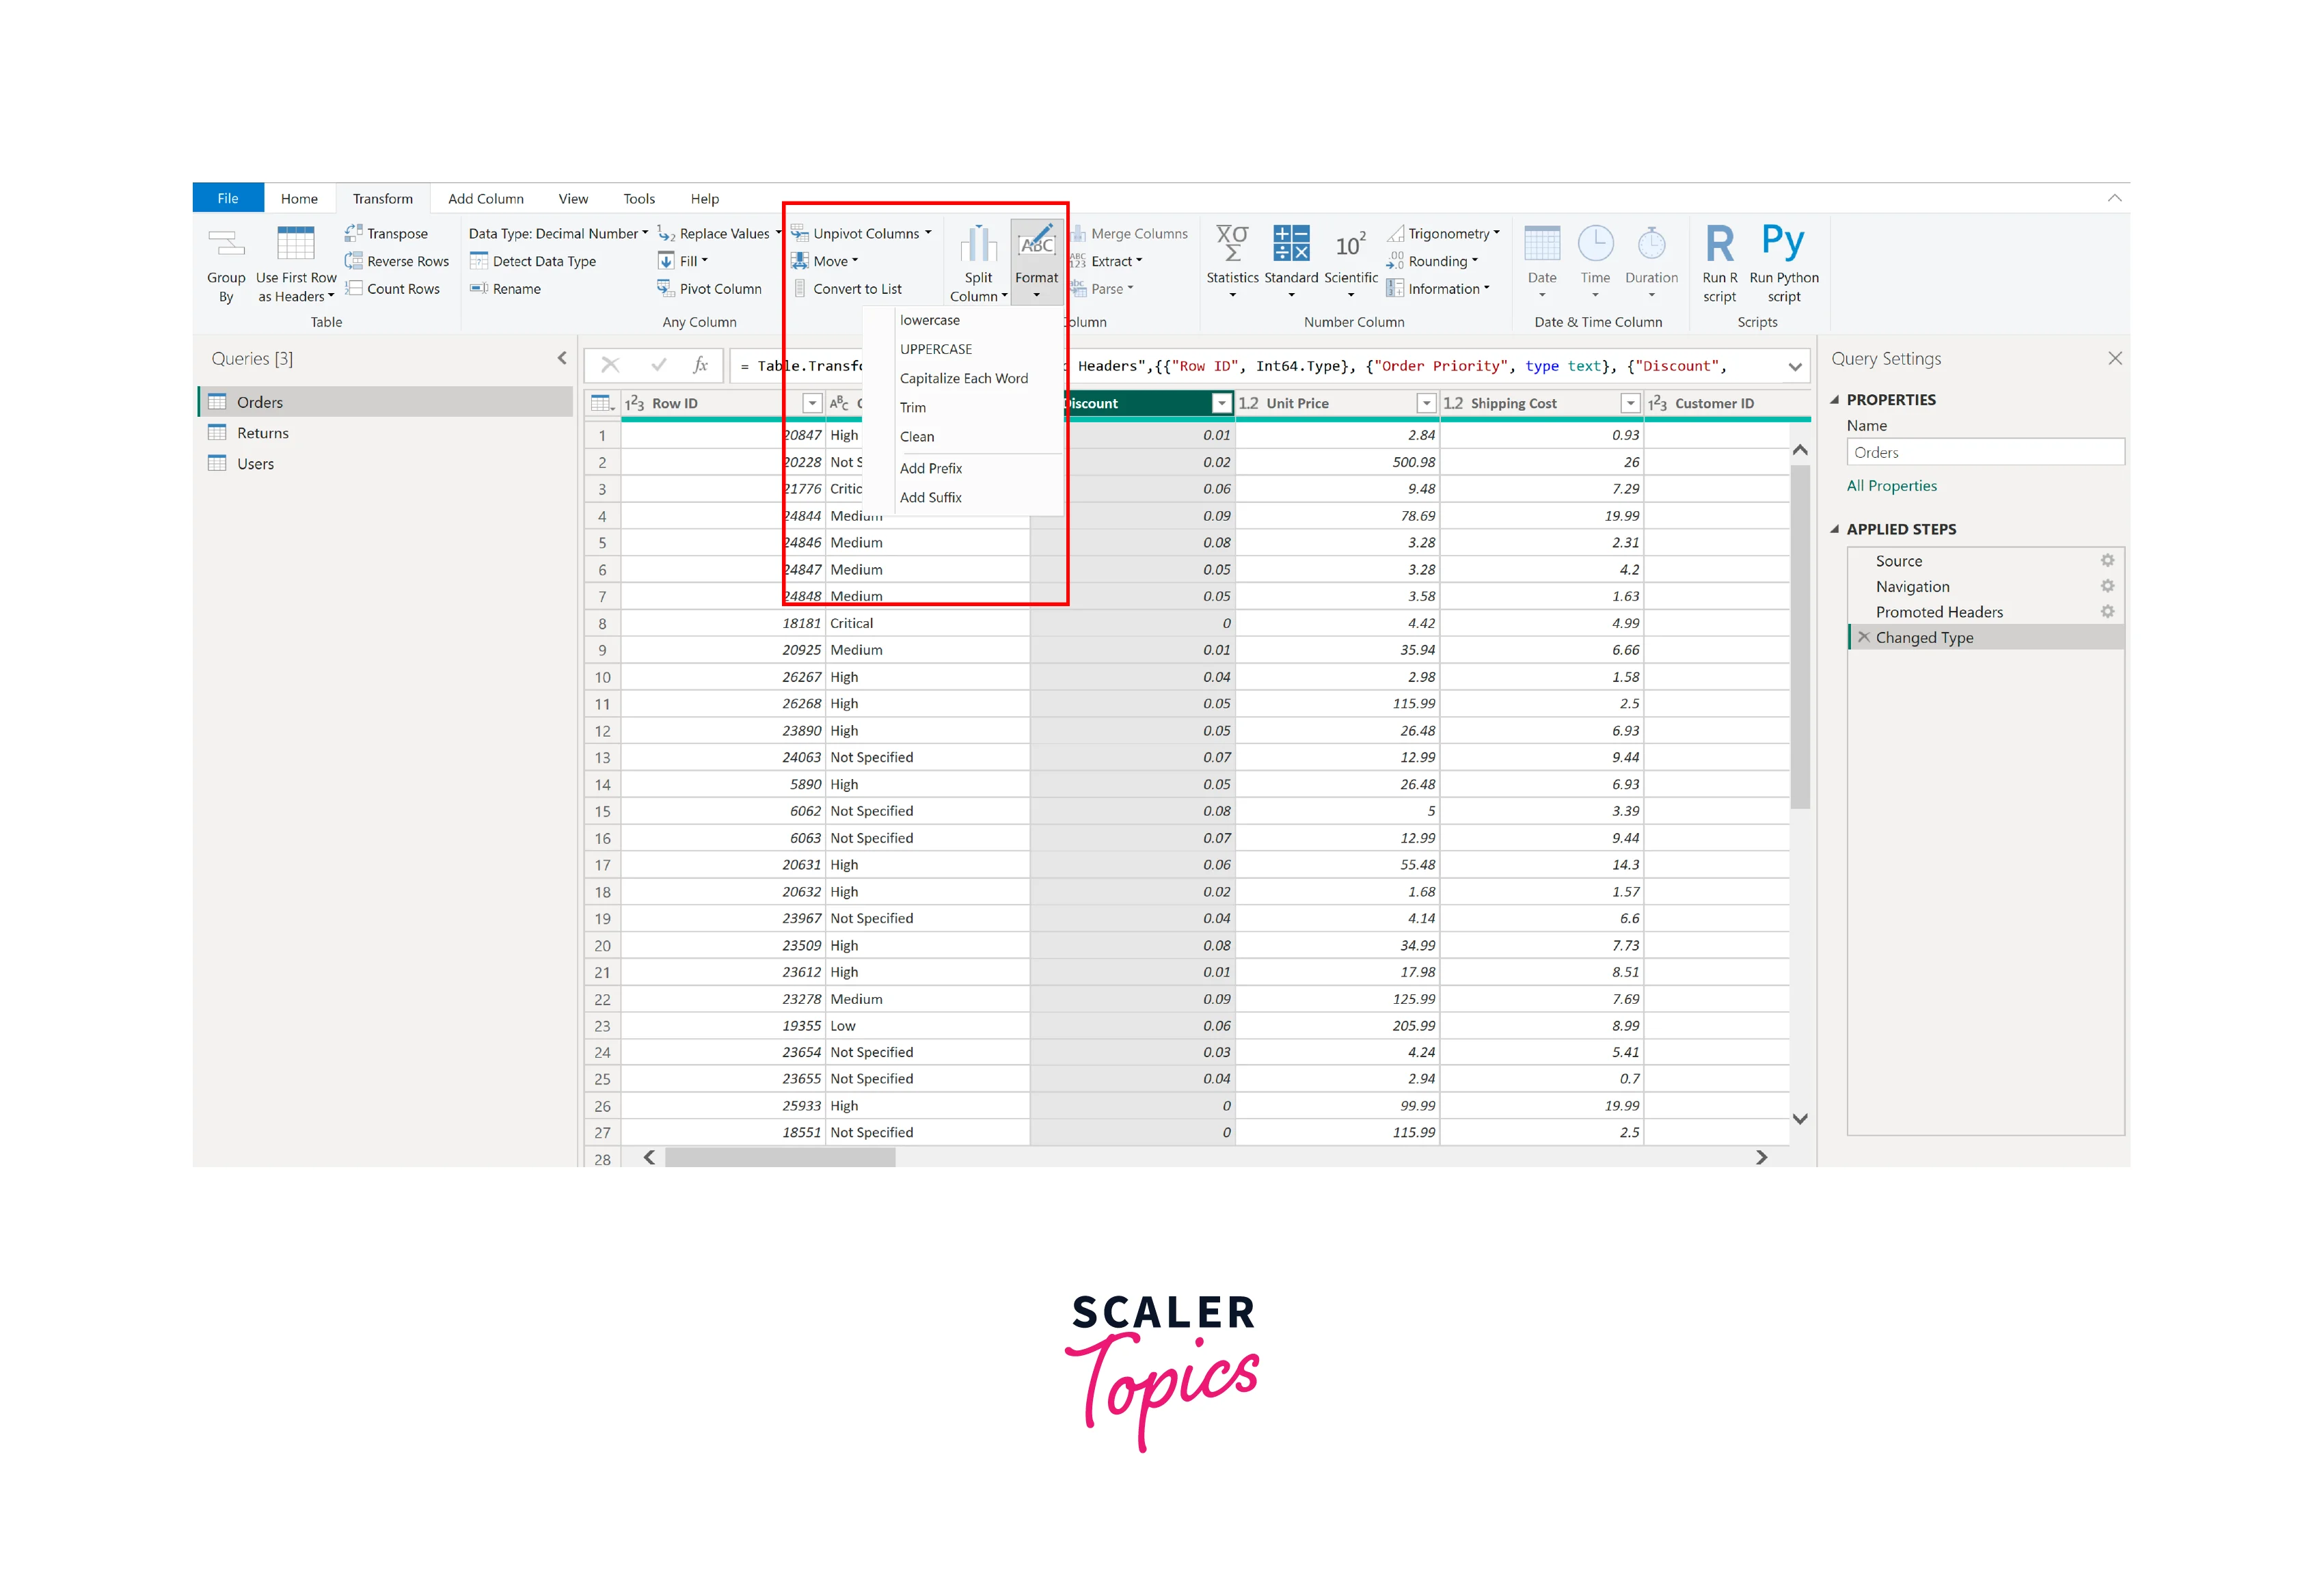
Formatting options can also be accessed via the 'Transform' tab of the ribbon, enabling you to clean, trim, and adjust the text's case. This functionality is valuable for streamlining text fields, simplifying subsequent transformations, and enhancing readability. The 'Trim' option, in particular, proves useful for eliminating leading or trailing spaces.
Data Aggregation and Grouping
Here are the steps to perform data aggregation and grouping in Power BI Query Editor:
-
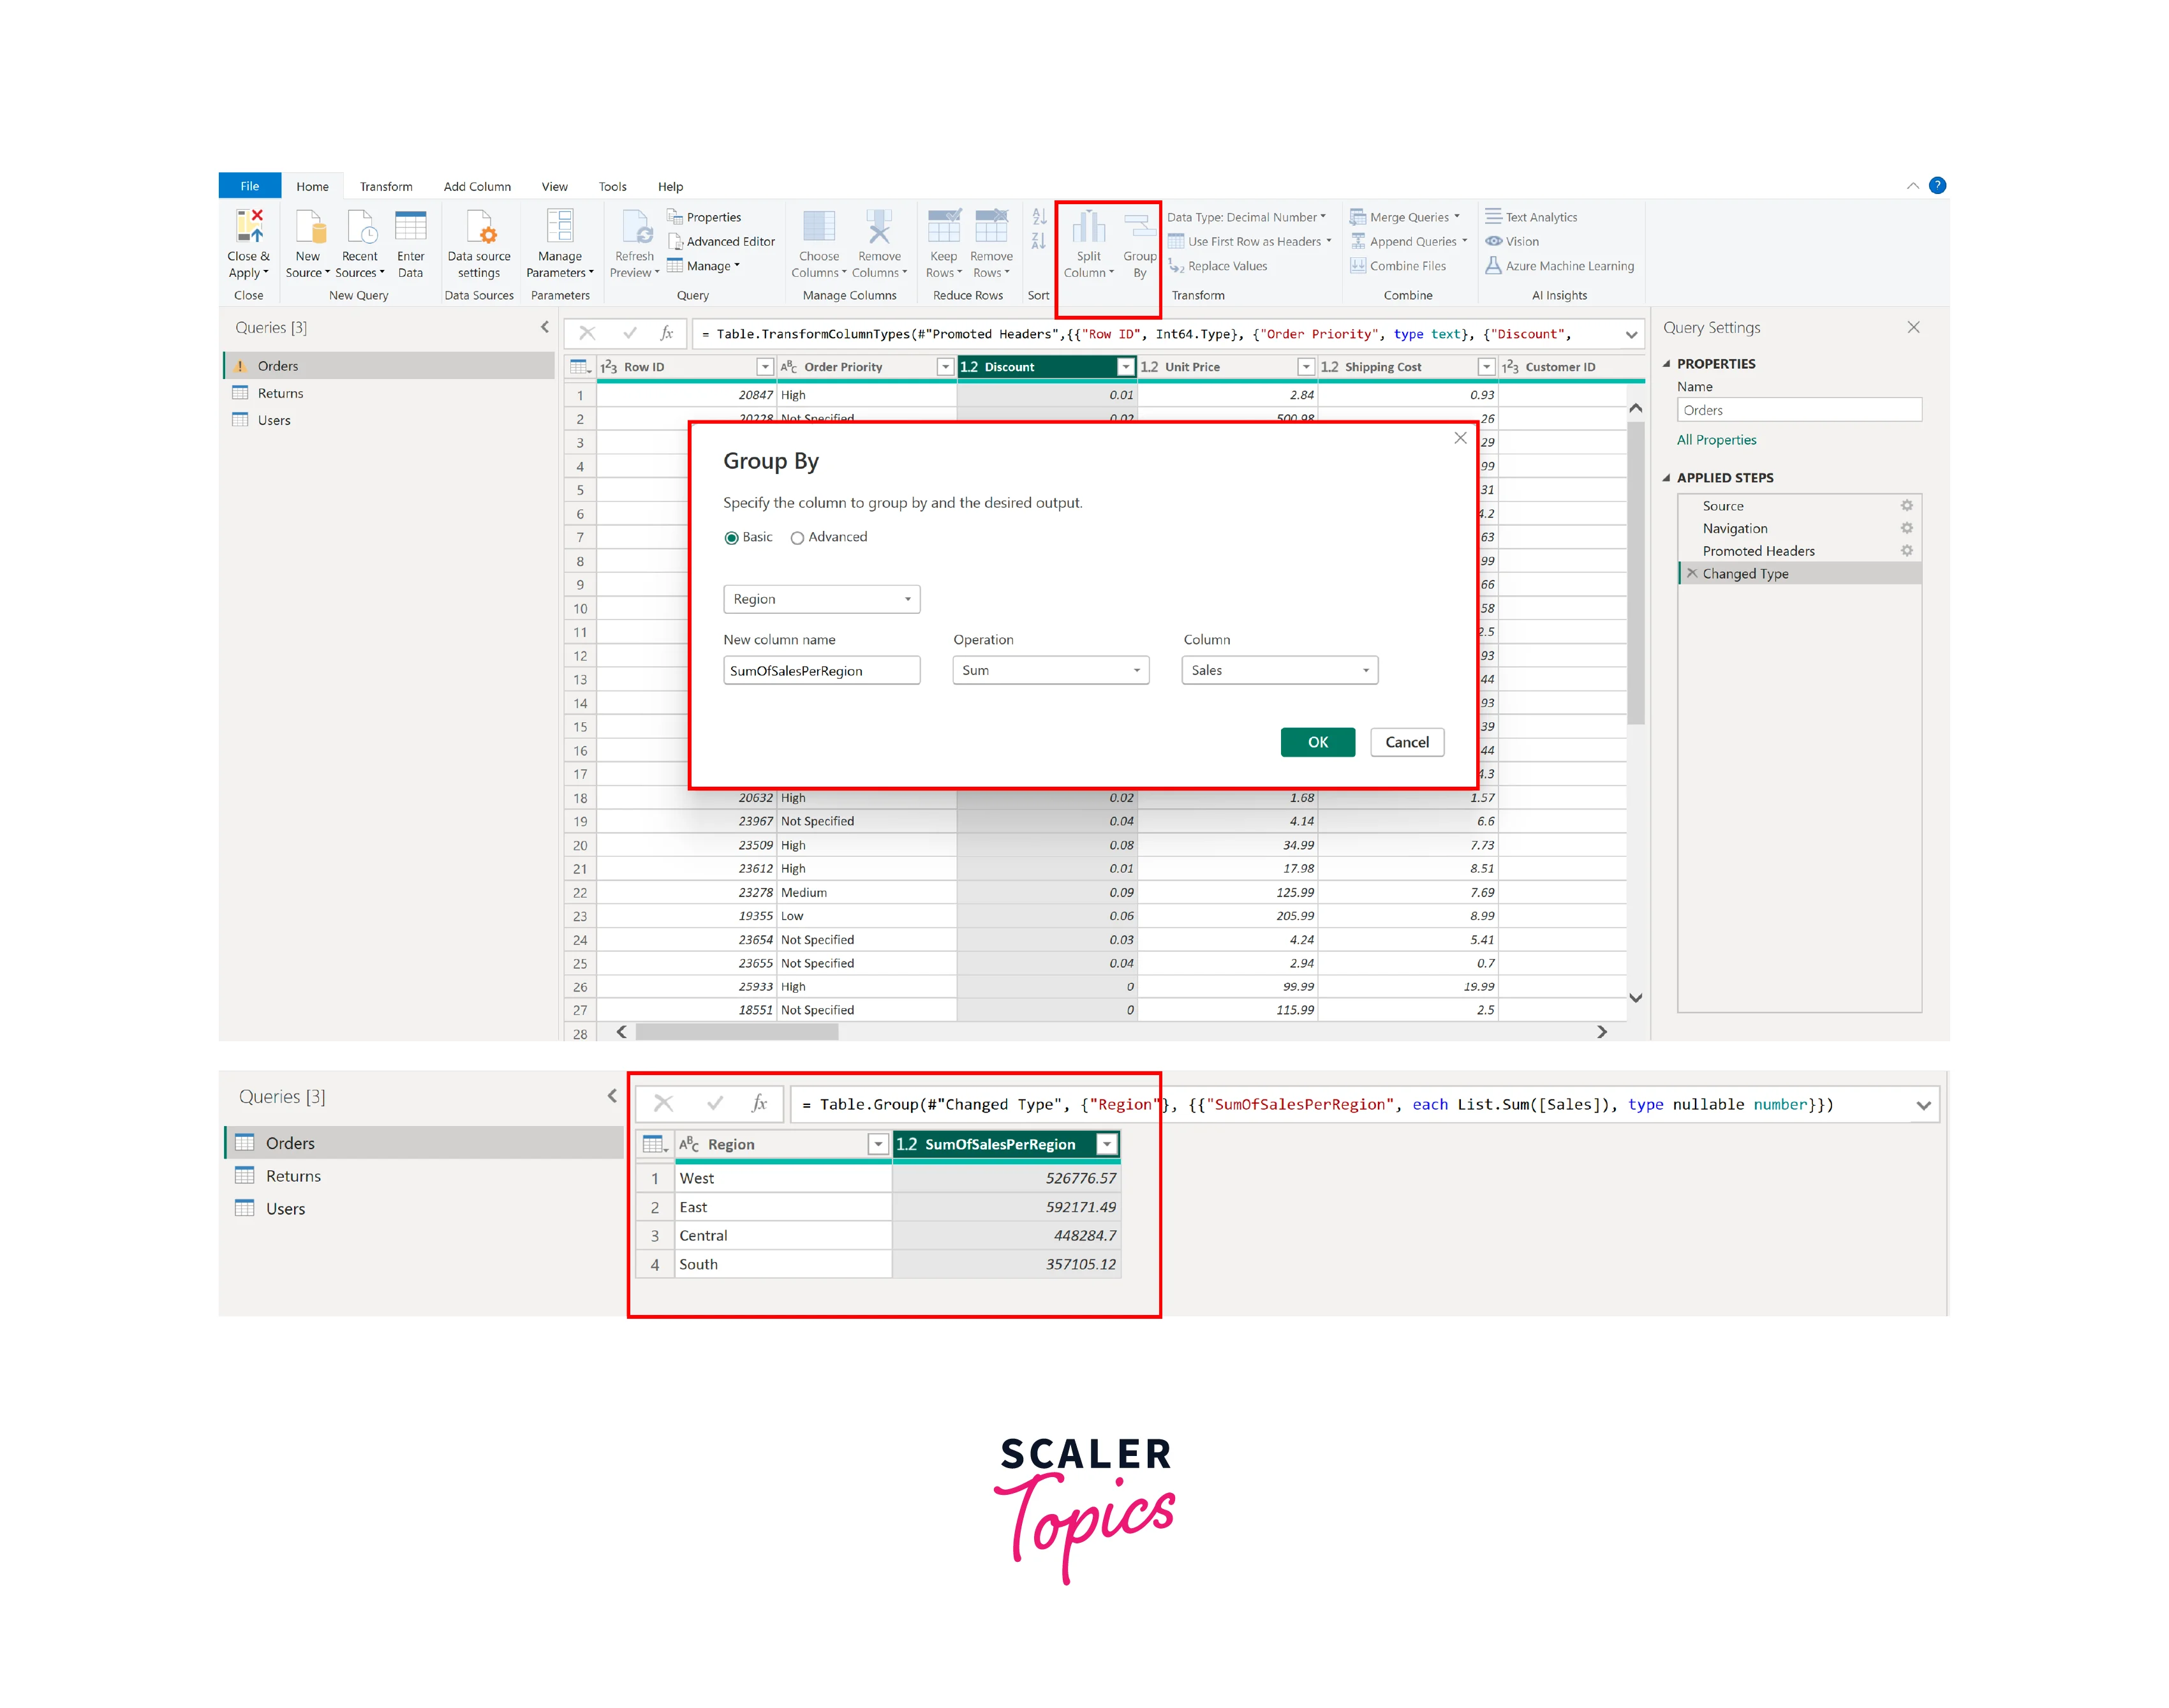
Within the Home tab, choose the "Group By" option, initiating the opening of a dialog box.
-
In the dialog box: Choose the column by which you want to group the data. Define the aggregation operations for other columns, such as sum, average, count, etc. These operations will be applied to the grouped data. Provide a new name for the aggregated column.
-
Your data will now be grouped and aggregated according to your specifications, creating a summarized dataset that you can use for analysis and visualization in Power BI. For instance, if we want to see total sales per region, we can group by and aggregate the sales data, as shown in the figure below:
Data Splitting and Extracting
Here are the steps for splitting and extracting data/columns in Power BI:
- Choose the column you want to split or extract data from.
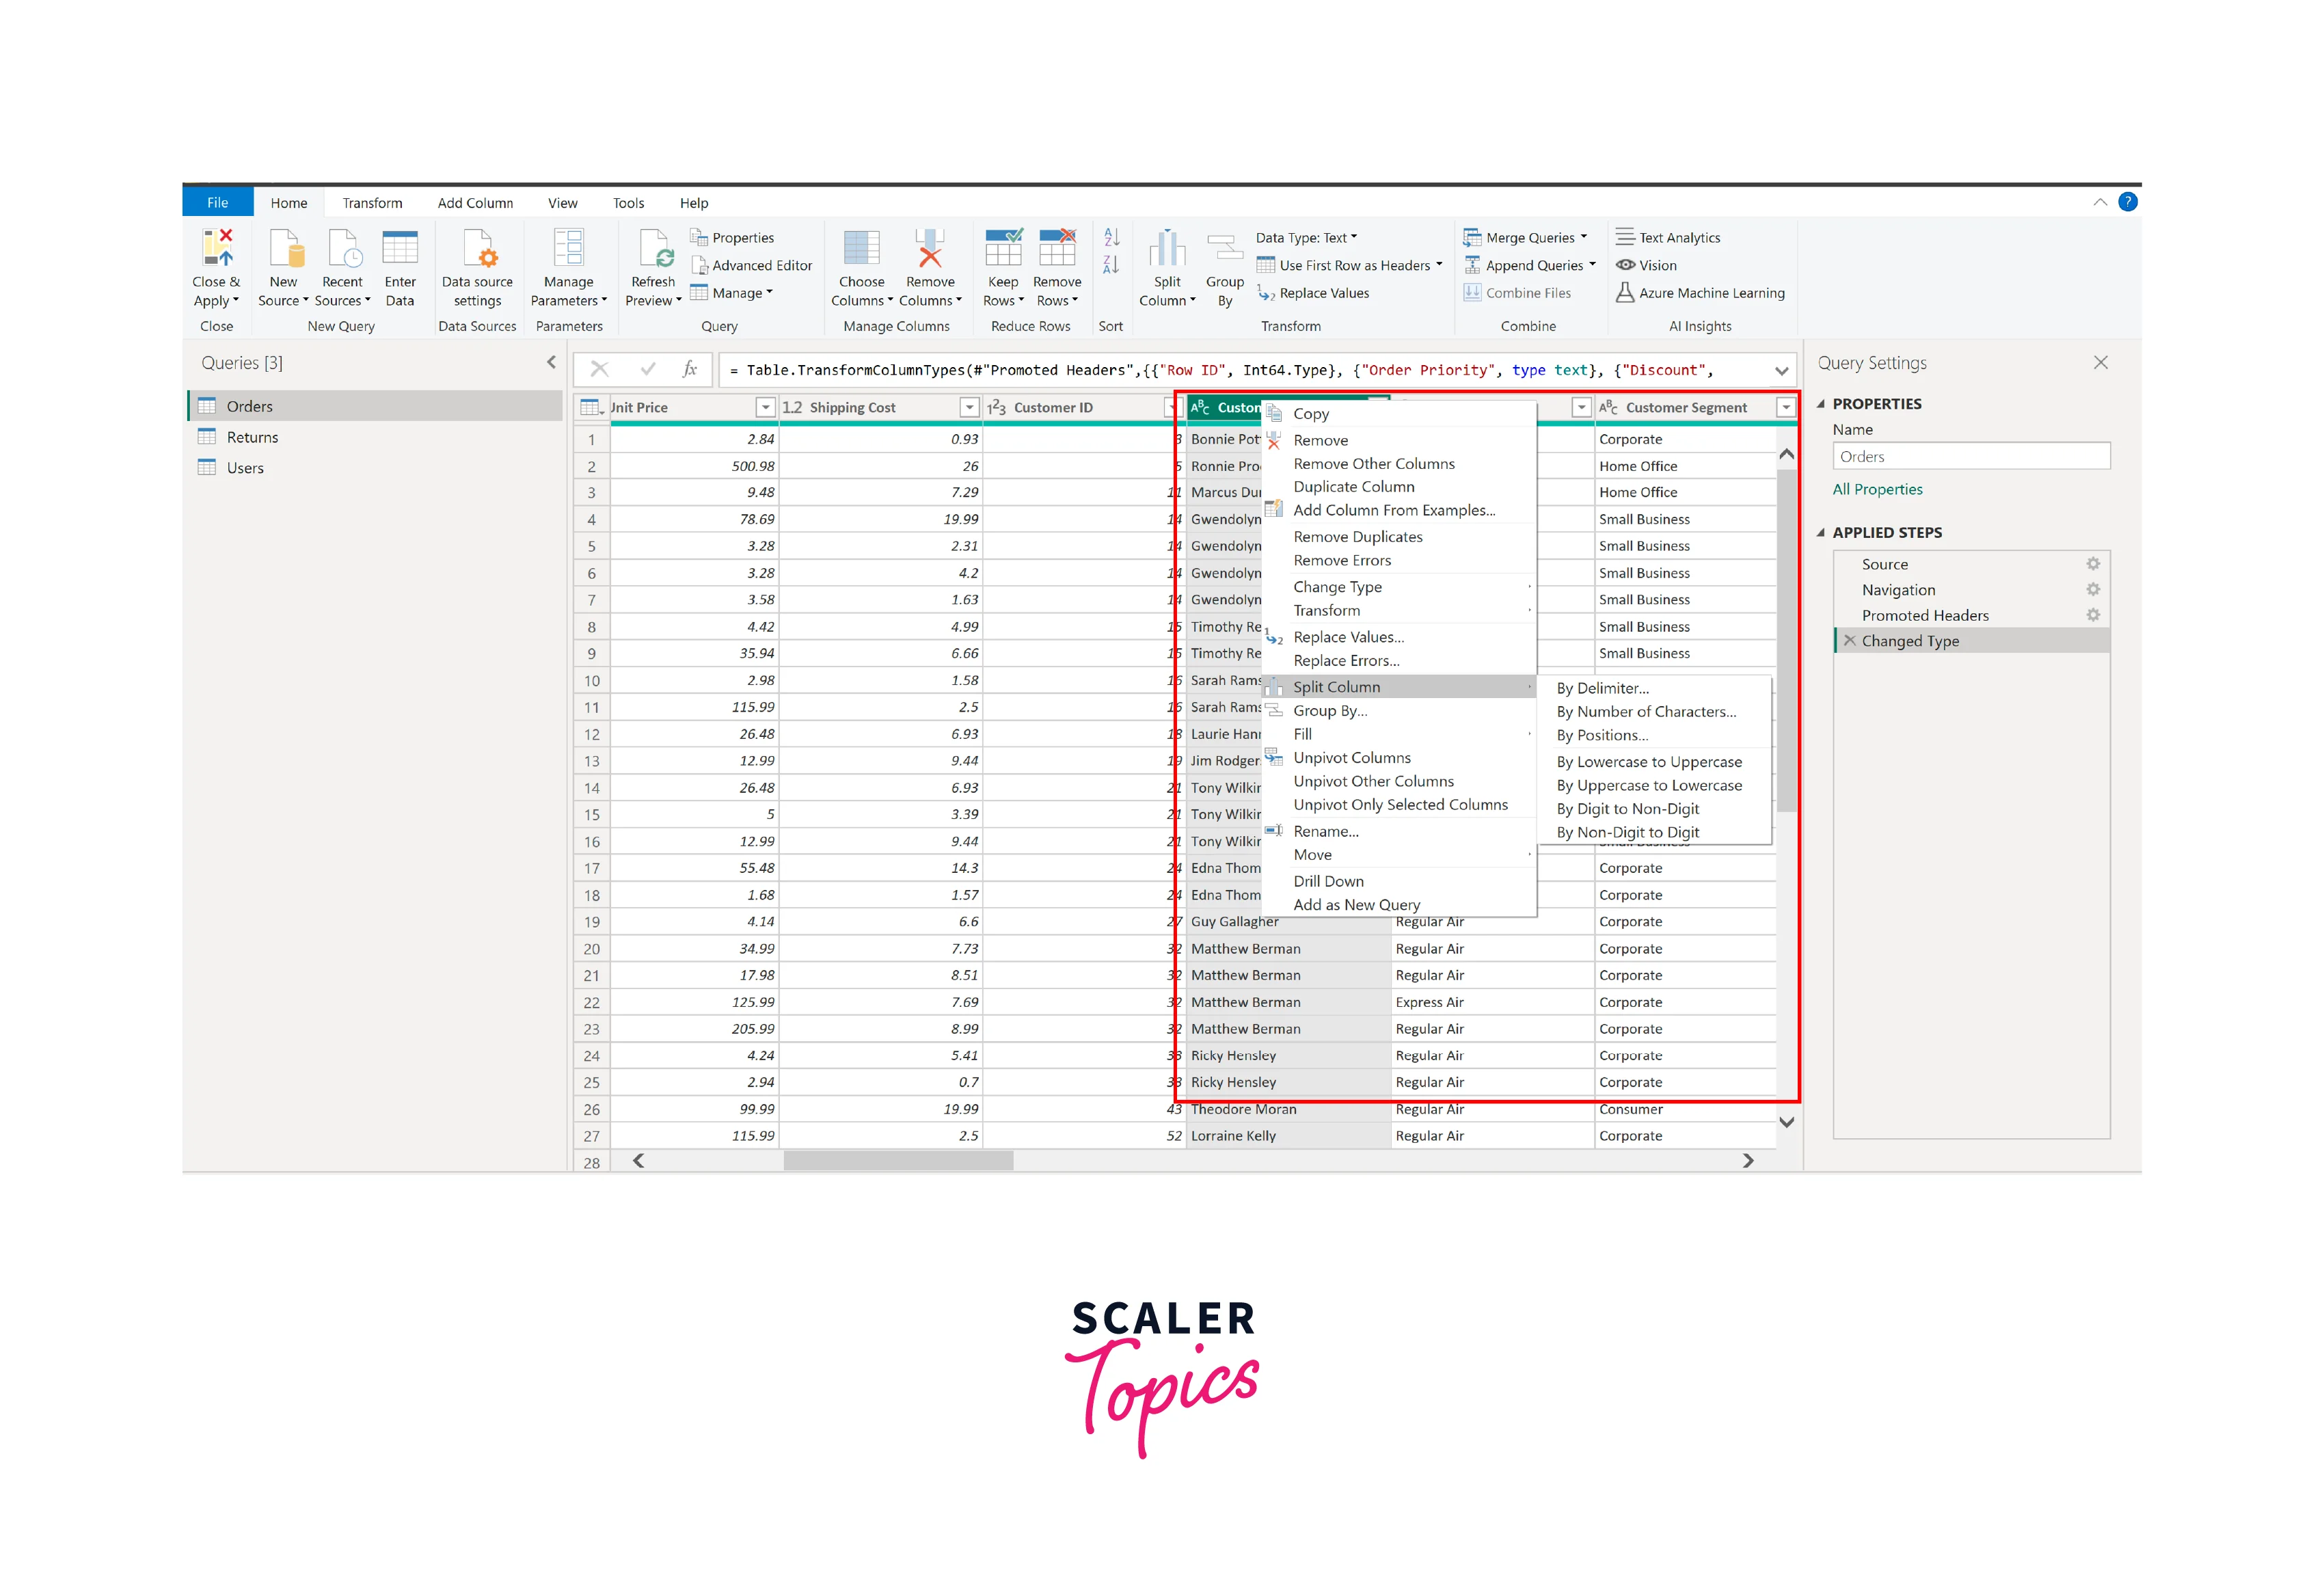
- Simply right-click the chosen column and opt for "Split Column". This action will open an additional list of various splitting choices, including options like "by delimiter" or "by a number of characters", among others.
- Configure the splitting settings based on your chosen option, specifying delimiters or character counts as necessary. Click "OK" to apply the split or extraction.
Advantages of Data Transformation in Power BI
Here are some of the key advantages of Power BI Data Transformation:
- Enhanced Data Quality:
Data transformation allows for data cleaning, filtering, and formatting, ensuring it is accurate and reliable for analysis. - Data Integration:
You can effortlessly combine and harmonize data from multiple sources, enabling comprehensive insights and reporting. - Customization:
Tailor data to specific business requirements by creating calculated columns, aggregations, and custom measures. - Consistency:
By standardizing data formats and values, transformation ensures consistent reporting and analysis across an organization. - Performance Optimization:
Data transformation helps optimize data models, leading to faster query performance and more responsive reports and dashboards. - Improved Decision-Making:
High-quality, well-structured data resulting from transformation empowers informed decision-making and strategic planning.
Conclusion
- Power BI Data Transformation is the key to unlocking actionable insights by ensuring data is clean, structured, and ready for analysis.
- Power Query Editor offers a wide range of user-friendly tools that empower both technical and non-technical users to perform essential data transformations effortlessly.
- In Power BI, you can execute a wide spectrum of data transformations, including column renaming, pivoting, NULL value removal, data type modifications, aggregation, grouping, and more.
