Introduction to Relationships in Power BI
Overview
In the dynamic world of data analysis and visualization, Power BI, a business intelligence tool developed by Microsoft, stands as a formidable tool. At its core lie relationships, the building blocks of insightful reports and dashboards. Relationships in Power BI are the crucial connections that link different data tables, enabling us to combine and analyze information effectively. In this article, we'll delve into the fundamentals of Power BI relationships, uncovering their significance, types, and how they unlock the true potential of your data. Whether you're a beginner or a seasoned data analyst, understanding these connections is the key to unlocking the full potential of your data and crafting compelling reports that drive informed decisions.
Defining Table Relationships in Power BI
In Power BI, think of your data as puzzle pieces. Each piece is a table filled with information. But to see the big picture, you need to connect the pieces, and that's where table relationships come into play.
Table relationships in Power BI are like bridges between tables. They help you combine data from different tables so you can answer important questions. For example, if you have one table with customer names and another with their orders, relationships allow you to see which customers made which orders. To define a relationship, you pick two tables and choose a common field or feature. This feature acts as the magic thread that ties the tables together. Power BI then knows how to match the data from one table with the data in another.
Identifying Relationship Cardinality (One-to-One, One-to-Many, Many-to-One, Many-to-Many)
When working with tables in Power BI relationships, it's important to understand how tables relate to each other. This understanding is known as "relationship cardinality", it comes in four flavors - one-to-one, one-to-many, many-to-one, and many-to-many.
One-to-One (1:1)
In a one-to-one relationship, each record in one table corresponds to one and only one record in another table. This type of relationship is less common but can be useful for scenarios like breaking up a large table into smaller, more manageable pieces. For instance, think of a company's employee records. Each employee has a unique employee ID, and each computer in the company also has a unique asset ID. Based on these unique IDs, you can establish a one-to-one relationship between the employee table and the computer table.
One-to-Many (1
One-to-many Power BI relationships are the most common. In this case, each record in the first table connects to multiple records in the second table, but each record in the second table relates to only one record in the first table. For example, think of a table of customers and a table of orders. One customer can have many orders, but each order belongs to only one customer. This is a one-to-many relationship.
Many-to-One (N:1)
This is the reverse of a one-to-many relationship. In a many-to-one relationship, multiple records in the first table link to one record in the second table. For instance, In a "City" and "Country" database, many cities can belong to one country, creating a many-to-one relationship, as each city is associated with a single country.
Many-to-Many (N
In a many-to-many relationship, each record in the first table relates to multiple records in the second table and vice versa. This type of relationship often requires an intermediary table, known as a "bridge" or "junction" table, to make the connections. It's commonly used for scenarios like tracking students enrolled in multiple courses, such as think of a university system. You have a "Students" table and a "Courses" table. Students can enroll in multiple courses, and each course can have multiple students. To represent this complex relationship, you create a many-to-many relationship using an intermediary "Enrollments" table. This table holds records of student-course pairings, connecting students to the courses they are enrolled in.
Types of Relationships in Power BI
In this section, we'll explore the three key aspects of Power BI relationships - Direct Relationships, Cross-Filter Direction and Behavior, and the concept of Multiple Relationships between Tables. Understanding these relationship types is fundamental to crafting robust and flexible data models in Power BI.
Direct Relationships
- Direct relationships in Power BI are straightforward connections between two tables. These relationships allow you to link tables based on one or more common fields.
- For example, you can establish a direct relationship between a "Sales" table and a "Products" table using a common field like "ProductID". This allows you to analyze sales data alongside product details.
Cross-Filter Direction and Behavior
-
Cross-filtering in Power BI determines how filters applied in one table affect related tables in the relationship.
-
There are two cross-filter directions: "Single" and "Both". In a "Single" direction, filters flow from one table to the related table, but not the other way around. In a "Both" direction, filters flow in both directions.
-
For example, if you have a "Customers" table and an "Orders" table with a "Many-to-One" relationship, applying a filter to select a specific customer will also filter the related orders. If the cross-filter behavior is set to "Both", selecting an order will also filter the list of customers to show only the customer who placed that order.
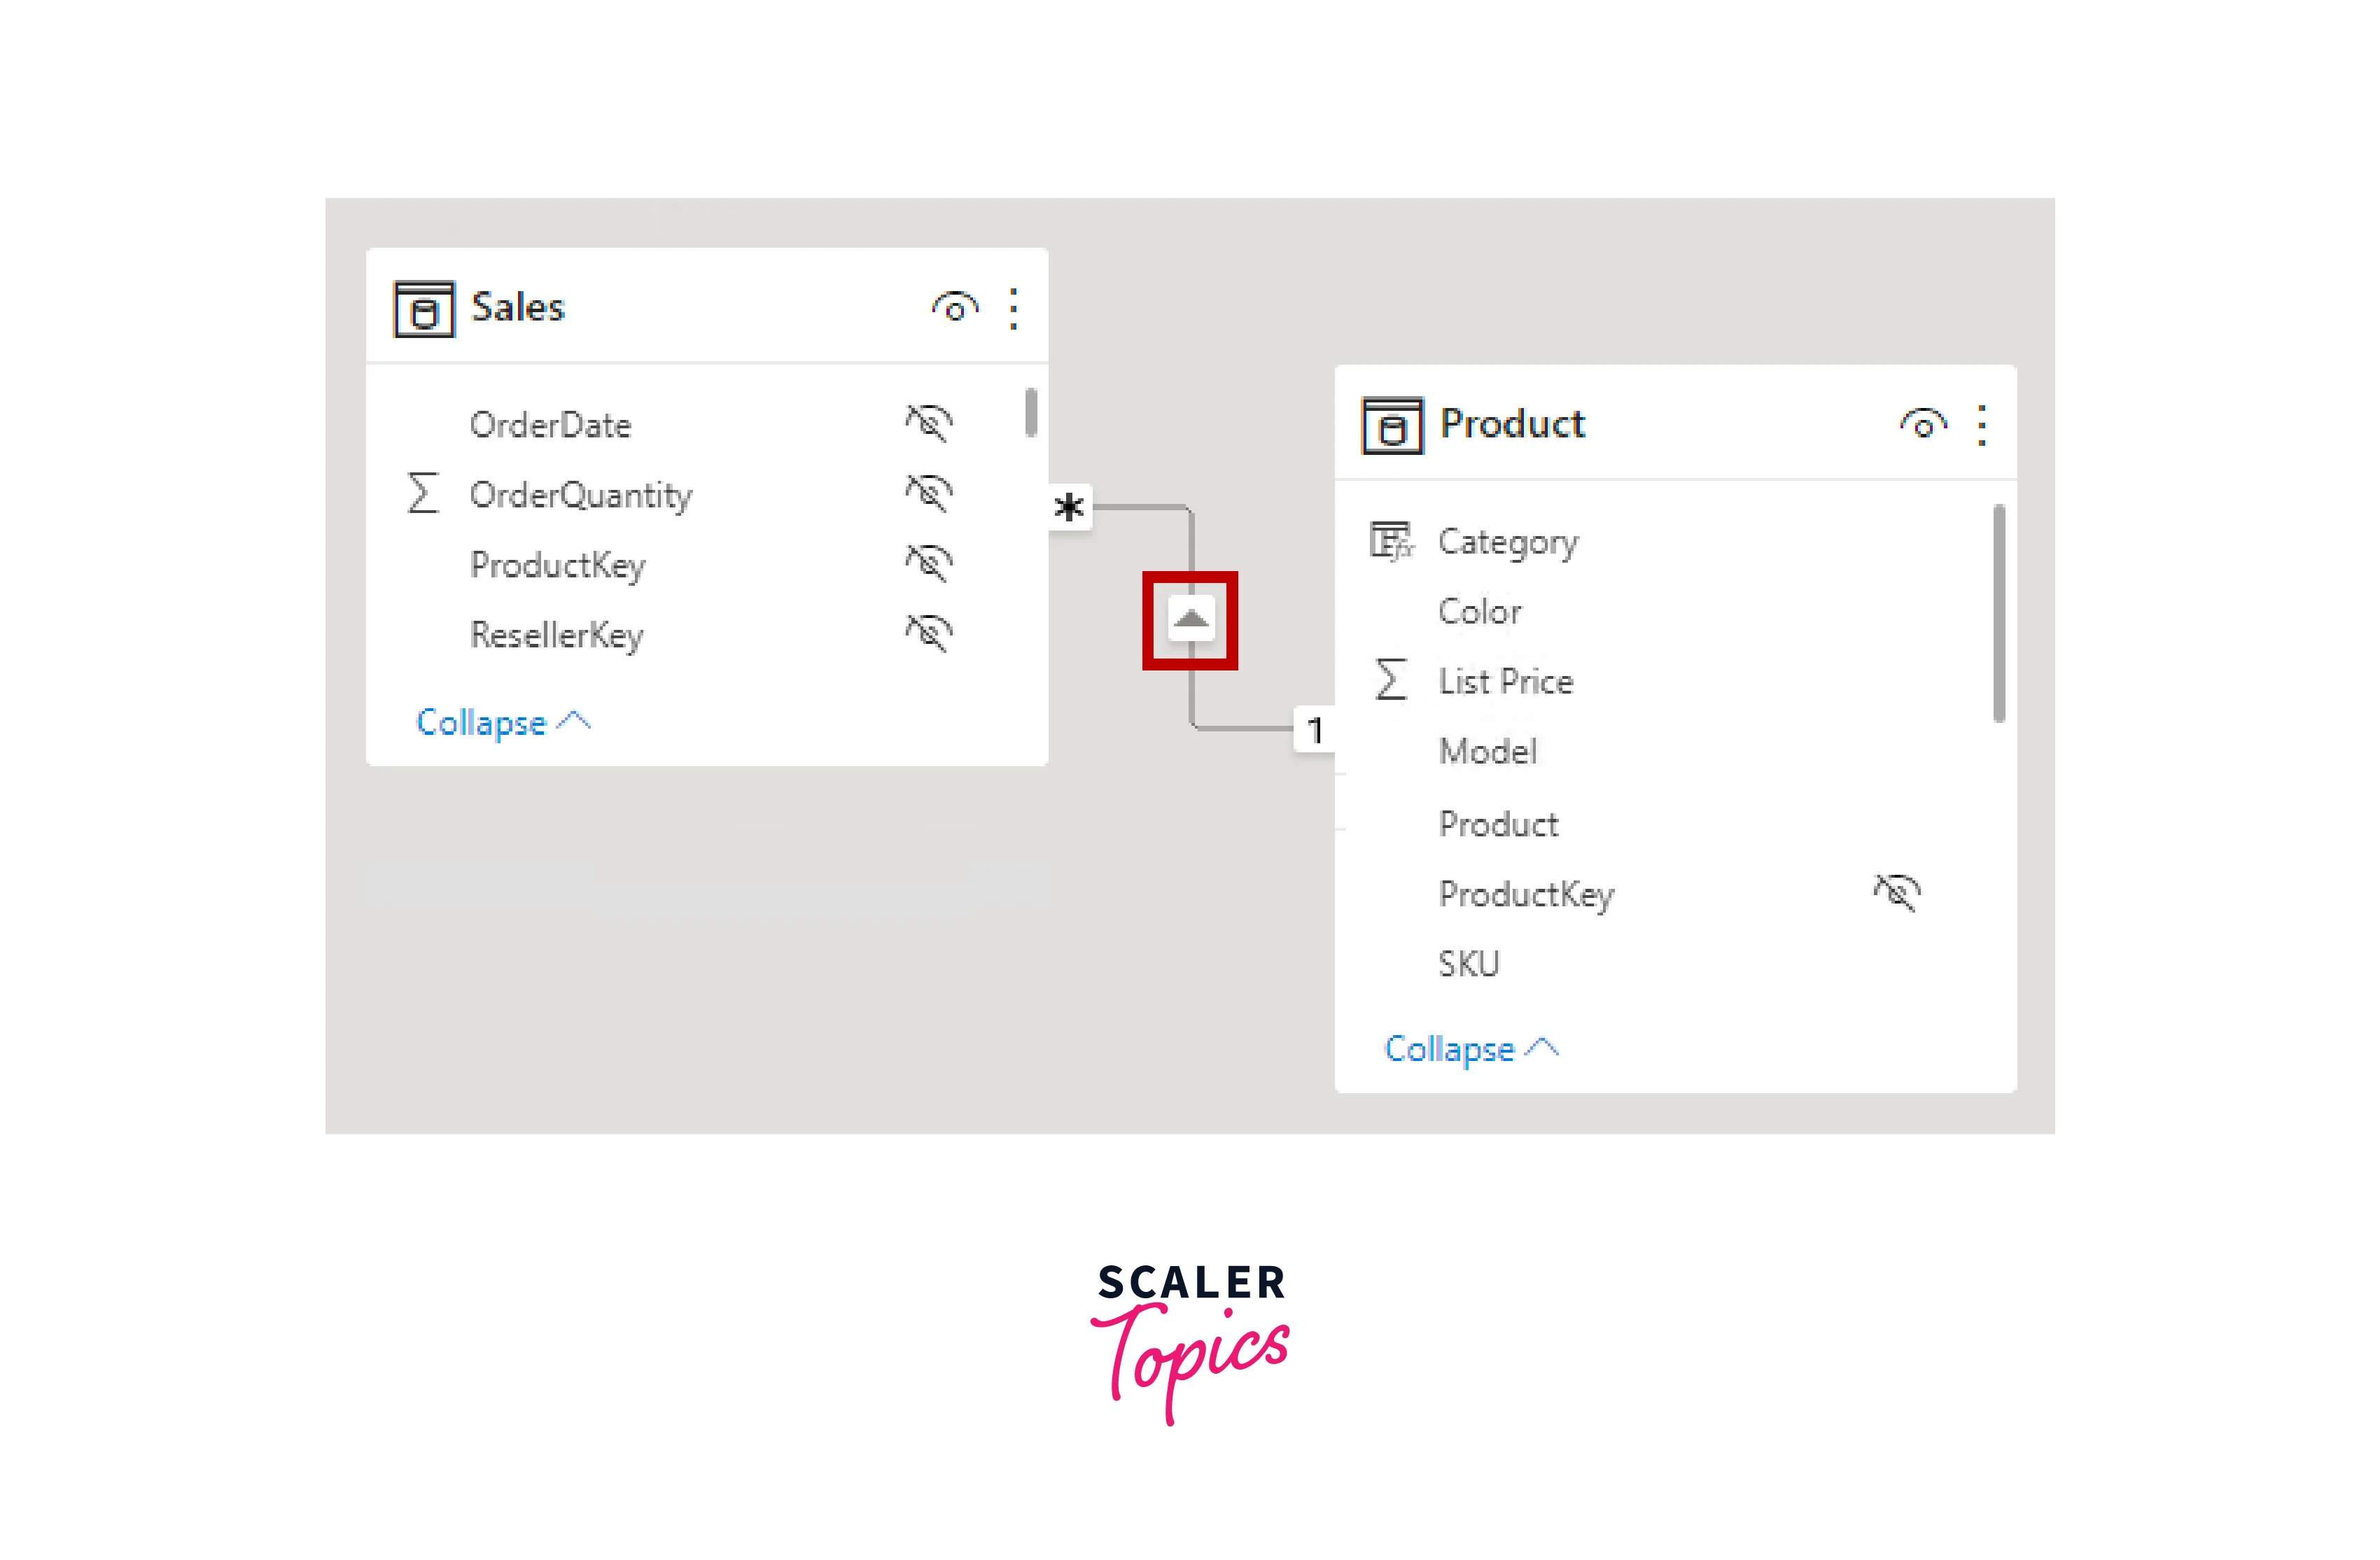
-
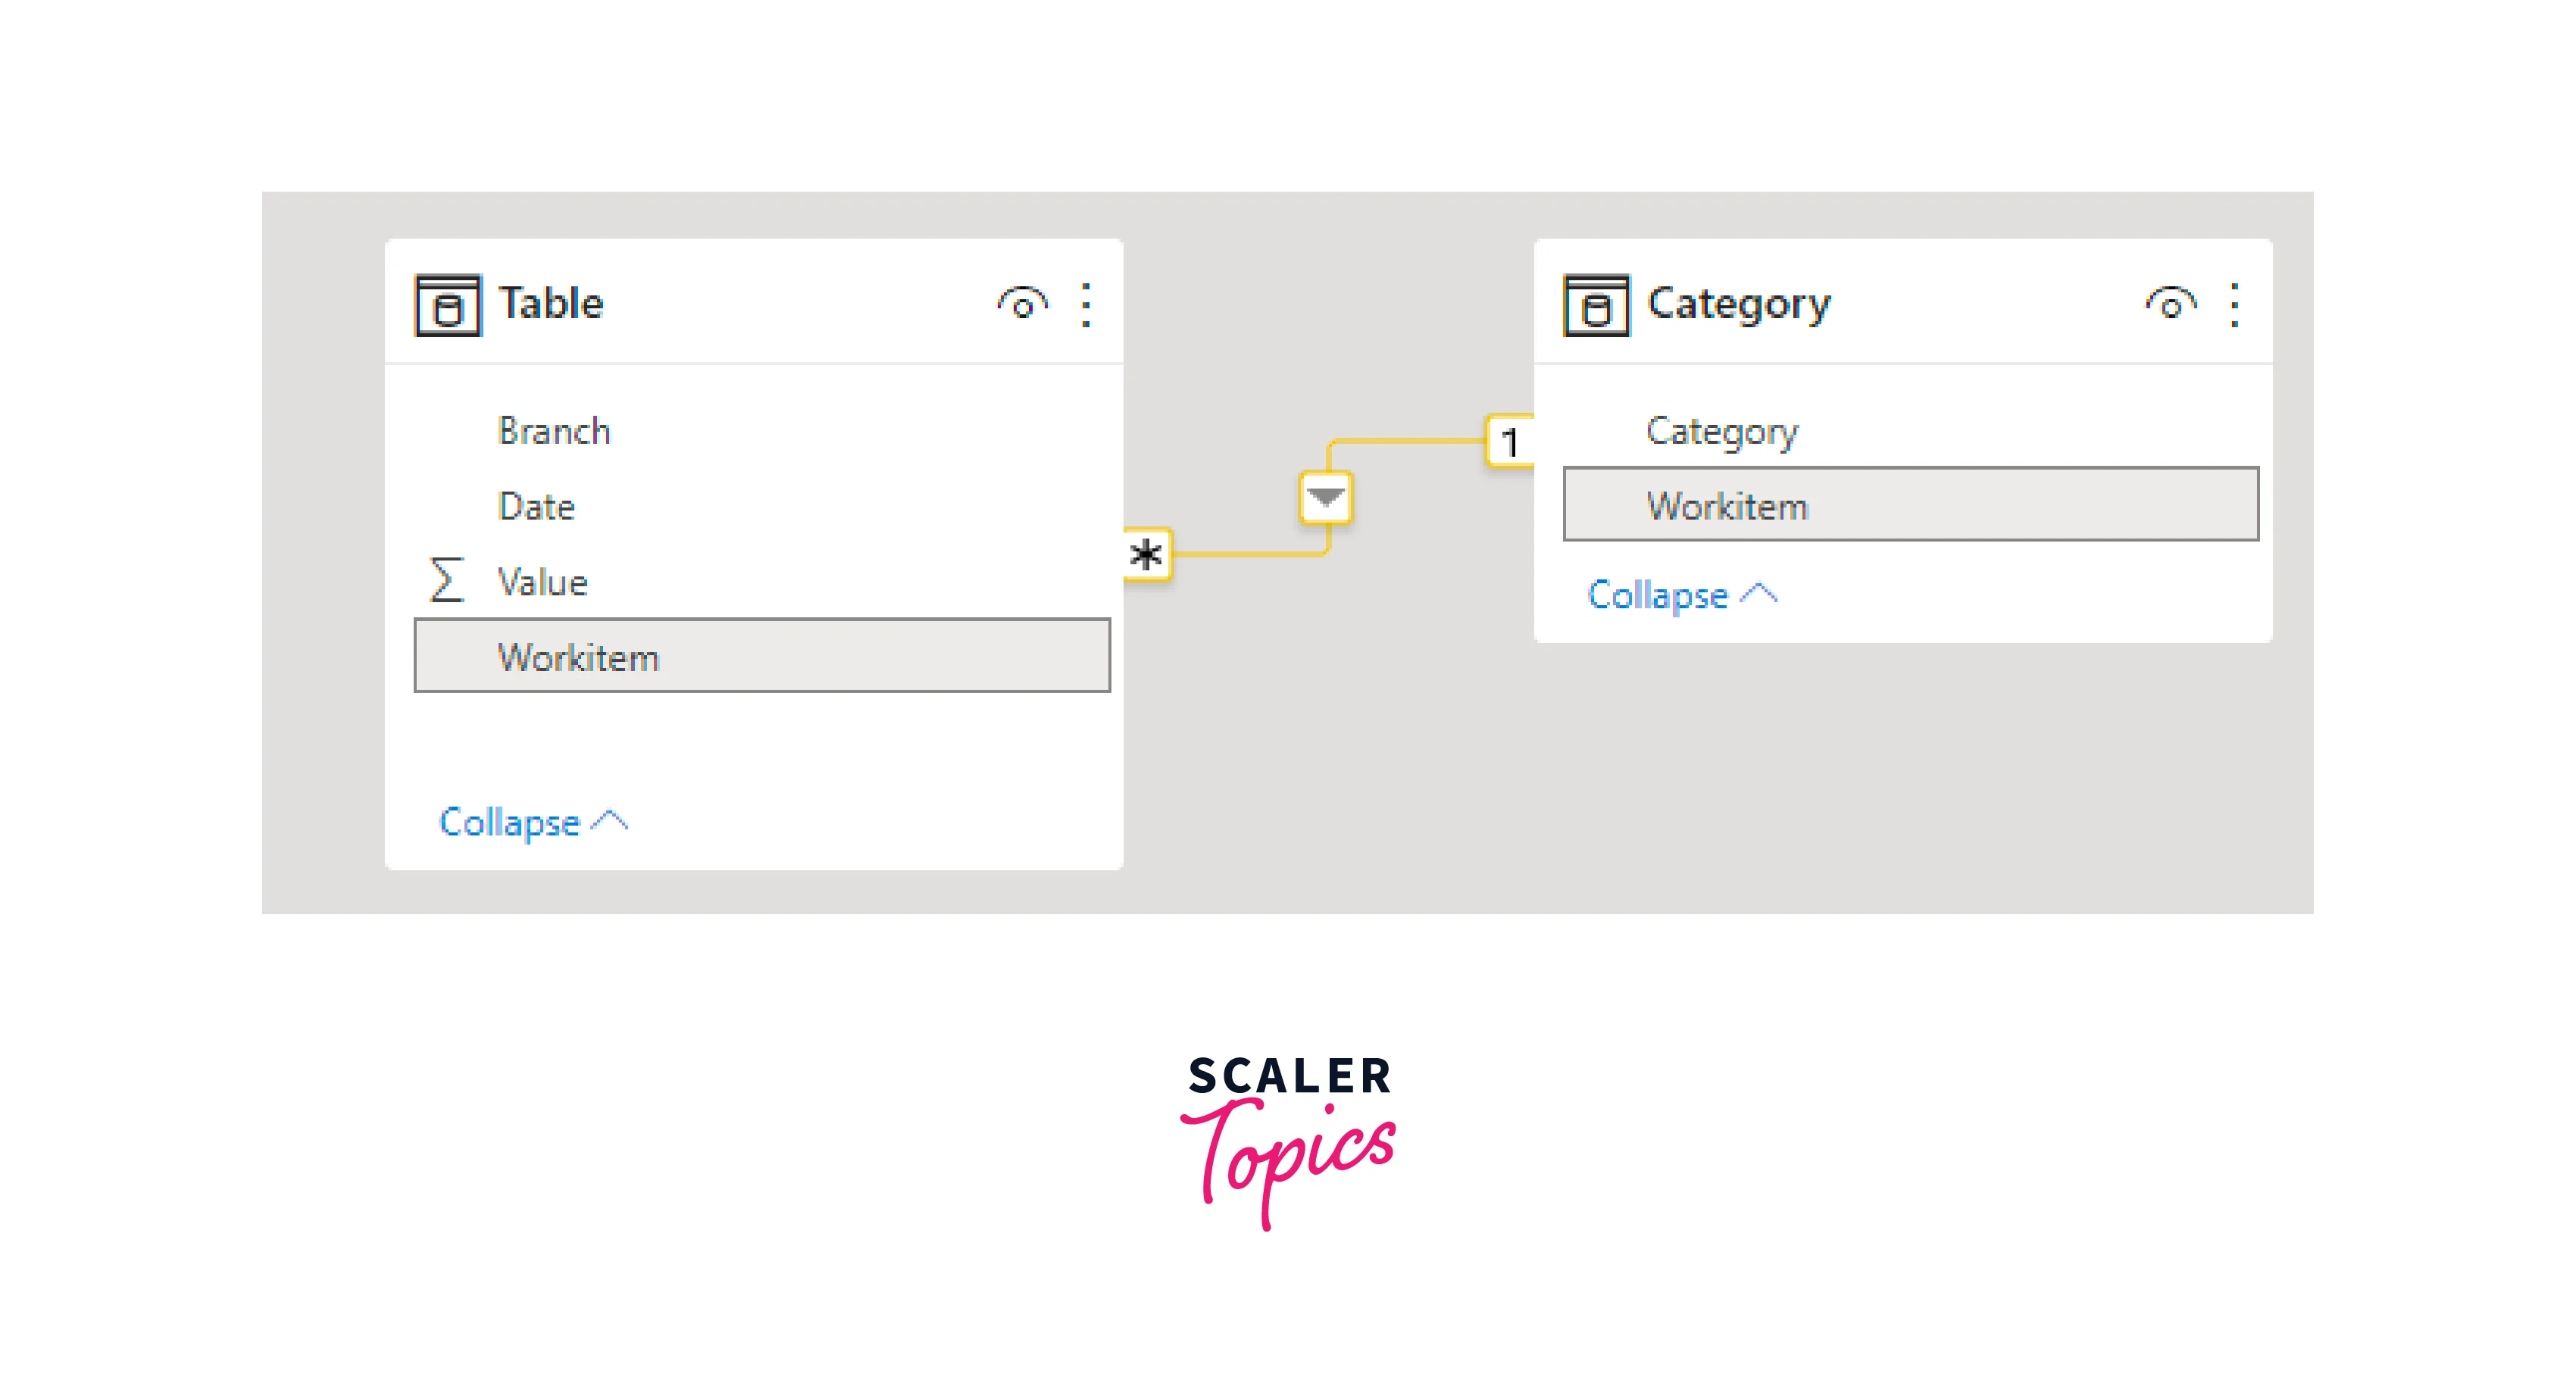
The below figure illustrates how to check the cross-filter direction in Power BI relationships:
Multiple Relationships between Tables
- Power BI allows you to create multiple relationships between the same two tables, each serving a different purpose. This is particularly useful when dealing with scenarios where you want to connect tables in various ways.
- For instance, in a data model containing "Employees" and "Managers", you can create one relationship based on the direct reporting structure (e.g., EmployeeID to ManagerID) and another relationship for a mentorship program (e.g., EmployeeID to MentorID). This enables you to analyze employee-manager relationships from different angles.
Common Scenarios for Using Relationships
This section will explore common scenarios where Power BI relationships are utilized, from seamlessly merging data to enabling dynamic drill-down analysis and empowering interactive cross-filtering and slicers. Understanding these scenarios is essential for harnessing the true power of Power BI in your data-driven endeavors.
Combining Data from Different Tables
Power BI relationships are the backbone of data integration. They allow you to merge information from separate tables into a single cohesive dataset. For example, you might have a "Sales" table and a "Customers" table. By establishing a relationship between them using a common field like "CustomerID", you can combine sales data with customer details, creating a comprehensive view of your sales performance.
Enabling Hierarchical Drill-Down Analysis
The hierarchical analysis involves exploring data at different levels of detail. Power BI relationships help you navigate through these levels smoothly. Consider a "Product Categories" table linked to a "Products" table. By using Power BI relationships, you can create hierarchical drill-down visuals, allowing users to start with high-level category data and then delve deeper into specific products within those categories.
Facilitating Cross-Filtering and Slicers
Cross-filtering and slicers are powerful tools for interactive data exploration and analysis. Relationships enable cross-filtering, where selecting an item in one visual (e.g., a specific category) automatically filters related visuals (e.g., showing only products within that category). Slicers, which are filter controls, are made possible by relationships. For instance, you can add a slicer to filter data by a specific region, and it will affect all visuals connected to the same data model through relationships.
Managing Relationships in Power BI
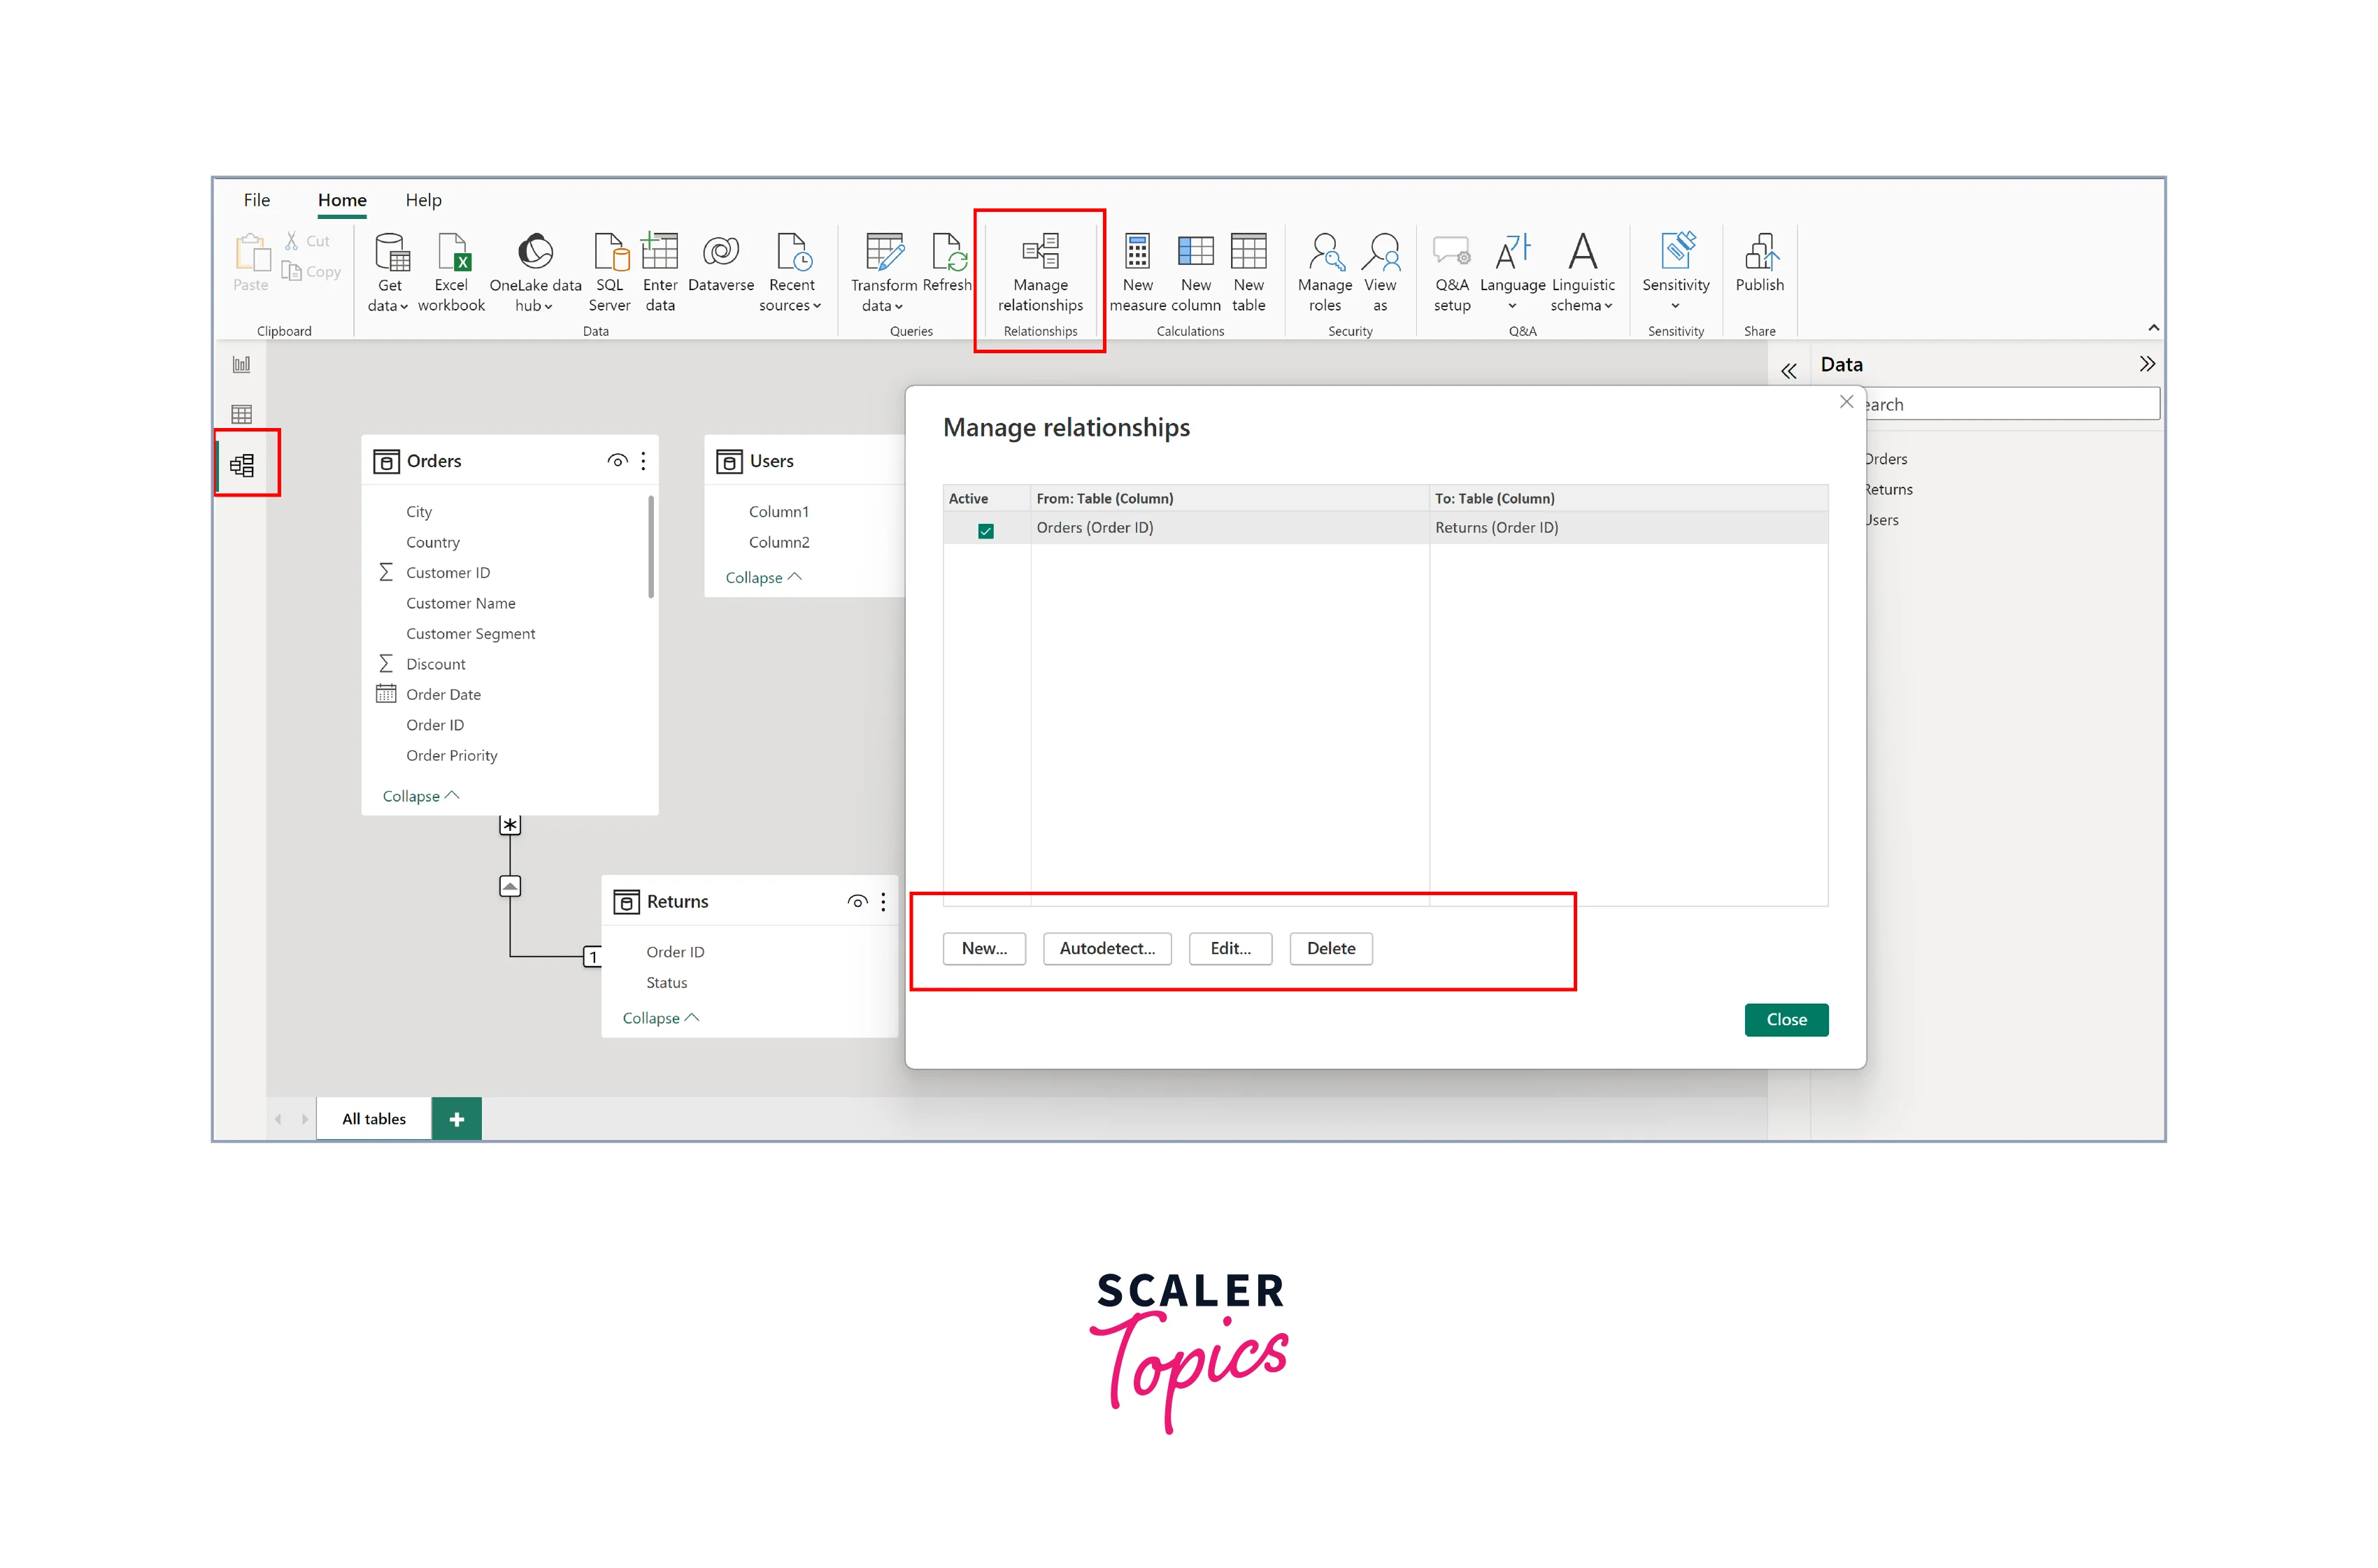
To manage Power BI relationships, you can follow the below steps:
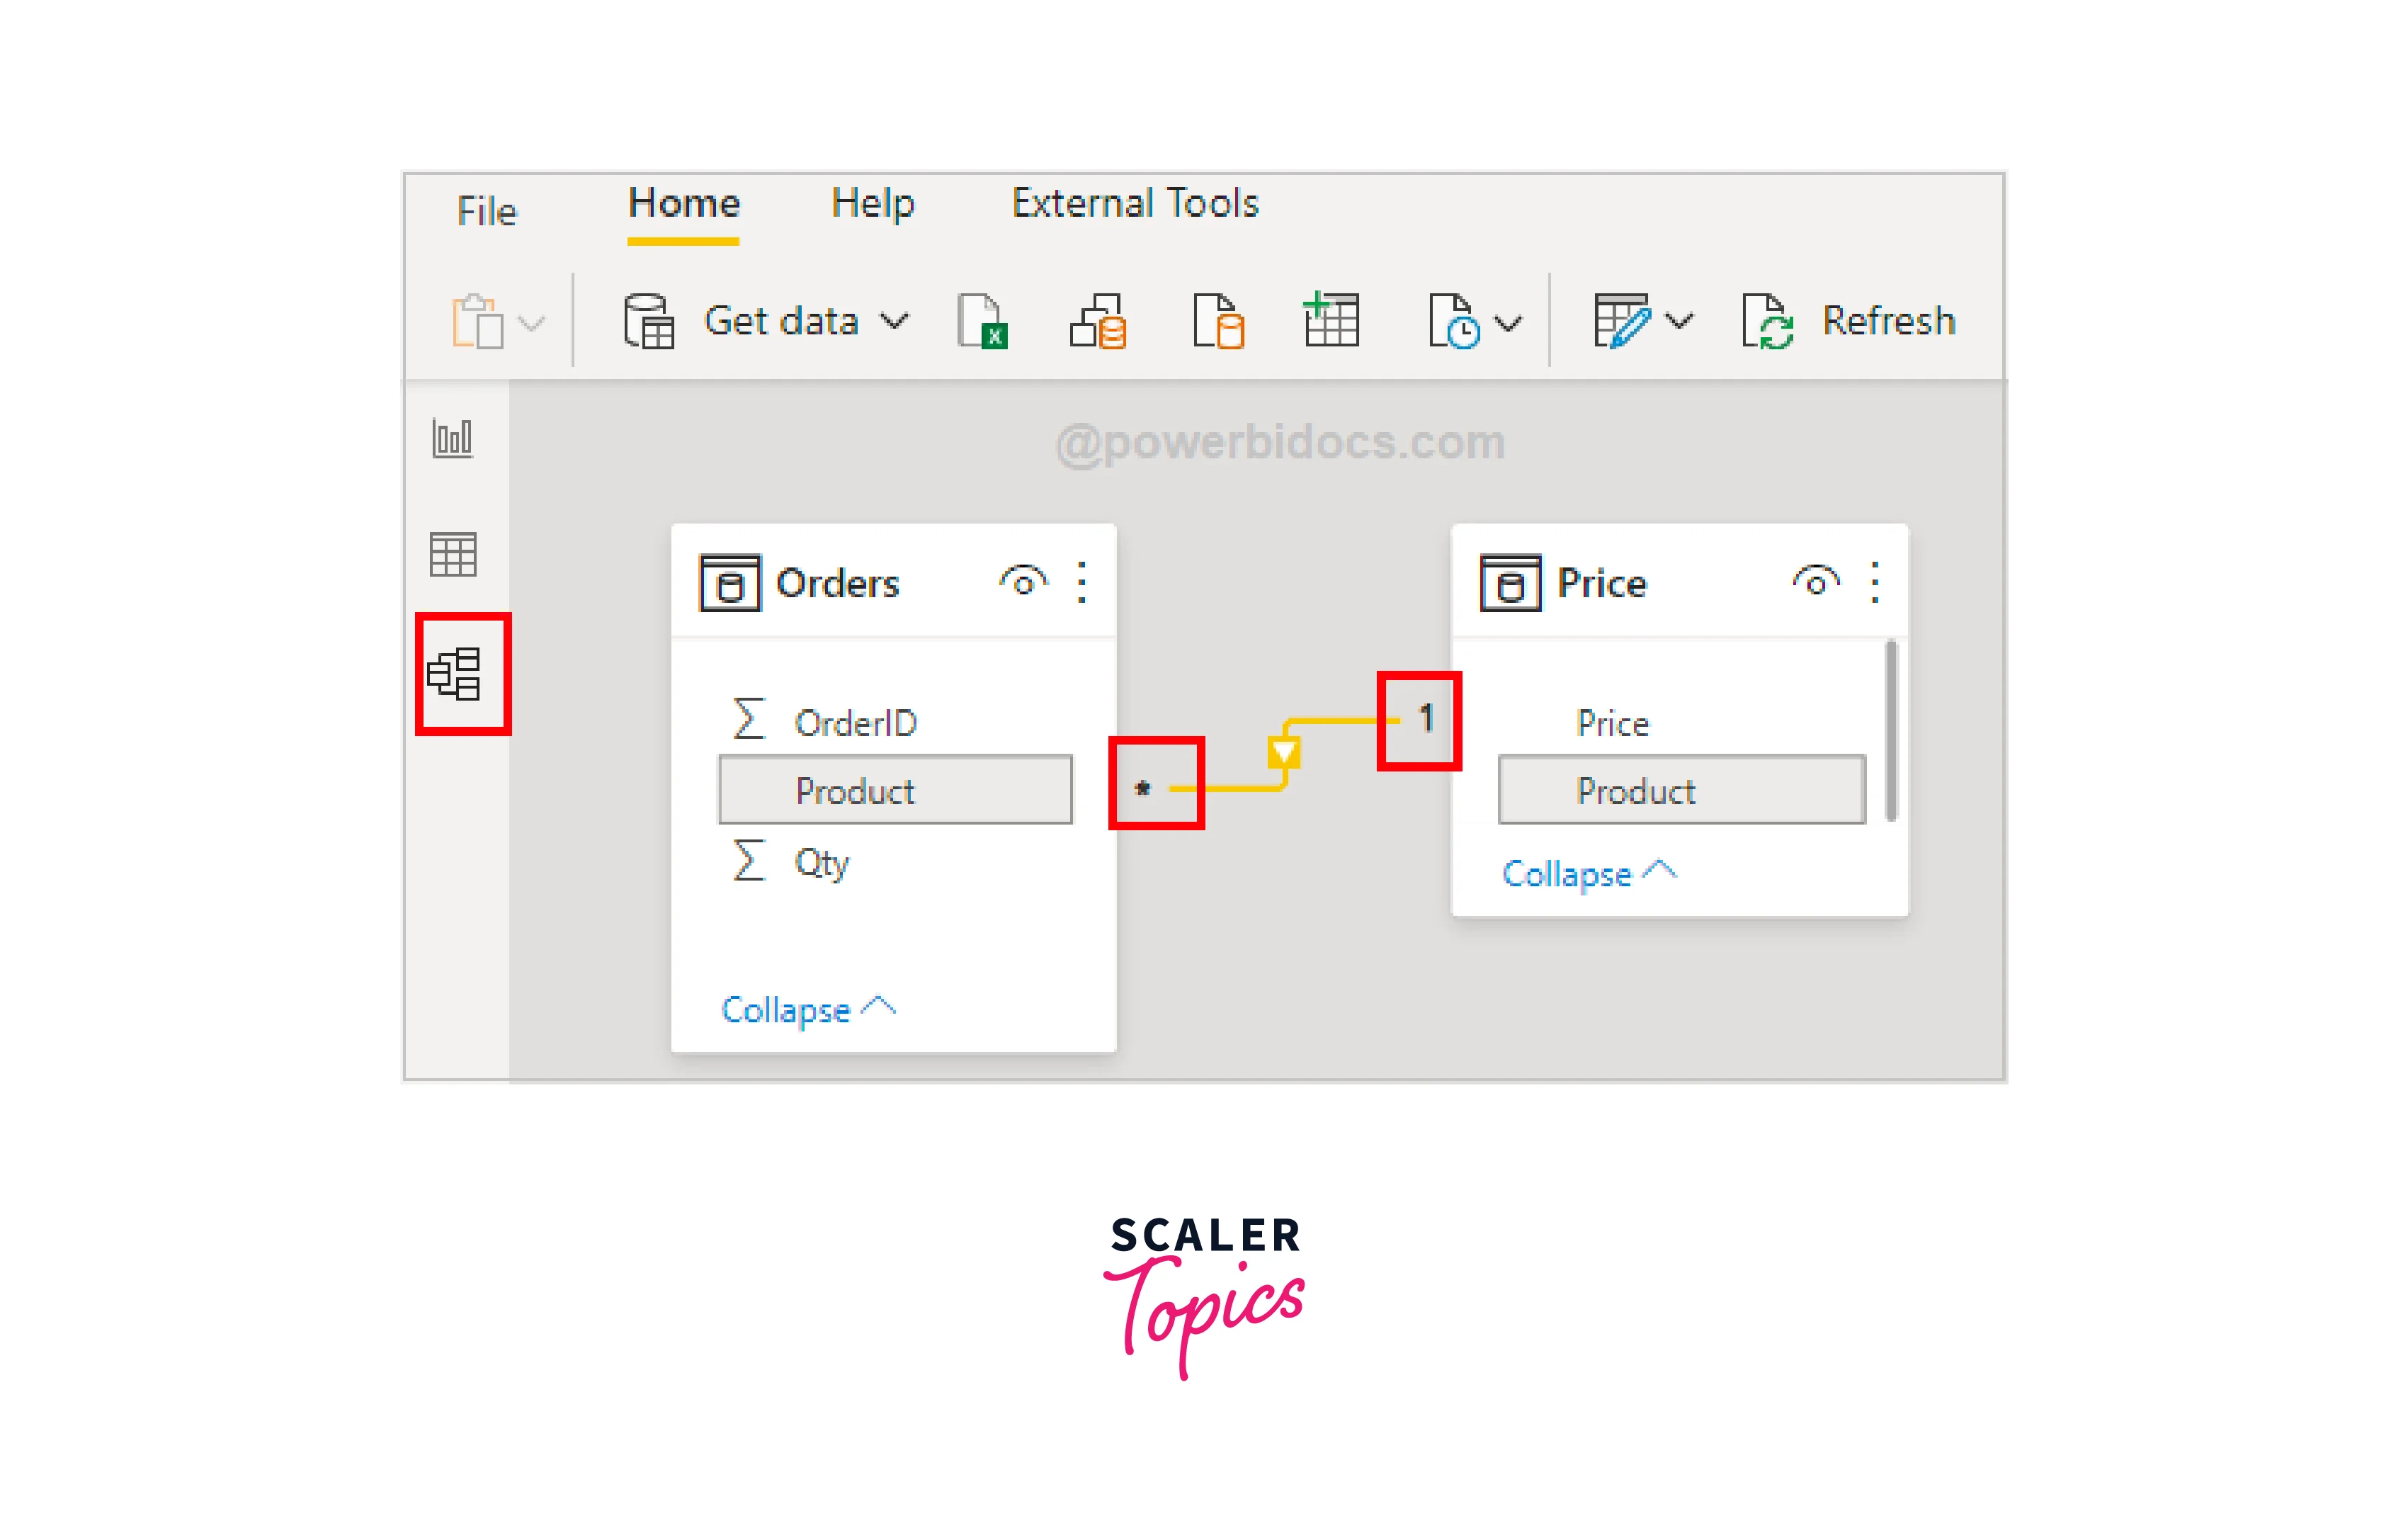
- In Power BI Desktop, go to the "Model" view by clicking the "Model" icon in the left-hand sidebar. Here, you'll see a visual representation of your data model with tables and their relationships.
- To edit or create Power BI relationships, click the "Manage Relationships" button in the toolbar. You can add, edit, or delete relationships from this interface. Specify the related fields, cardinality, and cross-filter direction as needed.
Editing and Modifying Existing Relationships
In the dynamic world of data analysis, Power BI relationships may need adjustments to fit changing requirements. Power BI allows you to edit and modify existing relationships flexibly. Whether you need to change the related fields, switch between single and both cross-filter directions, or adjust cardinality, you have the tools to adapt relationships to evolving data models. This ensures your data connections remain relevant and accurate as your analysis needs to evolve.
Removing and Deleting Relationships
Not all Power BI relationships are permanent, and sometimes you need to remove or delete them. Power BI offers straightforward options to do just that. Removing a relationship temporarily disables it while deleting a relationship permanently removes it from your data model. This flexibility empowers you to maintain a clean and efficient data model by eliminating unnecessary or outdated relationships that no longer serve your analysis goals.
Handling Errors and Inconsistent Data
Managing Power BI relationships isn't always smooth sailing. Errors and inconsistencies can arise in your data. Power BI provides mechanisms to handle these challenges. When data discrepancies occur, you can use features like "Manage Relationships" and "Modeling Tools" to troubleshoot and resolve issues. This section explores how to identify, diagnose, and rectify common problems, ensuring that your relationships stay robust even in the face of data imperfections.
Conclusion
- Power BI relationships are the crucial links that transform scattered data tables into powerful tools for analysis and visualization.
- Understanding the types of relationships, cross-filtering, and common scenarios unlock the full potential of Power BI, allowing you to merge data, drill into hierarchies, and create interactive reports.
- The ability to edit, remove, and handle relationship errors ensures that your data connections remain agile, adaptable, and resilient in the face of evolving data requirements.