Power BI Architecture
Overview
Power BI, a powerful business intelligence tool developed by Microsoft, revolutionizes data analysis and visualization. With its robust architecture, Power BI empowers organizations to extract valuable and actionable insights from vast amounts of data, transform them into meaningful visualizations, and make data-driven decisions.
What is Power BI?
Power BI is a business intelligence and data visualization tool developed by Microsoft. It enables organizations to connect to a variety of data sources, transform raw data into meaningful insights, and create interactive visualization dashboards and reports. With its user-friendly interface and powerful analytical capabilities, Power BI empowers organizations to make data-driven decisions and gain valuable insights into their business operations.
Why Power BI?
Below are a few of the top reasons why organizations should go for Power BI for their BI needs:
- User-friendly interface:
Power BI offers an intuitive and user-friendly interface, making it accessible to users with varying levels of technical expertise. - Data connectivity:
It provides seamless connectivity to a wide range of data sources, including databases, cloud services, Excel files, and more, allowing users to consolidate and analyze data from multiple sources. - Advanced data visualization:
Power BI enables the creation of visually appealing and interactive dashboards, reports, and charts, making it easy to explore and understand data trends and patterns. - Collaboration and sharing:
It supports collaborative data analysis and sharing capabilities, allowing professionals to collaborate on reports and dashboards in real-time and share insights with stakeholders across the organization.
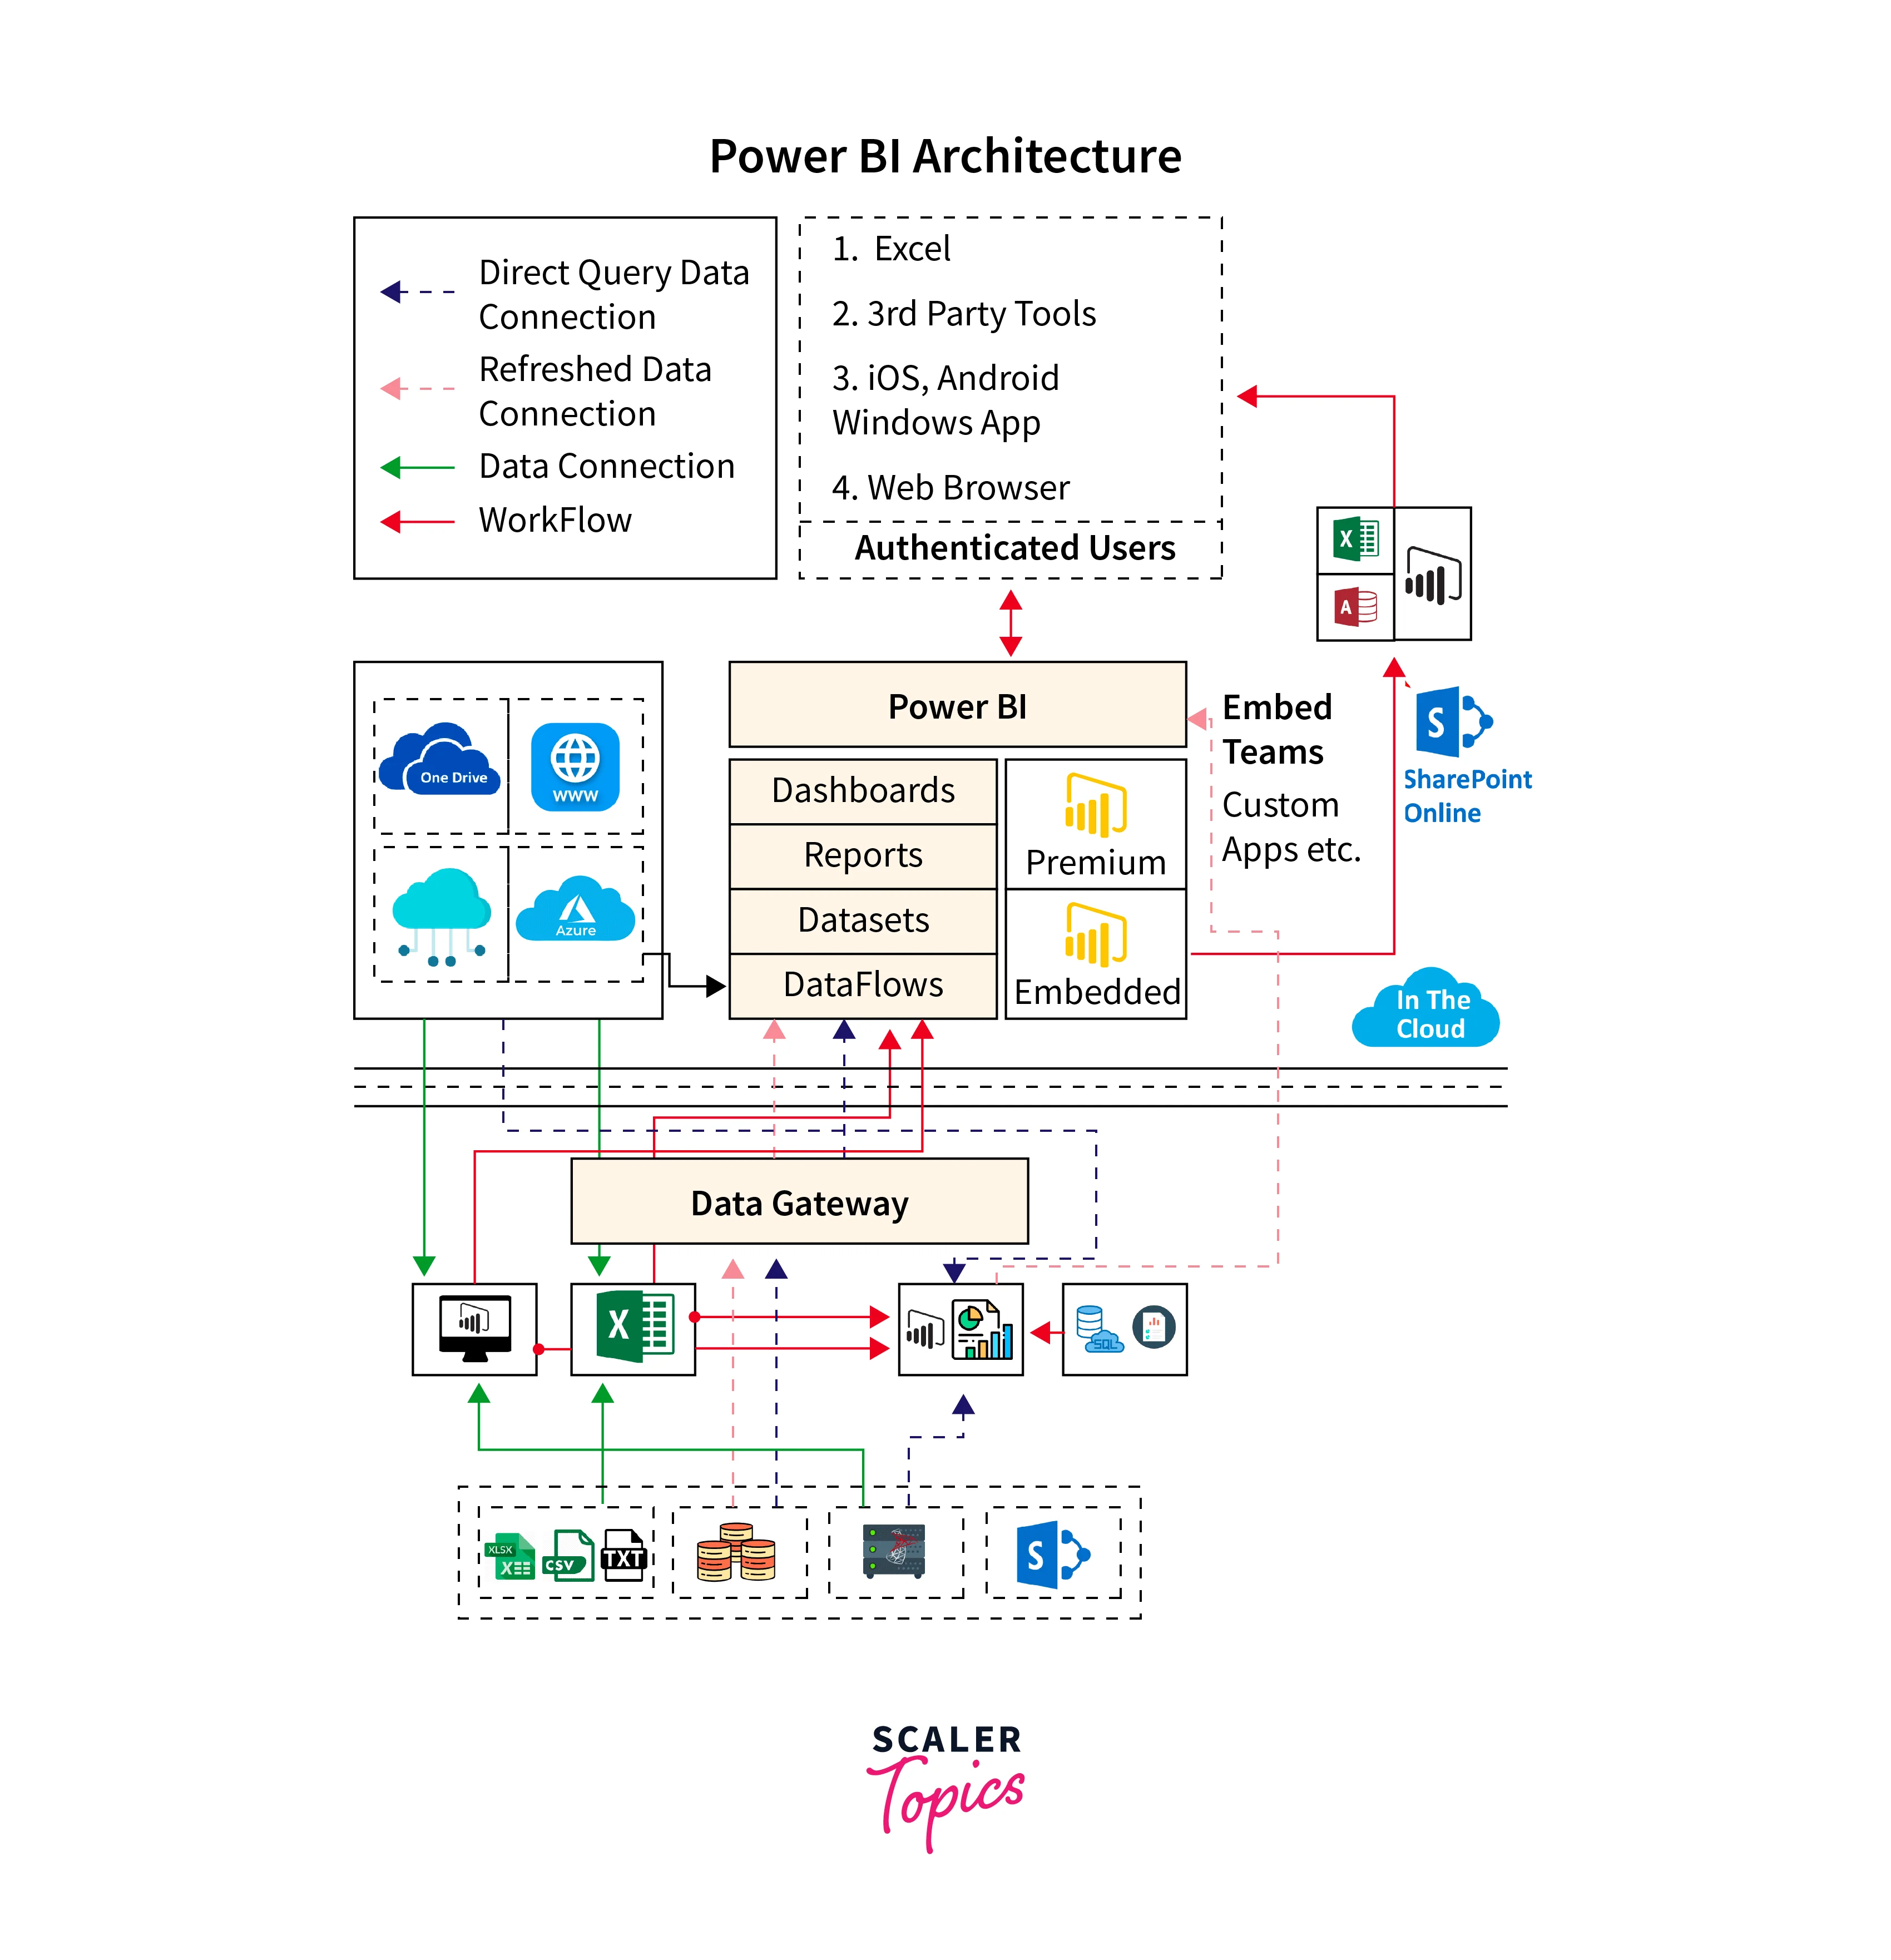
Power BI Architecture
- Power BI architecture consists of multiple layers that work together to deliver its comprehensive functionality.
- At the core is the Power BI service, a cloud-based platform that acts as the central hub for data storage, sharing, and collaboration.
- The data sources layer encompasses connectors that enable Power BI to connect to various data sources, including databases, cloud services, and files.
- The data transformation layer involves Power Query, which facilitates data extraction, transformation, and modeling.
- Finally, the visualization layer leverages Power View and Power Map to generate interactive visualizations and reports.
- This multi-layered architecture enables users to seamlessly extract, transform, model, and visualize data, providing a comprehensive business intelligence solution.
Components of Power BI
Below are the major components part of Power BI architecture. These components of Power BI work together to provide a comprehensive and flexible business intelligence solution, enabling data analysis, visualization, collaboration, and mobile access across different platforms and deployment scenarios.
- Data Sources:
Power BI supports a wide range of data sources, including databases, cloud services, files, and online services. It provides connectors that allow users to connect to these data sources and extract the data for analysis and visualization in Power BI. The most commonly utilized data sources include Excel, Text/CSV, XML, JSON, Oracle Database, IBM DB2 Database, MySQL Database, PostgreSQL Database, Teradata Database, SAP Business Warehouse server, Amazon Redshift, Azure SQL Database, etc. - Power BI Desktop:
Power BI Desktop is a Windows application that allows users to create and design interactive reports and visualizations. It provides powerful data modeling, transformation, and visualization tools, enabling users to build comprehensive reports using a drag-and-drop interface. - Power BI Service:
Power BI Service, also known as Power BI Online, is a cloud-based platform where users can publish, share, and collaborate on reports and dashboards created in Power BI Desktop. It provides web-based access to reports, allows for real-time collaboration, and offers additional features like data refresh and scheduled report delivery. - Power BI Report Server:
Power BI Report Server is an on-premises solution allowing organizations to host Power BI reports within their infrastructure. It provides a way to share reports internally while securely maintaining data privacy and control. - Power BI Gateway:
Power BI Gateway acts as a bridge between on-premises data sources and Power BI Service. It enables secure data transfer between the two environments, allowing users to refresh data in Power BI reports from on-premises sources and ensuring data remains up to date. - Power BI Mobile:
Power BI Mobile is a mobile application available for iOS and Android devices. It allows users to access and view their Power BI reports and dashboards on the go, providing a responsive and optimized experience for mobile devices. - Power BI Embedded:
Power BI Embedded is a developer offering that allows developers to integrate Power BI capabilities into their applications. It provides APIs and SDKs for embedding reports and dashboards, enabling users to interact with Power BI content within other applications seamlessly. - Power Pivot:
Power Pivot is an in-memory data modeling component of Power BI that allows users to create sophisticated data models within Power BI Desktop. It enables the creation of relationships between tables, the definition of calculated columns and measures, and the handling of large datasets for efficient analysis.
Working on Power BI Architecture
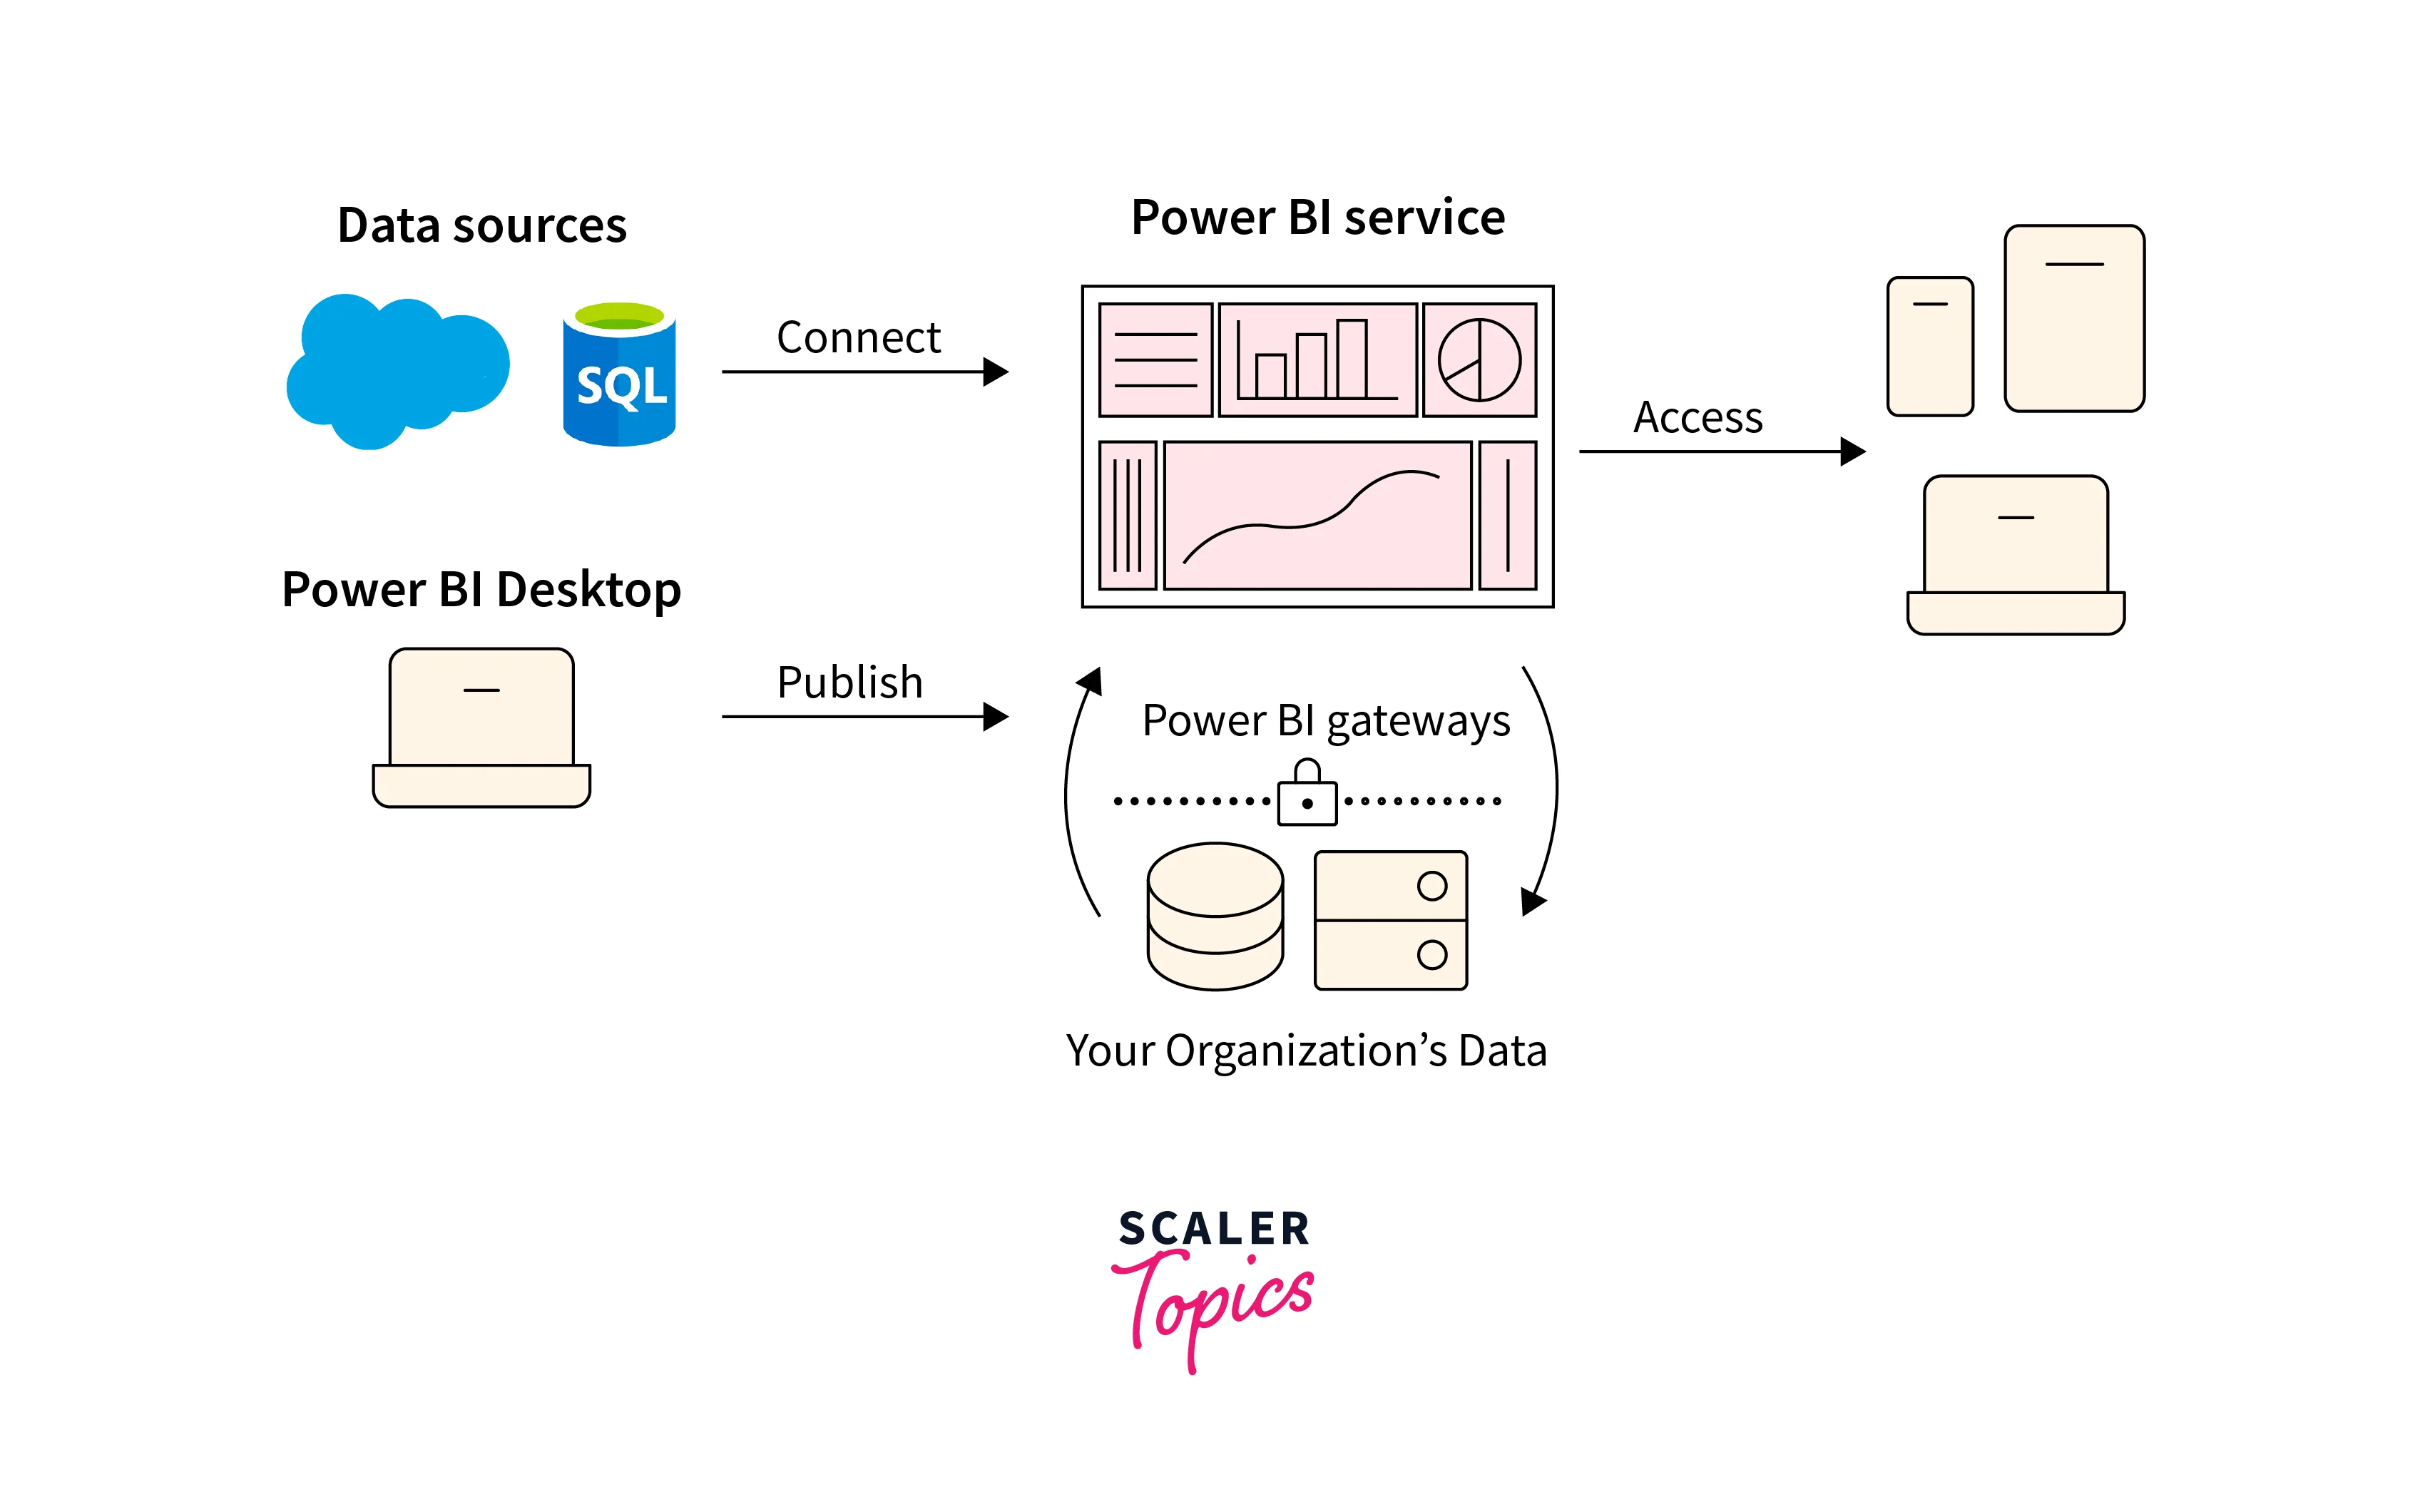
The working of Power BI architecture involves the interaction between on-cloud and on-premises services, facilitating the flow of data from various sources to the Power BI components. Here's how it works:
- On-premises:
In this part of the architecture, reports created in Power BI Desktop can be published to the Power BI Report Server. The Power Publisher tool enables users to publish Excel workbooks to the Report Server, where they can create datasets, paginated reports, mobile reports, and more. The published reports are then distributed to end-users, allowing them to access and view the reports. - On-cloud:
The on-cloud part of the Power BI architecture involves various components and services. Data sources such as web browsers, Excel sheets, and other sources feed information to the Power BI components. Power BI offers a wide range of data sources, including direct connections, in-house servers, and cloud databases. These data sources are connected to the Power BI tools. - Power BI Gateway:
The Power BI Gateway plays a crucial role in the architecture by acting as a bridge between on-premises data sources and on-cloud servers or applications. It enables secure and efficient data transfer from on-premises sources to the cloud. The Gateway ensures that data remains up to date and allows users to refresh data in Power BI reports from on-premises sources. - On-cloud Components:
The cloud part of the architecture consists of various components, including dashboards, datasets, reports, and Power BI Embedded. Dashboards provide visual representations of data, while datasets store the transformed and modeled data for analysis. Reports are created using Power BI Desktop and published to the cloud for viewing and sharing. Power BI Embedded allows developers to integrate Power BI capabilities into their applications.
Features of Power BI
Power BI offers a range of powerful features that enhance data analysis, visualization, and reporting capabilities. Here are the features of Power BI:
- Interactive Reports Authoring:
Power BI provides a user-friendly interface for creating interactive reports. Users can drag and drop visual elements, apply filters, and define interactions to create dynamic and engaging reports. - DAX Data Analysis Function:
Power BI leverages the Data Analysis Expressions (DAX) language, which allows users to perform advanced calculations, create calculated columns and measures, and build complex data models. DAX provides powerful data manipulation and aggregation capabilities. - Flexible Tiles:
Power BI enables the creation of flexible tiles that can display key metrics and visualizations on dashboards. Users can customize the size, layout, and appearance of the tiles to suit their specific needs and preferences. - Q&A Question Box:
The Q&A feature allows users to ask questions about their data in a natural language format. Power BI utilizes advanced natural language processing capabilities to interpret the questions and generate relevant visualizations and insights in response. - Stream Analytics:
Power BI integrates with Azure Stream Analytics, enabling real-time data analysis and visualization. Users can connect to streaming data sources and monitor live data to gain instant insights and respond to changing business conditions. - Help and Feedback Buttons:
Power BI includes help and feedback buttons that give users access to documentation, tutorials, and community forums. Users can seek assistance and provide feedback directly within the Power BI interface, facilitating a smoother user experience. - Dataset Filtration:
Power BI enables users to apply filters to datasets, allowing for data segmentation and analysis based on specific criteria. Users can filter data dynamically to focus on subsets of information and explore data from different perspectives.
Power BI Career Opportunities
Power BI offers promising career opportunities in the field of data analytics and business intelligence. As organizations increasingly rely on data-driven decision-making, the demand for professionals skilled in Power BI is on the rise. Career opportunities include roles such as Power BI Developer, Business Intelligence Analyst, Data Scientist, Data Analyst, and Data Visualization Specialist. With Power BI's growing popularity and widespread adoption, professionals proficient in Power BI can find employment across various industries, ranging from finance and healthcare to marketing and retail.
Power BI Certifications
Microsoft offers several Power BI certifications, including Microsoft Certified: Data Analyst Associate, that validate the skills needed to work with Power BI to analyze and visualize data, build data models, and create reports and dashboards. These certifications cover topics such as data preparation, modeling, visualization, report creation, and collaboration.
Power BI Analyst Salary
In India, as per Ambition Box, the average salary for Power BI analysts is around 5.2 LPA. On the other hand, in the USA, as per Glassdoor data, the average salary for a Power BI Analyst is around 87K USD per year. Overall, the Power BI Analyst profile presents lucrative career opportunities with the potential for high salaries worldwide.
Versions of Power BI
Several versions of Power BI are available, catering to different needs and requirements. Here are the main versions of Power BI:
- Power BI Free:
This is the basic version of Power BI and is available for free. It offers core functionalities such as data visualization, interactive reports, and limited data capacity. - Power BI Pro:
Power BI Pro is a monthly/annual subscription-based version of Power BI. It provides additional features and capabilities beyond the free version, including collaboration and sharing of reports and dashboards, content creation, and data collaboration with others. - Power BI Premium:
Power BI Premium is an enterprise-level offering that provides dedicated resources and enhanced capabilities for organizations. It offers increased data capacity, advanced data refresh options, and support for large-scale deployments. Power BI Premium is licensed based on capacity and is ideal for organizations with high-volume data requirements and a need for broader access to reports and dashboards. - Power BI Mobile:
Power BI Mobile refers to the mobile applications available for iOS and Android devices. It allows users to access and view Power BI reports and dashboards on their mobile devices, providing a responsive and optimized experience.
Who Uses Power BI Applications?
Power BI applications are used by a wide range of individuals and organizations. Organizations across various industries leverage Power BI to gain insights from their data and make informed decisions. Power BI is utilized by data analysts, business intelligence professionals, data scientists, and executives who need access to visualizations and reports to monitor key performance indicators (KPIs) and track business metrics. Additionally, Power BI is used by teams and departments within organizations to collaborate on data analysis and reporting, enabling effective communication and alignment around data-driven insights.
Case Study on Meijer
Meijer, a well-established chain of around 230 departmental stores operating in multiple states, faced the challenge of staying profitable and competitive amidst the rise of online competitors. To address this, Meijer turned to Power BI to gain deeper insights into customer behavior and make informed market decisions.
By implementing Power BI, Meijer was able to leverage advanced technology to analyze and understand customer behavior across all its stores. The integration of Power BI enabled Meijer to refresh a massive amount of data, surpassing 20 billion rows, in real time. This allowed their teams to access and analyze data faster, creating real-time reports on hourly sales. With these insights at their fingertips, Meijer could make better-informed market decisions and respond quickly to changing trends.
By leveraging the capabilities of Power BI, Meijer aimed to enhance its understanding of customer behavior and make data-driven decisions to drive profitability and stay competitive in the challenging retail landscape.
Demo Using Power BI
In this demonstration, we will guide you through the process of loading data from an Excel sheet and creating various visualizations, such as bar charts and pie charts, to help you get started with Power BI.
Step - 1: Prepare Your Data
Before using Power BI, ensure that your data is properly structured in any format, such as an Excel sheet. This includes having clear column headers and organizing the data logically.
Step - 2: Install and Launch Power BI
If you haven't already, download and install Power BI Desktop, the desktop application used for creating and editing Power BI reports. You can find it on the official Power BI website. Open Power BI Desktop after installation.
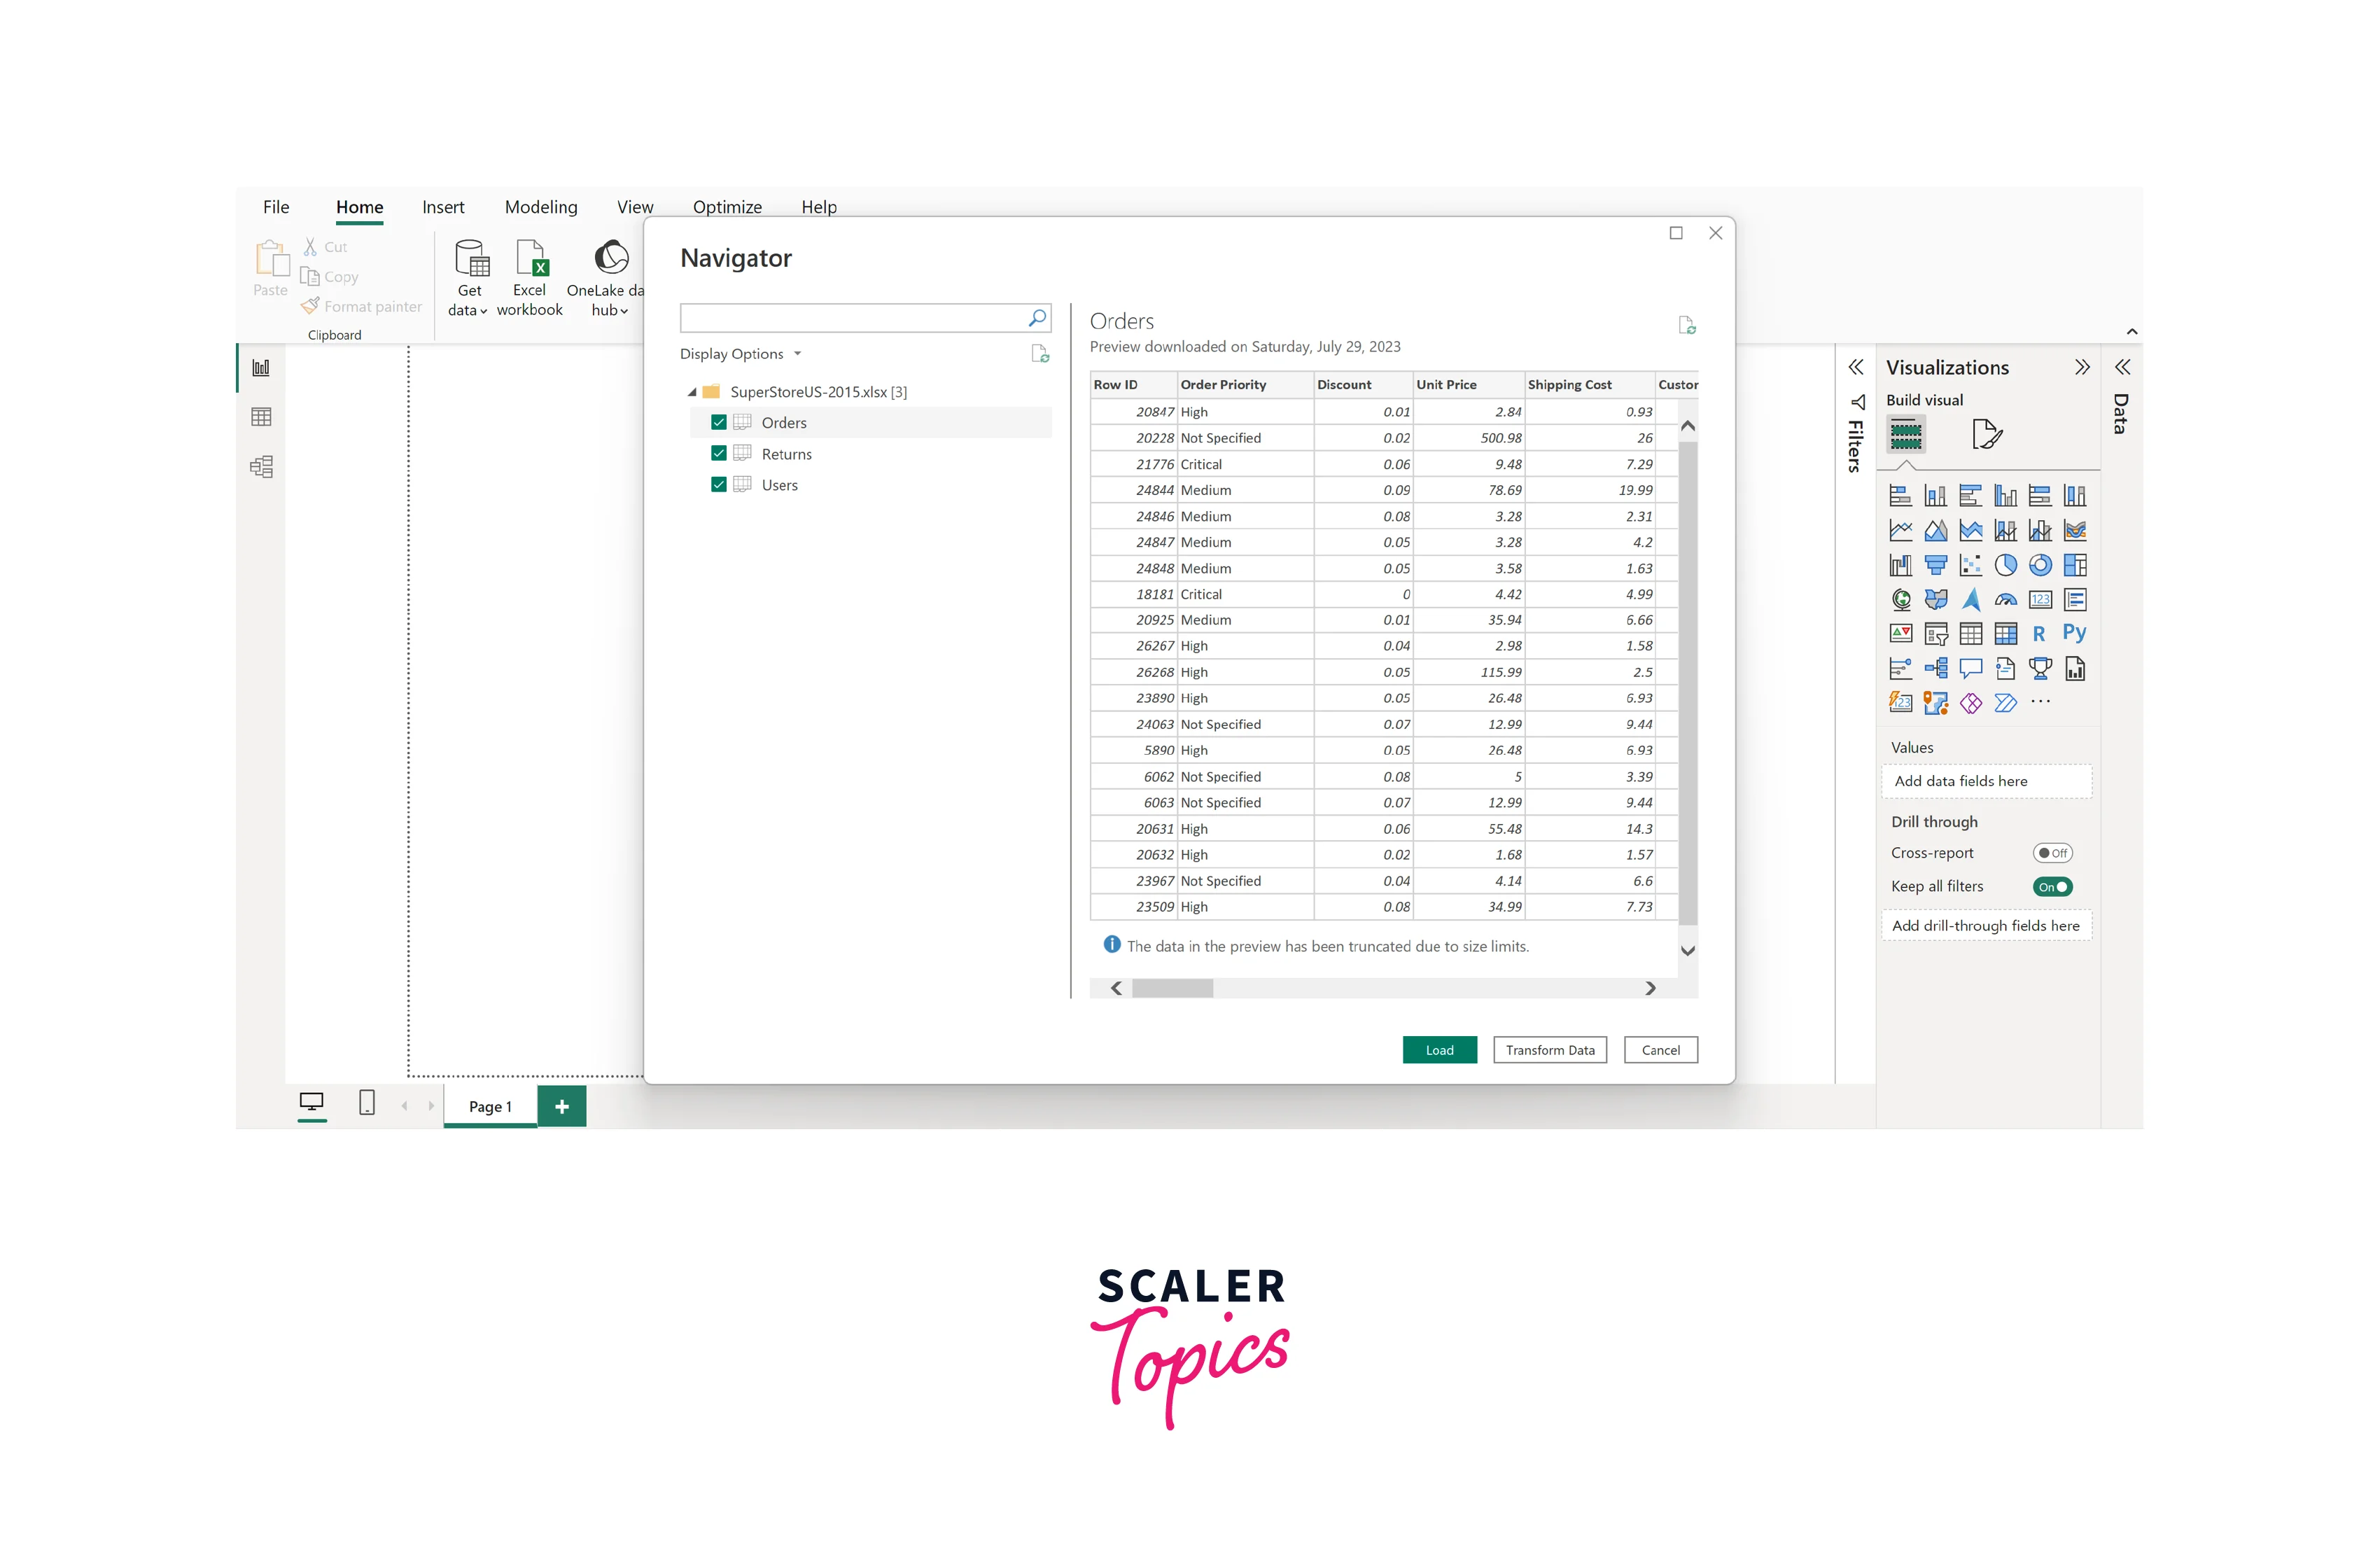
Step - 3: Load Data
Click on the "Home" tab in Power BI Desktop. Select "Get Data" and choose "Excel" from the available data source options. Browse and select your Excel file. Choose the specific sheet or table you want to import. Click "Load" to import the data into Power BI. In this illustration, we will employ an Excel spreadsheet encompassing a sales dataset from US superstores in 2015, as shown in the figure below. Once data is loaded, you can also clean and transform your data as needed using the Power Query Editor. This may involve filtering, merging, or reshaping data.
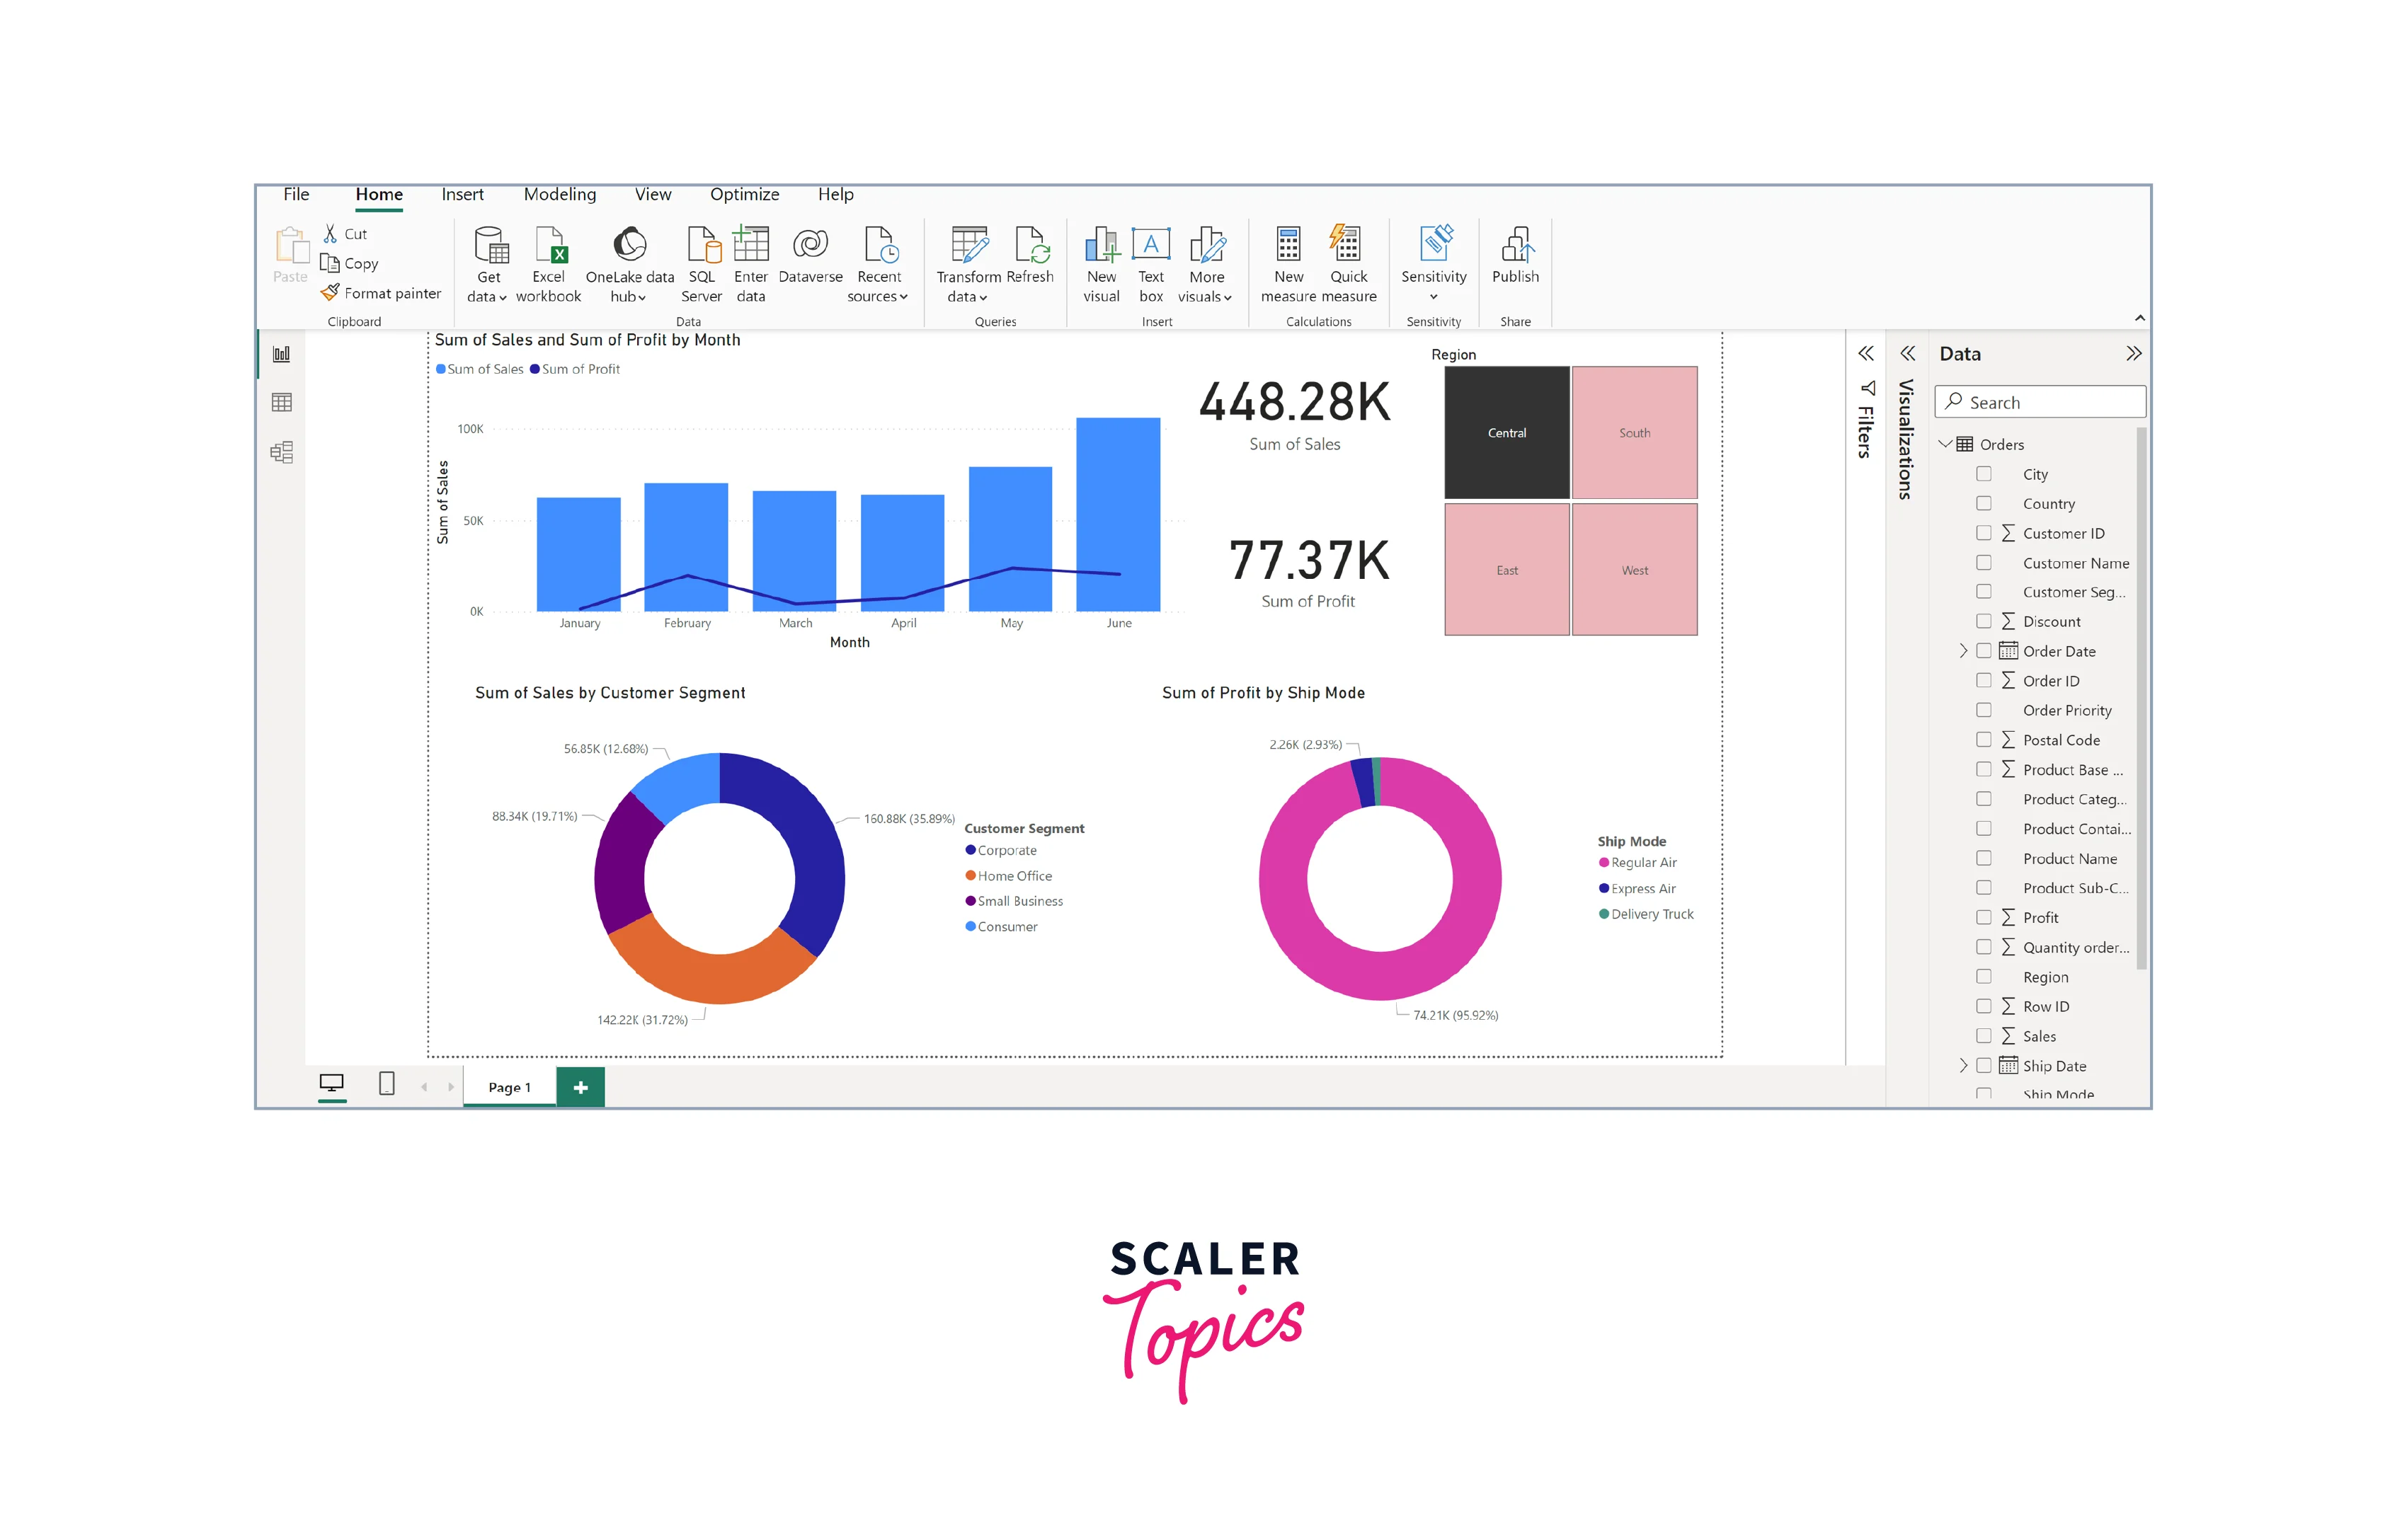
Step - 4: Create Visualizations
Now that your data is loaded, it's time to create visualizations. Click on the "Visualizations" tab. Choose the type of visualization you want (e.g., bar chart, pie chart) from the "Visualizations" pane on the right. Drag and drop the relevant fields from your data into the appropriate sections of the visualization (e.g., values, axis, legend). Customize the visualization by adjusting colors, labels, and formatting.
You can also add interactive elements like slicers, filters, and drill-through options to the Power BI visualizations. These interactive elements empower users to dynamically explore and analyze data, enabling focused insights and customized views for more informed decision-making.
Conclusion
- Power BI architecture comprises interconnected components and layers that enable data analysis, transformation, modeling, and visualization.
- The architecture includes the Power BI Service as the central hub for data storage, sharing, and collaboration. The data sources layer connects to various data sources, while the data transformation layer utilizes Power Query for data extraction and transformation. The visualization layer utilizes Power View and Power Map for creating interactive visualizations and reports.
- Microsoft offers several Power BI certifications to learn the skills required for a career in Power BI. The Power BI Analyst profile presents lucrative career opportunities with the potential for high salaries worldwide.