Report Publishing in Power BI
Overview
In today's data-driven world, making informed decisions is paramount. Power BI, a dynamic business intelligence tool by Microsoft, empowers organizations to harness the full potential of their data. This article delves into the essentials of how to publish Power BI reports, guiding you through the process of transforming raw data into visually compelling insights. Discover how to create, share, collaborate, and publish Power BI reports, enabling data-driven decision-making that drives success.
Introduction
In a world where data reigns supreme, the ability to translate raw information into actionable insights can be a game-changer. This is precisely where Power BI, a leading business intelligence tool, steps in. At its core, report publishing in Power BI is the art of transforming complex data sets into clear, interactive, and visually engaging reports that are easily accessible to stakeholders. This article will explore the process of how to publish Power BI reports, and share and collaborate with the business stakeholders.
How to Publish a Report in Power BI?
It is a straightforward process to publish Power BI reports that enable you to share your insights with colleagues, clients, or stakeholders. Follow these steps to successfully publish Power BI reports -
- Before you can publish Power BI reports, you need to create one within Power BI Desktop. Design your visualizations, charts, and dashboards, and ensure that your data is imported and structured as needed.
- Save your Power BI report (.pbix file) to your local computer. This file contains all the data, visuals, and configurations of your report.
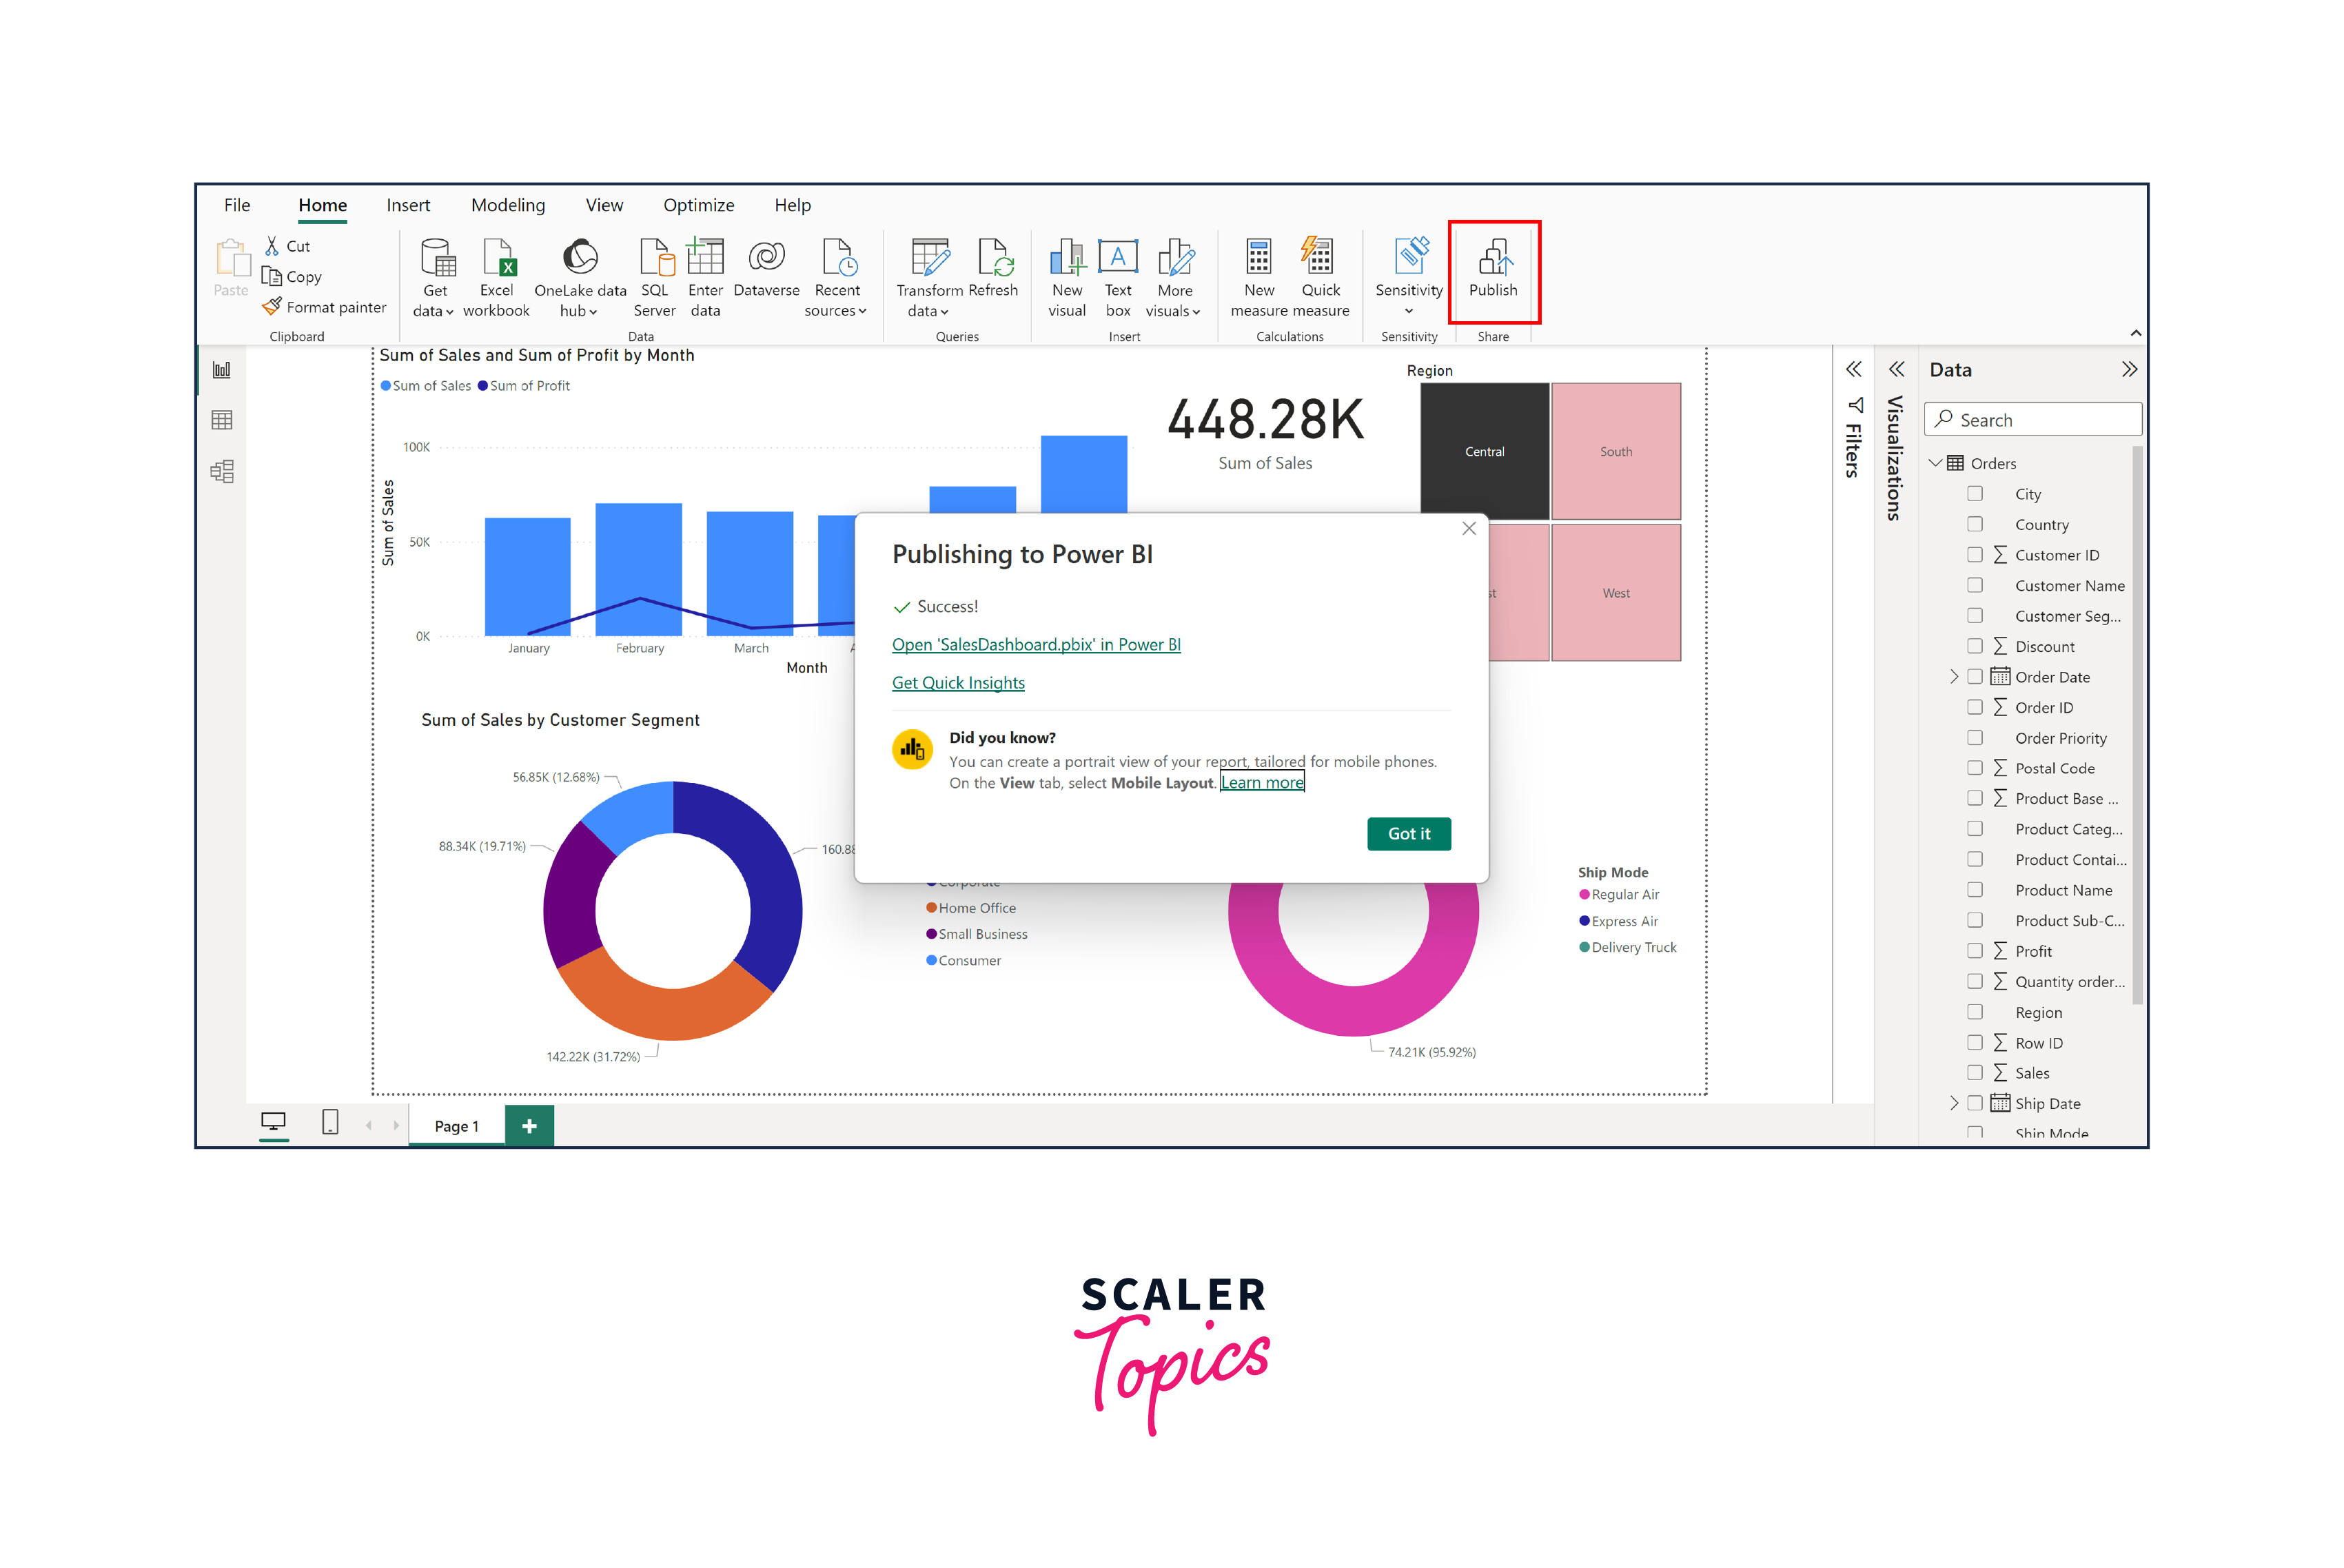
- In Power BI Desktop, navigate to the "Home" tab on the ribbon at the top of the window. Within the Home tab, you'll find the "Publish" button. Click the "Publish" option to save your report to the Power BI service (online platform), as shown in the figure below.
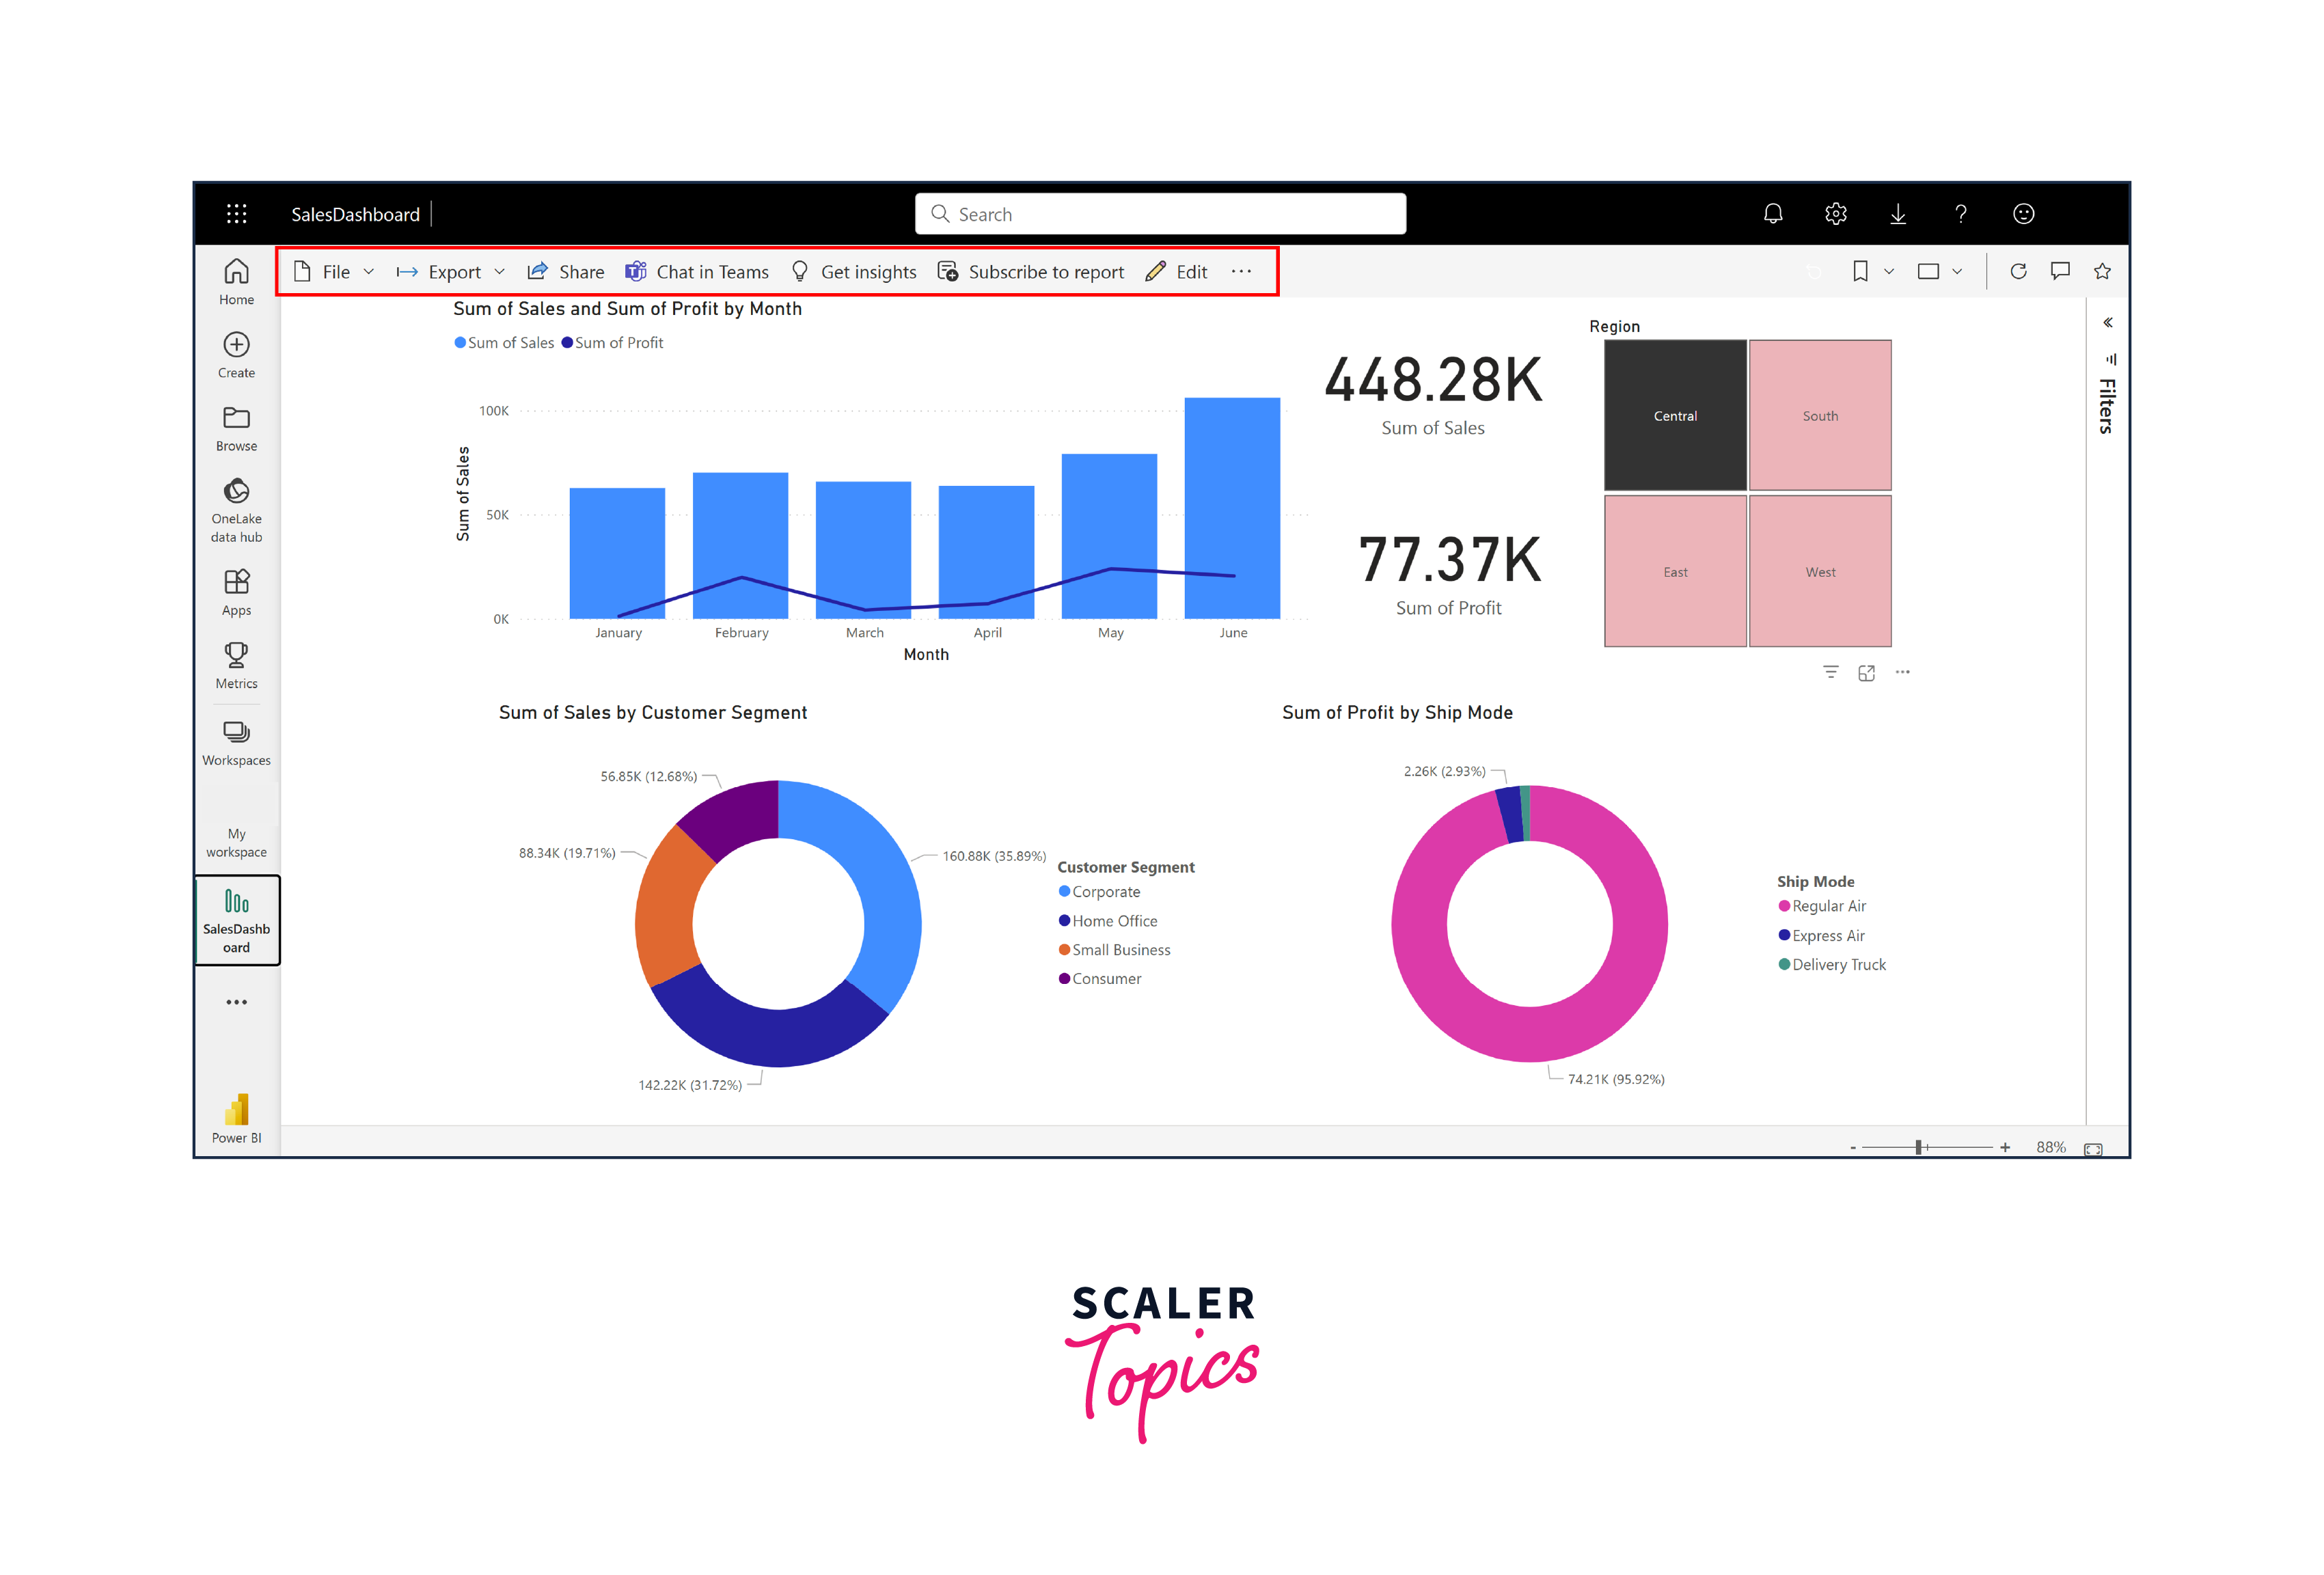
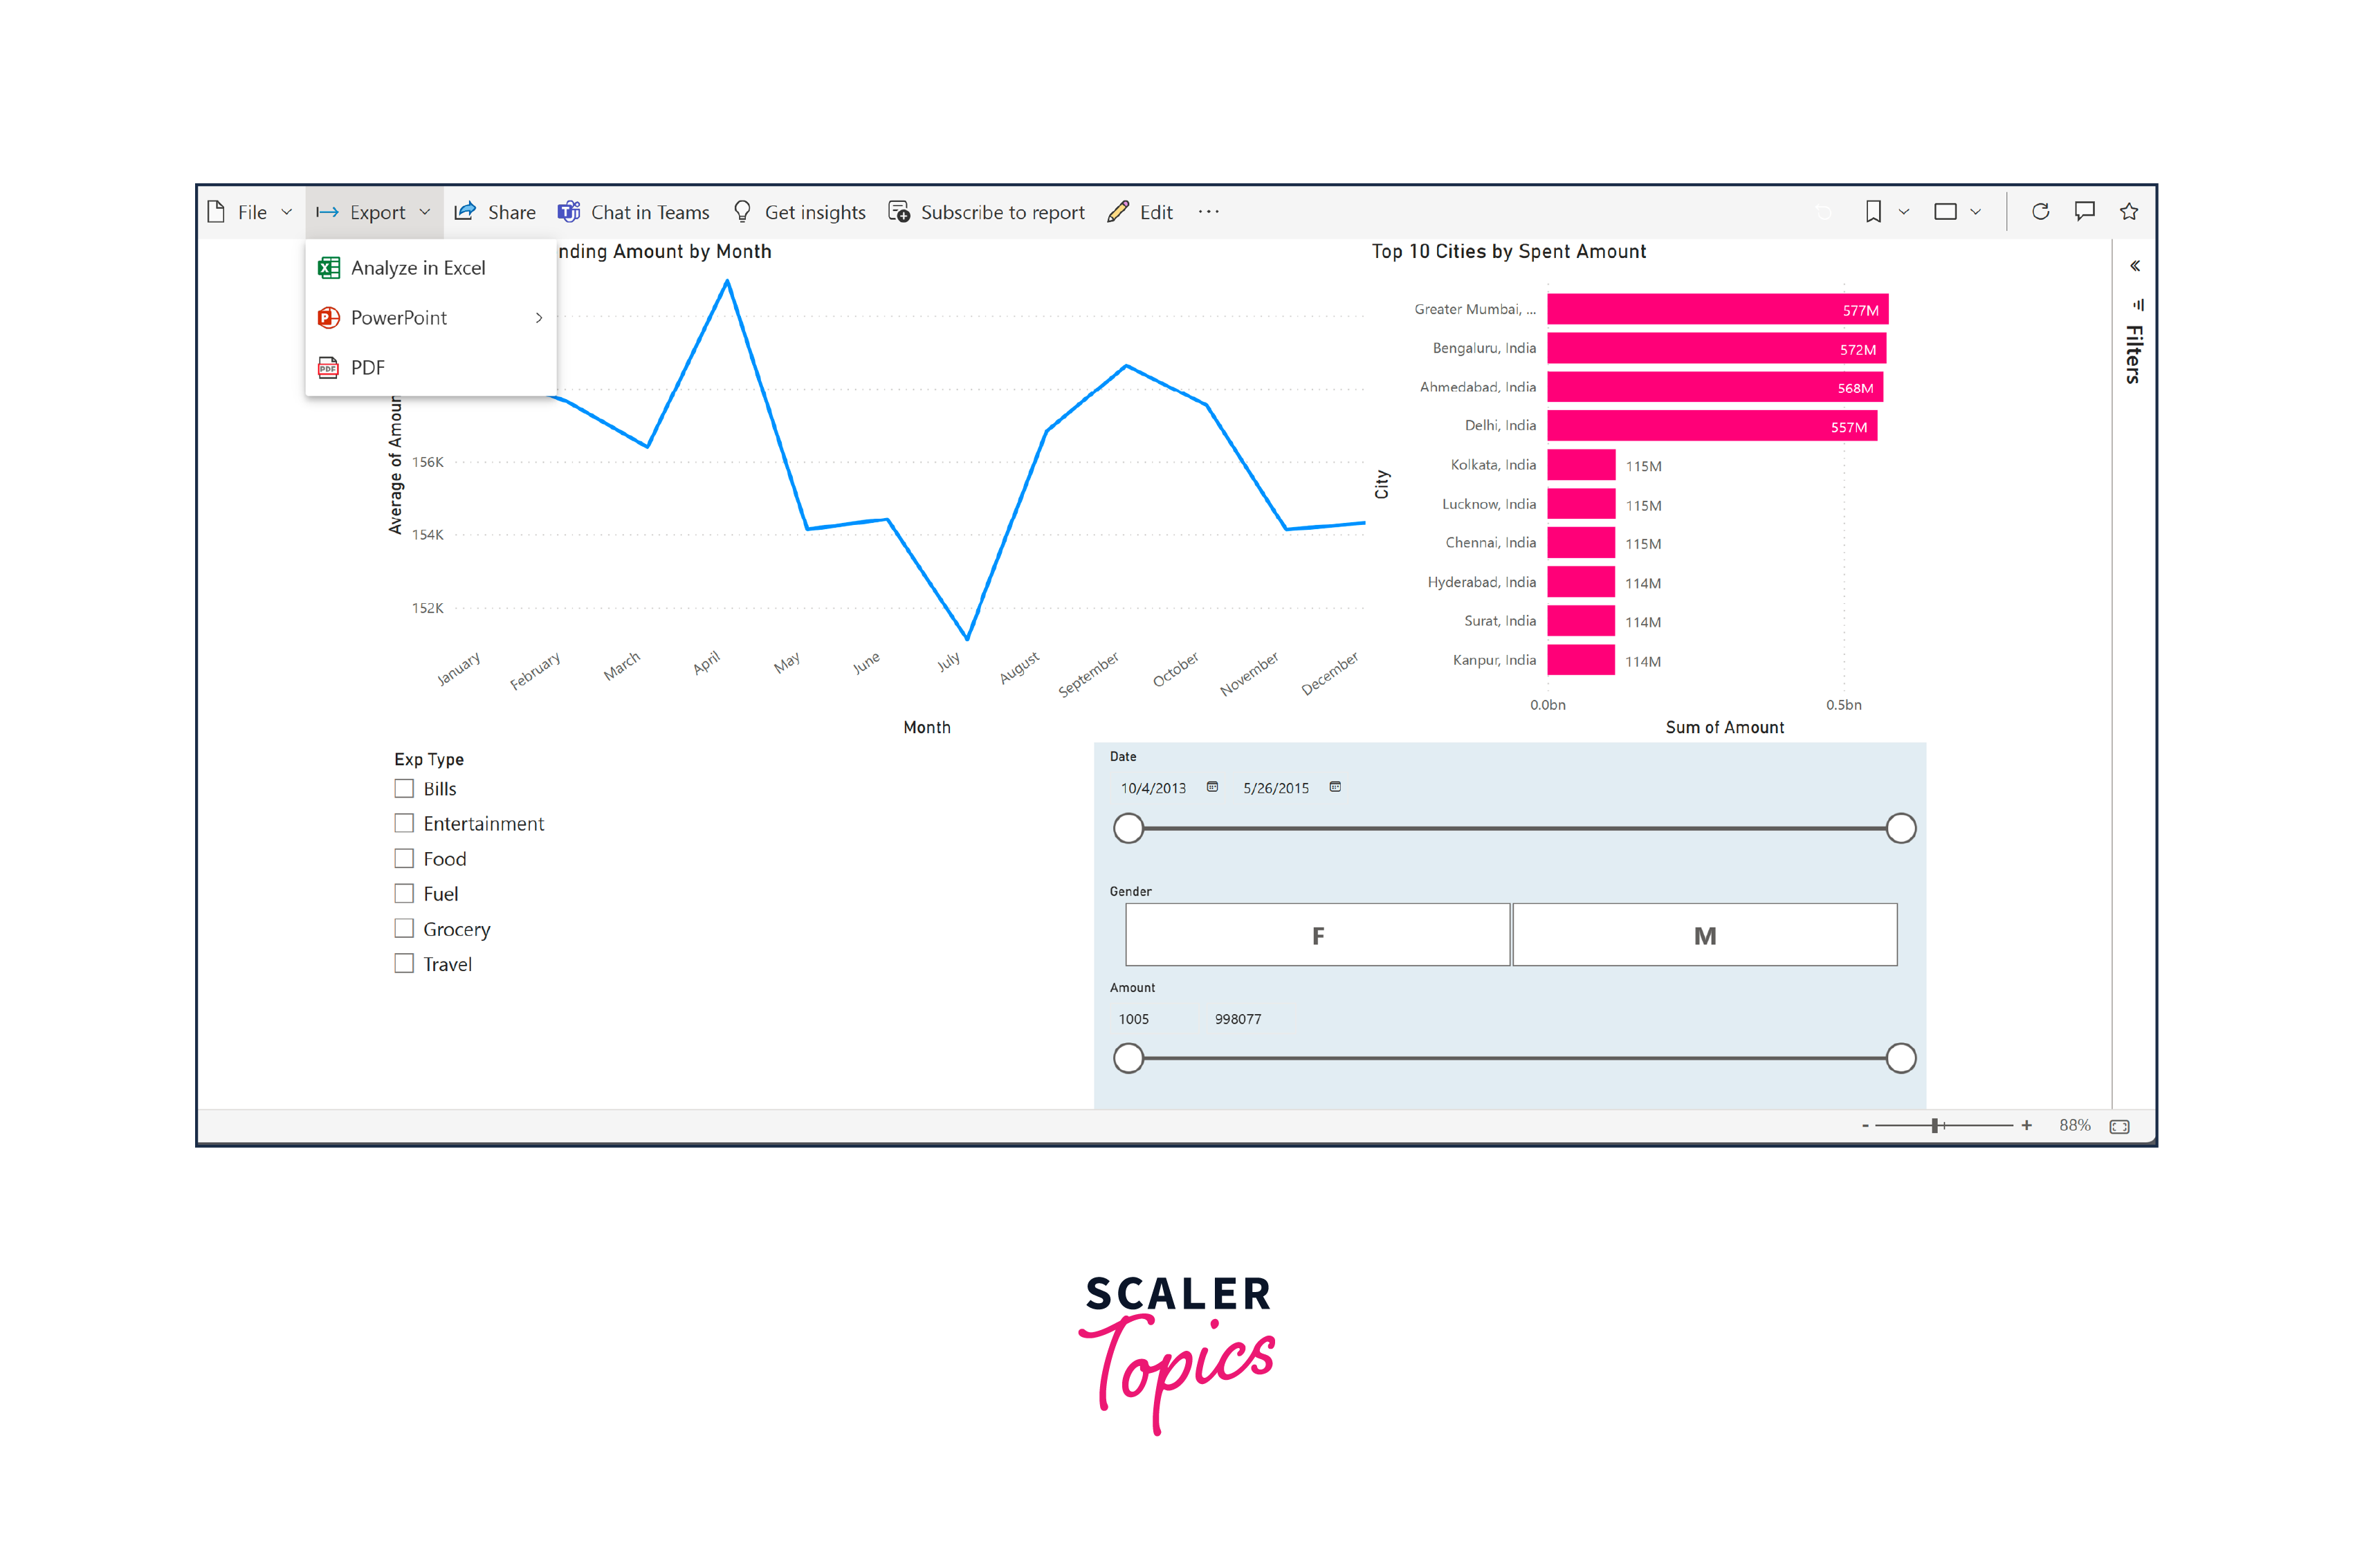
- Clicking on the link depicted in the image above will redirect you to your web browser, granting you access to your dashboard within the Power BI service online. Once you've arrived, you'll have the flexibility to export the dashboard in various formats like PPTs or PDFs. Additionally, you'll find options for sharing it with colleagues and teams, as illustrated in the subsequent figure below.
How To Republish Or Replace A Dataset Published From Power BI Desktop
When you publish Power BI reports, both the dataset and any associated reports are uploaded to your Power BI site. Should you wish to update this dataset, republishing your Power BI Desktop file replaces the dataset in your Power BI site with the updated dataset. However, there are key considerations to keep in mind, as mentioned below -
- Avoid having multiple datasets in Power BI with the same name as your Power BI Desktop file, as this could fail the publishing process. It's advisable to maintain a single dataset with a matching name. Alternatively, rename the file before publishing to create a new dataset with the same name.
- Be cautious when renaming or deleting columns or measures, as these modifications may affect the functionality of visualizations in Power BI.
- Republishing a dataset previously published from Power BI Desktop with a defined refresh schedule will automatically trigger a dataset refresh.
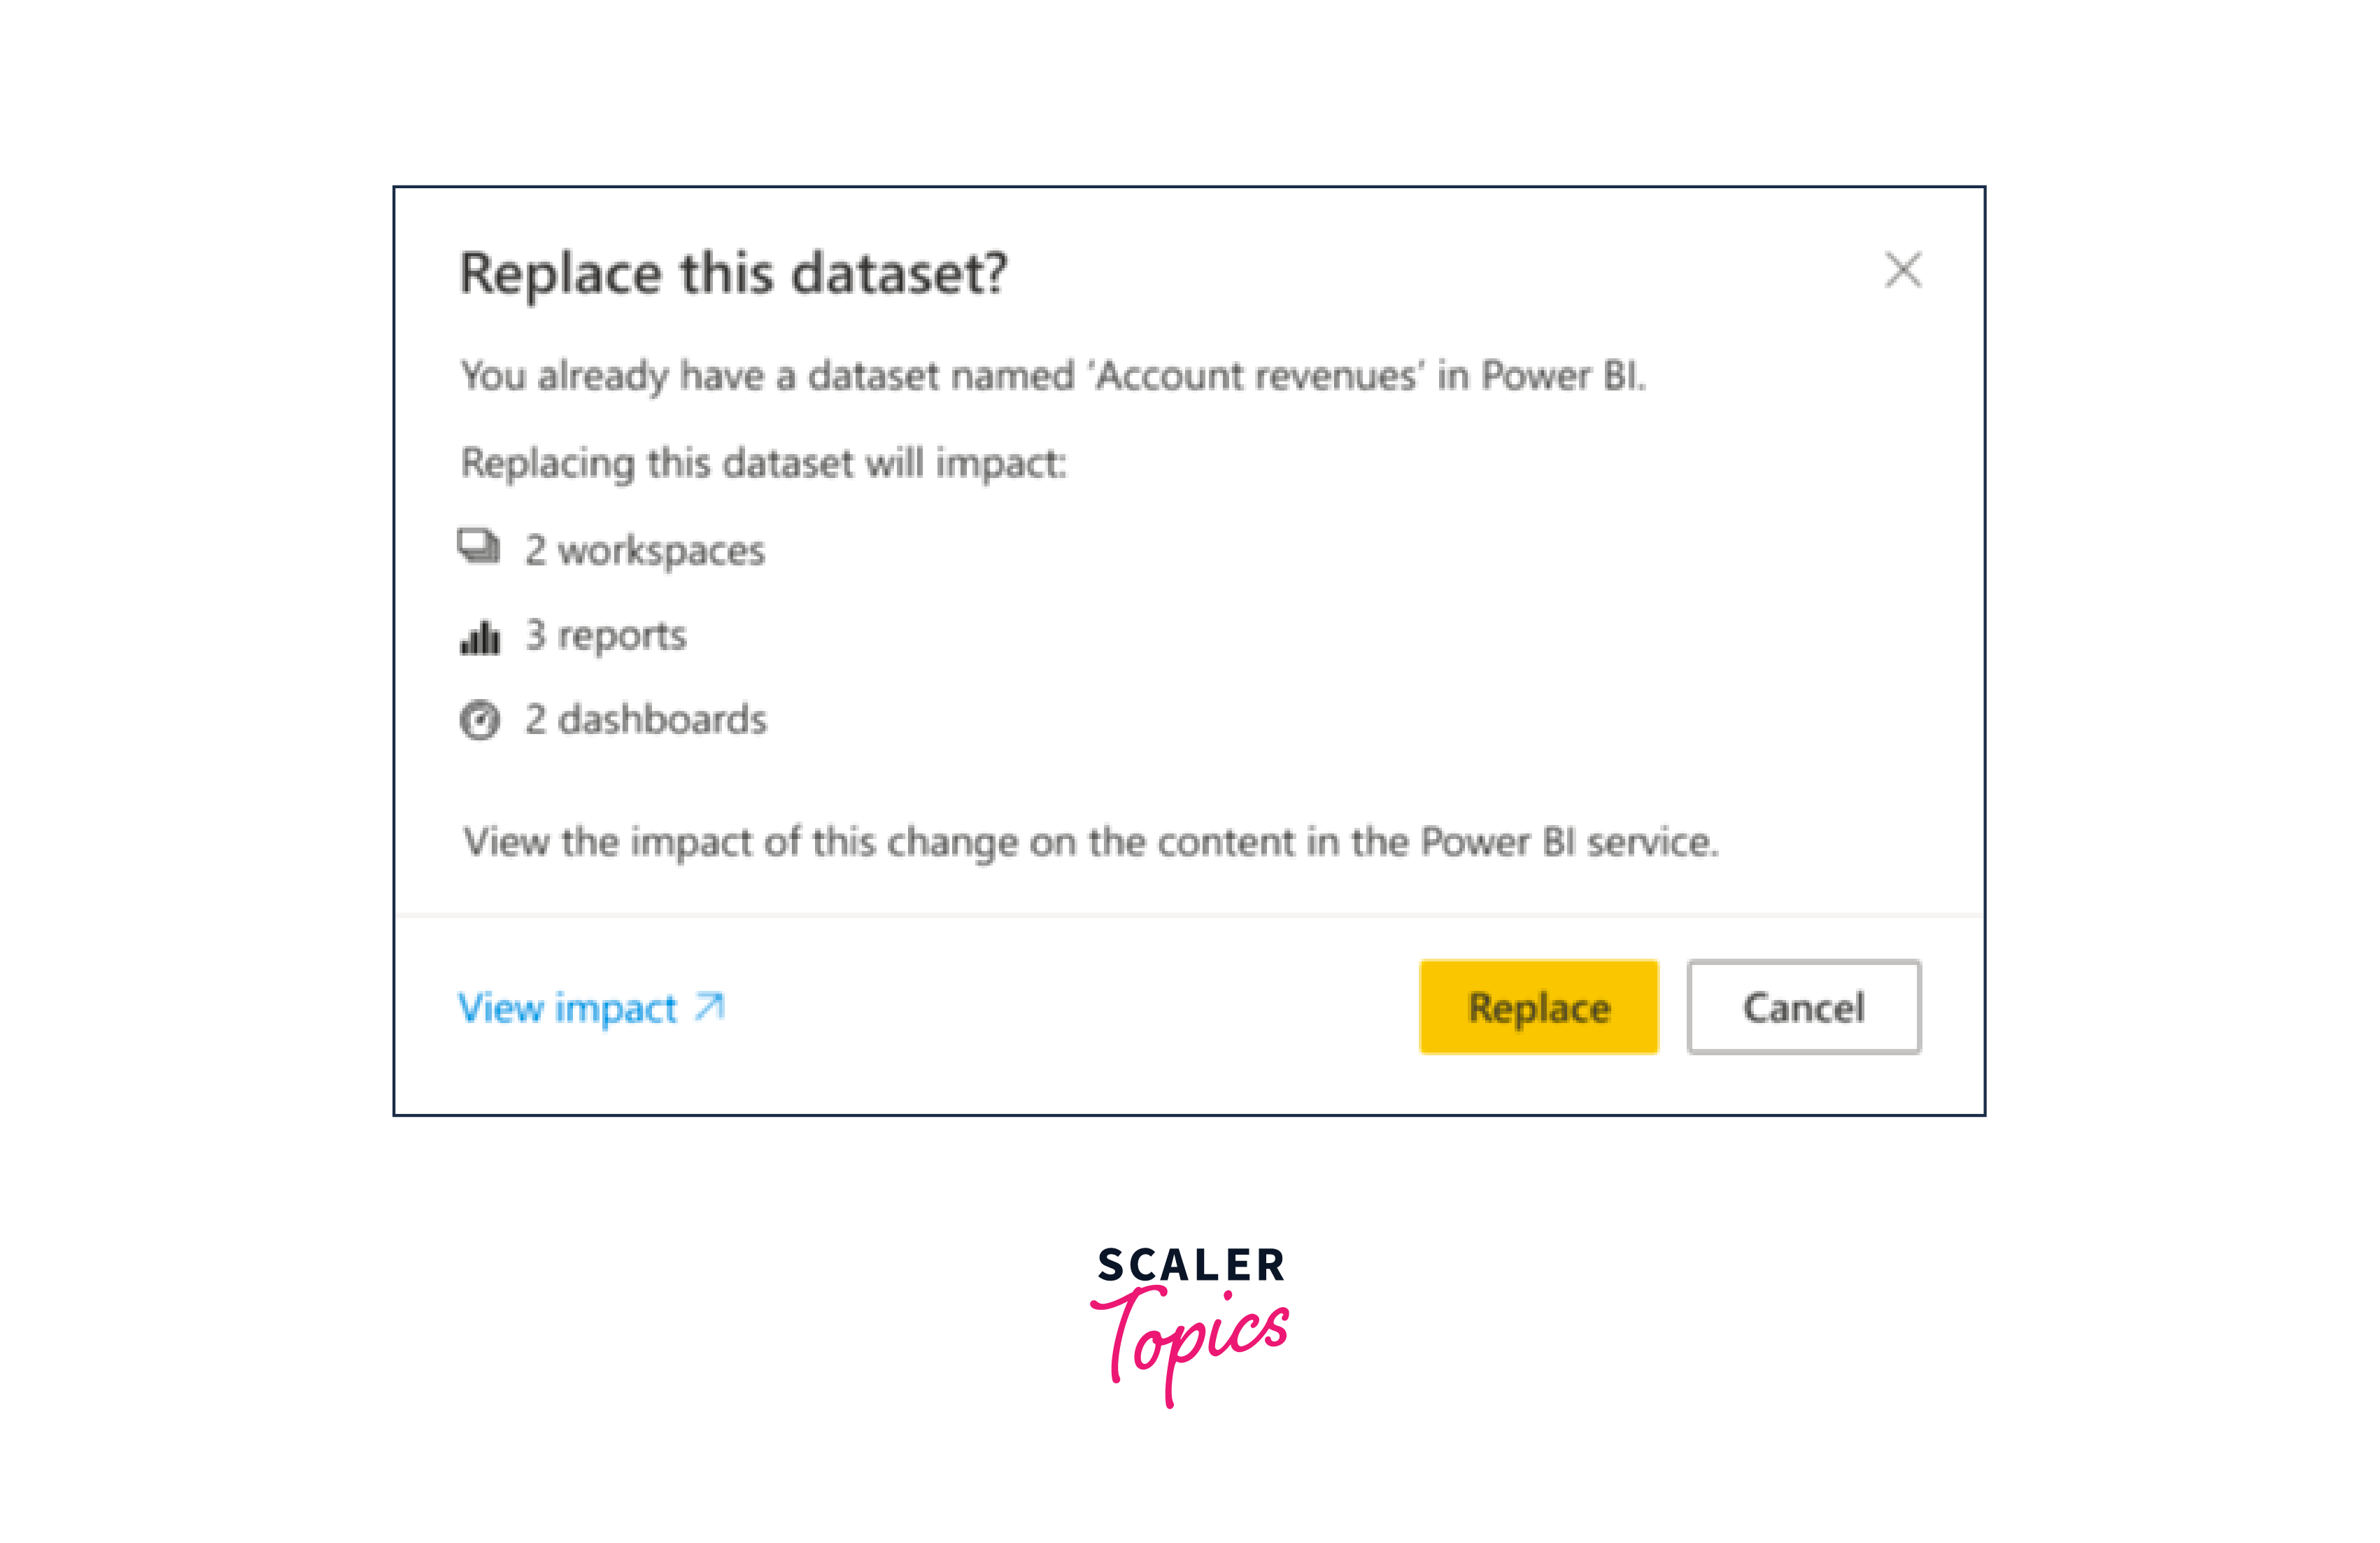
- After modifying a dataset and initiating a republish, you'll receive a message detailing the potential impact on workspaces, reports, and dashboards. The message will request confirmation to replace the existing dataset with the modified one. Additionally, it offers a link to a comprehensive dataset impact analysis within the Power BI service, providing further insights and mitigation options.
How to Print Power BI Dashboards?
Printing Power BI Dashboards can be a valuable way to share insights in a physical format or to keep records for meetings and presentations. Here's how you can print your Power BI Dashboards -
- Start by accessing the specific dashboard you want to print in the Power BI service.
- In the top-left corner of the opened dashboard, navigate to the 'File' menu, and then choose the option labeled 'Print this page.

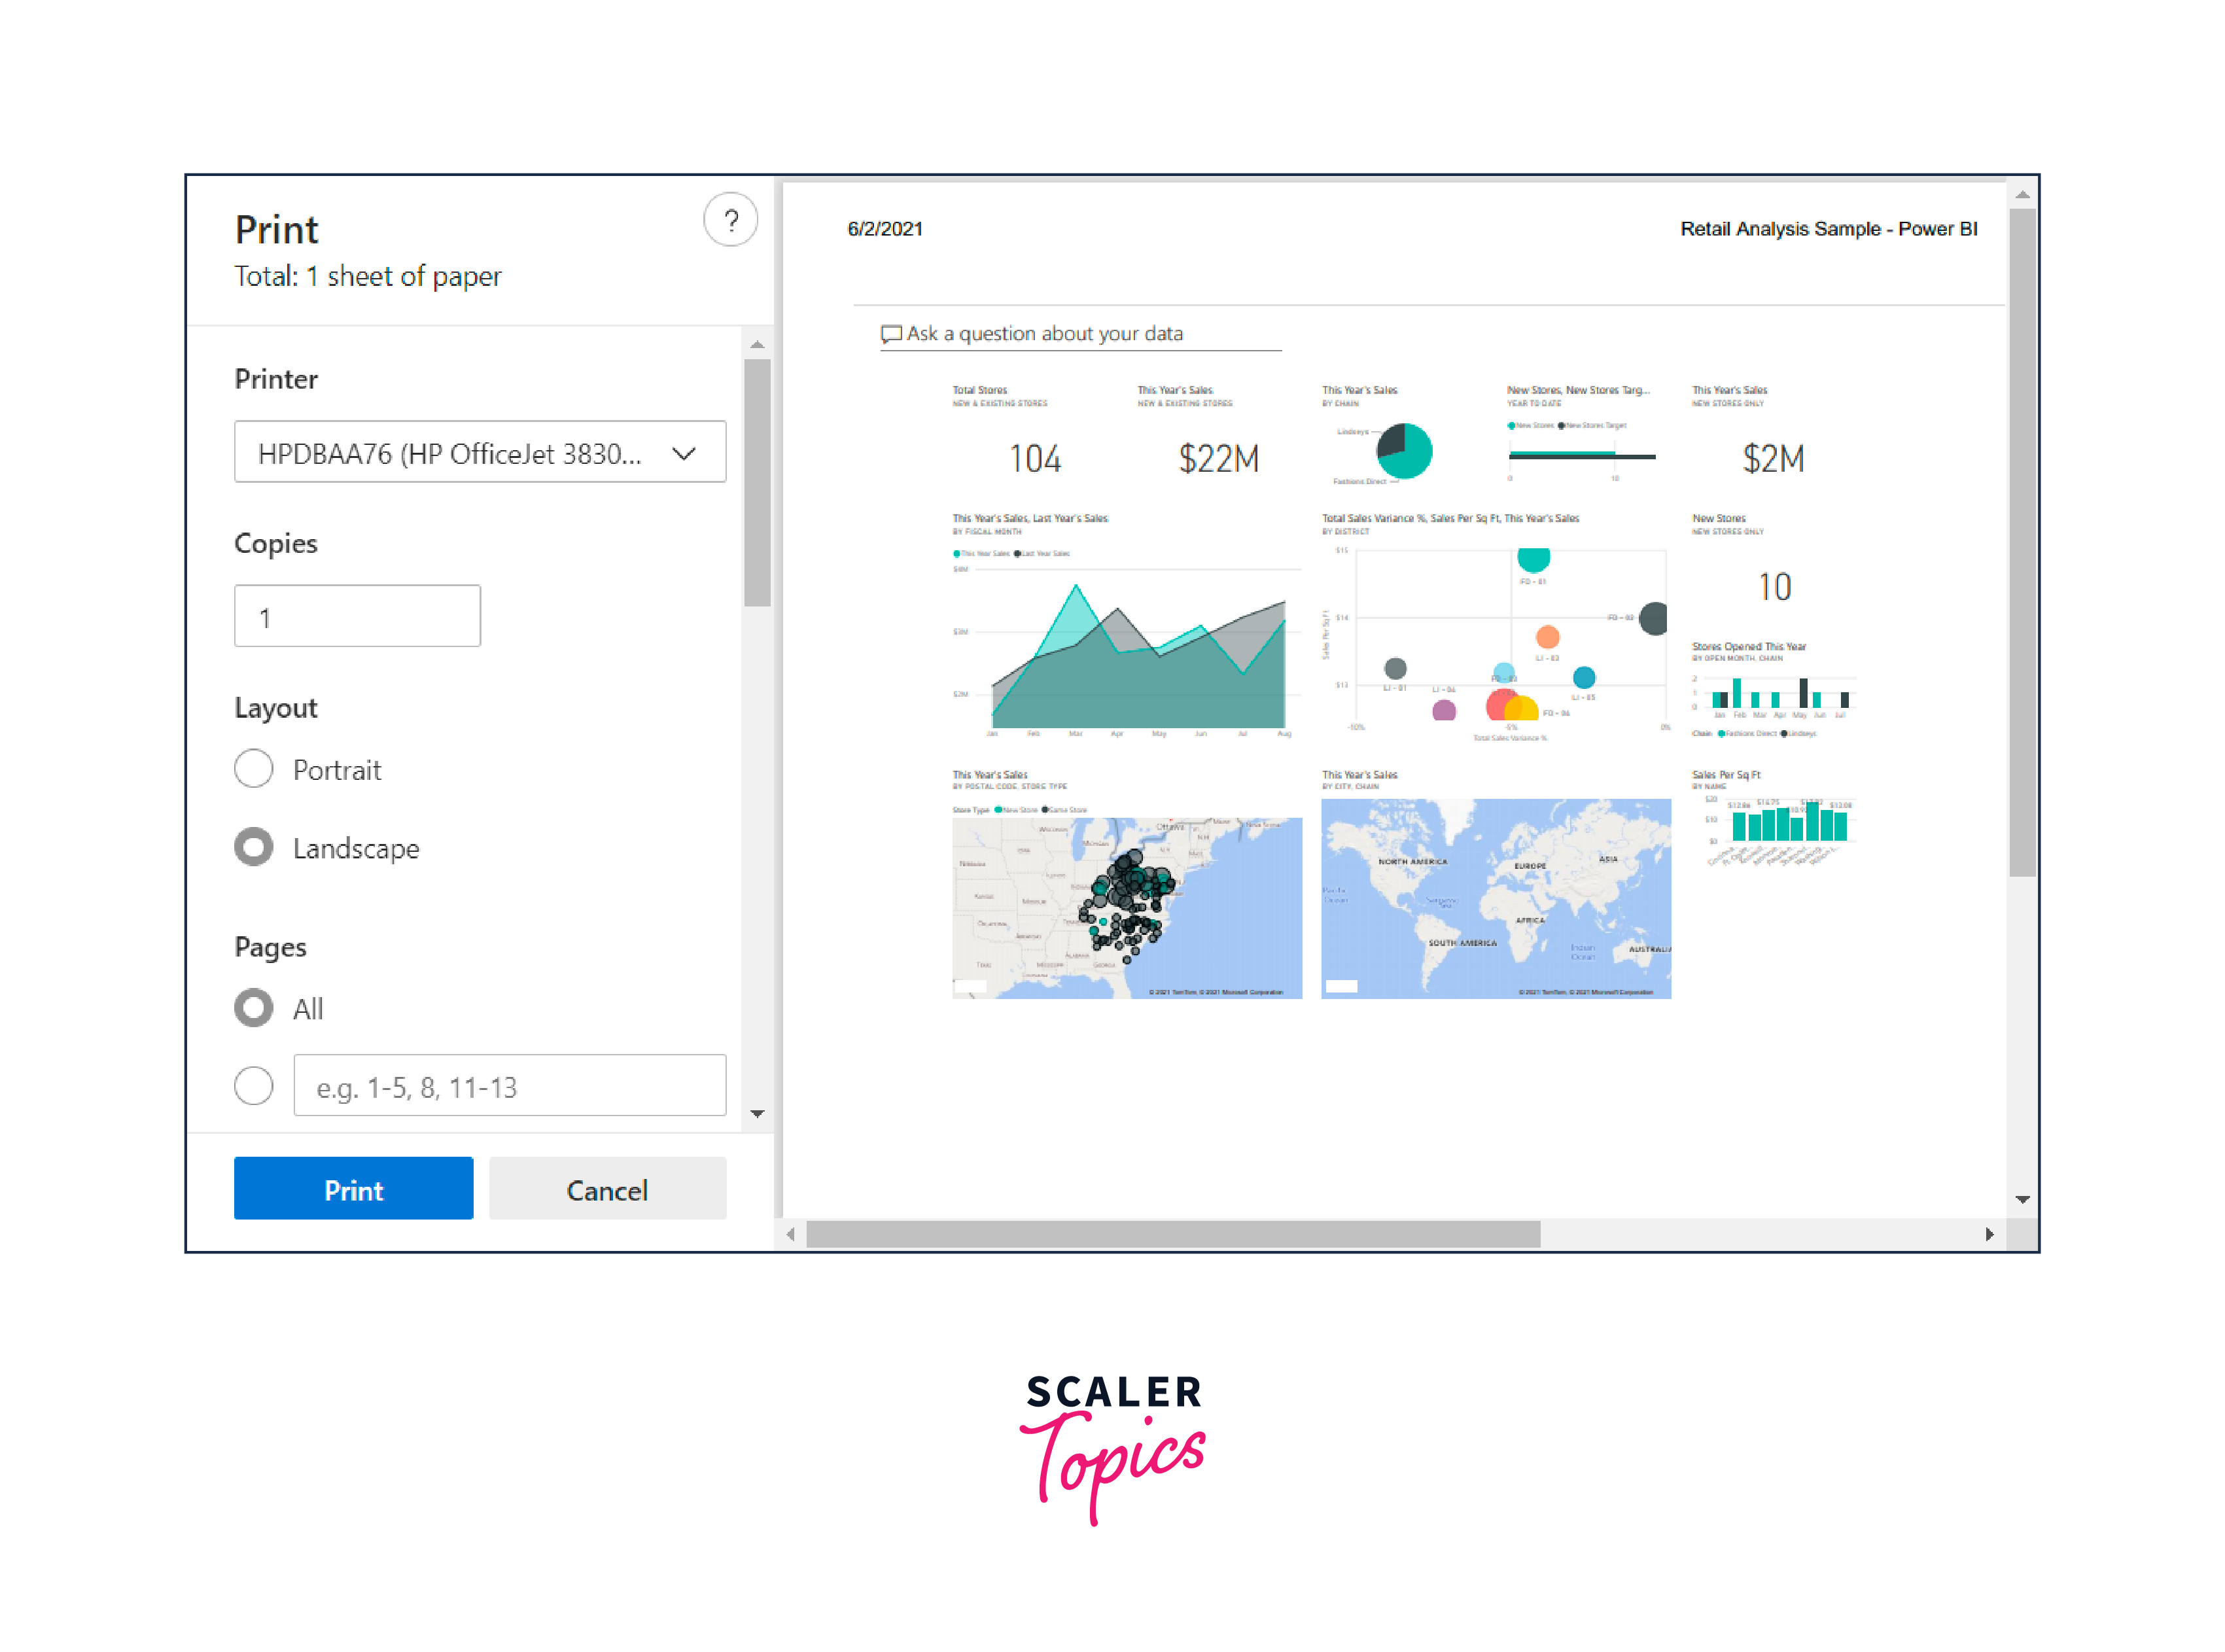
- After clicking on 'Print this page,' a print dialogue window will be displayed in your web browser, allowing you to fine-tune your print settings as needed.
Export Options in Power BI Dashboards?
Exporting data and visuals from your Power BI Dashboards can be essential for sharing insights, collaborating with colleagues, or archiving information. Power BI offers several export options to cater to your specific needs, as mentioned below -
- Export to Excel - Exporting your Power BI Dashboard to Excel allows you to obtain the underlying data for further analysis and manipulation. This option generates an Excel workbook (XLSX file) that includes the dataset behind your visuals. Each table or visual on the dashboard is translated into a corresponding worksheet in the Excel file, making it easy to explore and analyze the data in detail.
- Export to PowerPoint - The Export to PowerPoint option in Power BI enables you to create visually compelling presentations using your dashboard visuals. When you choose this option, Power BI generates a PowerPoint presentation (PPTX file) that includes the selected visuals from your dashboard. This is an efficient way to share your data-driven insights in a format that's well-suited for meetings, reports, or presentations, ensuring your audience can easily grasp the key information.
- Export to PDF - Exporting your Power BI Dashboard to PDF produces a static snapshot of the entire dashboard, preserving its layout and visualizations as they appear on the screen at the time of export. This option is suitable for sharing a read-only, print-ready version of your dashboard with stakeholders who may not have access to the Power BI service. PDFs are also ideal for archiving reports or distributing a fixed-format document that retains the visual integrity of your dashboard, making it a valuable tool for documentation and sharing insights in a standardized format.
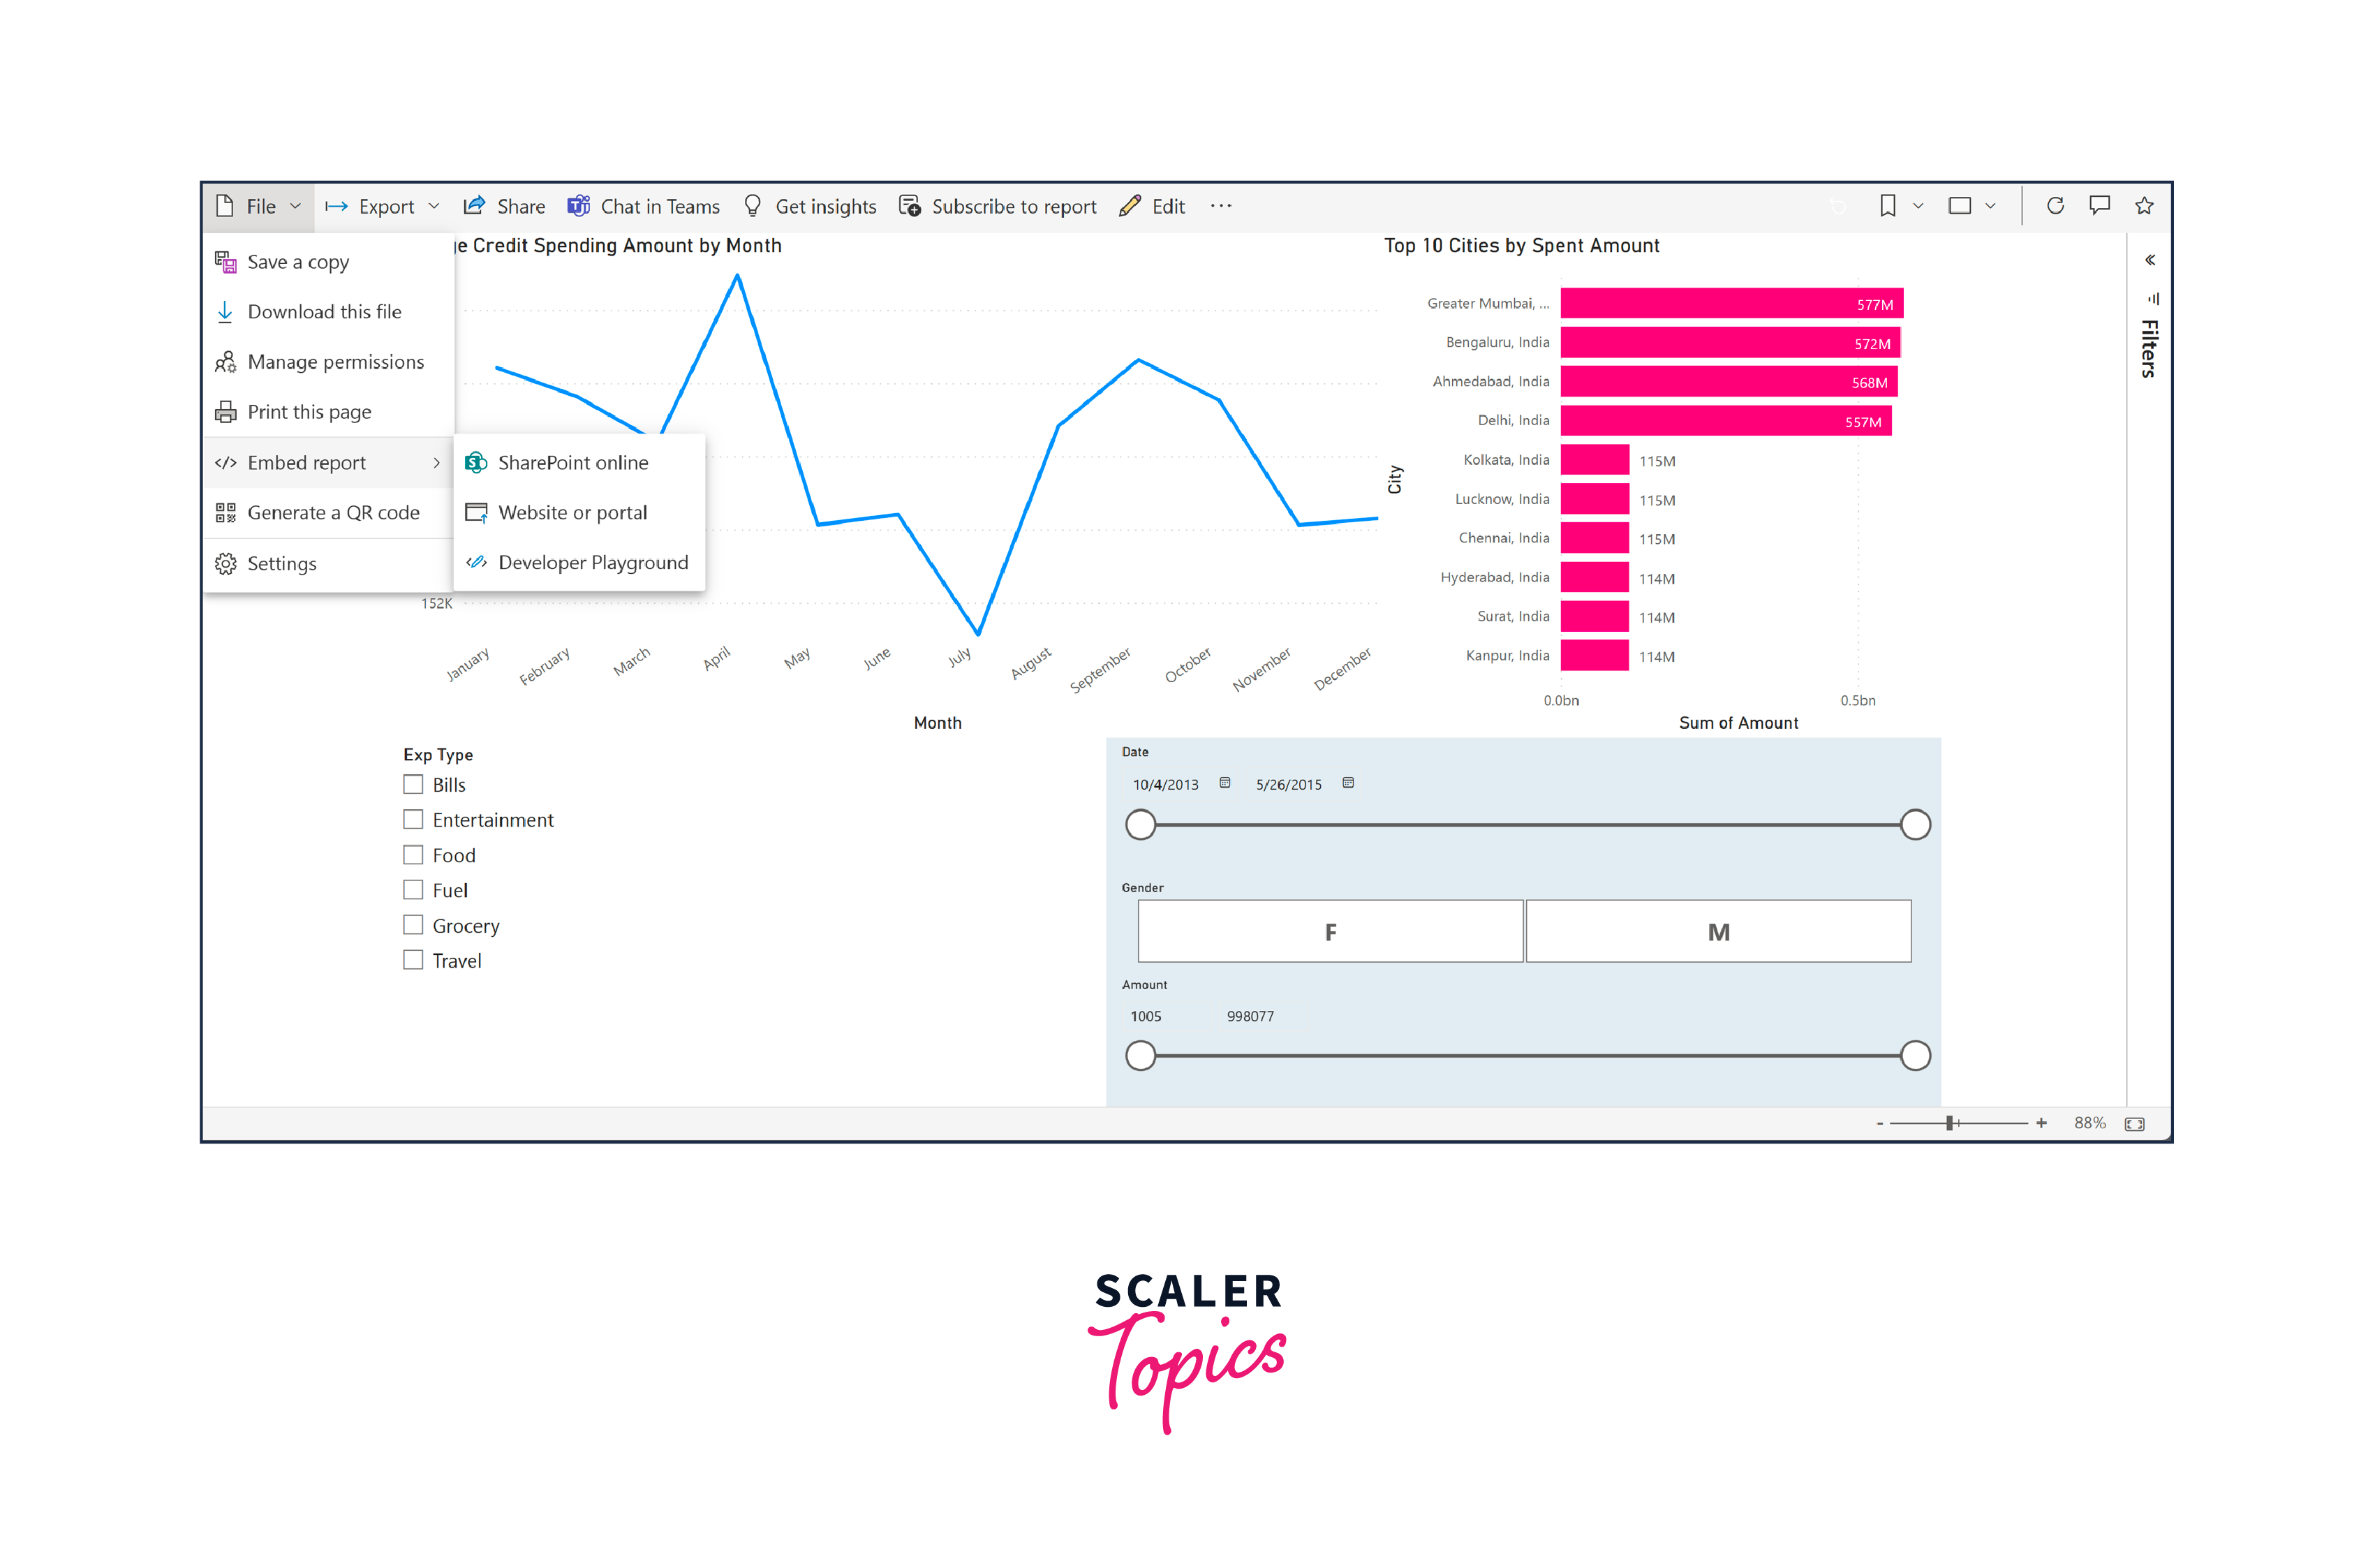
Publishing Report to Web
Power BI offers a convenient feature known as "Publish to Web" that allows you to share your reports publicly on the Internet, making them accessible to a wide audience without requiring a Power BI account. This feature is particularly useful for sharing non-sensitive data, insights, or visualizations with stakeholders, clients, or the public. Here's how to publish Power BI reports on the web -
- Begin by opening the Power BI report you want to share.
- In the top menu, navigate to "File," then select "Embed code," and choose the option labeled "Website or portal" to publish the dashboard to your website or portal.
- This action will produce both an embed link for your content and the corresponding HTML code that you can then paste onto your website.
How to Use Content Pack in Power BI?
A content pack is a functionality accessible with either the Pro or Premium versions of Power BI. In the broader context of Power BI, it offers shareable reporting capabilities, including dashboards. The primary purpose of a content pack is to enhance collaboration and organization within your reporting endeavors.
With a content pack, you can efficiently gather and centralize essential information within a single repository, which can then be readily shared with your team members. Think of content packs as virtual containers, akin to boxes, where you can systematically organize data and resources for specific projects. These containers can hold various items, such as Dashboards, Datasets, Reports, Excel workbooks, etc. Then, instead of sharing your information one by one, you can share the entire content pack with your colleagues. You can create a content pack with the following steps -
- In your Power BI navigation panel, navigate to "Workspaces."
- Select "My Workspaces" from the options.
- A new navigation panel will appear. Locate and click on the cog icon.
- Choose "Create a new content pack" from the available options.
Editing Content Pack
Editing a Content Pack in Power BI allows you to maintain and enhance the shared content's relevance and accuracy. To edit a Content Pack, follow these steps -
- First, access the Content Pack you want to edit by navigating to the workspace where it's located and selecting it from the respective section.
- Within the Content Pack, you can make various edits, including updating reports, modifying dashboards, or refreshing datasets to ensure they reflect the latest data.
- Any changes you make to the content within the Content Pack will be automatically synchronized with all users who have access to it. This ensures that everyone benefits from the latest insights and updates.
Common Use Cases of Report Publishing
It is a versatile tool to publish Power BI reports with various practical applications across different industries and business functions. Here are some common use cases to publish Power BI reports -
- Executive Dashboards - Create visually appealing executive dashboards that provide a high-level overview of key performance indicators (KPIs) and critical business metrics. Publish Power BI reports and these dashboards to enable senior leadership to make informed decisions quickly.
- Sales and Marketing Reports - Sales teams can utilize published reports to track sales performance, analyze customer trends, and identify opportunities for growth. Marketing teams can gauge the effectiveness of campaigns and allocate resources strategically.
- Financial Analysis - Finance departments can publish Power BI reports to assess financial health, monitor budget adherence, and conduct in-depth financial analysis. Share financial reports with stakeholders to enhance transparency.
- Operational Monitoring - Monitor real-time operational data and publish Power BI reports to keep teams informed about process efficiencies, supply chain performance, and any potential issues that require immediate attention.
- Customer Service and Support - Publish Power BI reports to track customer service metrics, analyze customer feedback, and optimize support operations. This helps improve customer satisfaction and service quality.
- Healthcare Analytics - Healthcare organizations can utilize Power BI to publish reports that track patient outcomes, manage healthcare costs, and enhance decision-making in medical facilities.
Dashboard vs. Report in Power BI
Here is the difference between dashboard and reports in Power BI, in a tabular format -
| Factor | Dashboard | Report |
| Purpose | Provide a high-level overview of key performance indicators (KPIs) and critical metrics. | Offer detailed, structured, and comprehensive data analysis and visualization. |
| Number of Pages | Dashboards are constrained to a single page and do not extend beyond it. | Reports typically consist of multiple pages. |
| Visualizations | Dashboards focus on conveying data insights through visually appealing elements like charts and graphs. | Reports prioritize creating summary pages over data visualization. |
| Interactivity | Limited interactivity; typically, dashboards are read-only, and users can't drill down into specific details. | Highly interactive; users can explore data, filter, drill down, and create custom views. |
| Data Depth | Offers a shallow view of data, focusing on summarizing key metrics and trends. | Allows for deep dives into data, supporting detailed analysis and exploration of underlying datasets. |
| Target Audience | Primarily designed for executives and high-level decision-makers who need a quick overview of business performance. | Suited for analysts, data professionals, and anyone needing in-depth insights and data exploration capabilities. |
Conclusion
- Report publishing in Power BI empowers organizations to effectively communicate insights, making data-driven decision-making accessible to a broader audience.
- Through shared reports and content packs, teams can collaborate seamlessly, ensuring that stakeholders have access to up-to-date data and reports tailored to their needs.
- Leveraging the full potential of Power BI's report publishing capabilities can lead to improved business performance and a more informed, agile, and data-centric organizational culture.