Sales Dashboard Using Power BI
Overview
In today's data-driven business landscape, monitoring and analyzing sales performance is paramount for informed decision-making. In this article, we delve into the world of data visualization and analytics, showcasing how Power BI empowers users to create dynamic and insightful sales dashboards.
The article will guide you through the step-by-step process of constructing a comprehensive sales dashboard Power BI. Starting with an introduction to Power BI's capabilities, we'll explore the significance of visualizations, key performance indicators (KPIs), and filters within the dashboard. From there, we'll provide hands-on tutorials on incorporating various visualization types and customizing them to display sales trends, patterns, and performance metrics effectively. Whether you're a business analyst, a data enthusiast, or a professional aiming to enhance your data presentation skills, this article offers a step-by-step guide to creating a dashboard using Power BI.
What are We Building?
In this article, we will design and develop a sales dashboard using Power BI Desktop, integrating various visualizations, KPIs, and interactive filters to provide a comprehensive overview of sales performance.
Pre-requisites
Here's a list of prerequisites to create a Sales Dashboard Power BI -
- Power BI Desktop - Ensure you have Power BI Desktop installed on your computer. You can download it from the official Microsoft Power BI website.
- Familiarity with Data Analysis - Basic understanding of data analysis concepts, such as data types, aggregation, and trends, will be helpful.
- Basic Excel Skills - A foundational knowledge of Excel is beneficial for data preprocessing and manipulation before importing into Power BI.
- Understanding of Key Performance Indicators (KPIs) - Familiarity with KPIs and their significance in evaluating business performance.
- Visualization Concepts - Basic comprehension of data visualization principles and chart types, like bar charts, line graphs, and pie charts.
How Are We Going To Build This?
We will build the sales dashboard Power BI using a systematic approach. First, we'll import the sales data into Power BI, ensuring it's cleaned, structured, and prepared appropriately. The heart of the dashboard lies in designing compelling visualizations - we'll utilize bar charts, line graphs, and pie charts to showcase sales trends, regional comparisons, and performance. Then, using card visualizations, we'll add key performance indicators (KPIs) like total revenue, average order value, etc. Interactivity will be added through slicers and filters, enabling users to drill down into data subsets dynamically.
How to Create a Sales Dashboard Using Power BI
Let’s explore the various steps involved in creating a sales dashboard Power BI -
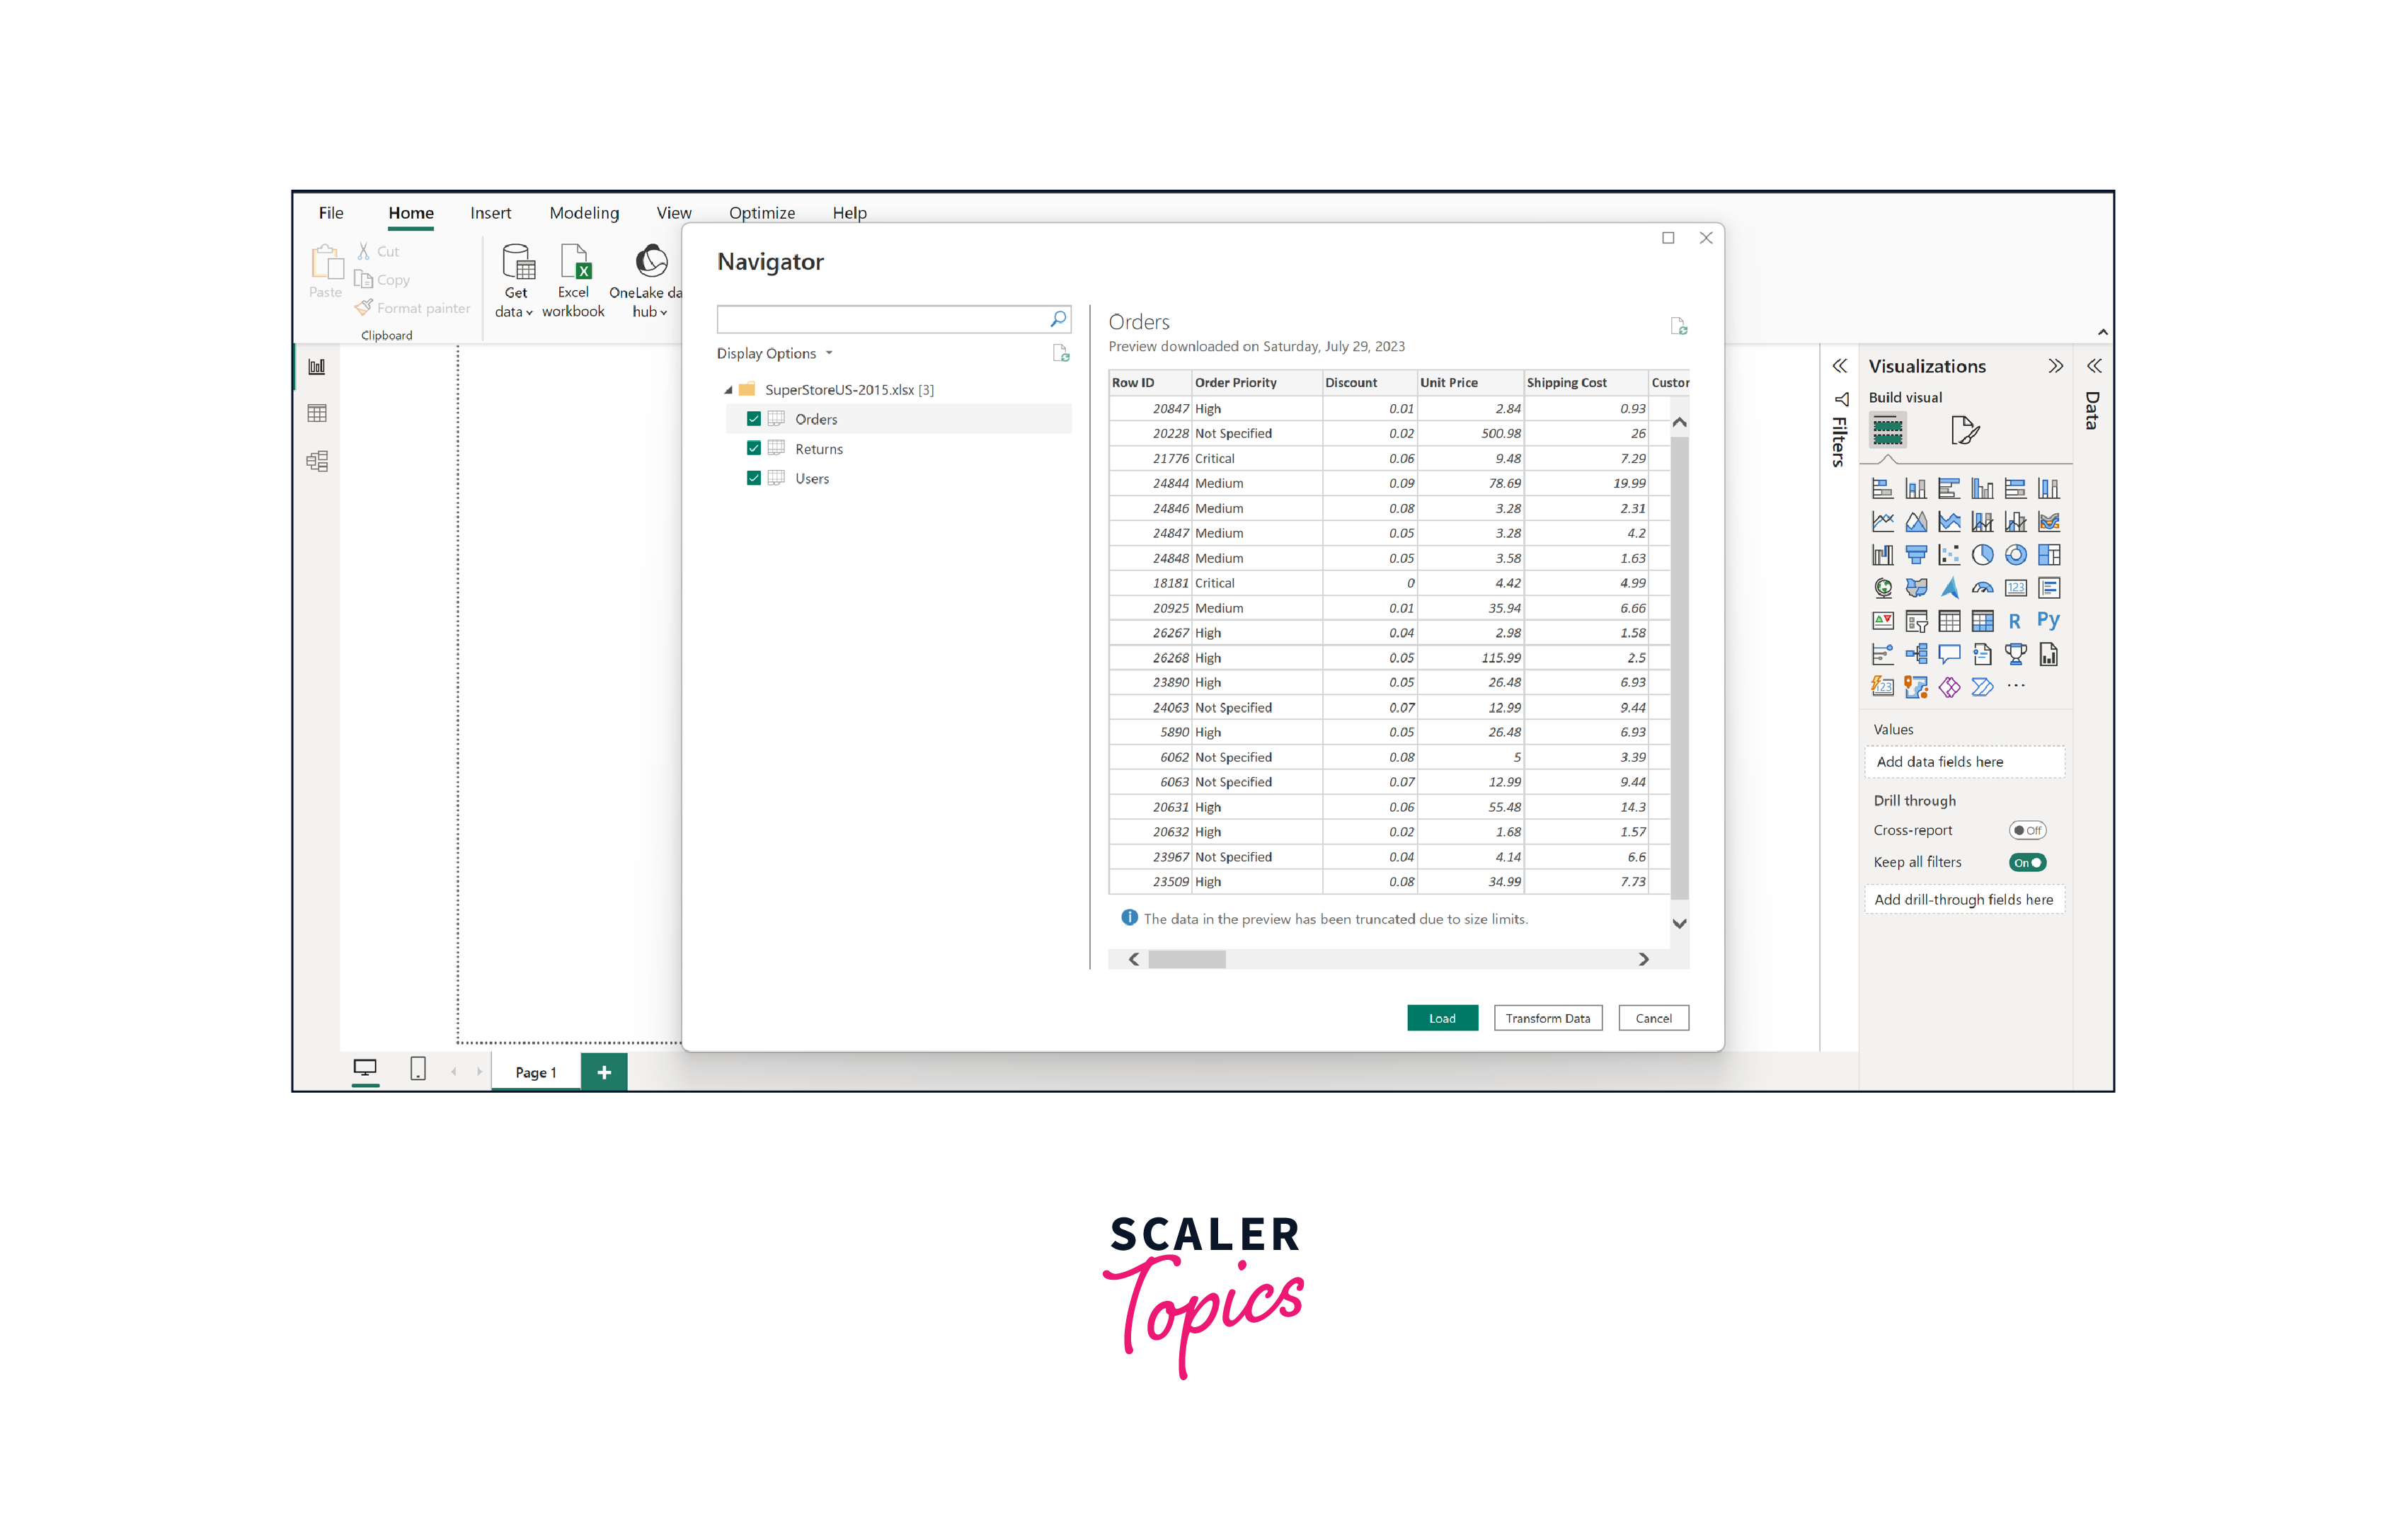
Step 1: Connect to Your Data Source
The first step in creating your Sales Dashboard using Power BI is to connect to your data source. For this project, we will utilize a sales dataset from a USA-based superstore for the year 2015. You can also download this dataset from here. This dataset contains comprehensive sales information, including product details, categories, customer segments, regions, order dates, sales, profits, etc. Establishing this data connection is the foundation upon which we will build insightful visualizations and metrics to showcase sales performance and trends.
To connect to a data store using Power BI -
- Open Power BI Desktop.
- Click "Home" > "Get Data" > select your data source (e.g., Excel, CSV, database).
- Browse and select your dataset, then follow the prompts to configure the connection and load data into Power BI.
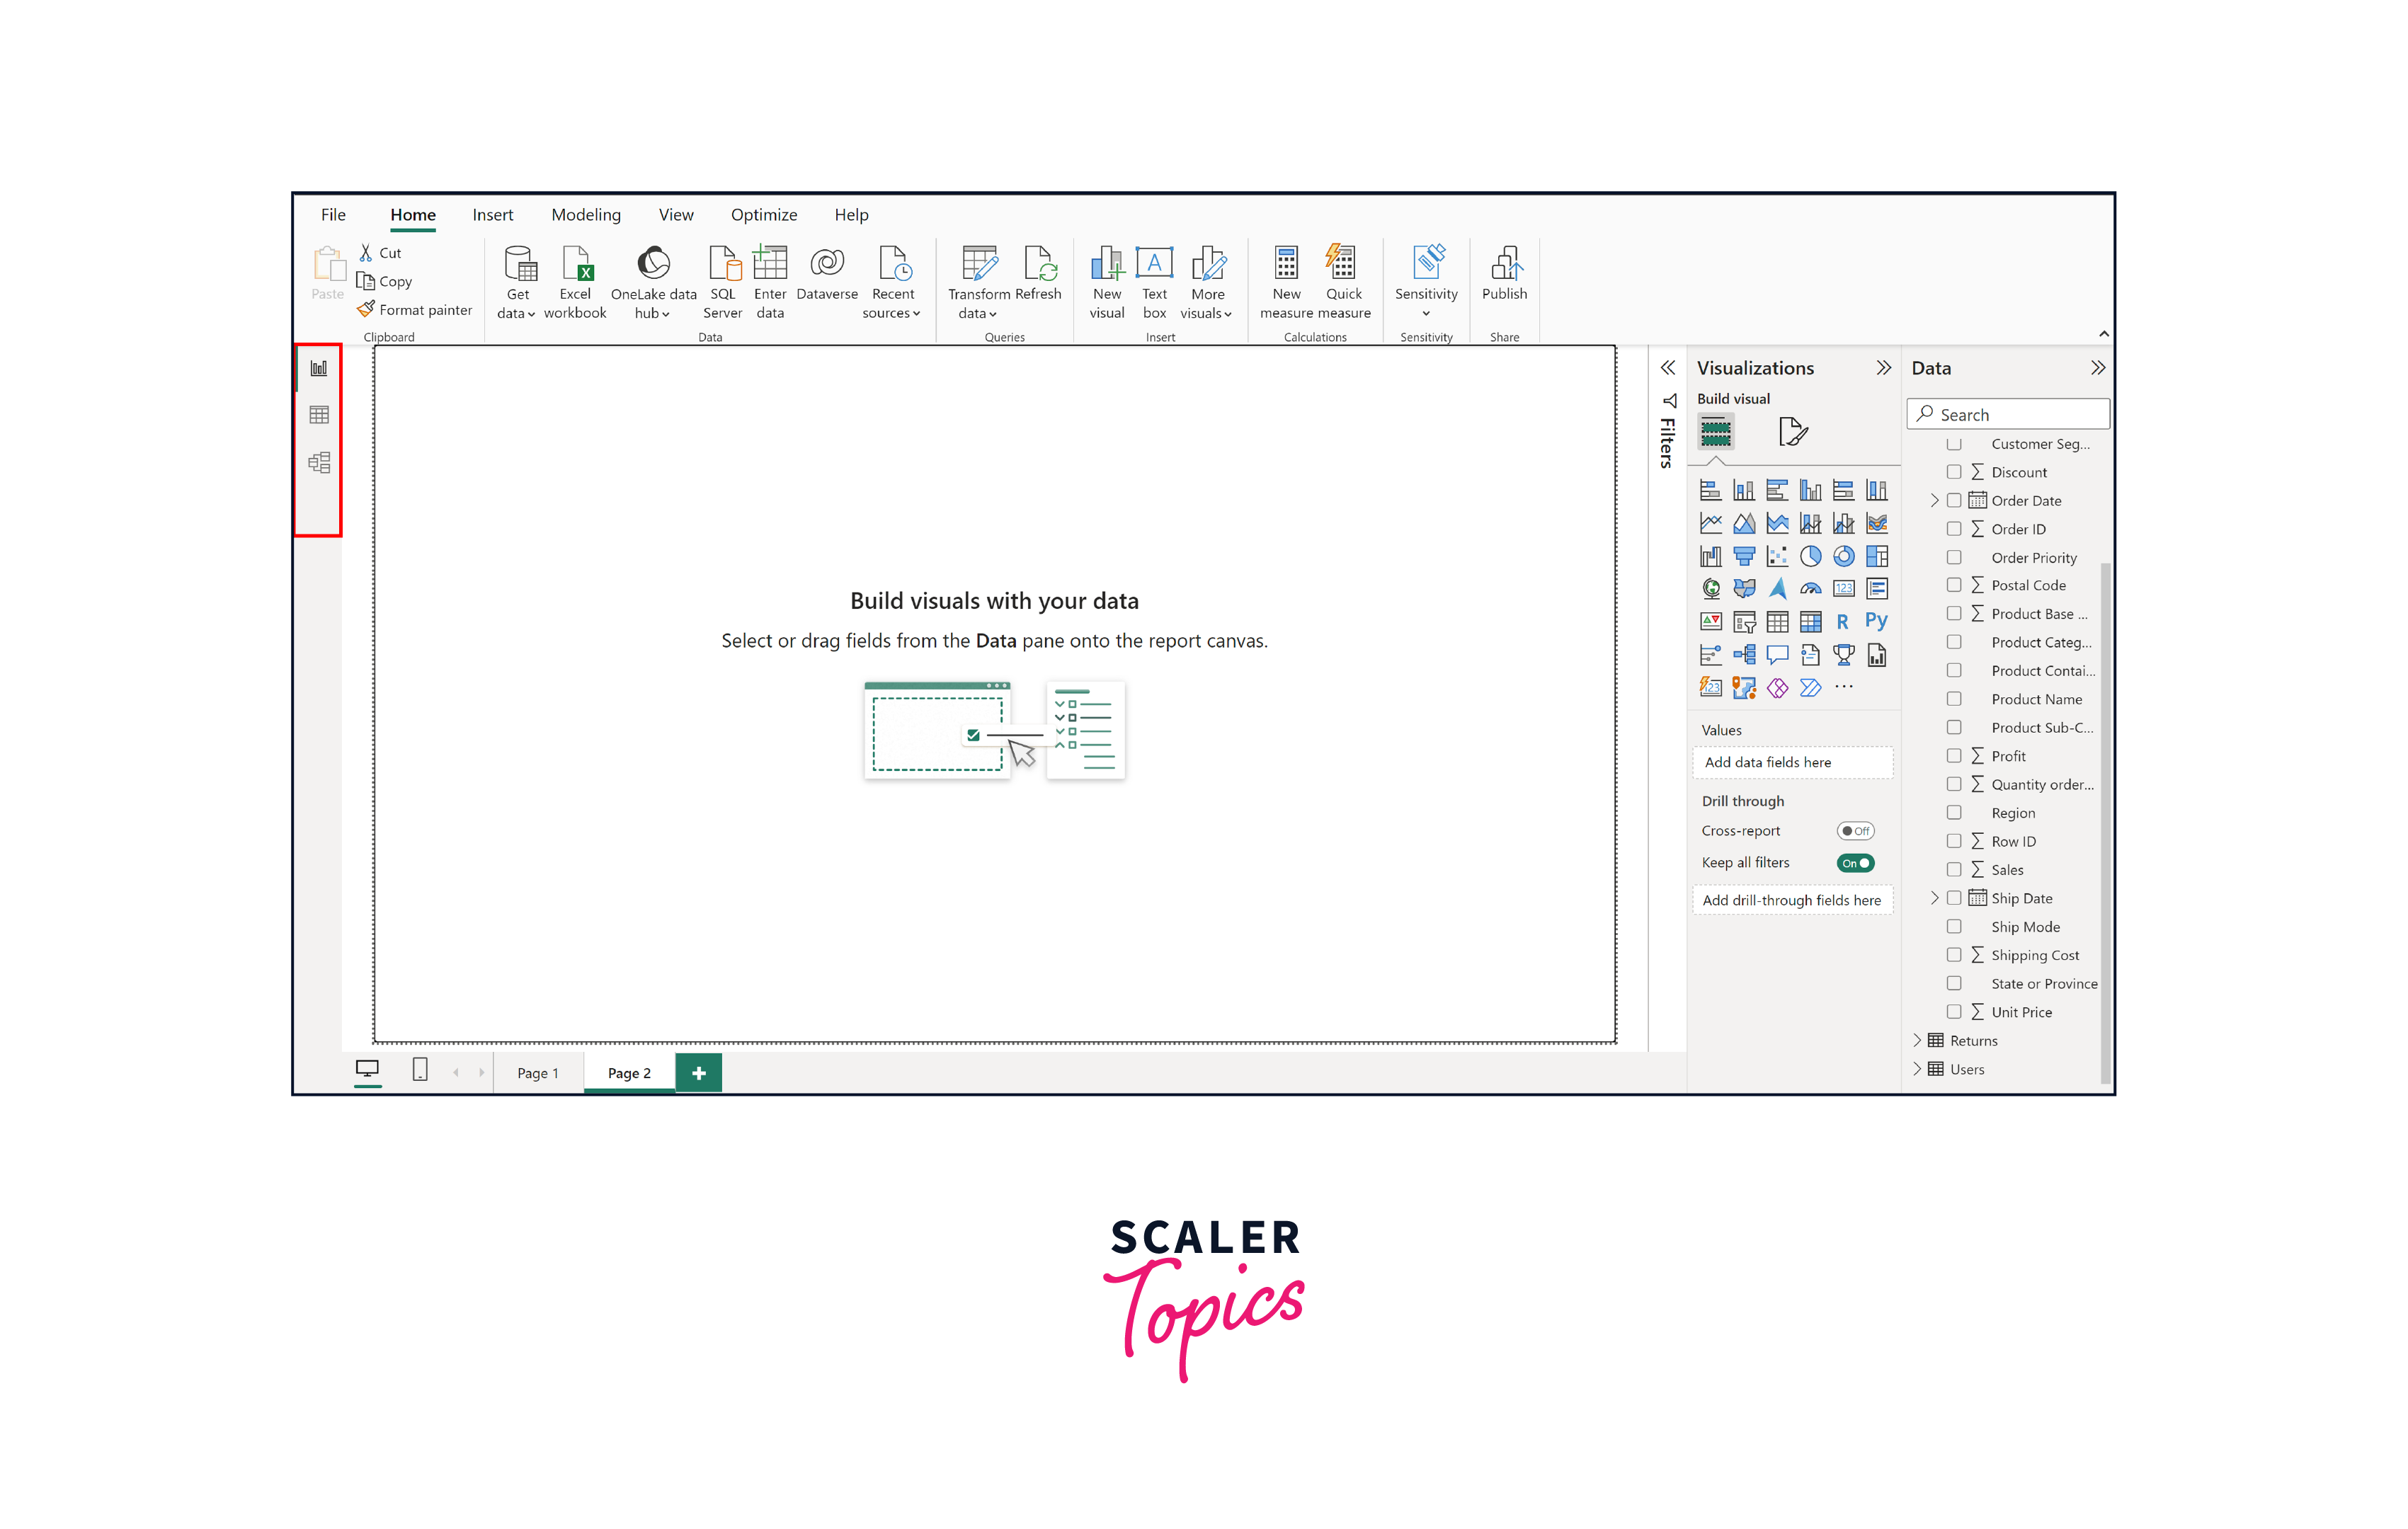
Step 2: Create A New Report
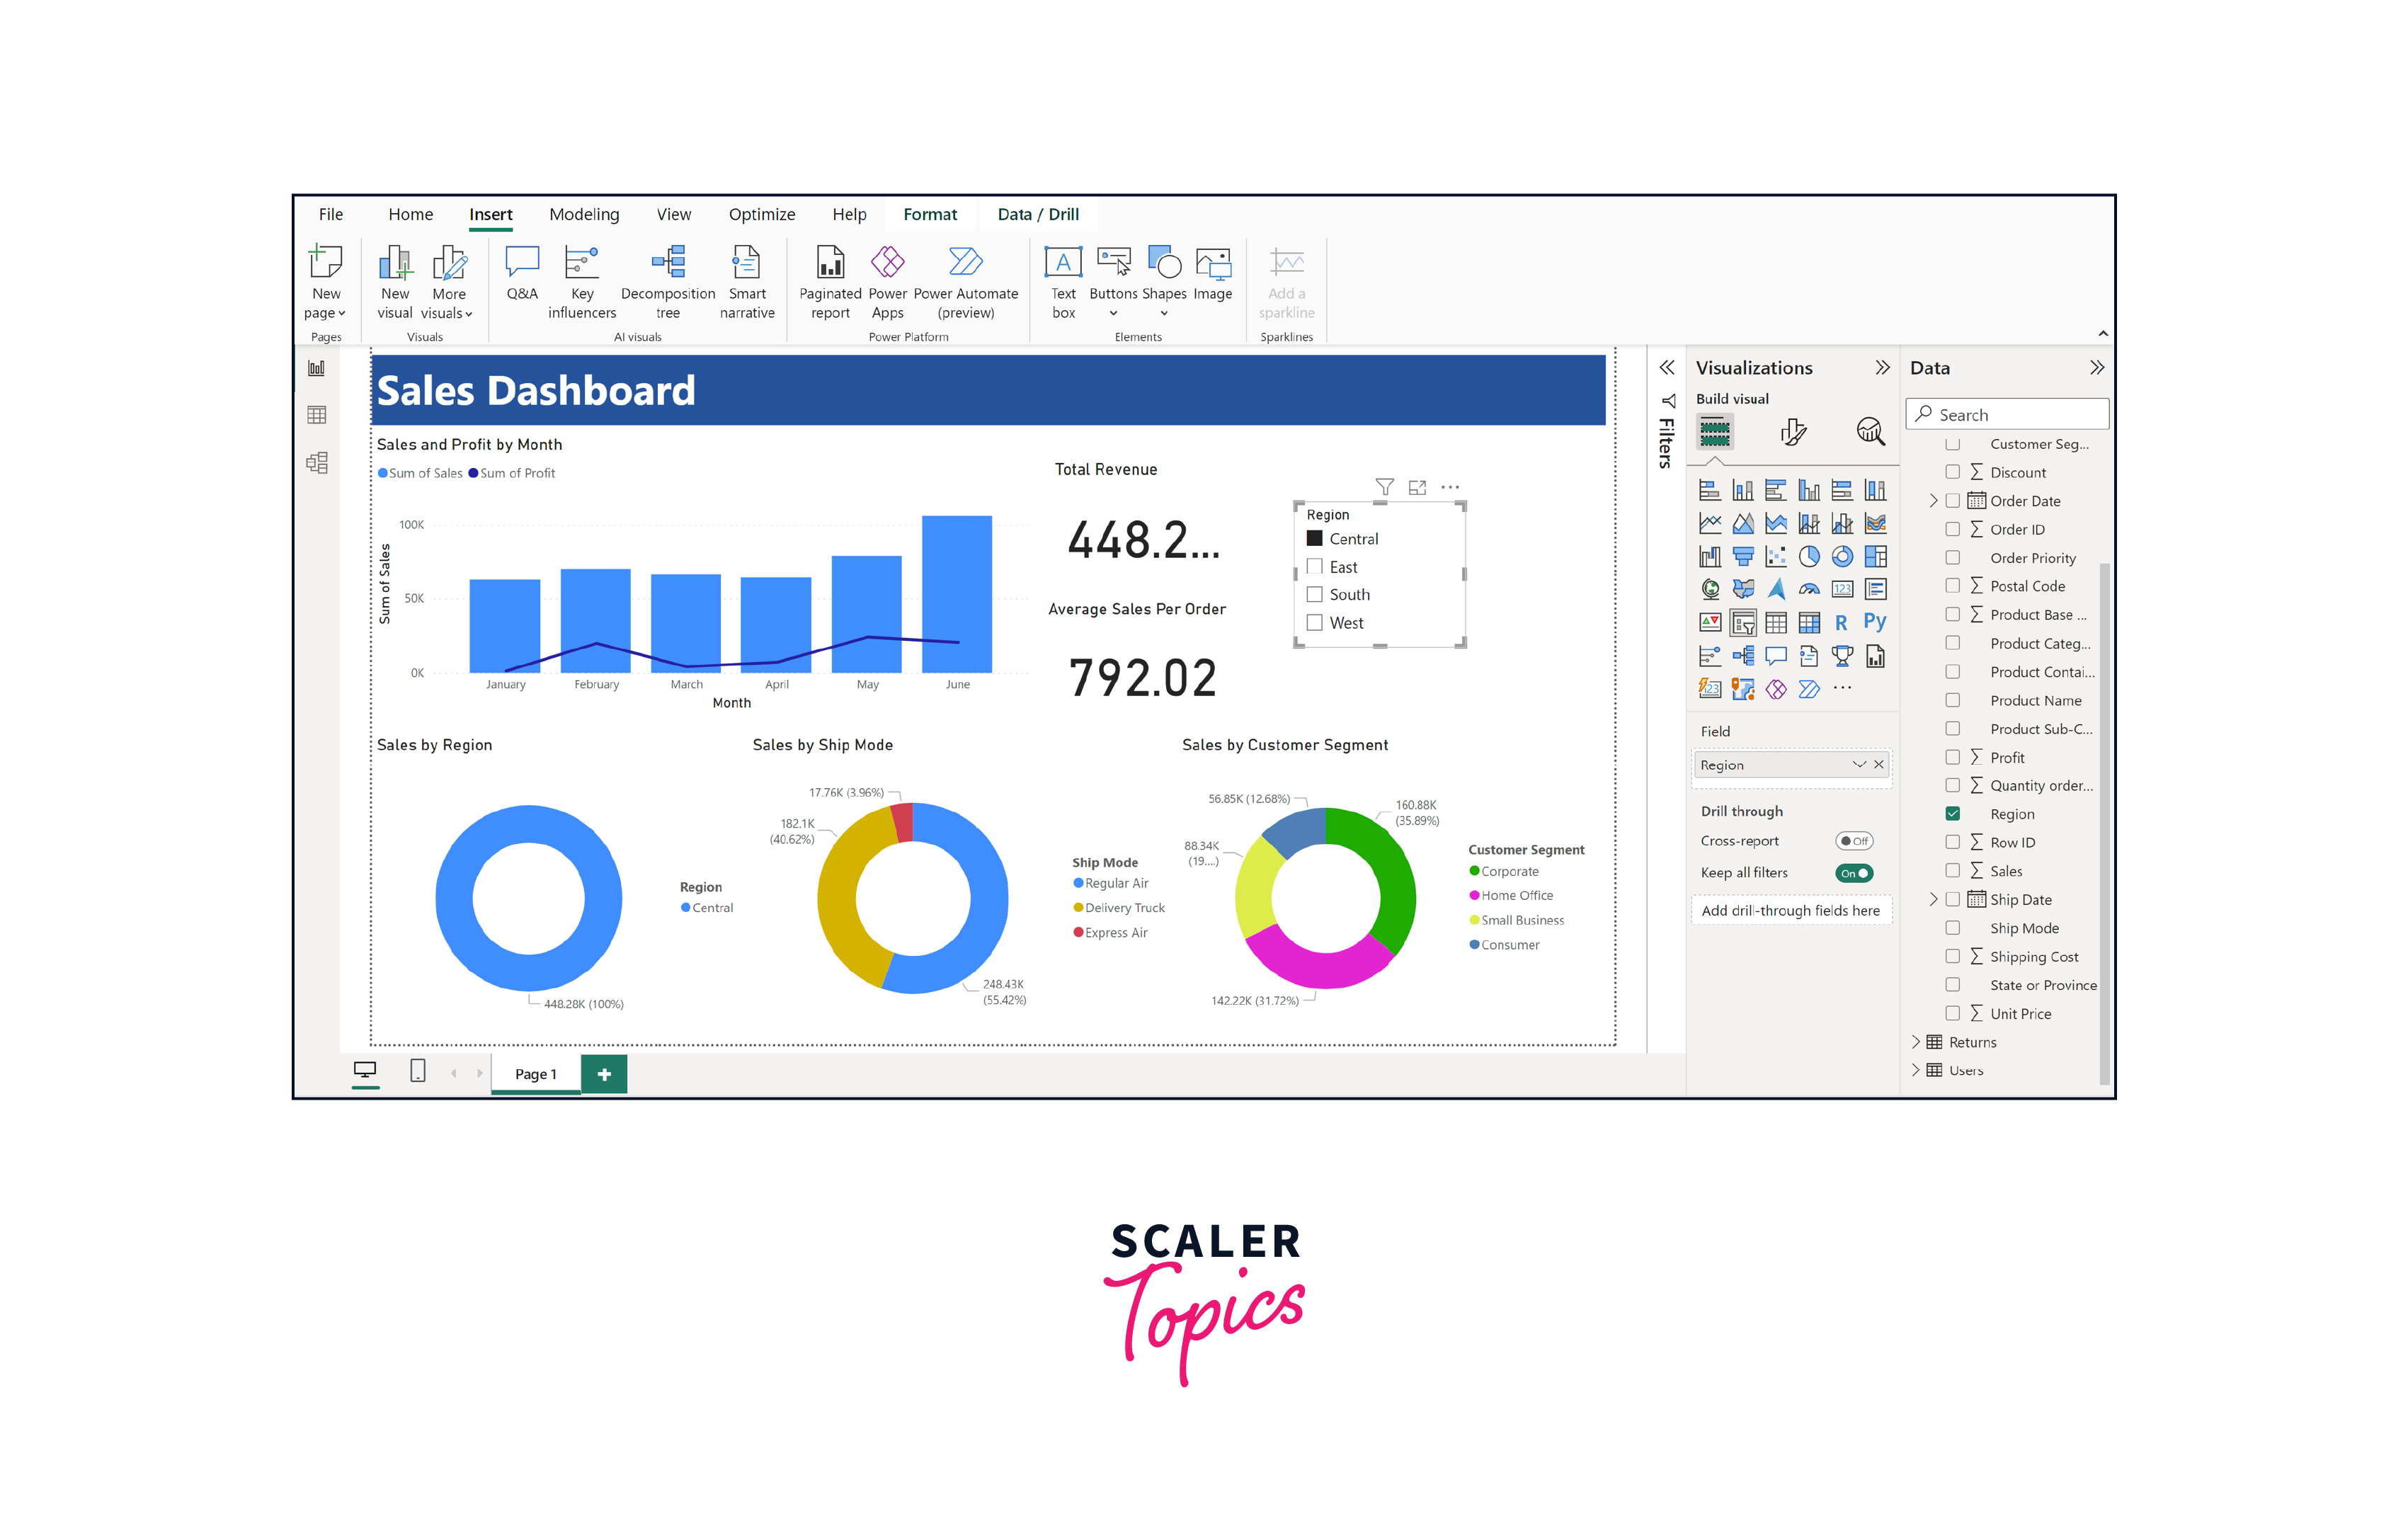
The next step in our journey to build a Sales Dashboard using Power BI is to create a new report canvas. After loading your data, click on the "Report View" tab (located on the left side) in Power BI Desktop. This will open a blank canvas where you can start designing your dashboard. Here, you'll add various visualizations, charts, and KPIs to represent your sales data effectively. This canvas serves as a dynamic workspace to arrange and customize elements that will form the basis of your interactive sales dashboard.
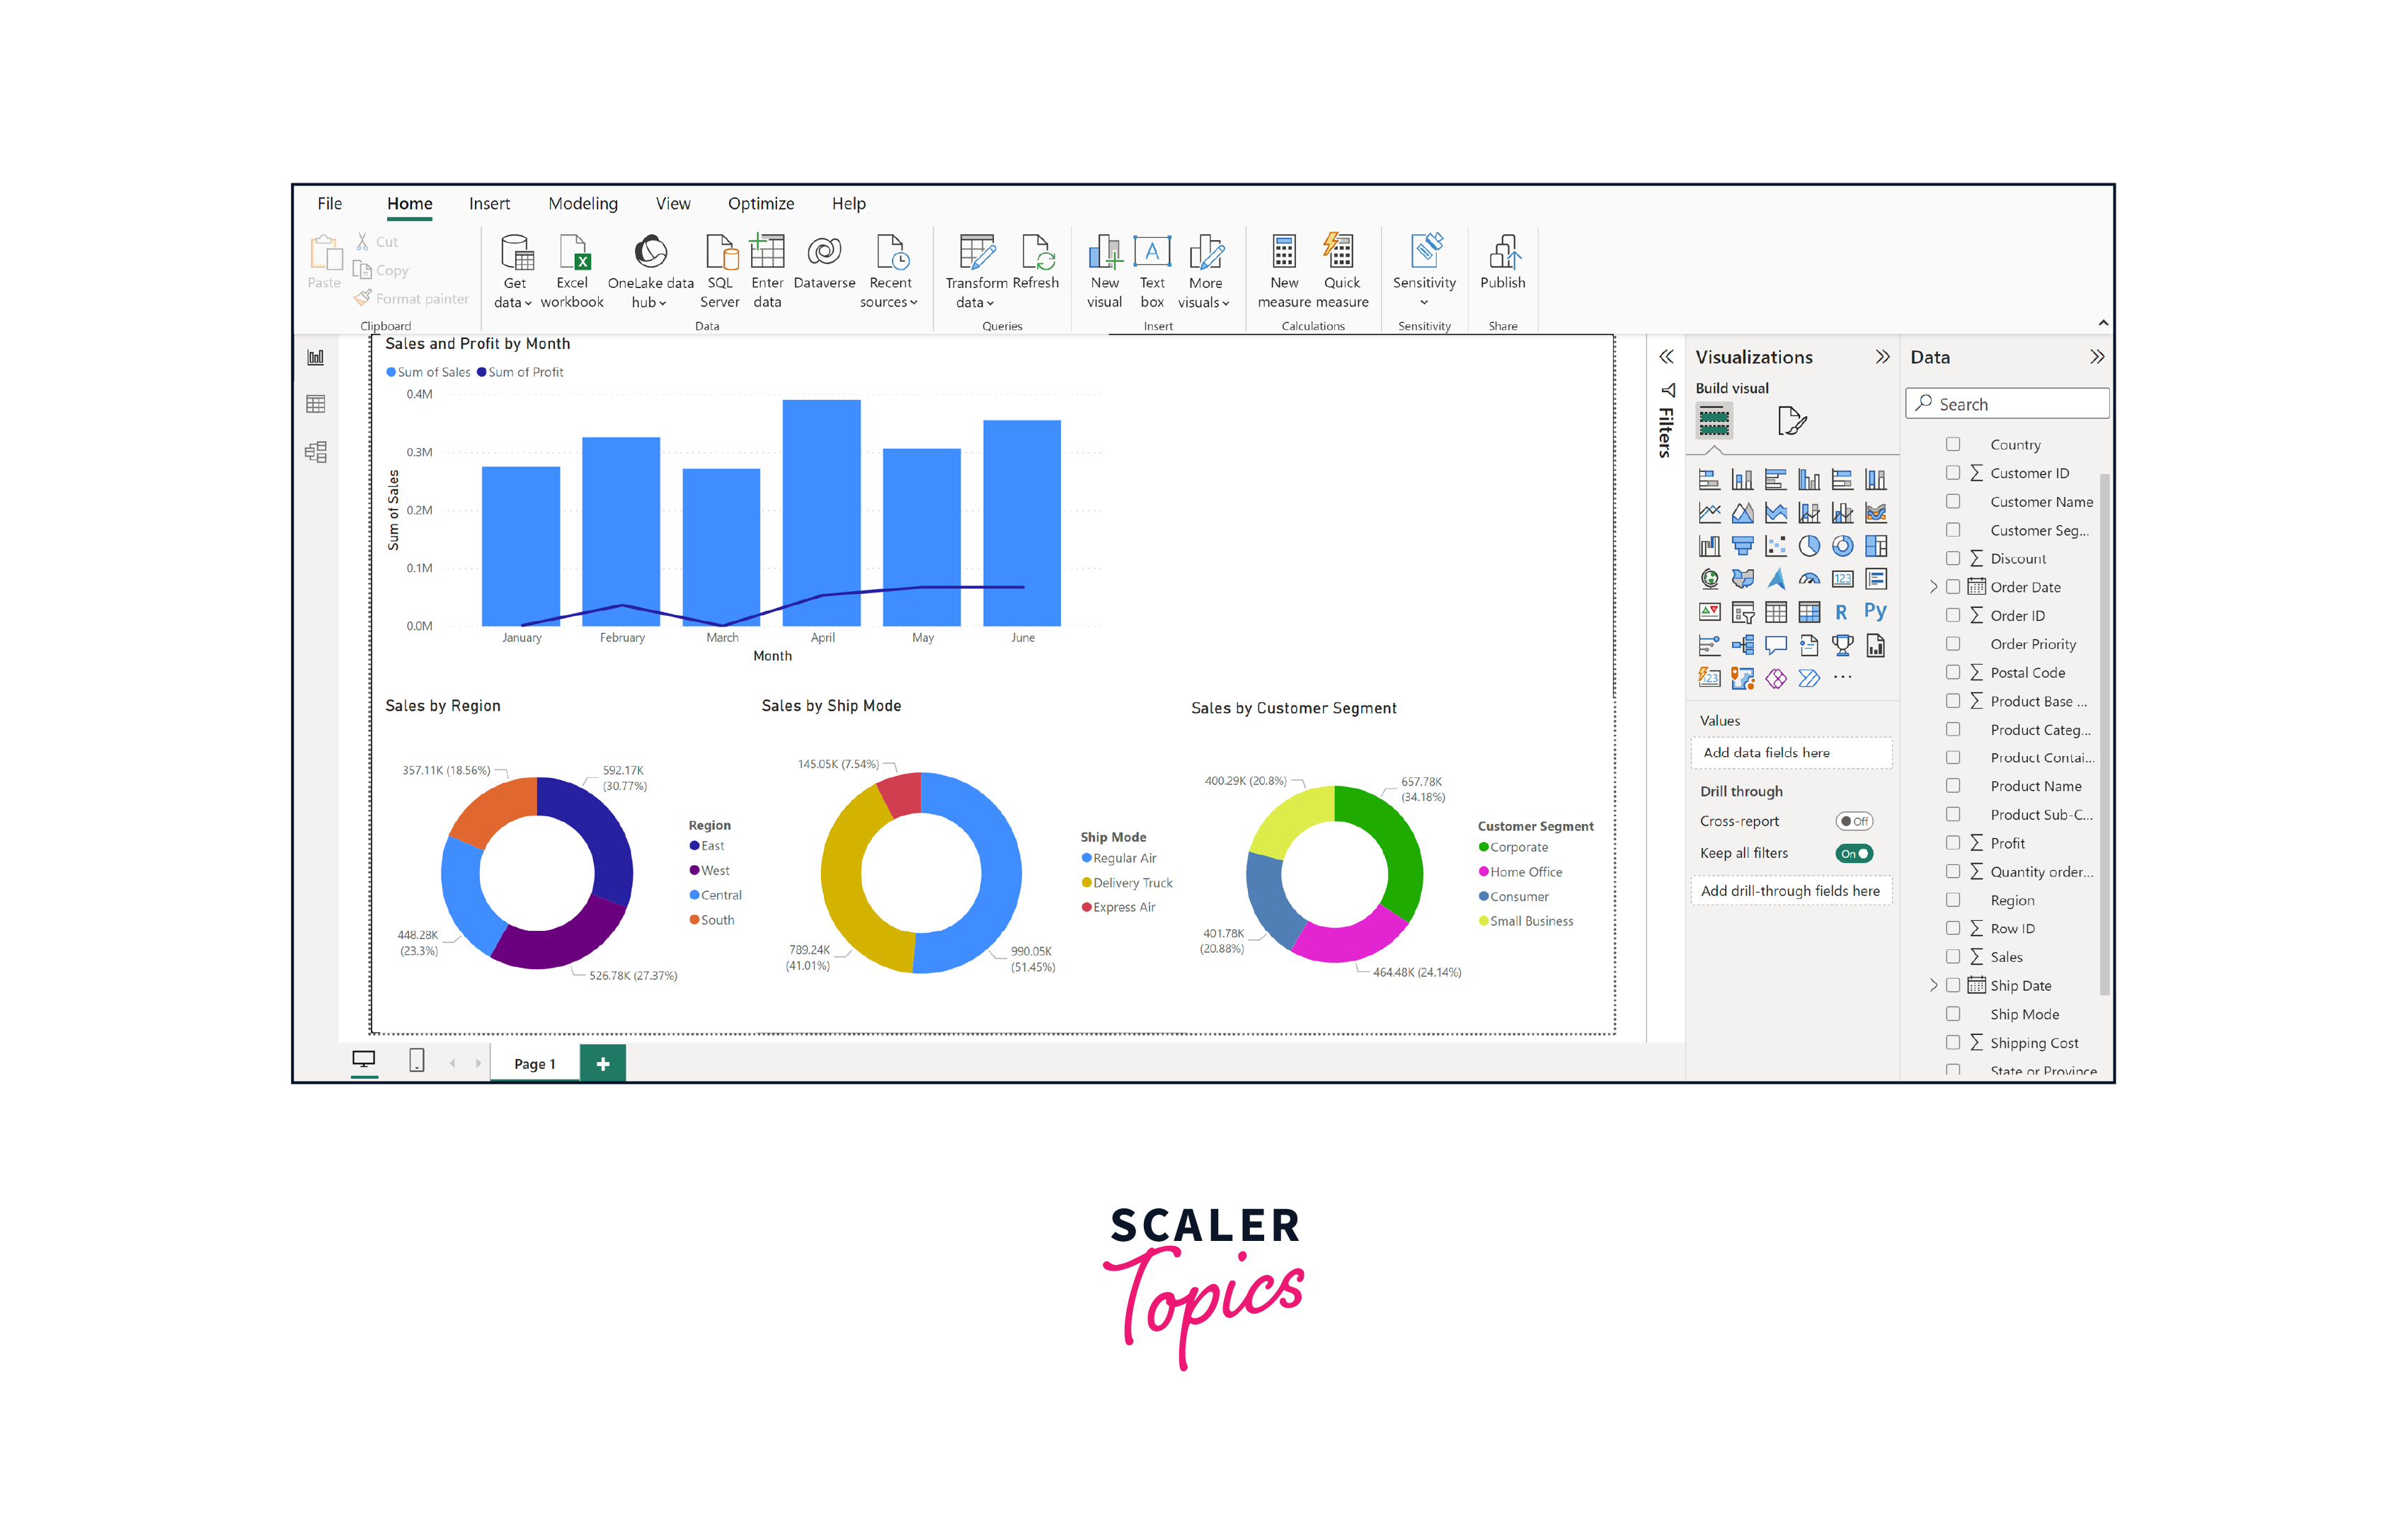
Step 3: Add Visualizations
In this pivotal step of our Sales Dashboard creation process, we'll add a wide range of visualizations to convey vital insights from our data. To create these visualizations in Power BI -
- Drag and drop the required fields onto the visualization area.
- Choose the appropriate visualization type (bar, line, or pie chart).
- Customize the visualizations by configuring labels, colors, and other settings.
In this project, we will focus on below visualizations -
-
Bar and Line Chart for Monthly Sales and Profit Trends
To visualize sales and profit trends over time, we'll add a combination bar and line chart. The bars will represent monthly sales, while the line will represent profit. This dual-axis visualization will provide a clear depiction of how sales and profit correlate month by month, enabling us to spot trends and patterns.
-
Pie Charts for Sales Distribution Analysis
For a comprehensive understanding of our sales distribution, we'll employ pie charts. These charts will depict the proportion of sales across various segments, including regions, customer segments, and shipping modes.
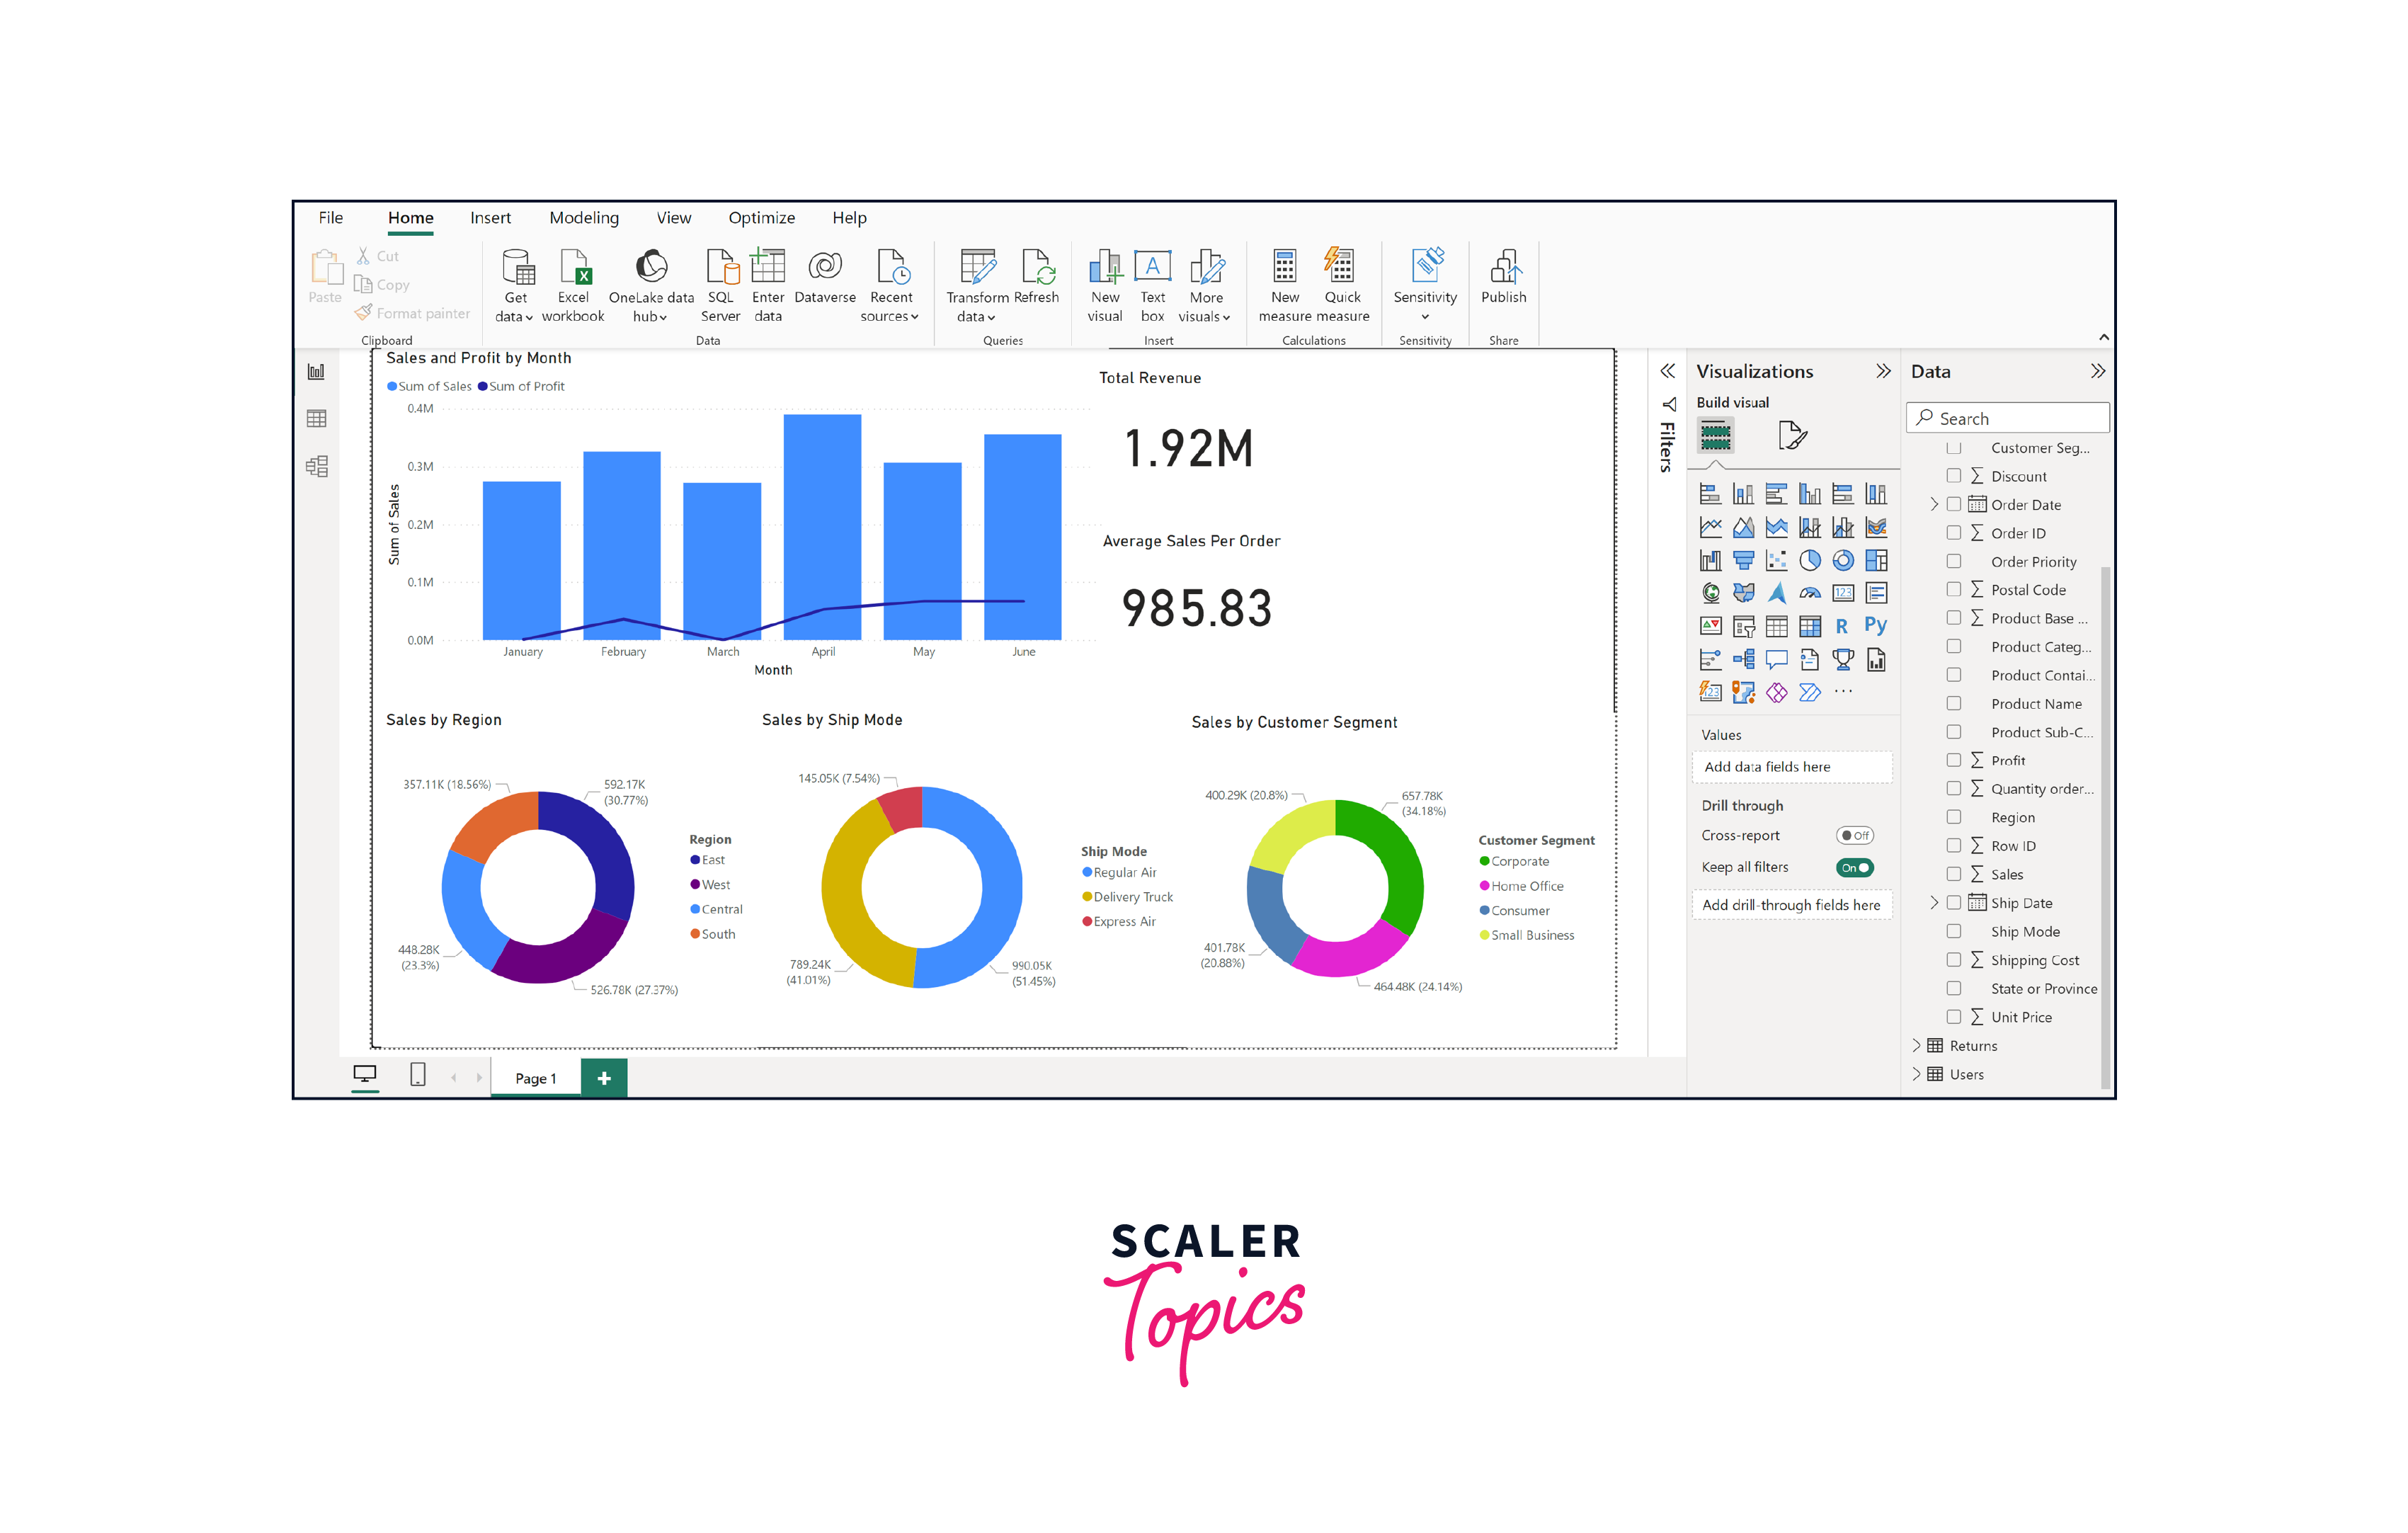
Step 4: Add the KPIs to the Dashboard
To add Key Performance Indicators (KPIs) to the dashboard, we'll utilize card visualizations in Power BI -
- Click on "Card" from the Visualizations pane.
- Drag and drop the relevant field onto the "Values" section of the card.
- Customize the card by adding appropriate titles and formatting.
For instance, you can create KPI cards to display metrics like Total Revenue, Average Order Value, and Year-over-Year Growth. These concise visual elements provide immediate insights into essential performance indicators, enhancing the dashboard's impact and usability. In this project, we will add two KPIs, total sales and average sales per order, in the dashboard.
Step 5: Add Filters and Interactivity
Adding filters and interactivity to the sales dashboard is crucial as it empowers users to explore the data, focus on specific aspects, and gain deeper insights. Filters allow users to dynamically adjust data views, making the dashboard adaptable to various scenarios. Here's how to achieve it in Power BI -
- From the "Visualizations" pane, select "Slicer."
- Drag fields relevant to filtering (e.g., region, order date) onto the slicer.
- Users can now interactively filter data by selecting options within the slicer.
This feature enables users to dynamically refine the displayed data dynamically, gaining deeper insights and customizing their analysis according to specific criteria. In this dashboard, we will add a filter based on the region feature. We have also added a title bar in the canvas, as shown below.
Step 6: Publishing and Sharing The Dashboard
Publishing and sharing the dashboard is crucial, allowing stakeholders to access insights and collaborate seamlessly. Here's how to do it -
- Click "Publish" in Power BI Desktop.
- Choose Power BI Service workspace to publish to.
- In Power BI Service, open the report, click "Share," and specify recipients' email addresses.
- Set permissions (view or edit).
- Recipients receive an email invitation with a link to the shared dashboard.
More on Power BI Sales Dashboard Examples
Let’s explore some more templates and examples for Power BI sales dashboards, as mentioned below -
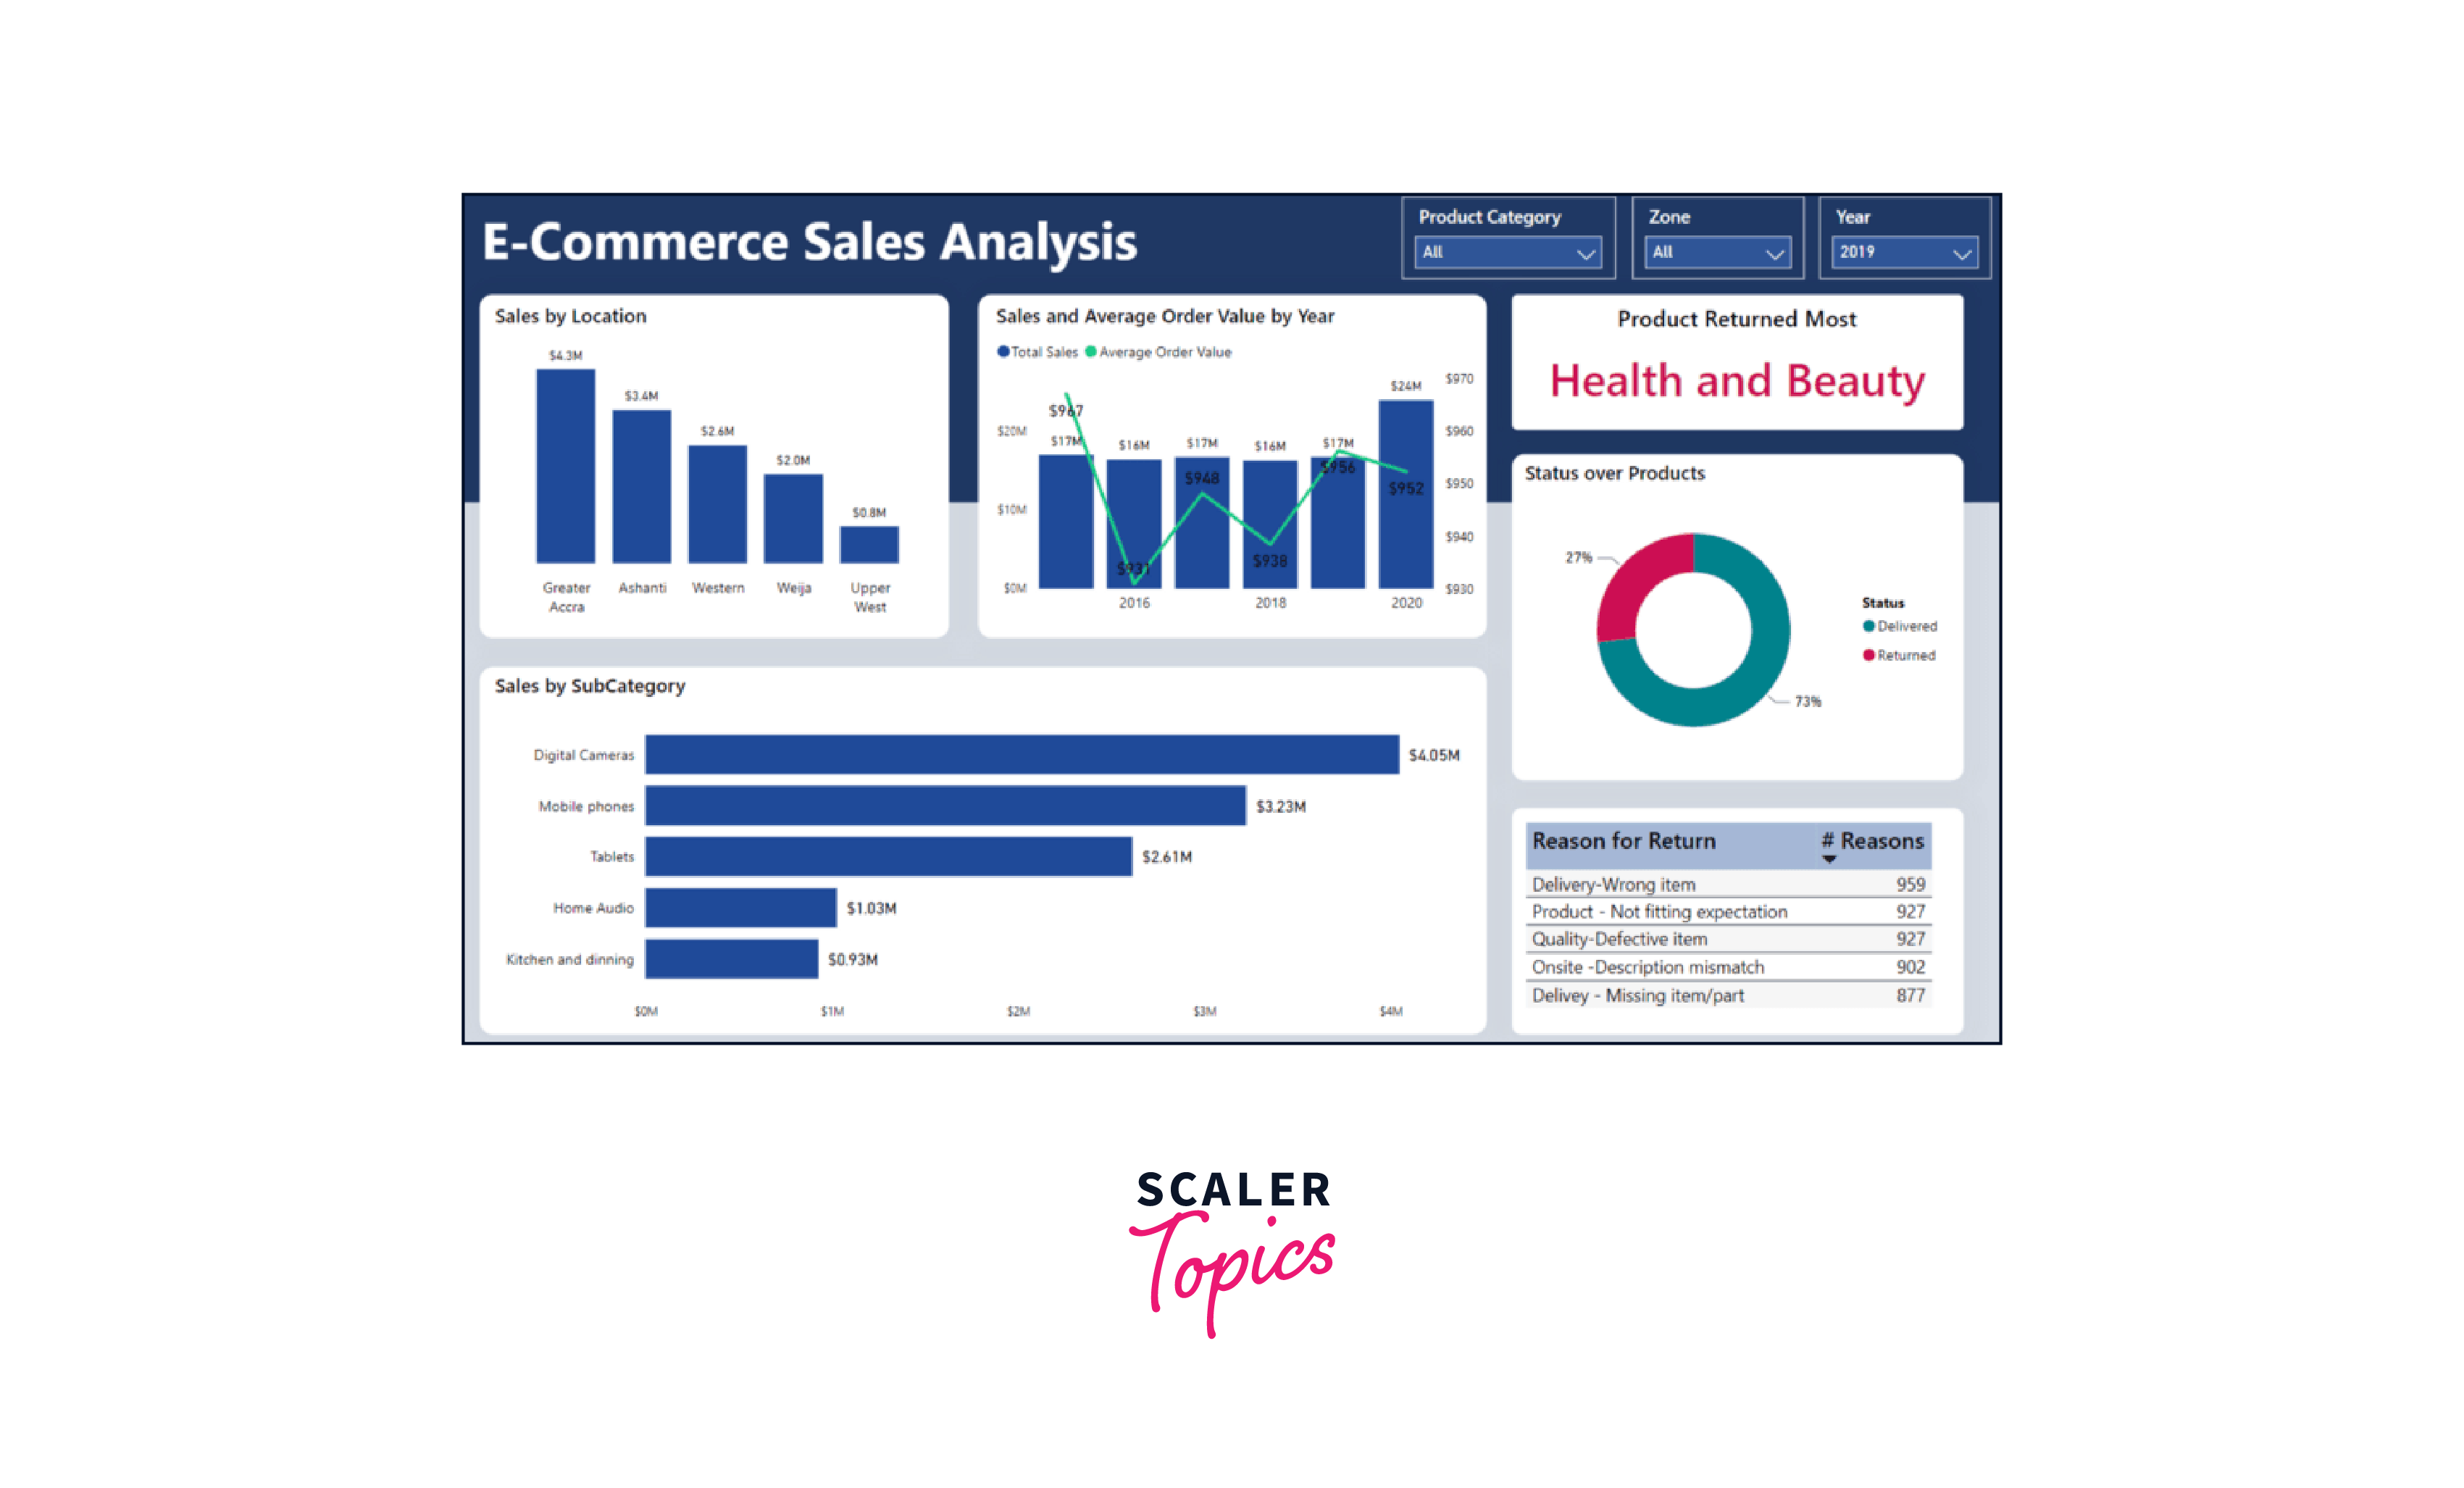
1. E-commerce Sales Dashboard
Designed and developed for online retailers, this dynamic dashboard offers comprehensive insights, spanning from a view to intricate details on product performance. It displays a holistic perspective on total sales, offering the flexibility to showcase year-on-year, quarterly, and monthly growth rates. Furthermore, it extends the capability for users to explore the dataset, unraveling top-performing products, geographical impact, and more. You can access the dashboard from here.
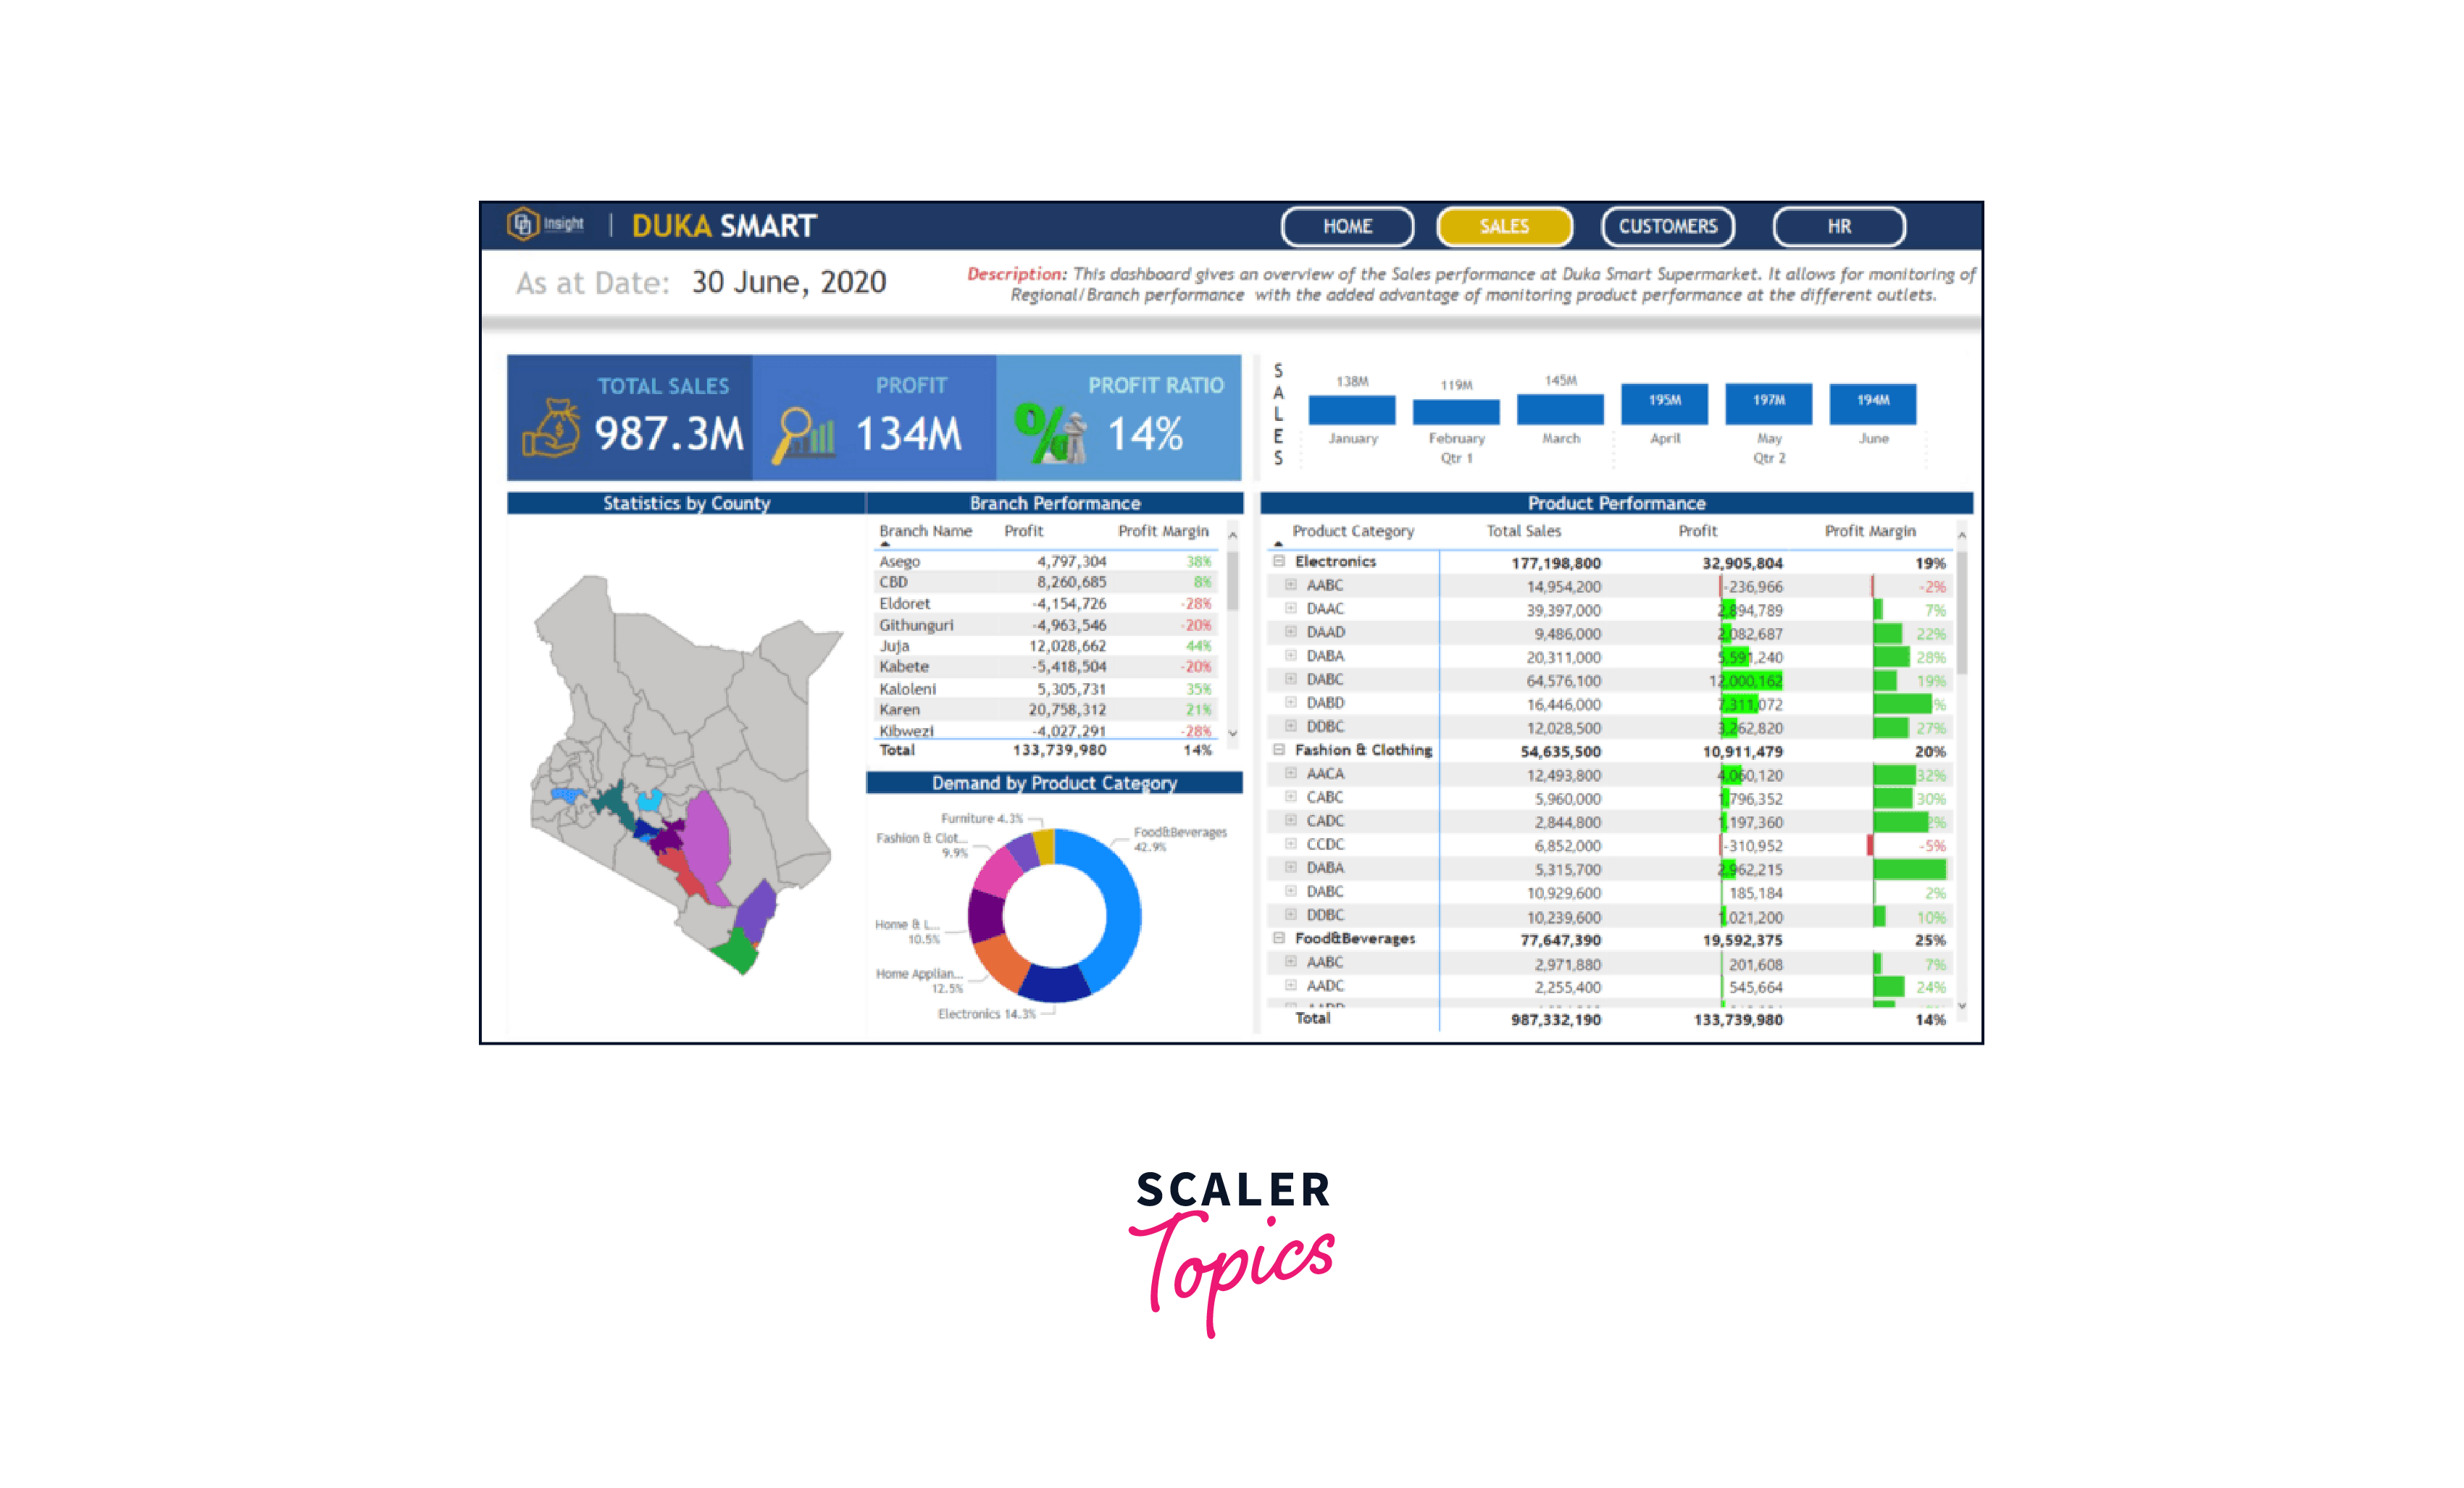
2. Supermarket Sales Dashboard
This simple yet comprehensive dashboard gives you a quick way to see how well a supermarket chain in Kenya is doing financially. There are three reports - one shows the total sales and lets you see sales for different types of products, another gives information about customers, and the third tells you about staff costs and the number of employees in different supermarket branches. You can access the dashboard from here.
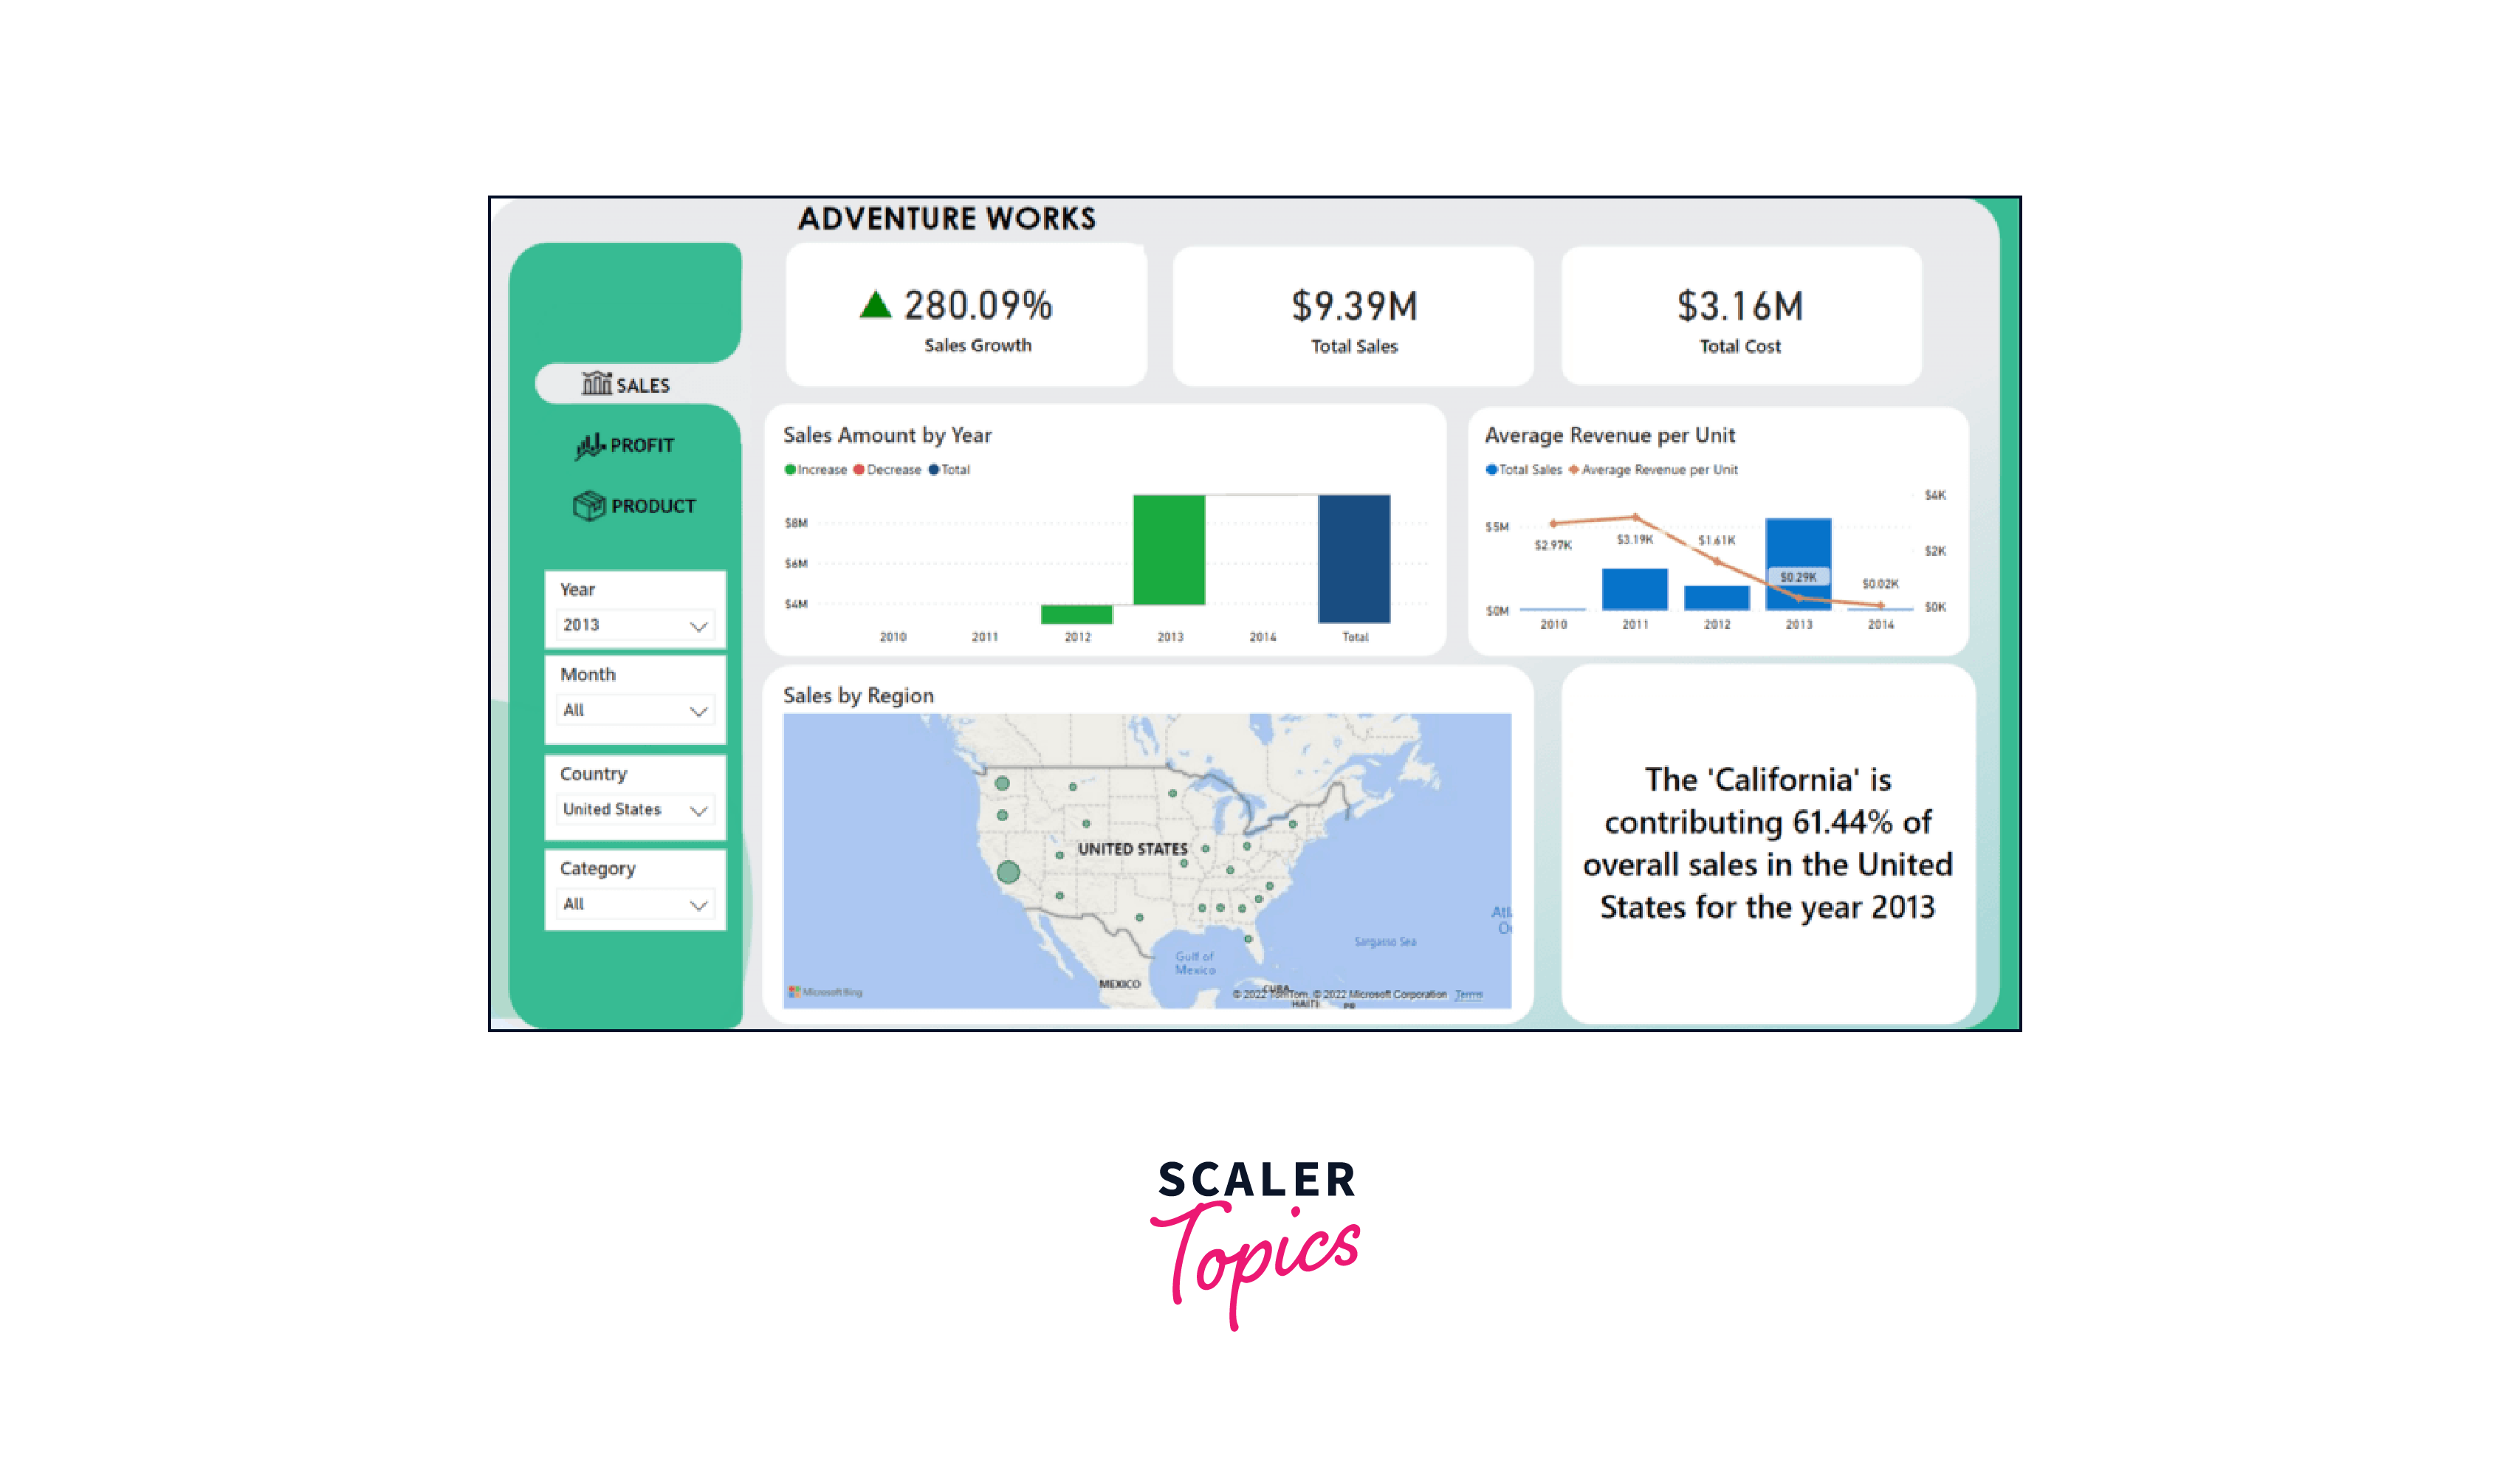
3. Sales Dashboard for AdventureWorks
This dashboard monitors how well a fictional bike company called AdventureWorks is selling. It shows a big picture of all the sales and how they're growing, and you can also look more closely at specific types of bikes. Plus, it's easy to compare sales between different years and months, and there's a cool map that shows where the most sales happen. This dashboard can be accessed from here.
Conclusion
- Building a Sales Dashboard using Power BI equips businesses with powerful tools to understand and enhance their business. The sales dashboard offers a complete view, from total sales to growth rates, aiding informed decisions.
- We designed and developed a sales dashboard in Power BI showcasing various visualizations, such as line charts, pie charts, etc., to display sales trends and card visualizations to display KPIs.
- To enhance user engagement and allow dynamic data exploration, we added interactive elements, such as slicers based on region features in the sales dashboard.