Slicers in Power BI
Overview
Slicers in Power BI are powerful data visualization tools that facilitate enhanced data exploration and analysis within reports and dashboards. As an interactive filter, slicers enable users to dynamically slice through data, allowing them to focus on specific subsets of information/data. Slicers empower users to interact with data effortlessly by providing an intuitive and user-friendly interface, gaining valuable insights, and driving data-driven decision-making processes. In this article, we will explore the fundamental aspects of slicers in Power BI, their functionalities, and how to effectively utilize them to maximize the potential of Power BI for data analysis and business intelligence.
What are Power BI Slicers?
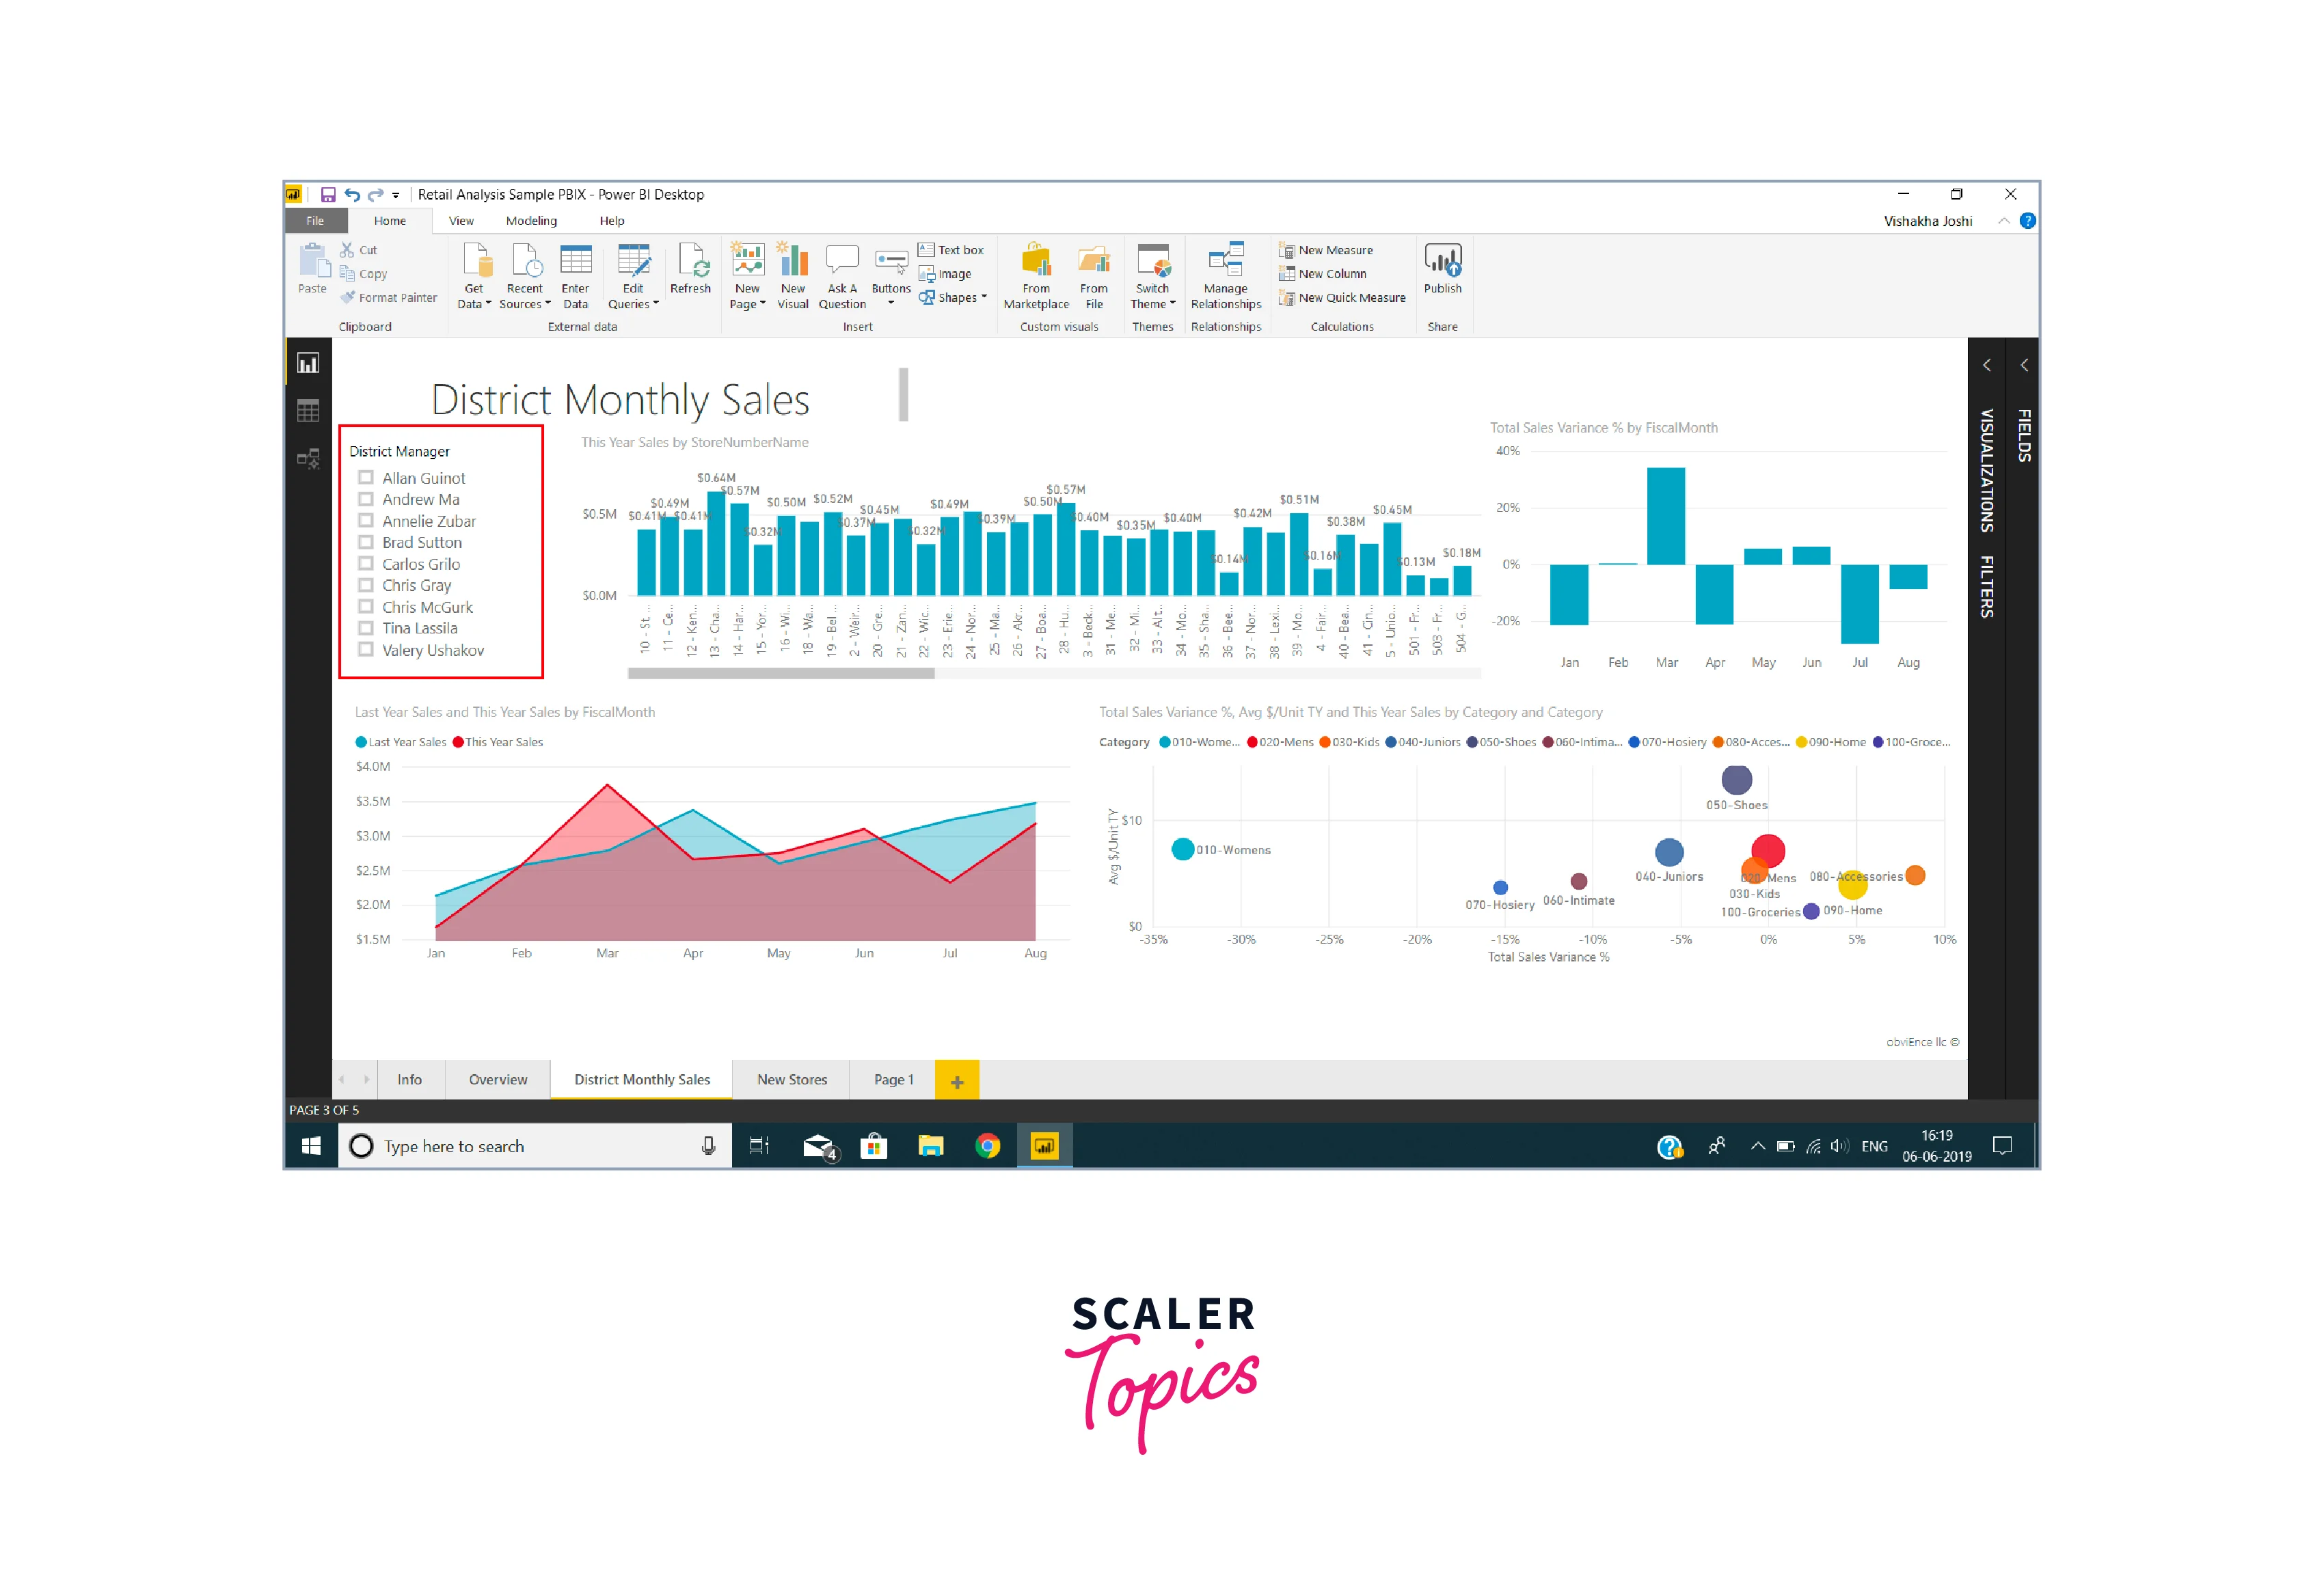
Power BI slicers are interactive and user-friendly filtering components allowing users to filter data within reports and dashboards interactively. Essentially, slicers in Power BI act as data filters, enabling users to focus on specific subsets of information without requiring complex queries or manual data manipulation. These visual controls offer an intuitive way to interact with data, making it easier to explore and analyze large datasets dynamically. Unlike traditional filters, slicers in Power BI are presented visually on the report, allowing users to select specific values as they analyze the data. For example, in a sales analysis report, a slicer for years enables users to choose a particular year to view sales metrics, automatically updating the visuals accordingly.
As illustrated in the image, slicers provide an intuitive way to enhance data exploration, making it easier to focus on the information that matters most.
Need for Using Power BI Slicer
If you have any of the following needs for your data analysis, incorporating a slicer in your Power BI report will be beneficial -
- Handling Large Datasets - Slicers in Power BI are essential when dealing with large volumes or amounts of data, allowing users to swiftly filter and navigate through information without cluttering the visualizations.
- Dynamic Data Exploration - When users need to interactively explore different facets of their data and instantly see the impact of filtering on visualizations, slicers in Power BI provide a quick and effortless solution.
- Facilitating User Interactivity - Slicers enhance user engagement by enabling users to control and customize the data they want to view, tailoring the analysis to their specific needs.
- Simplifying Data Analysis - For business analysts and decision-makers, slicers simplify data analysis by offering an intuitive way to drill down into specific data points or focus on critical trends.
- Enhancing Dashboard Aesthetics - By integrating slicers into dashboards, users can create visually appealing and dynamic reports, elevating the overall user experience and understanding of the data presented.
How To Create Slicer in Power BI Desktop (Step By Step)
To create slicers in Power BI, you can use the following step-by-step process in your Power BI Desktop application -
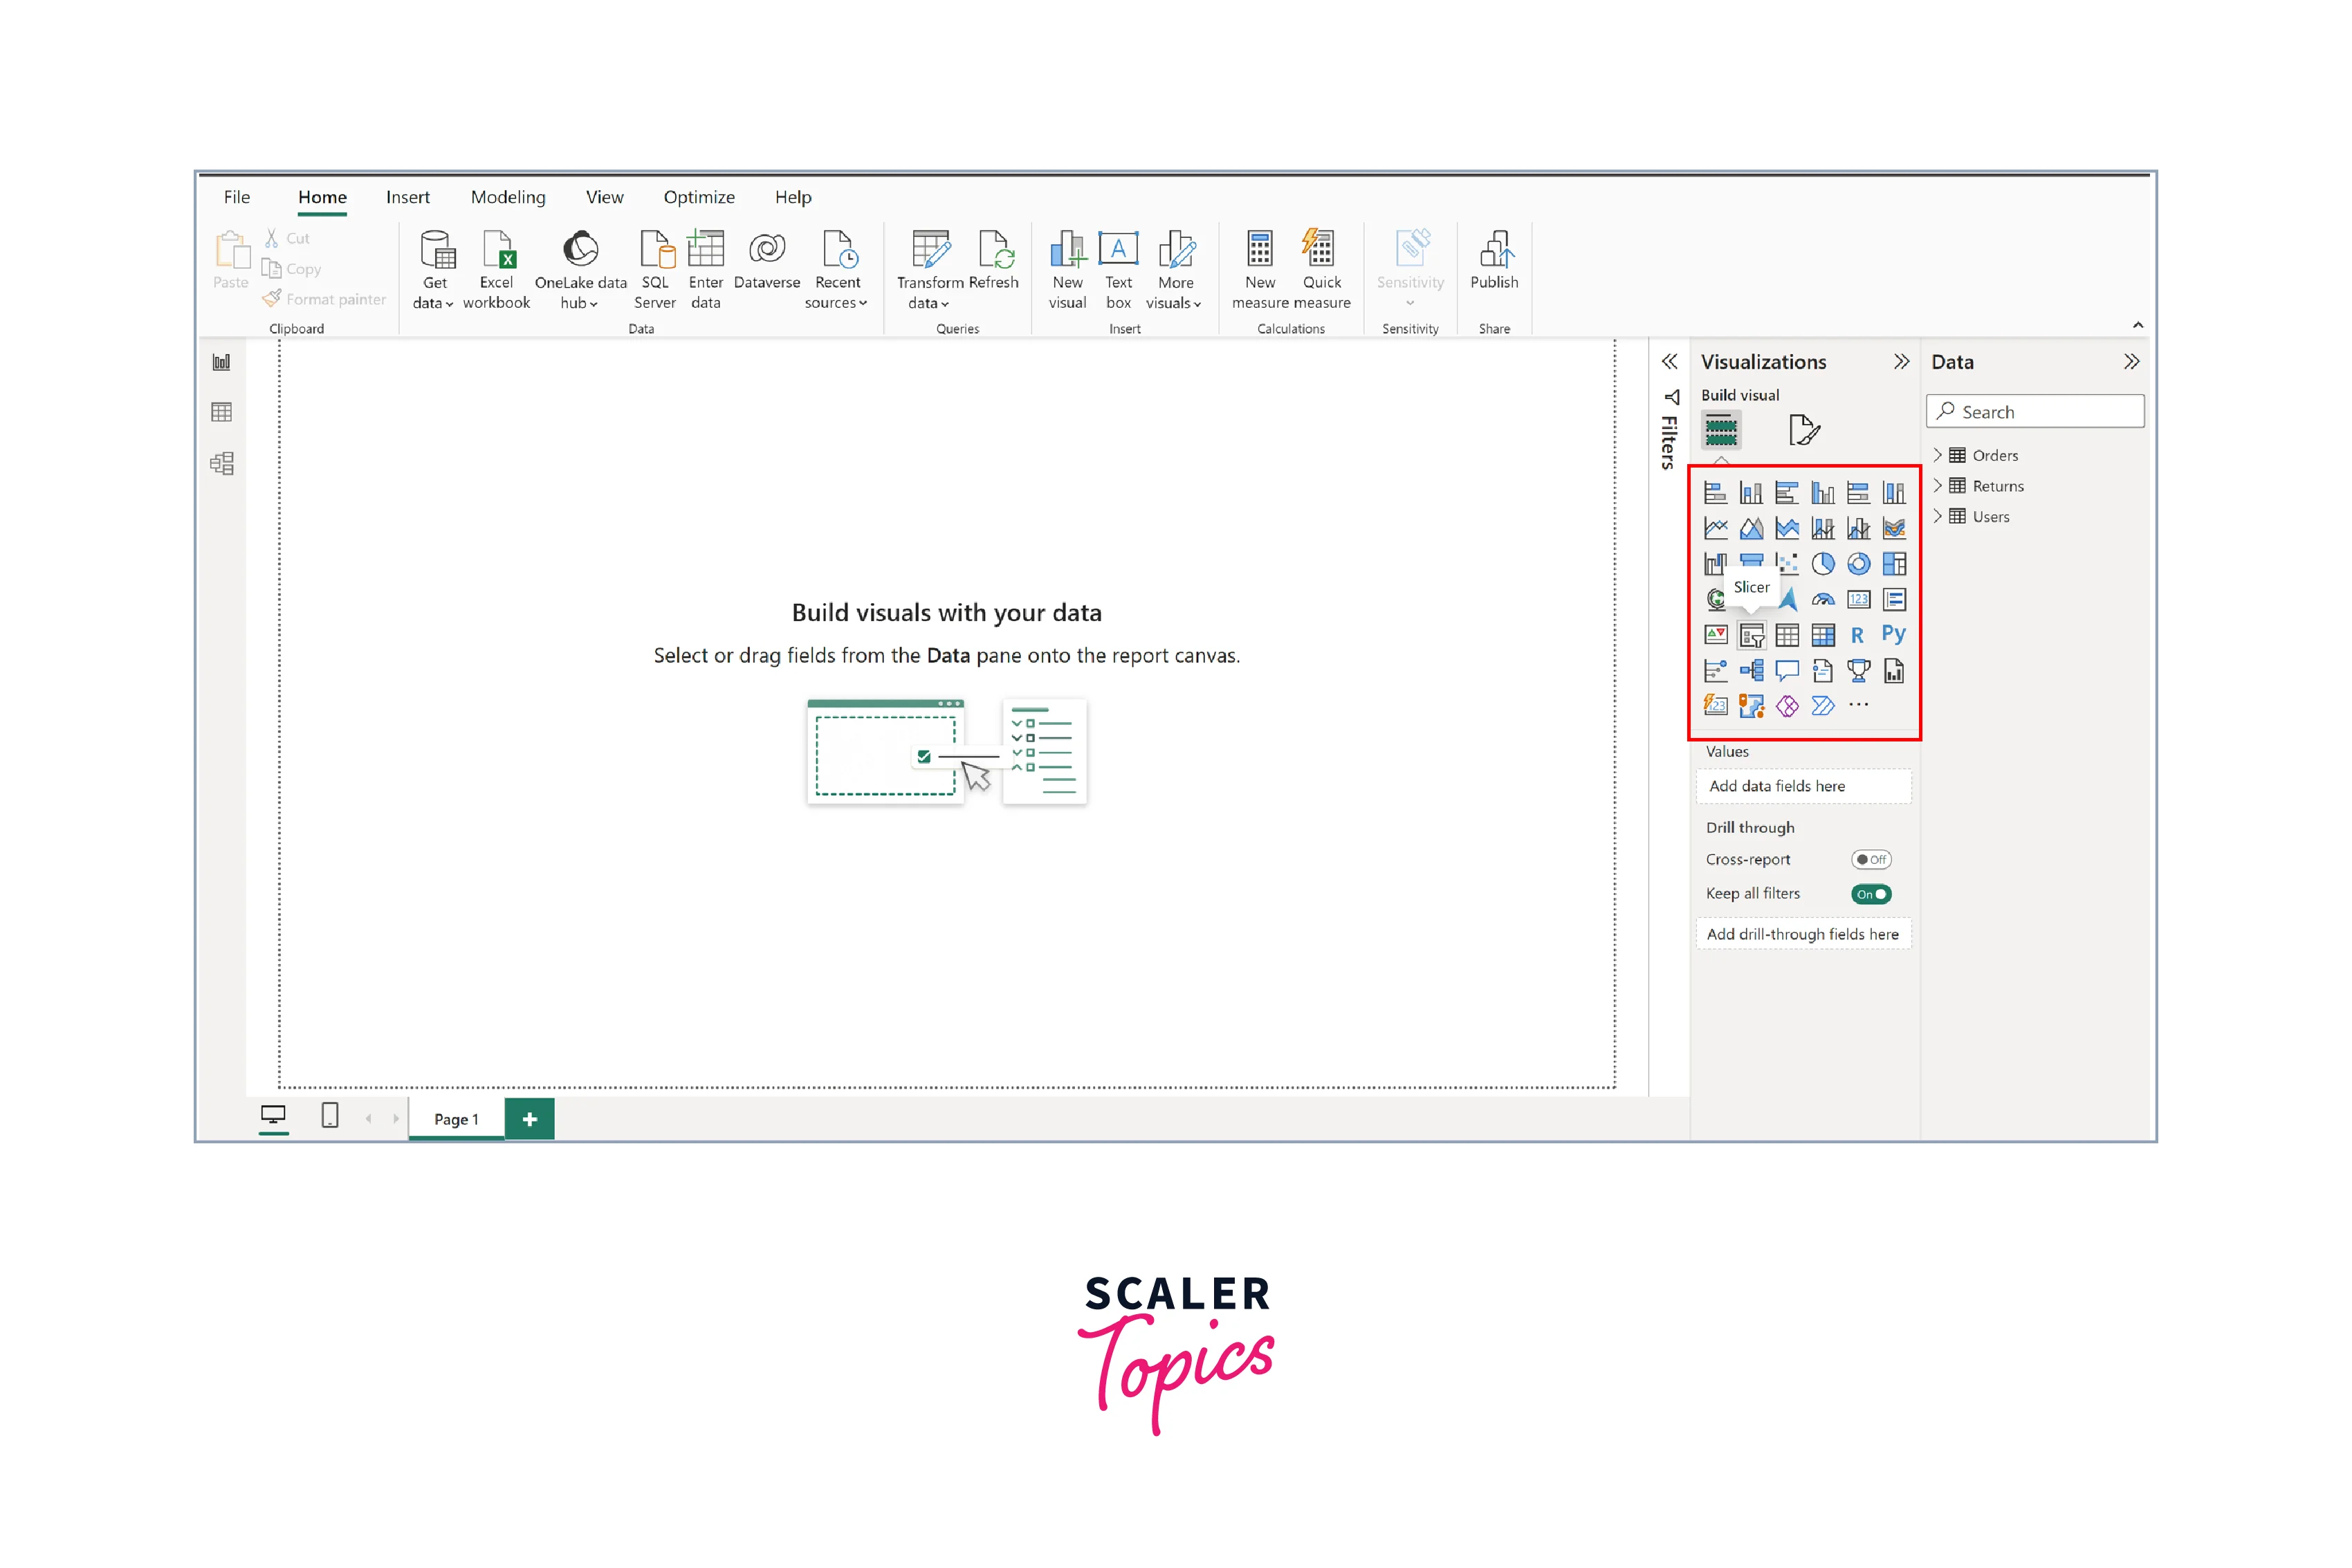
Step 1 - Open the Power BI Desktop application, load your dataset for exploration, and select the "Slicer" icon from the Visualizations pane to add an empty slicer template to the report. The slicers icon in Power BI looks like a funnel-shaped filter icon.
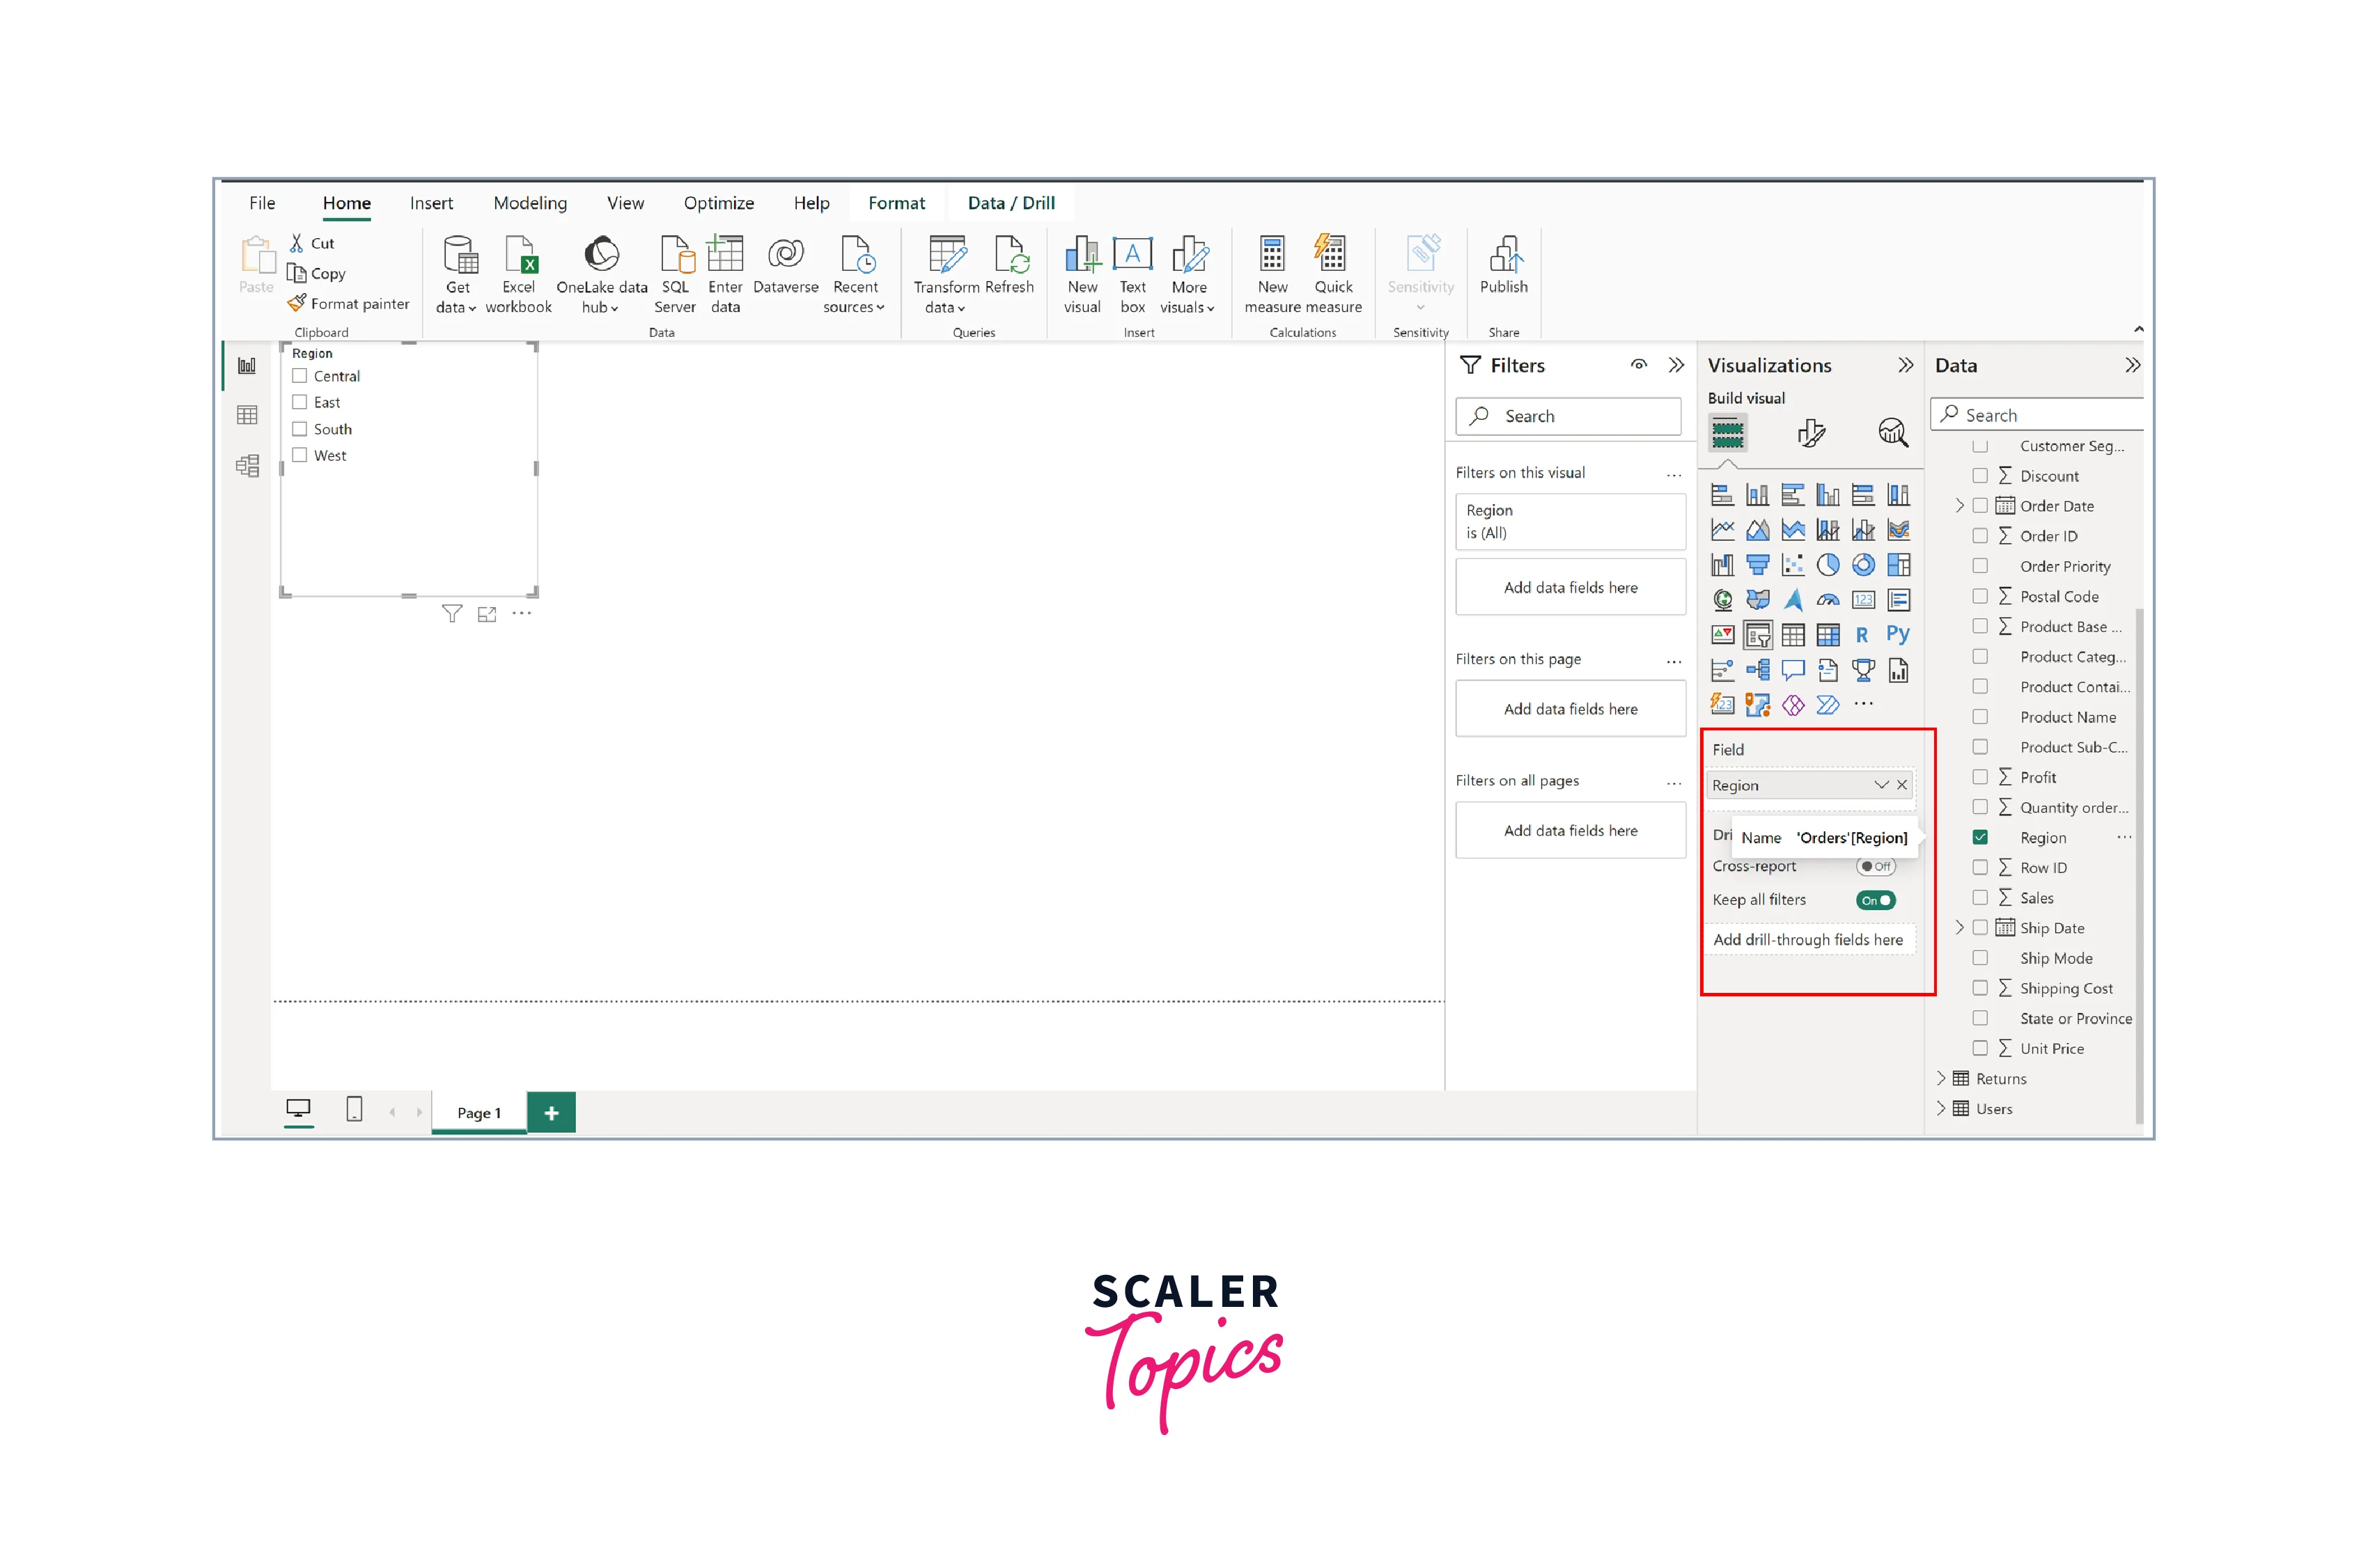
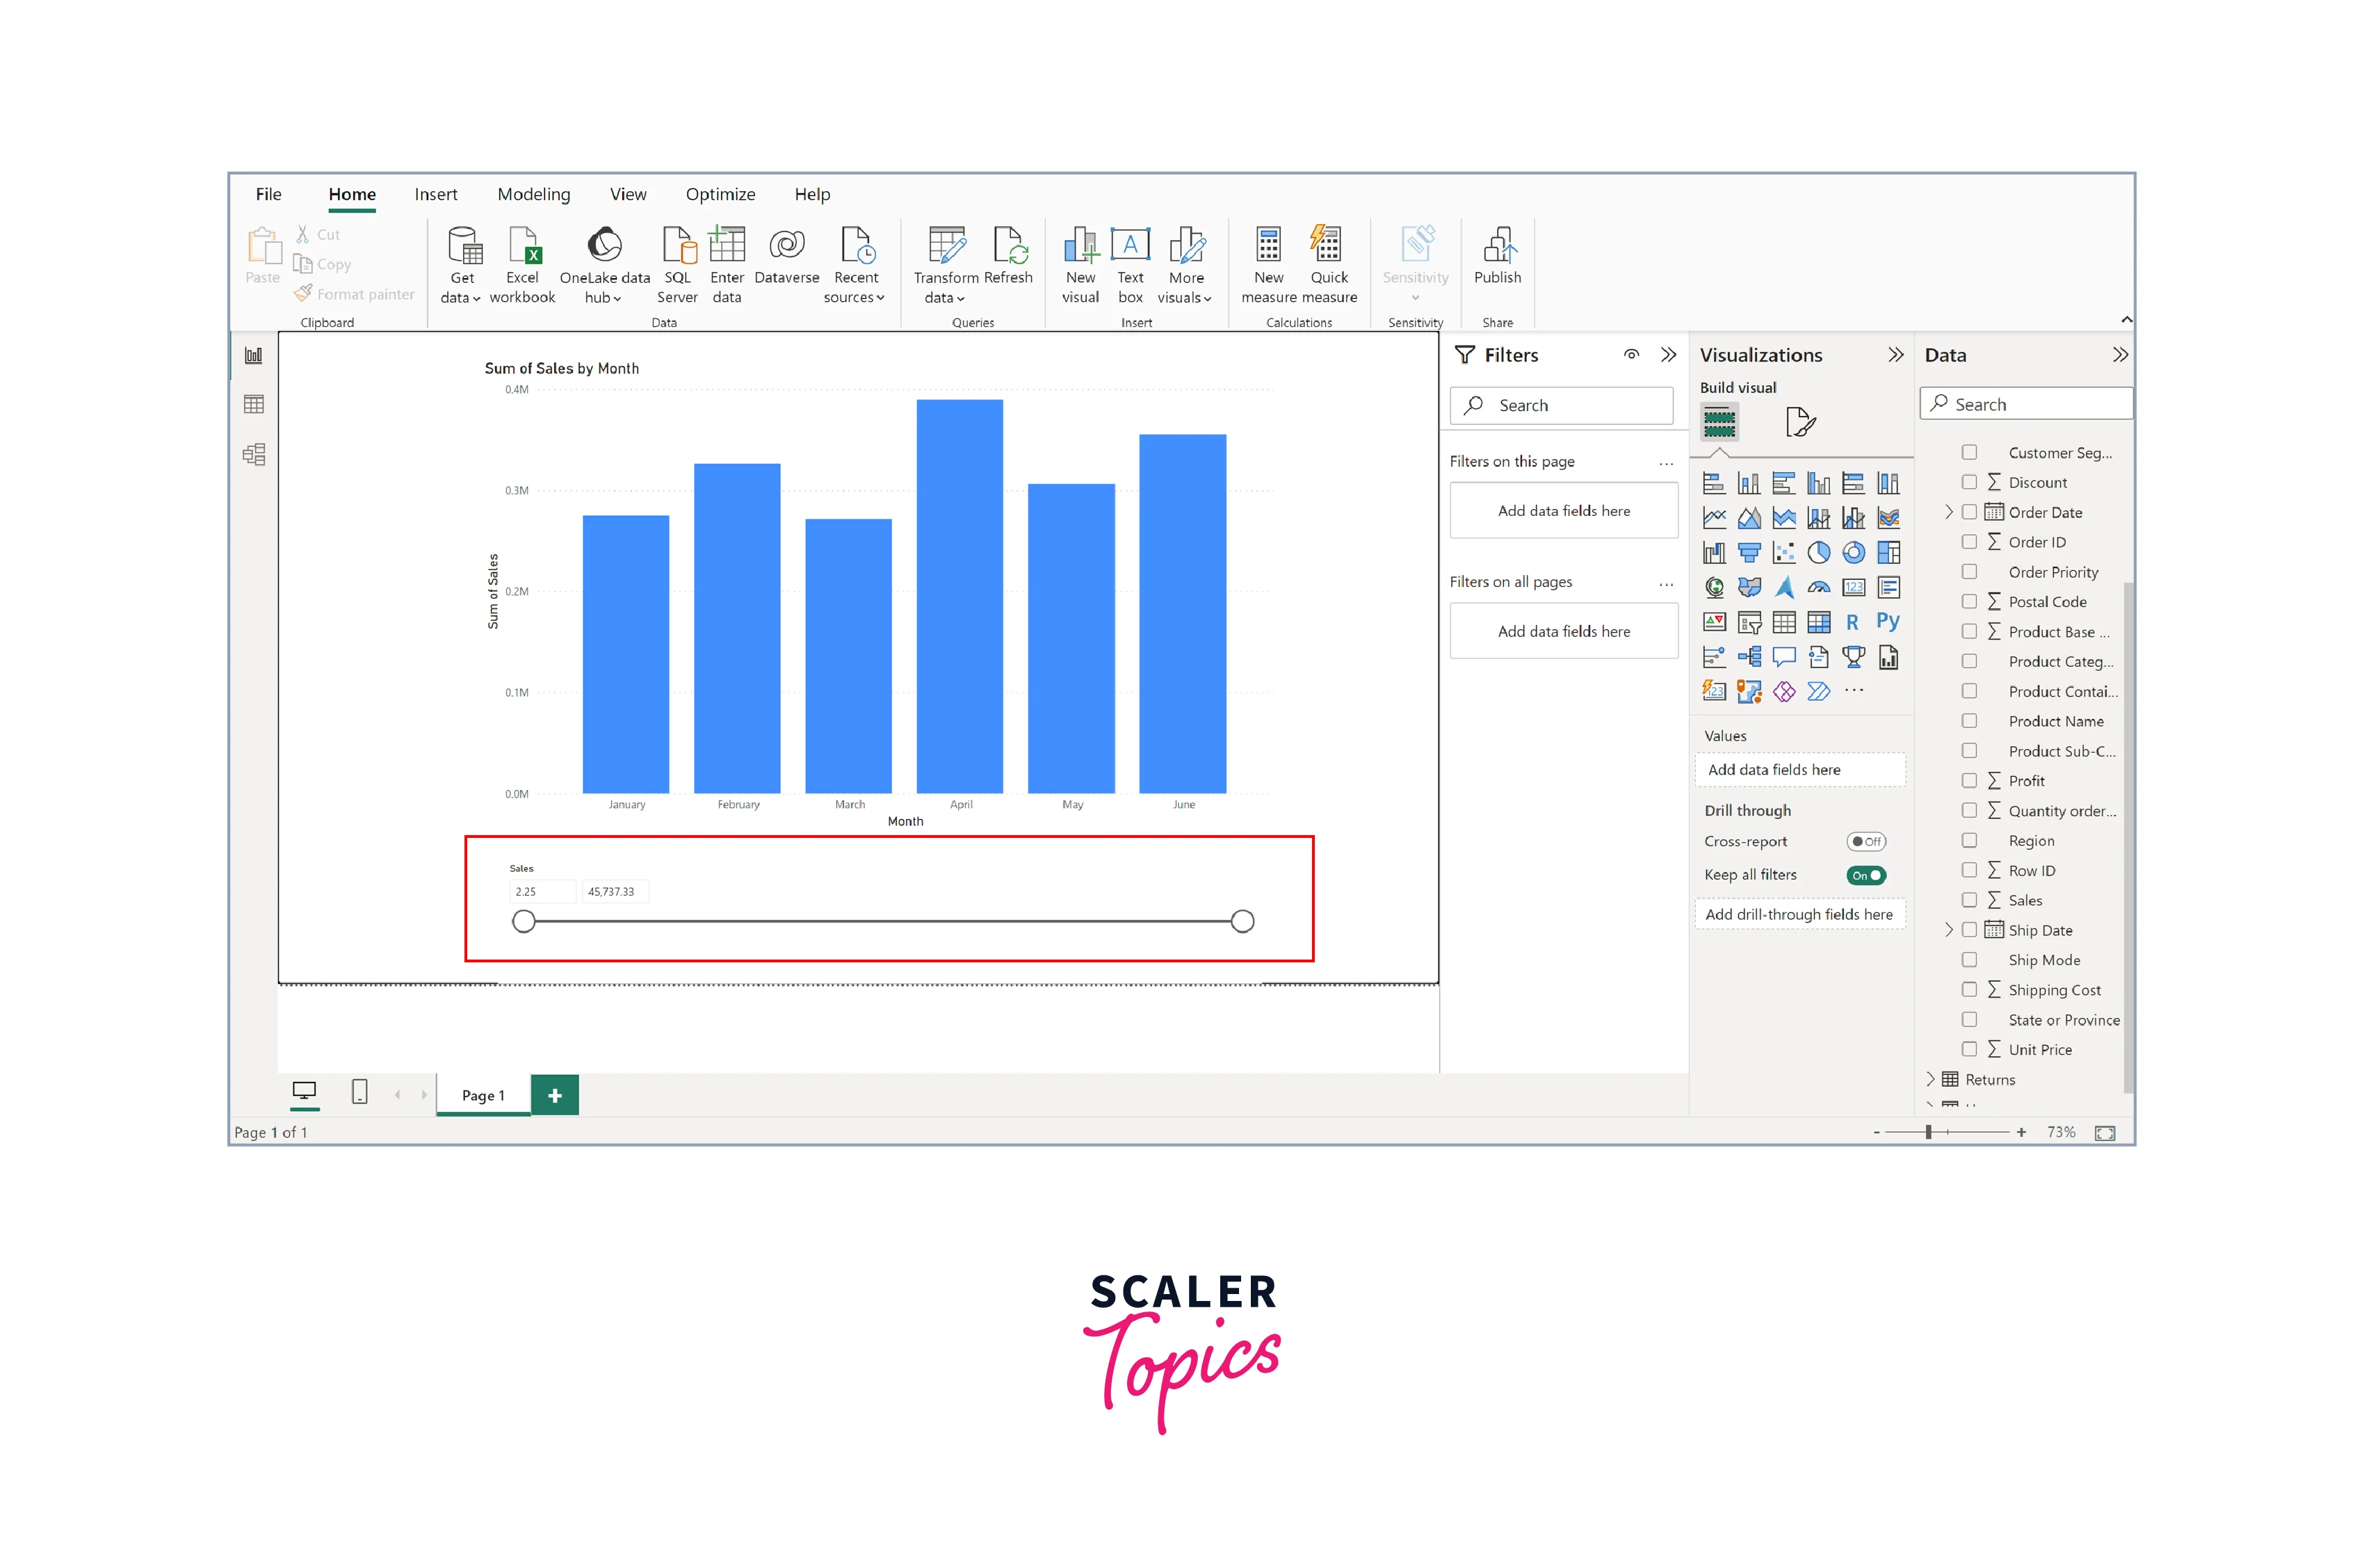
Step 2 - Next, you need to drag and drop a field/column for which you want to create a slicer from the Data section into the Values column of the slicer (indicated by the red box).
Step 3 - After creating slicers in Power BI, you can resize and position the slicer on the canvas as needed for further customization.
Next, we will explore different types of slicers, including date, numeric range, and sync slicers.
Date Slicers
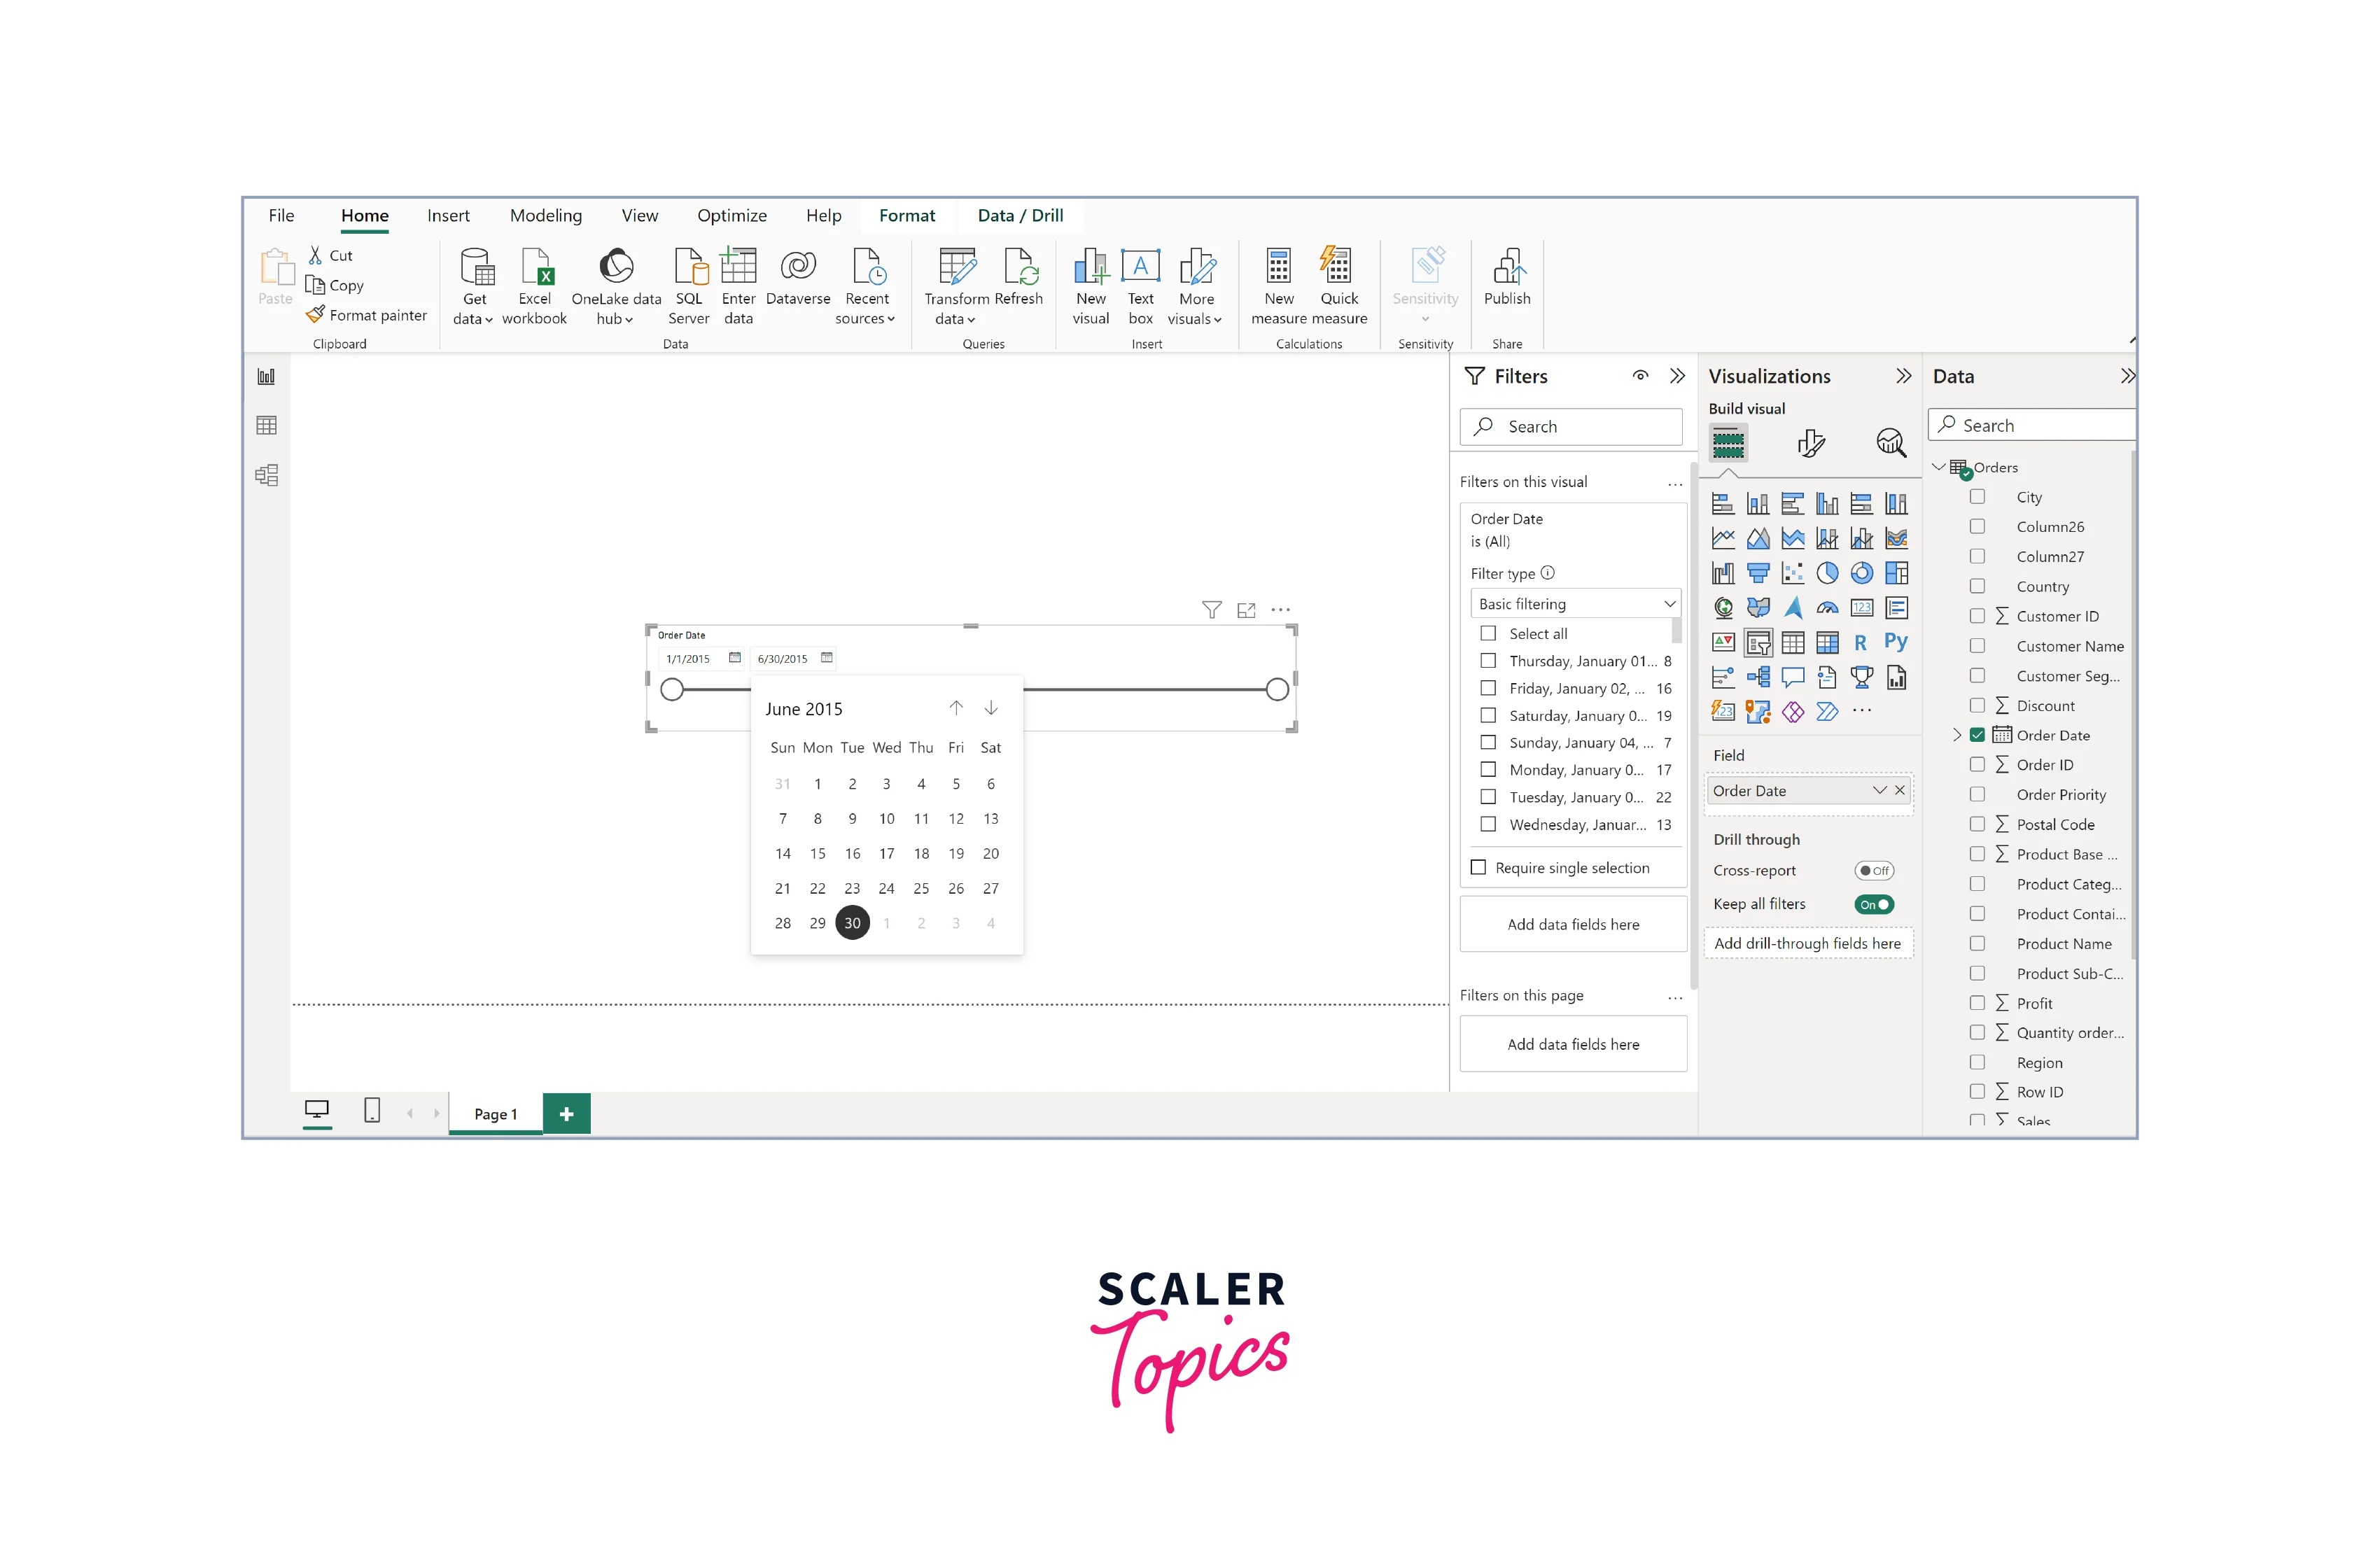
Date slicers in Power BI are specialized slicers designed to filter data based on date or time-related criteria. They allow users to interactively select specific date ranges, time periods, or individual dates to focus their data exploration and analysis. With date slicers, users can quickly visualize data patterns over specific time frames, compare trends, and gain insights into temporal aspects of their datasets. This feature is particularly useful when dealing with time-series data, as it enables users to identify patterns, spot anomalies, and make data-driven decisions based on time-related factors.
Numeric Range Slicers
Numeric range slicers in Power BI facilitate data filtering based on numerical intervals. Unlike regular slicers that select individual data points, numeric range slicers allow users to define a range or interval of numeric values. Users can easily analyze data falling within specific numerical boundaries by setting minimum and maximum values. This functionality is especially valuable when working with datasets containing numerical measurements, such as sales data, etc. Numeric range slicers enhance data exploration by offering a precise and flexible way to filter and analyze numerical data.
Sync Slicers
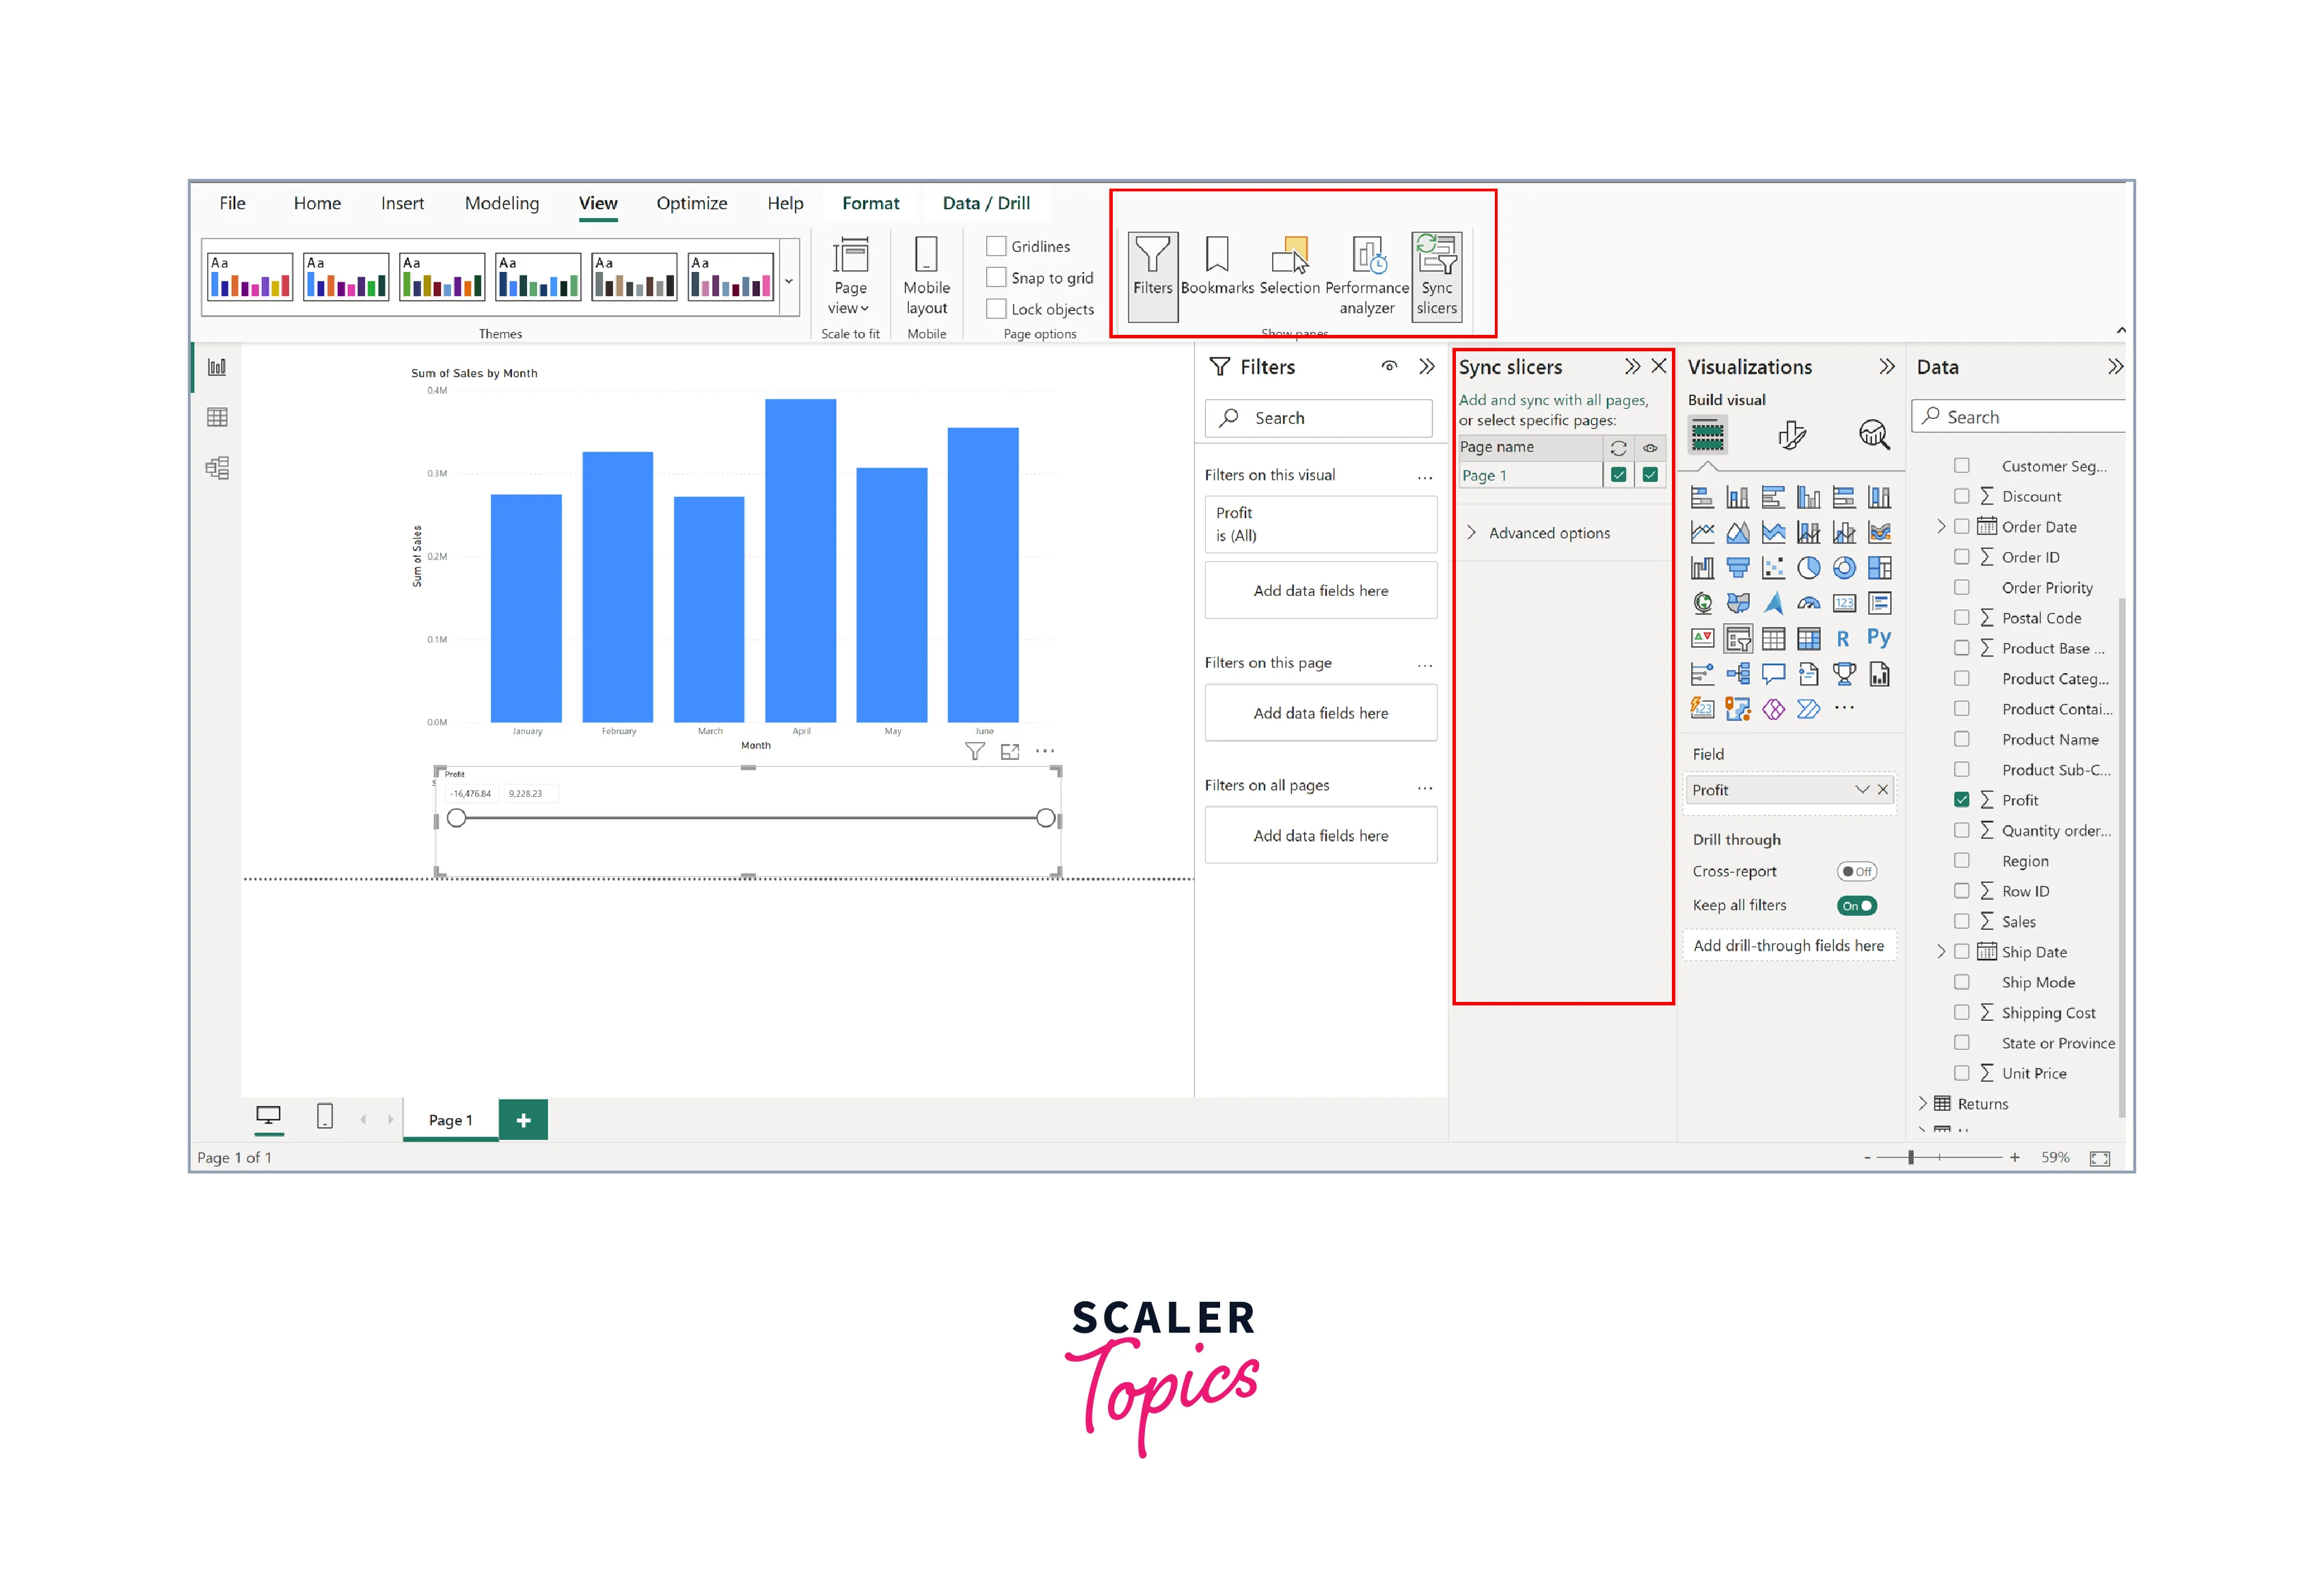
Sync slicers in Power BI are powerful features that allow you to synchronize slicer selections across multiple pages and visuals within a report. When you enable sync slicers, choosing a value in one slicer automatically updates and filters data in all other visuals and pages where the synced slicer is present, providing a consistent and coordinated data analysis experience. This capability simplifies data exploration and ensures that users can easily navigate through insights while maintaining focus on specific data subsets across the entire report. You can enable sync slicers in Power BI by going to the "View" tab and clicking on the "Sync Slicers" icon, as shown in the below figure.
Formatting the Slicer
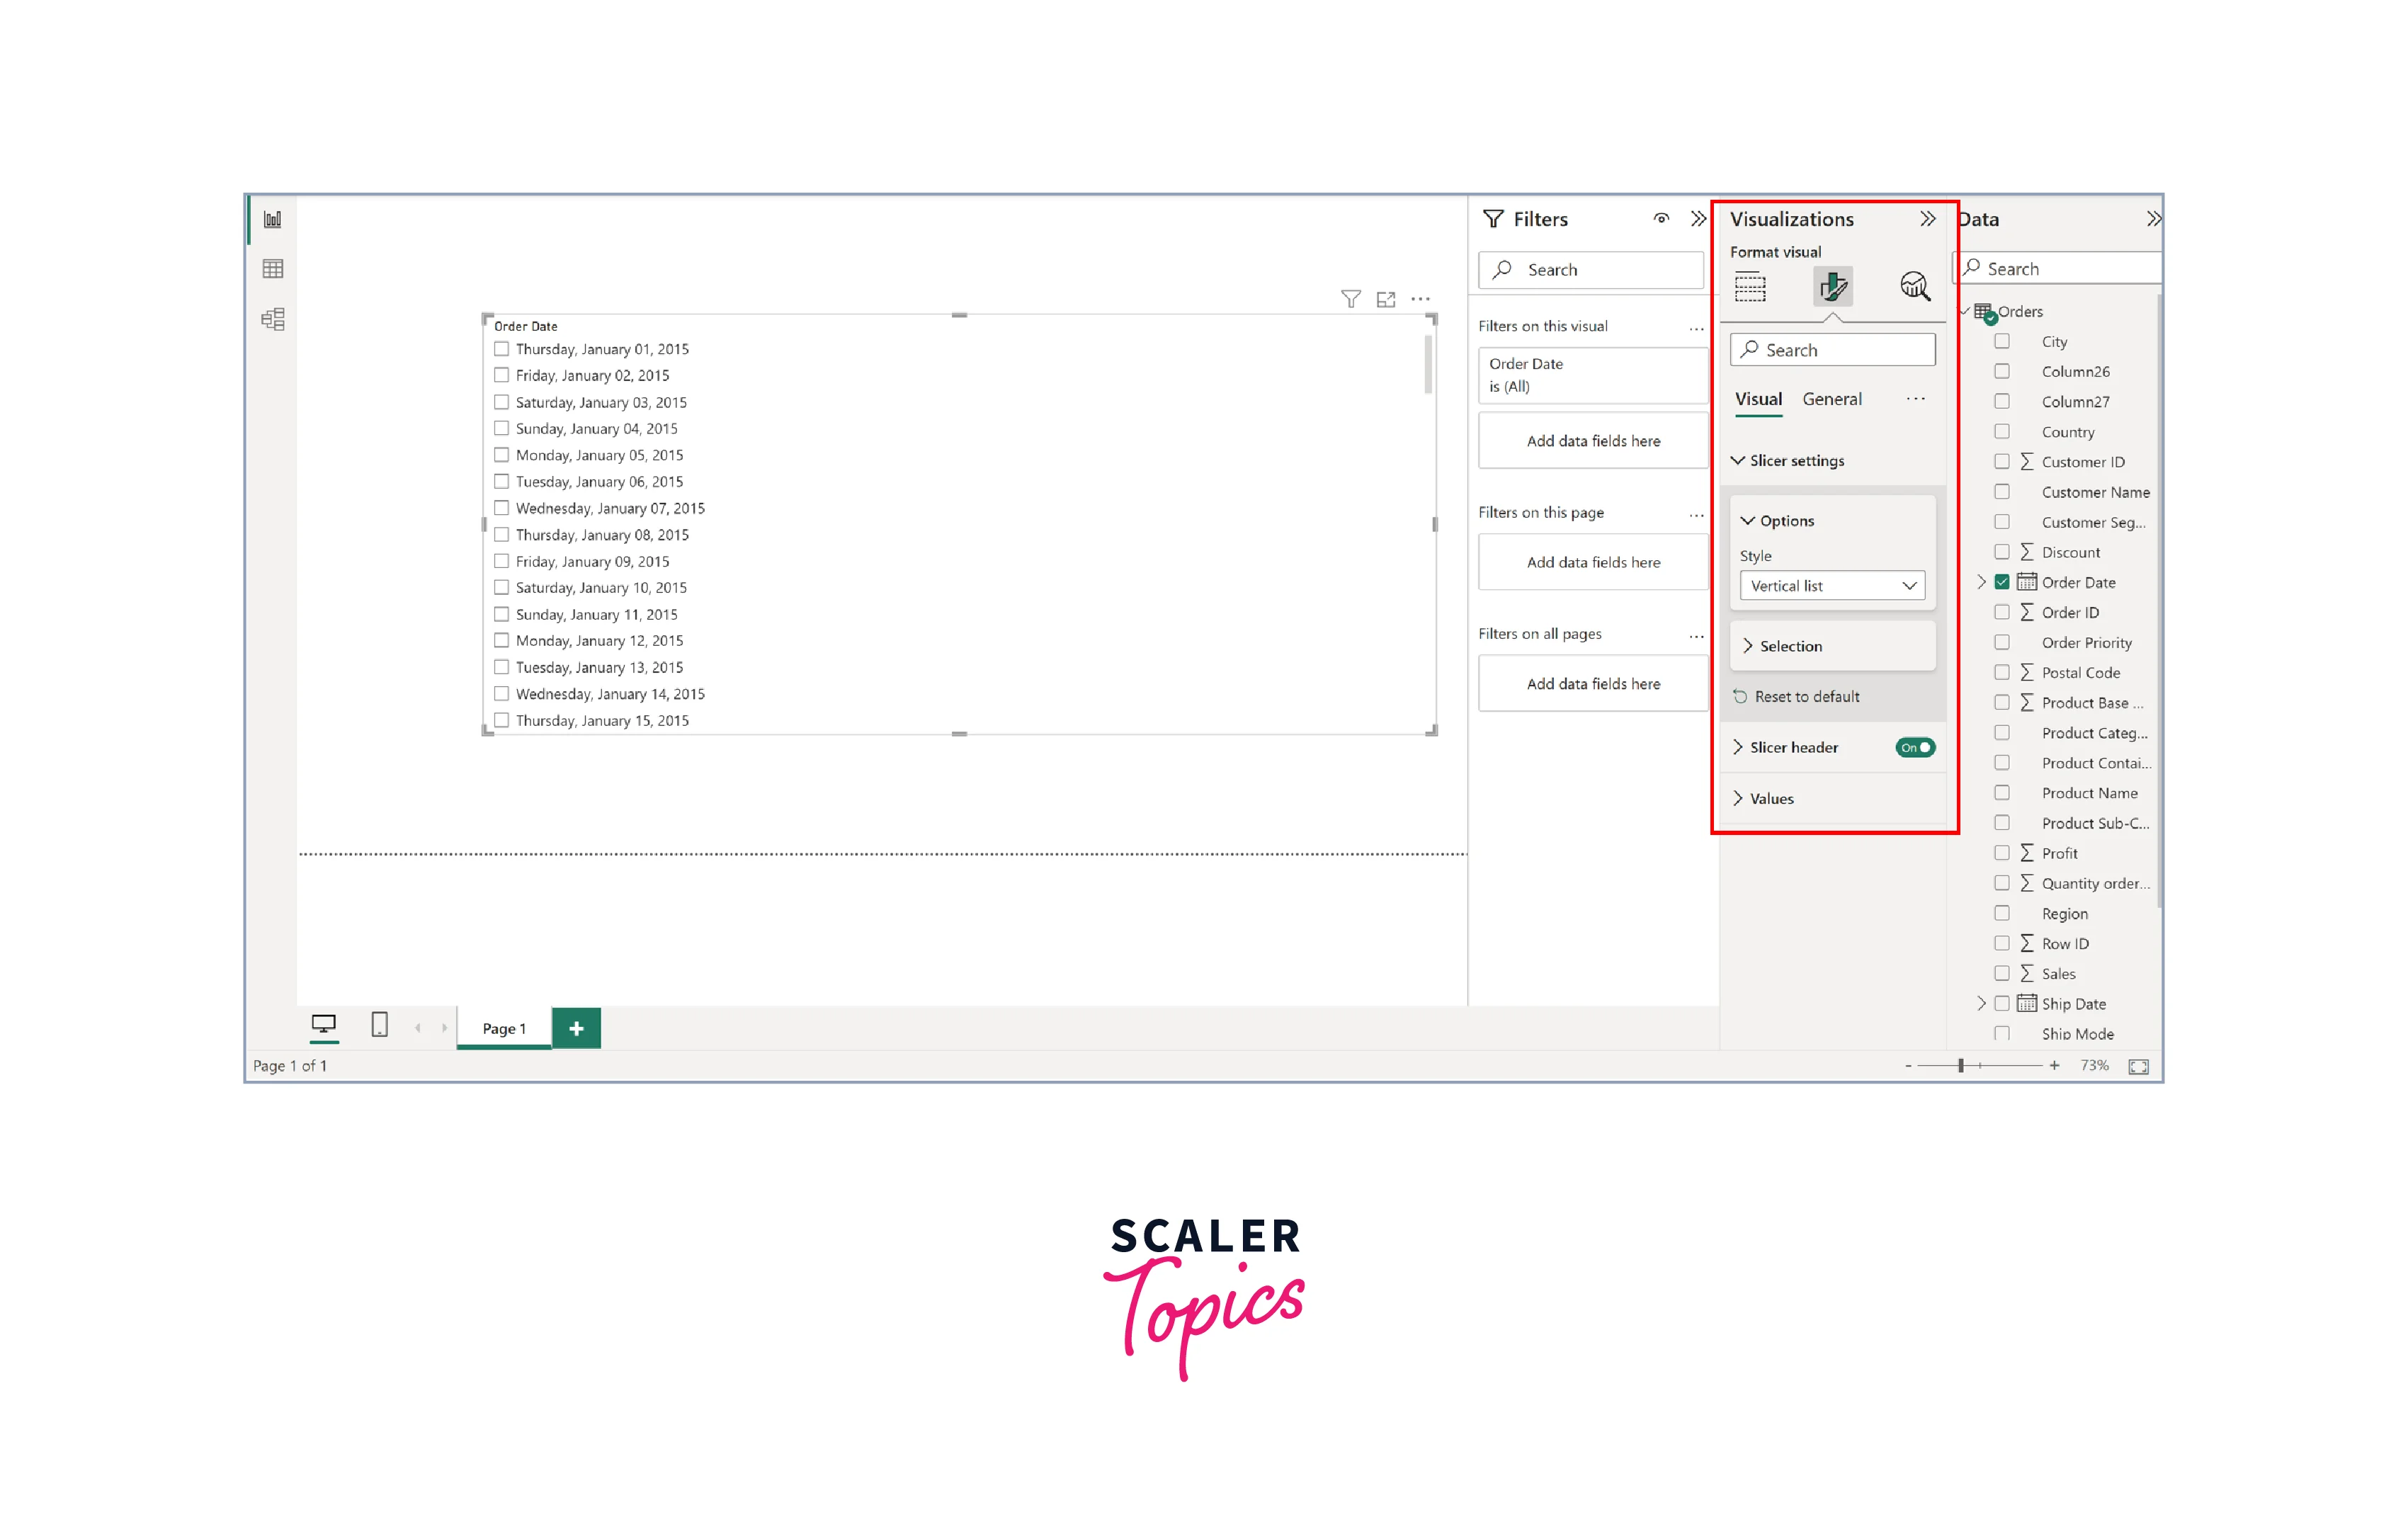
Power BI offers a range of formatting options to customize the appearance and behavior of slicers. Users can adjust the size, color, font, and style to match their report's design. Additionally, they can control slicer header settings, orientation, and layout. To format slicers in Power BI, follow these steps -
- Select the slicer you want to format by clicking on it.
- In the "Visualizations" pane, click on the "Format" icon (paint roller) to access formatting options.
- Under the "Visuals" and "General" tabs, you can customize various aspects such as font, color, size, header settings, orientation, and layout to tailor the slicer's appearance to your preferences and report design.
Let’s have a look at some snapshots showcasing the formatting of different slicer types, including date slicers, category slicers, and numerical range slicers, providing a visually appealing and coherent presentation of data filtering options.
As shown in the figure below, slicers in Power BI offer formatting options that allow them to be displayed as a vertical list or dropdown, giving users flexibility in selecting the subset of the data.
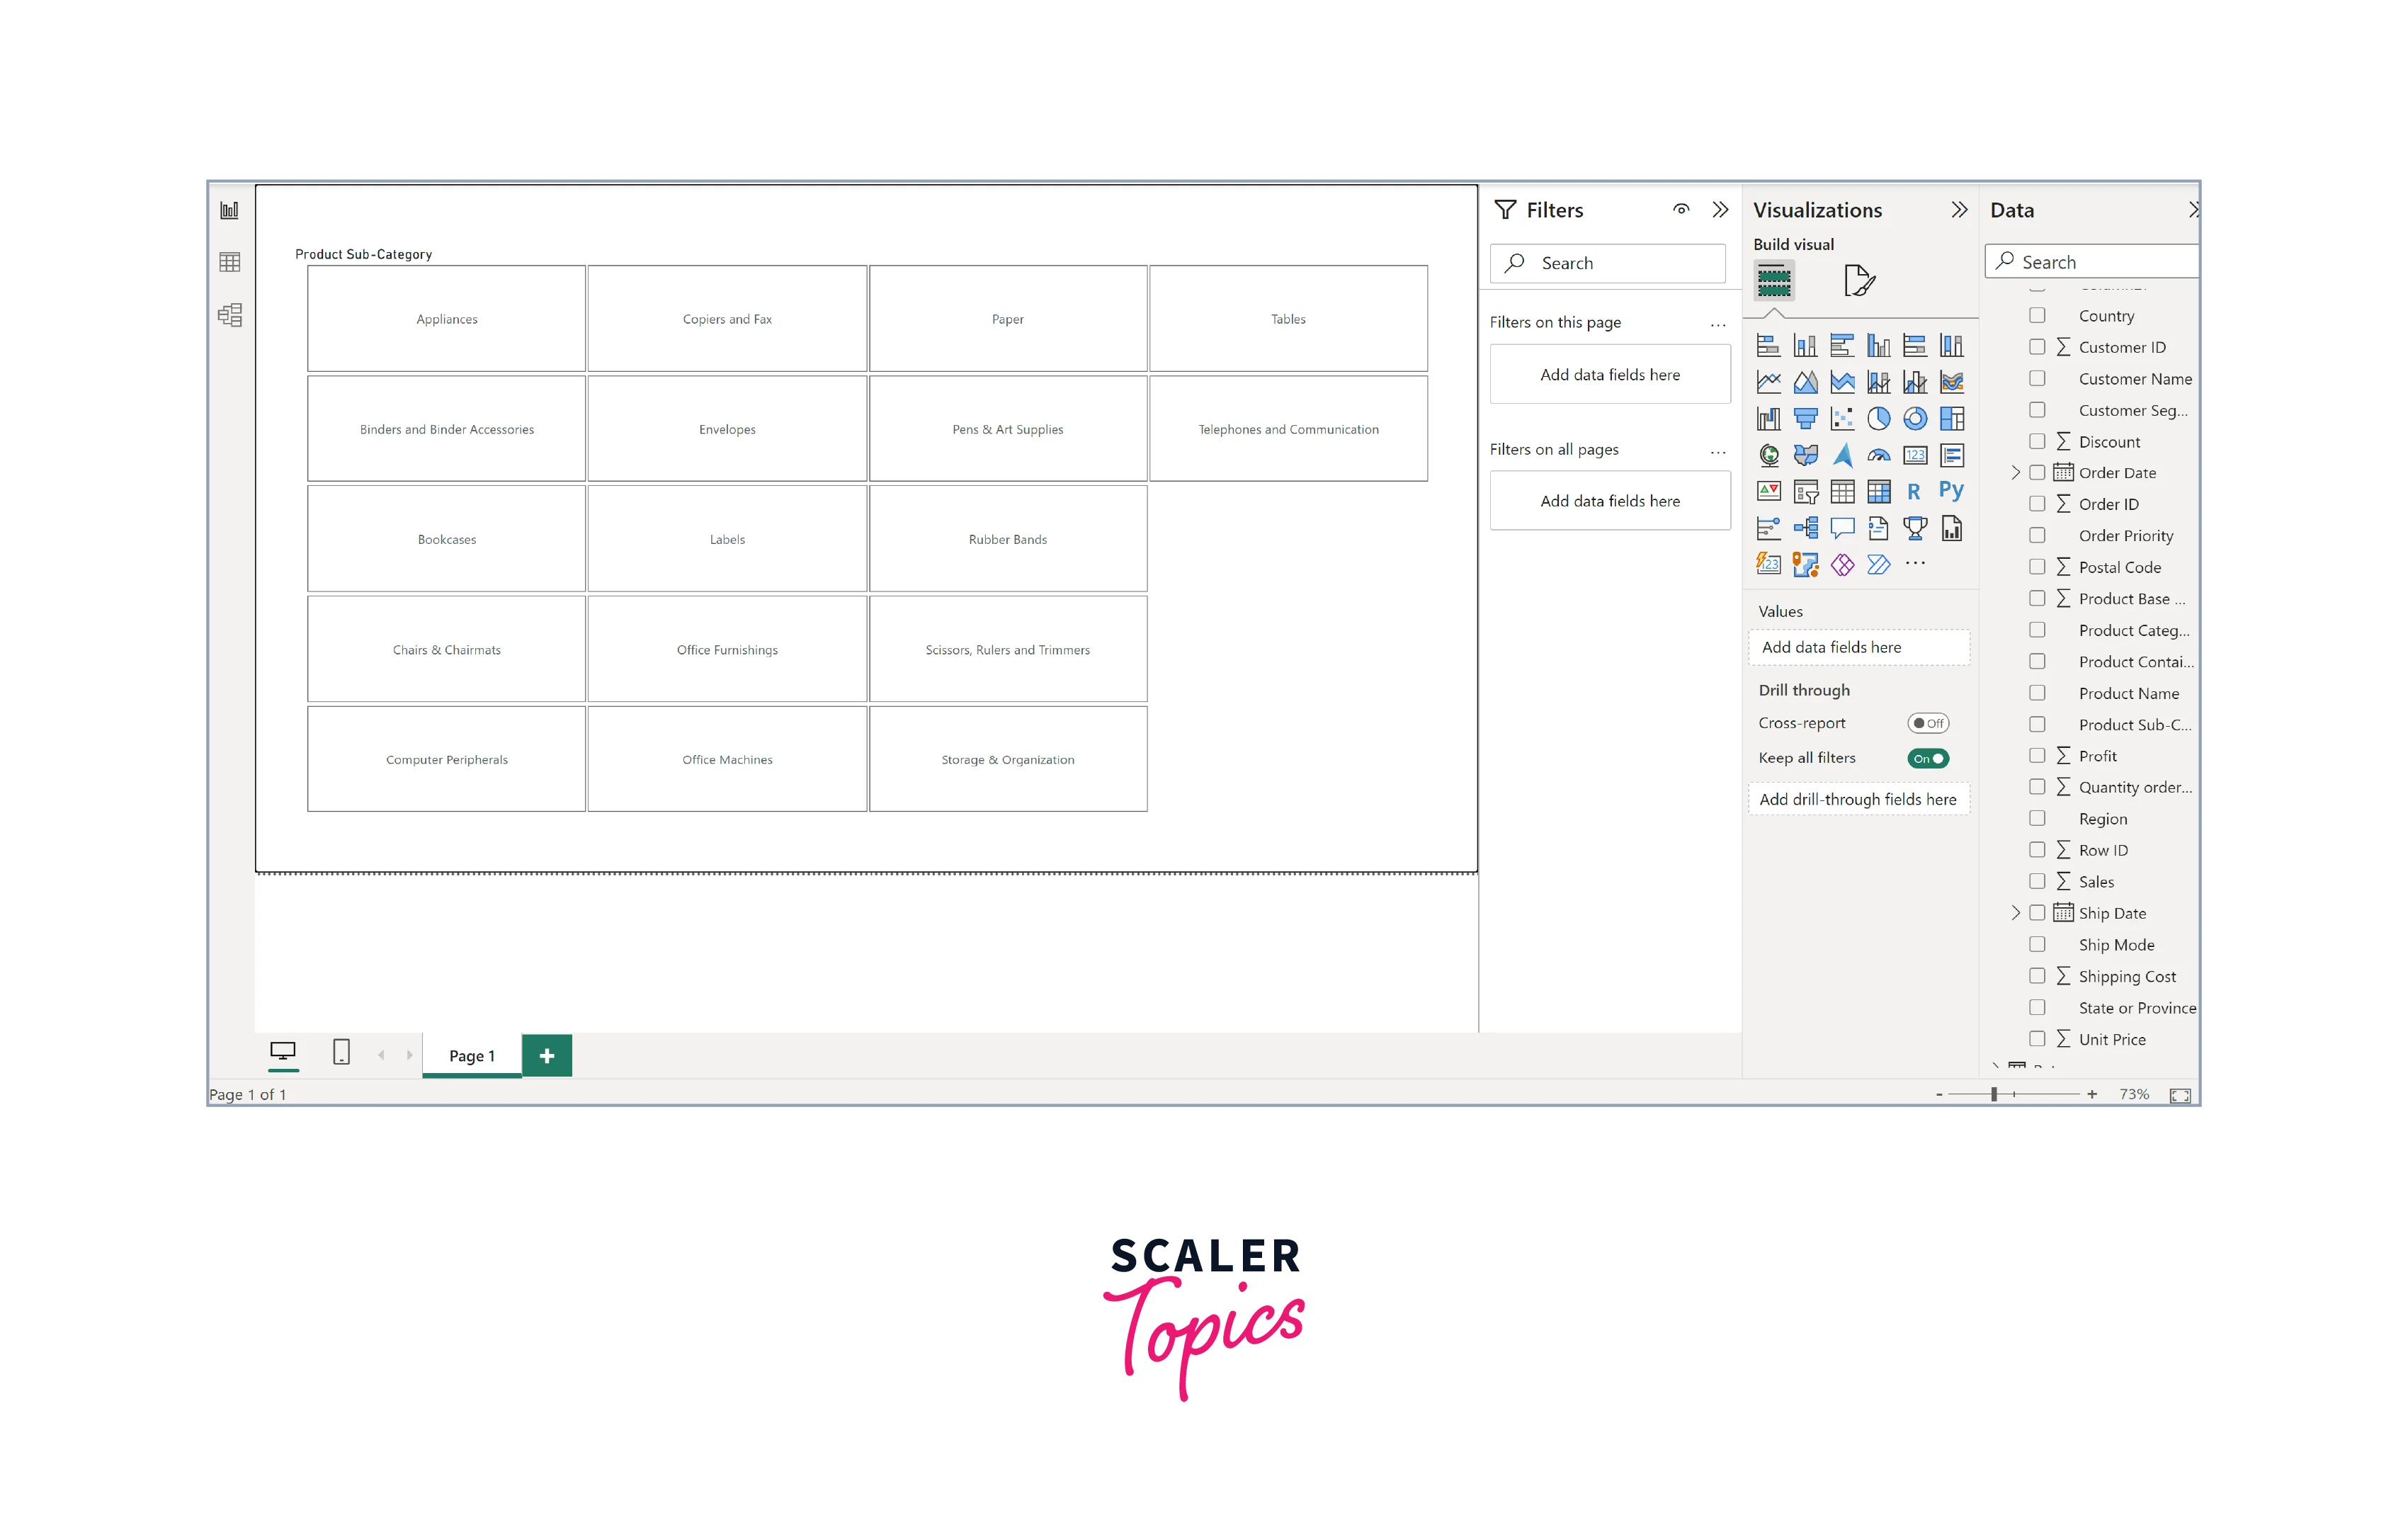
Slicers in Power BI can be formatted into tiles, as shown in the figure below, adding an appealing appearance to your report. This formatting option enhances the visual presentation of data filters, contributing to a more engaging and user-friendly experience.
Limitations of Power BI Slicers
The slicers in Power BI also comes with some limitation, as mentioned below -
- Slicers cannot be pinned to a dashboard.
- Slicers do not support drill-down functionality in Power BI reports.
- Visual-level filters are not supported in Power BI slicers.
- Data models used in slicers lack time zone information, but conversion to UTC is possible using the Query Editor in Power BI Desktop.
- Slicers do not support and work with measures.
- Numeric range slicers are only available in Power BI Desktop and cannot be used in Power BI Service.
Conclusion
- Slicers in Power BI offer a dynamic and user-friendly approach to data exploration and analysis, allowing users to interactively filter and focus on specific subsets of information without complex queries or manual data manipulation.
- Date slicers enable users to analyze temporal aspects of their datasets, while numeric range slicers provide precise filtering based on numerical intervals, enhancing the analysis of numerical data.
- Users can create visually appealing reports and dashboards by formatting slicers, making data filtering options more intuitive and engaging for report consumers.