Data Transpose in Power BI
Overview
Data transformation is a crucial step in the world of business intelligence, and Power BI has become an indispensable tool for professionals seeking to harness the power of data. This article delves into the concept of data transpose in Power BI – a technique that can reshape your data for more meaningful analysis. Data transpose in Power BI involves switching rows and columns in your dataset, allowing you to pivot and restructure information. We'll explore why data transpose matters, how to perform data transpose in Power BI efficiently, and real-world scenarios where it can unlock new insights.
Introduction to Data Transpose in Power BI
The ability to transform raw data into actionable insights is paramount in data analysis and visualization. Data Transpose – a fundamental operation in Power BI that empowers users to reshape their datasets. Data Transpose in Power BI process involves the dynamic reorganization of rows and columns, enabling users to pivot and manipulate data for more coherent analysis.
Data Transpose involves the conversion of rows into columns, or vice versa, offering an alternative perspective for data analysis. This change in orientation, from horizontal to vertical or vice versa, can enhance trend identification and facilitate aggregation when dealing with row-based data. By transposing data into columns, you can efficiently employ aggregation functions to calculate totals for each column.
Furthermore, Data Transpose aids in data organization, particularly with complex tables containing multiple rows and columns. It allows you to group related data together, improving data readability and comprehension, a valuable asset for handling large datasets.
Why Transposing Data is Important in Power BI
- Data Transpose in Power BI provides a fresh perspective on your data, enabling the discovery of previously unseen patterns and trends, which is invaluable for data-driven decision-making.
- Data Transpose helps uncover relationships between different data points that may be obscured in the original format, offering insights into correlations and connections among variables.
- Data Transpose in Power BI streamlines the process of rearranging data, which is particularly beneficial for handling large datasets. This efficiency gain allows you to devote more time to in-depth data analysis.
Use Cases for Data Transpose in Power BI
Here are some common use cases for data transpose in Power BI -
- Time Series Data Transformation - Transposing data is useful when dealing with time series data where each timestamp is a row. By transposing, you can convert the timestamps into columns, making it easier to create time-based visualizations and perform trend analysis.
- Survey and Questionnaire Data Analysis - When working with survey responses or questionnaire data, transposing can help restructure the dataset. Each question can become a column, and each respondent's answers can be in rows, making analyzing and visualizing responses simpler.
- Cross-Tabulation and Pivot Tables - Transposing can be beneficial for cross-tabulation, where you want to summarize data across multiple dimensions. By transposing data, you can pivot rows and columns to create pivot tables, facilitating multi-dimensional analysis.
- Financial Data Reporting - For financial reporting, you may have data in a vertical format with different financial metrics stacked as rows. Transposing this data can transform it into a horizontal format, making it easier to create financial statements and perform period-to-period comparisons.
Transposing Data By Power Query
Here are the steps to execute data transpose in Power BI through the Power Query Editor -
Step 1. Open the Data in Power Query - Begin by opening the dataset you intend to transpose in Power Query. The image below illustrates the dataset we aim to transform, rotating it from rows to columns.

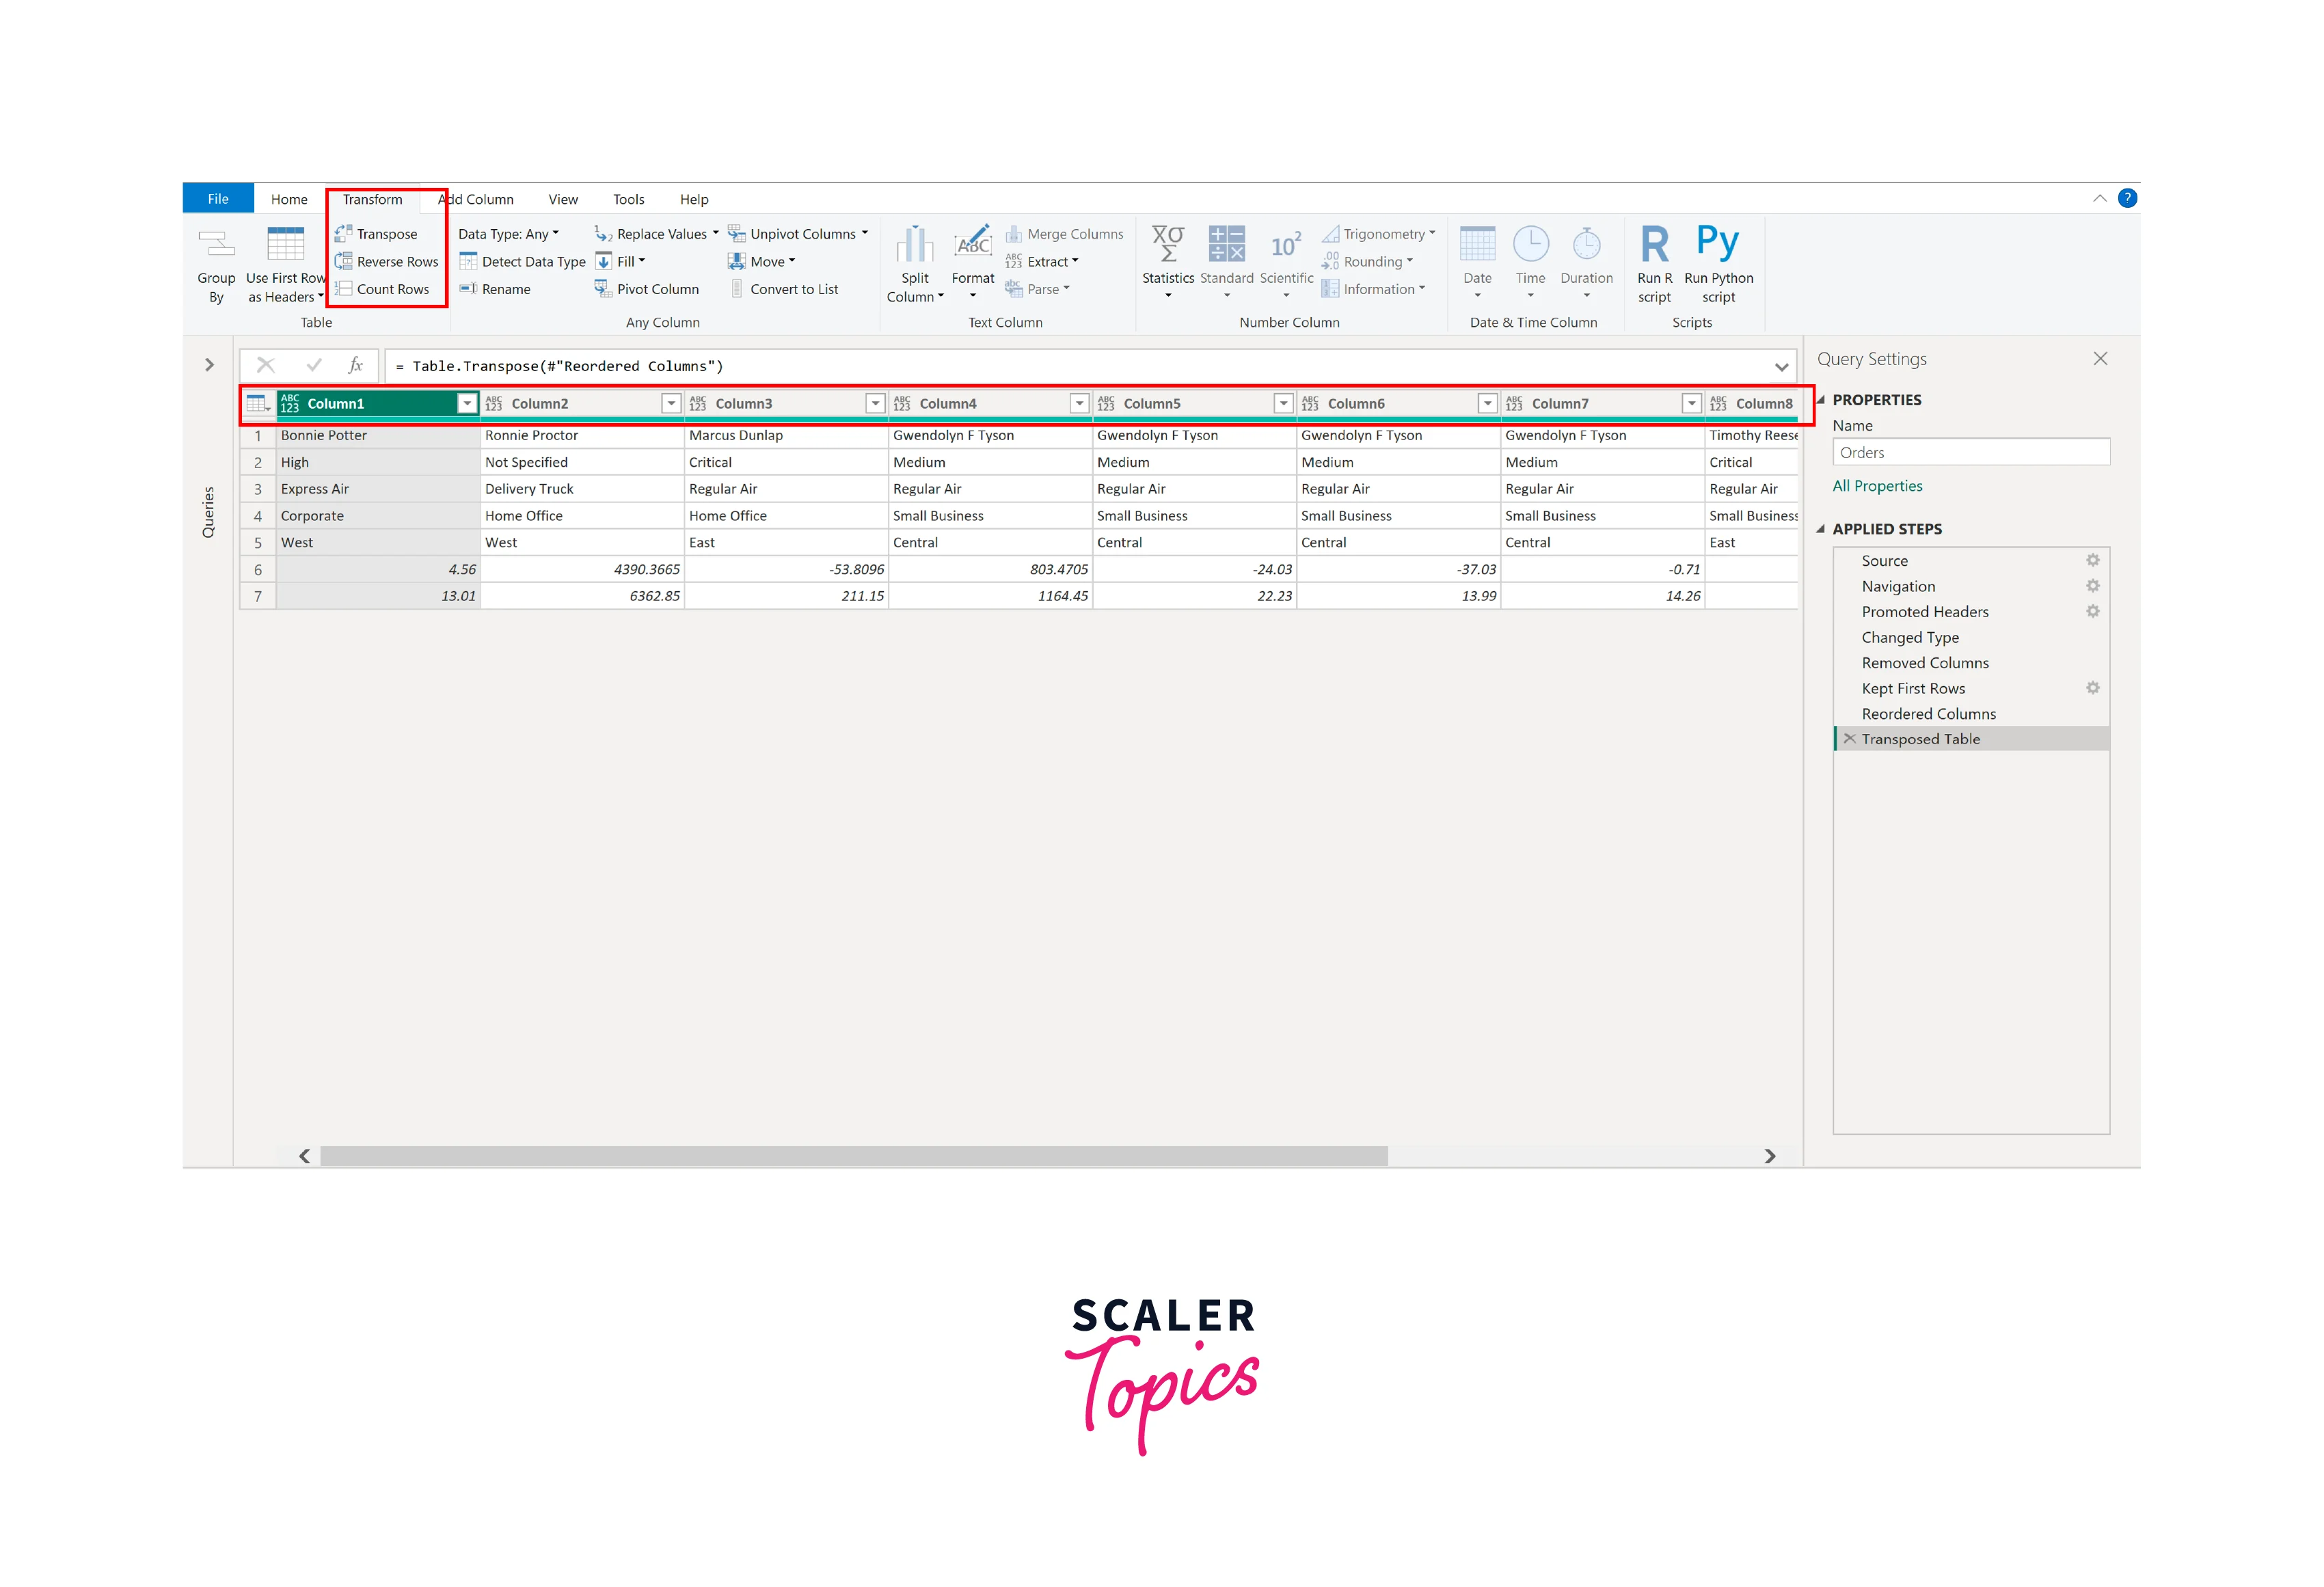
Step 2. Transpose the Data Table - Next, choose "Transform" > "Transpose." This action converts the data from rows to columns. The Power BI Transpose feature operates on the entire Data table, as the image below depicts. Please note that transposing the data table will remove the existing column headers, replacing them with default Power Query column headers such as Column1, Column2, and so forth.
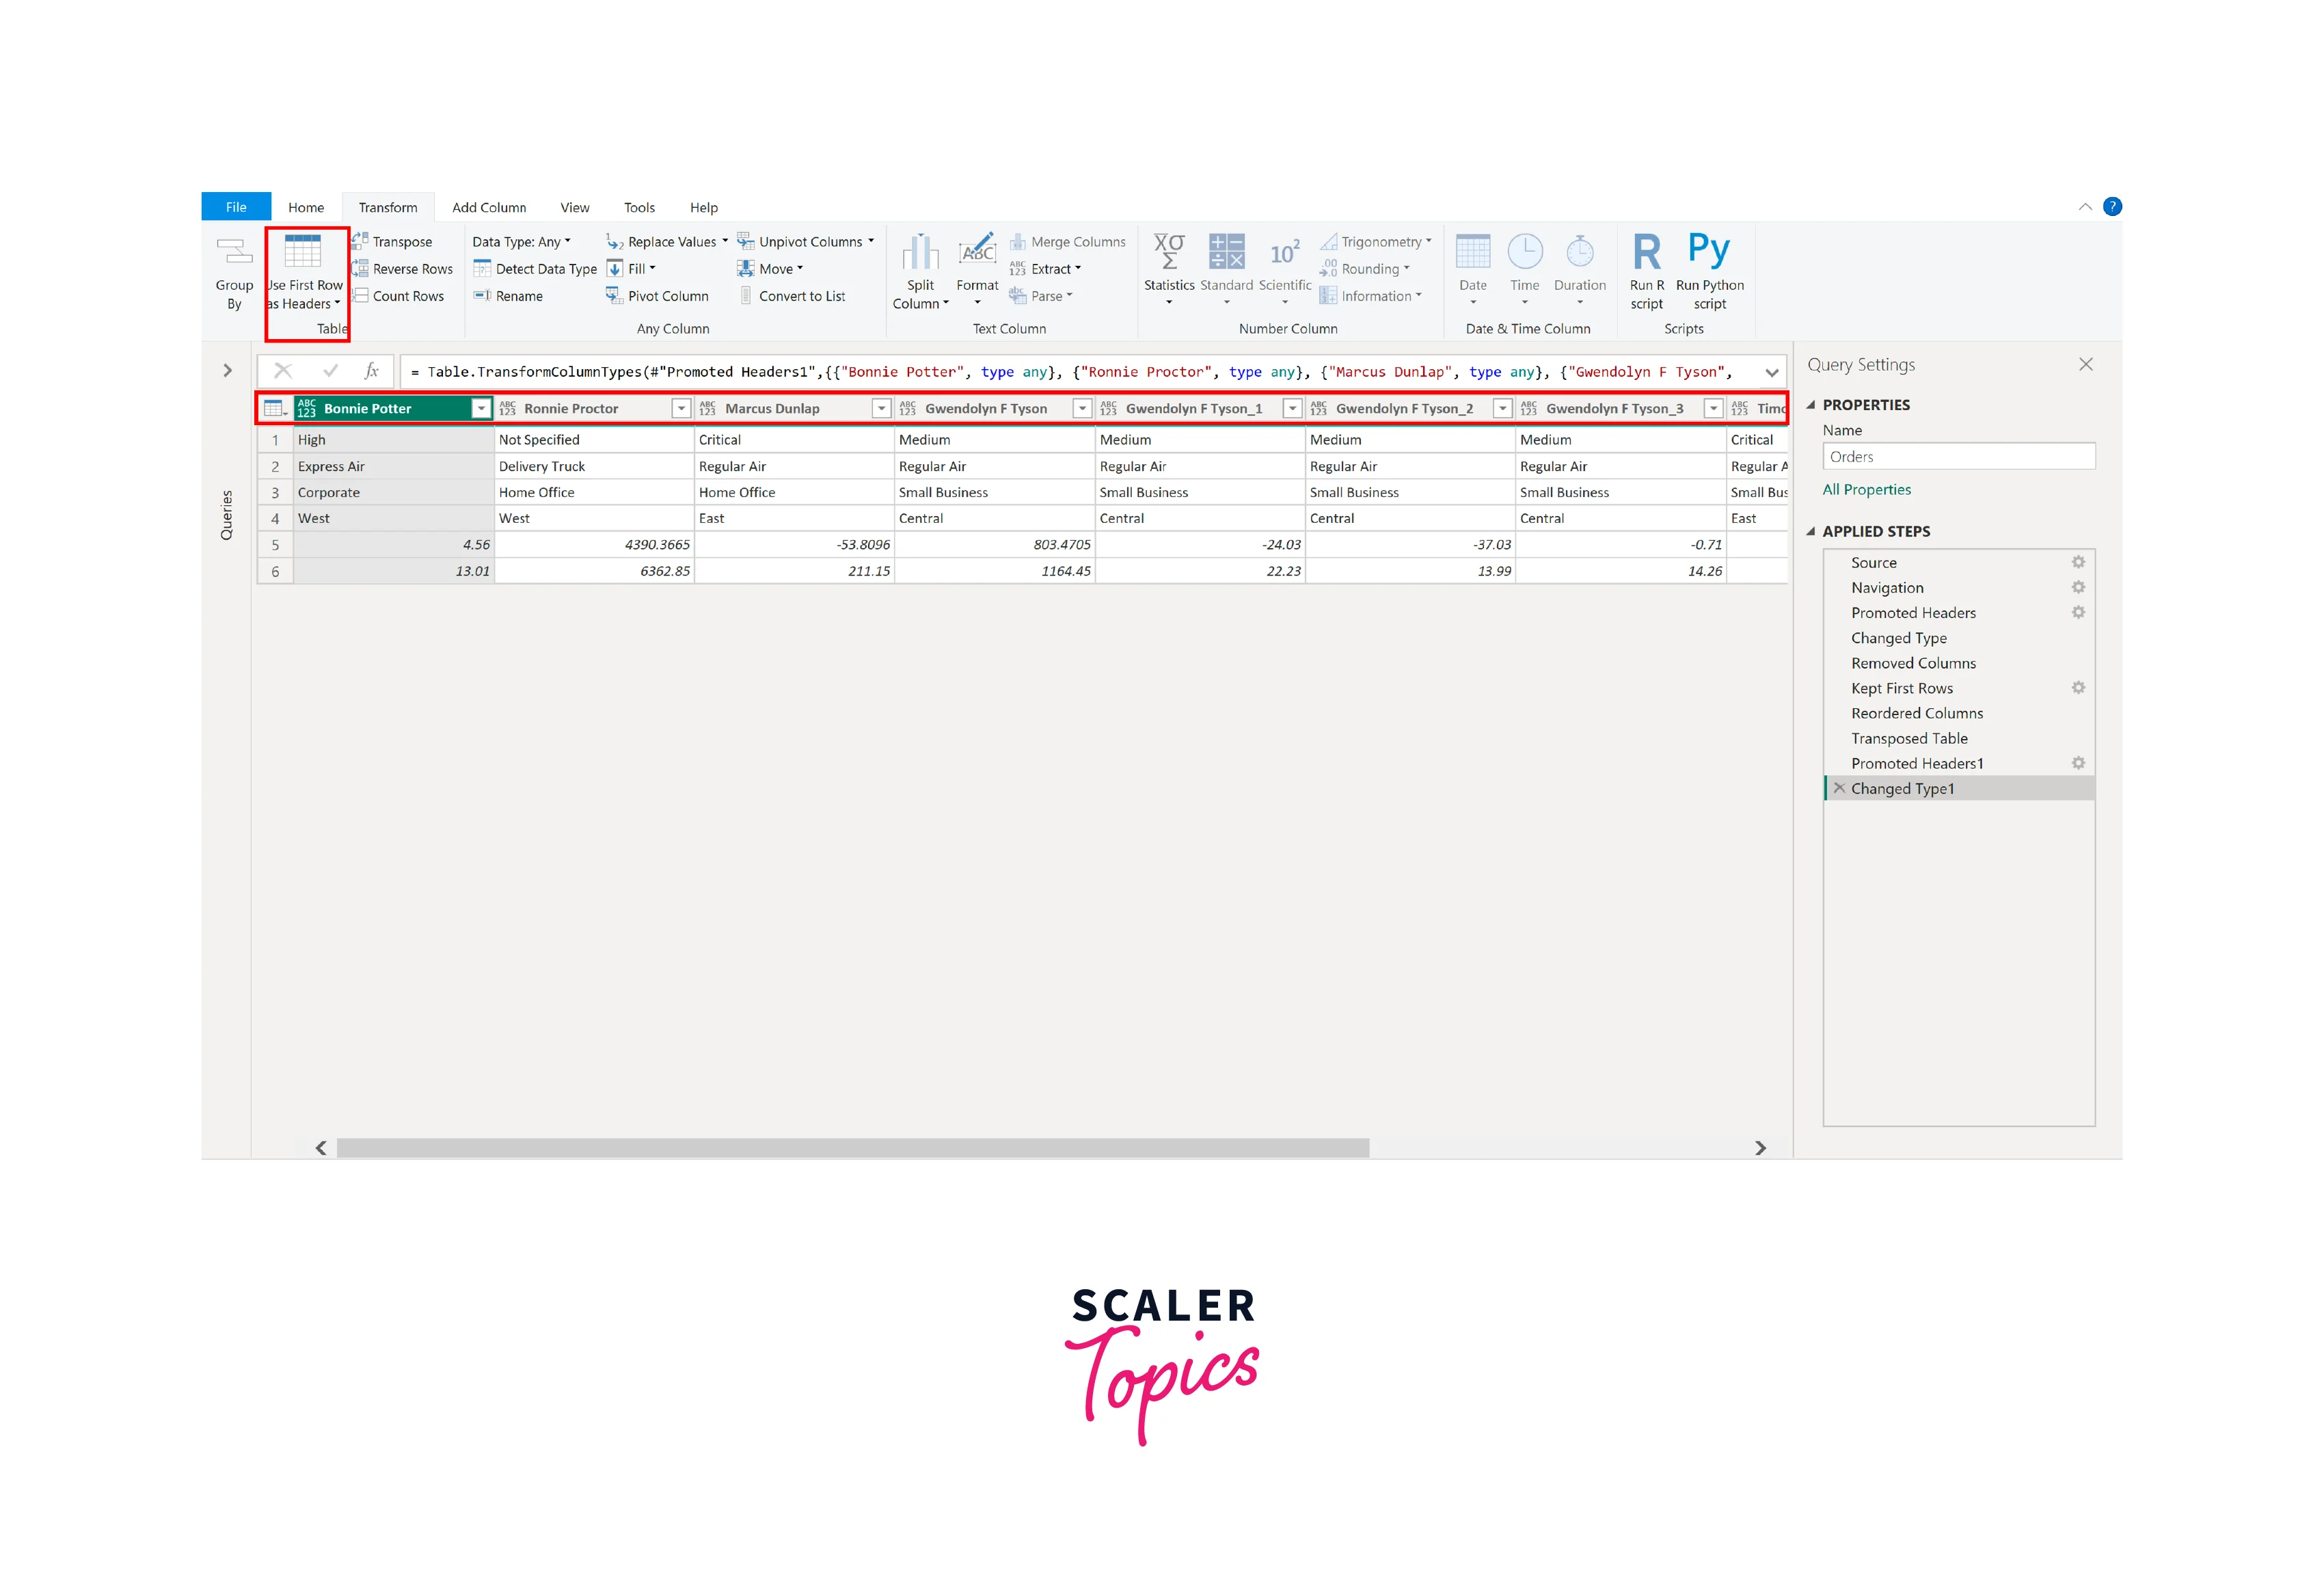
Step 3. Use First Rows as Headers - Navigate to "Transform" > "Use First Row as Headers" button > Select "Use First Row as Headers" option. To finalize the changes to your transposed data, click "Close & Apply" from the Home tab.
Transpose Function in Power BI
The Transpose function in Power BI is a powerful tool that allows users to pivot or rearrange rows into columns and vice versa easily. It provides a straightforward way to reconfigure data layouts, enhancing data visualization and analysis capabilities within the platform.
The Transpose function in Power BI is a powerful tool that simplifies the process of rearranging your data. With just a few clicks, you can convert rows into columns and vice versa, making your data more suitable for further analysis and visualization. This feature is particularly valuable for reshaping datasets, such as converting time series data or reformatting survey responses.
Transposing Rows to Columns
Pivoting Data Transformation
Pivoting is a crucial data transformation technique in Power BI that involves reorganizing data to create a summarized view. It typically aggregates data from multiple rows into columns, allowing for more compact and understandable representations. Pivoting is especially valuable when dealing with datasets with a wide range of attributes or categories, simplifying data analysis and visualization. This transformation empowers users to convert detailed information into a condensed format, making identifying trends, relationships, and patterns within the data easier.
To perform a pivot in Power BI, you can follow the steps mentioned below -
- Open the Power Query Editor and select the column you want to pivot.
- Go to the "Transform" tab and choose "Pivot Column." In the pivot dialog box, under the Value column list, choose the value column. Power Query defaults to using the sum as the aggregation method, but you can opt for the Advanced option to explore other available aggregations before selecting.

- Click "OK" to apply the pivot transformation.

Performing Transpose in Power BI
Data Transpose in Power BI is restructuring data to change rows into columns or vice versa for improved analysis and visualization. The data transpose function applies to any dataset or table and can be executed by following the steps outlined in the preceding sections.
Handling Challenges and Considerations
While data Transpose in Power BI offers valuable benefits, there are certain challenges and considerations to remember. Firstly, transposing large datasets can potentially increase the complexity of data analysis and visualization. It's crucial to assess whether the benefits of transposing outweigh the potential drawbacks in terms of performance and readability.
Secondly, the format of your original data is essential. If your data contains specific formats, such as date or time, transposing can sometimes disrupt these formats. Therefore, it's necessary to anticipate and address any formatting issues that may arise during the transformation. Additionally, when transposing data, the original column headers are replaced with default Power Query column headers (e.g., Column1, Column2). To maintain clarity and context, it's essential to rename these columns appropriately after transposing.
Transposing Columns to Rows
Unpivoting Data Transformation
Unpivoting is a data transformation technique in Power BI that reverses the process of pivoting or transposing. It converts aggregated or summarized data, typically presented in columnar format, back into a more detailed, row-based format. This transformation is particularly useful when you need to revert to the original data structure for further analysis or visualization. Unpivoting allows you to expand aggregated data, providing greater granularity and flexibility in your analytical endeavors.
Performing Unpivot in Power BI
To perform an unpivot in Power BI, follow the steps mentioned below -
- In the Power Query Editor, select the column(s) you want to unpivot. These are typically the columns containing aggregated or summarized data.
- Right-click on the selected column(s) and choose "Unpivot Columns" from the drop-down menu.
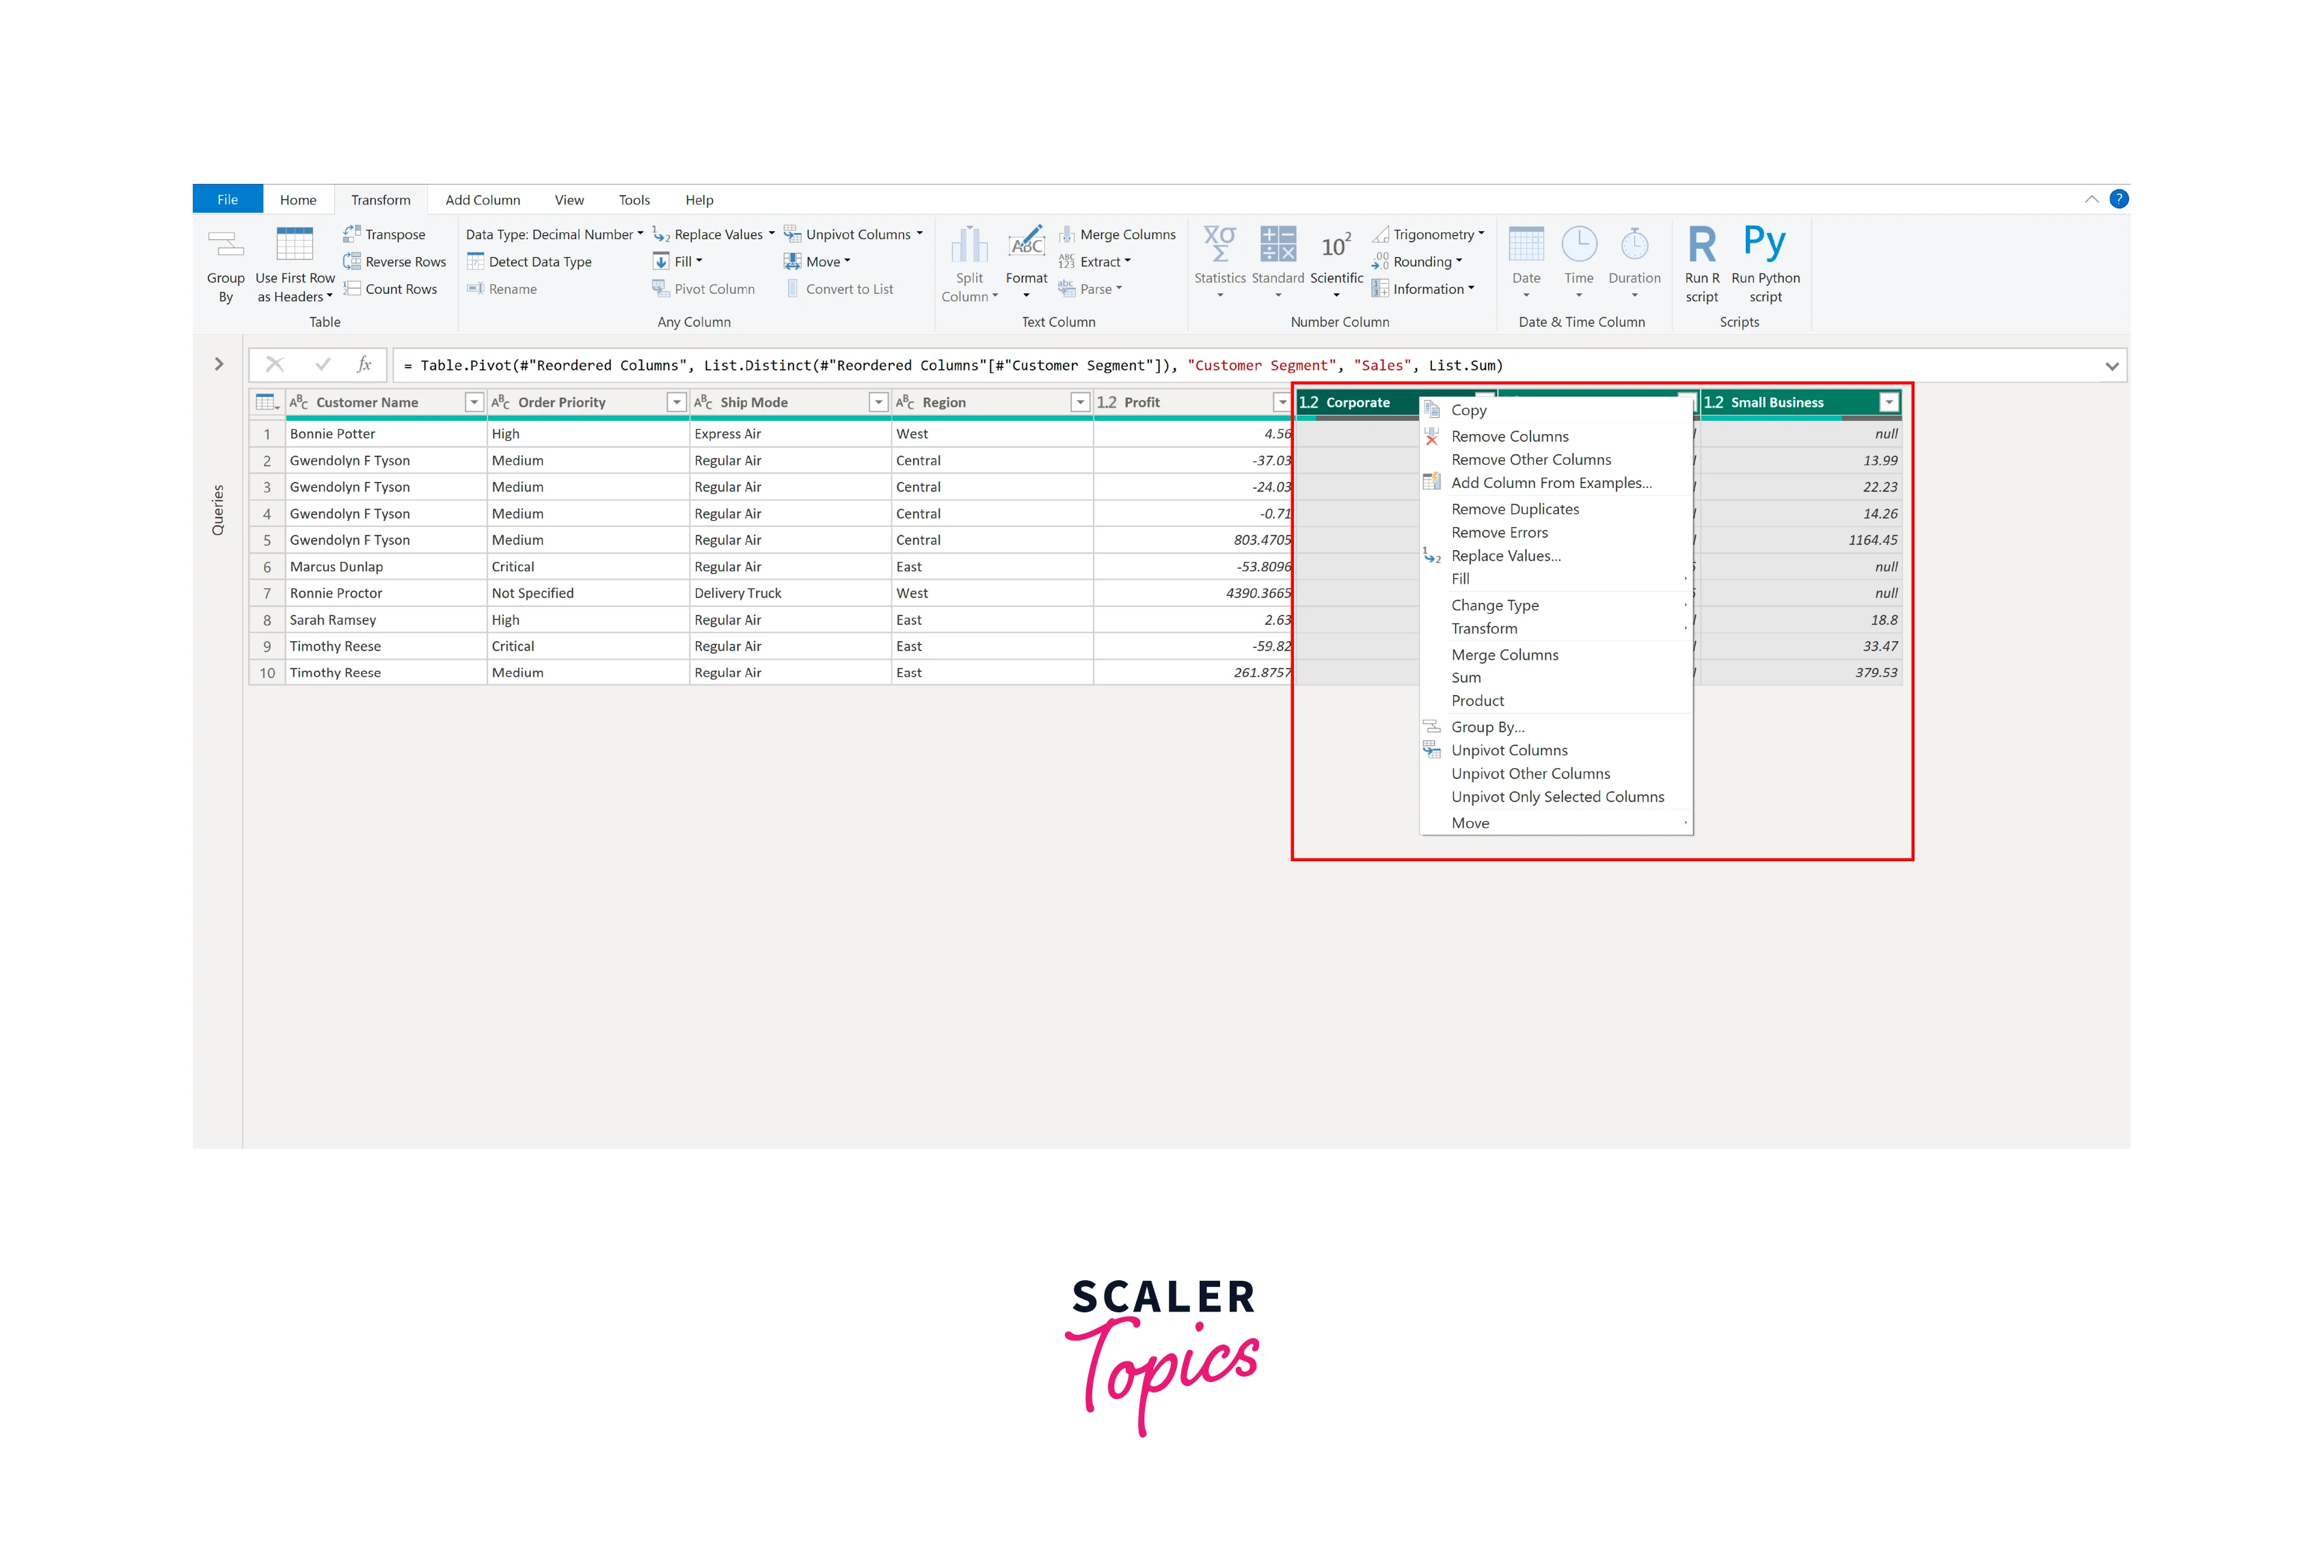
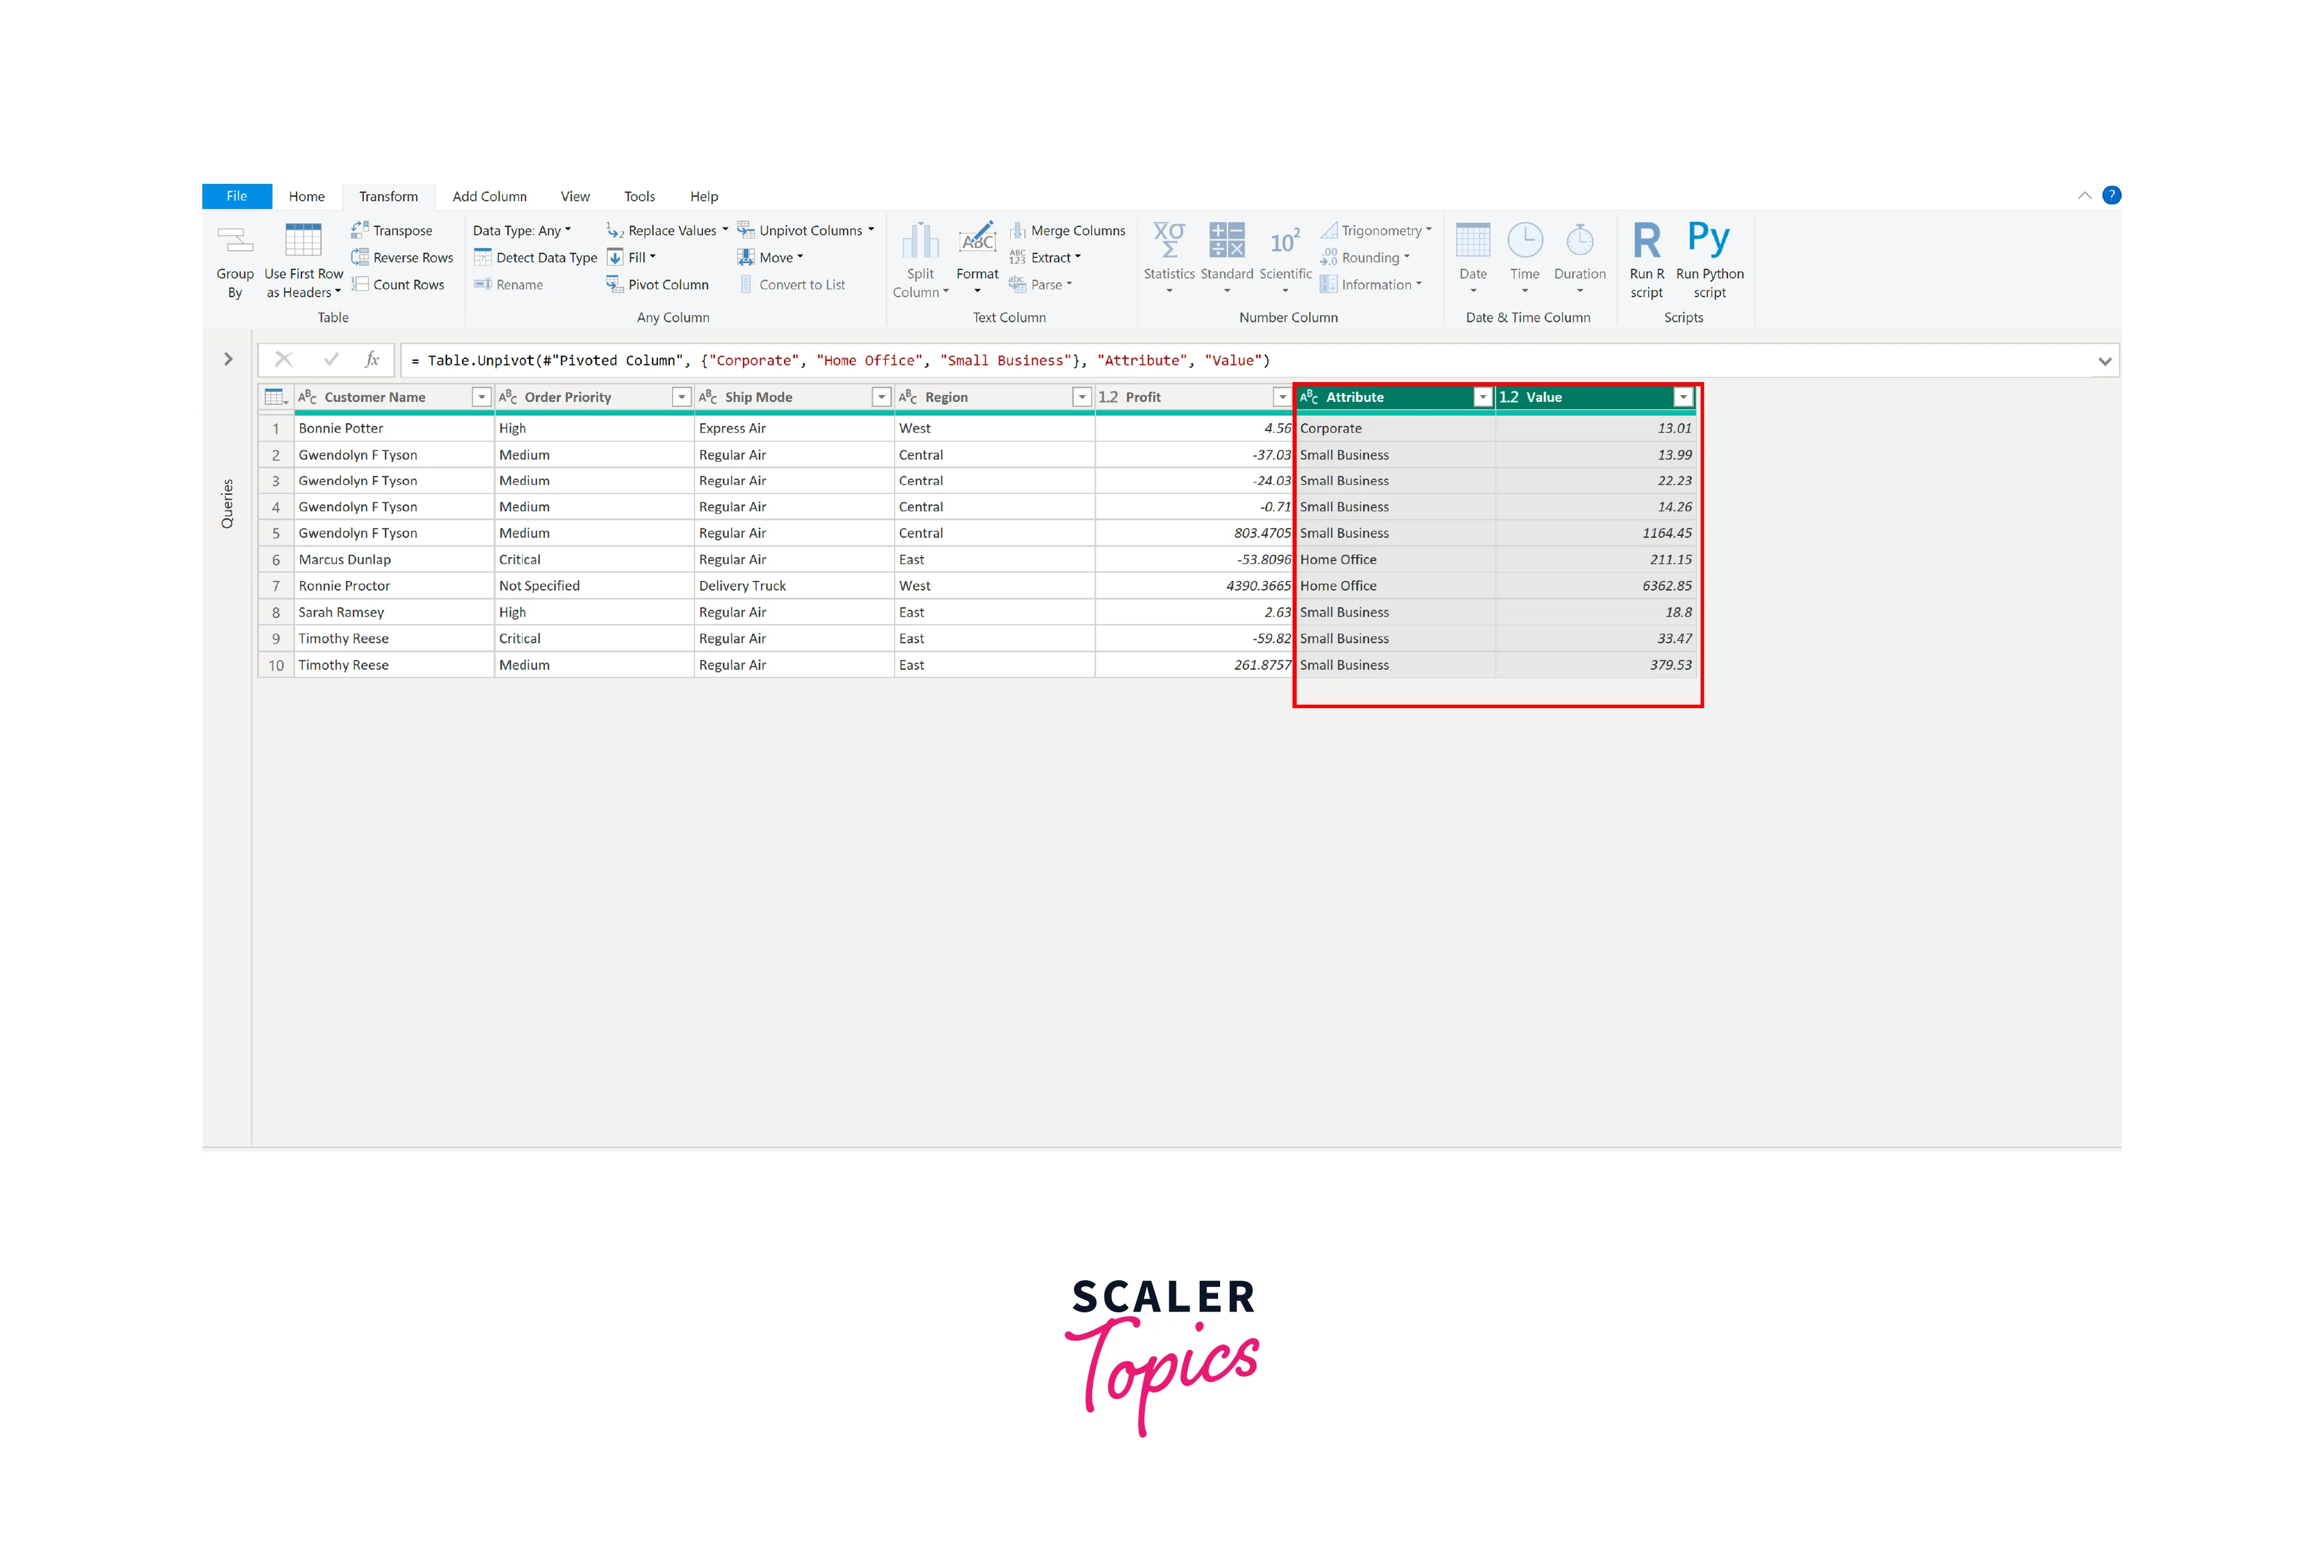
- Click "OK" to apply the unpivot transformation.
Managing Unpivot Issues and Limitations
While unpivoting in Power BI is a powerful data transformation tool, it's essential to be aware of potential issues and limitations. One common challenge is dealing with missing or irregular data in the original dataset. Unpivoting can introduce null or empty values when there are gaps in the data, requiring data cleaning or filling strategies.
Additionally, the process can become complex when handling multiple levels of aggregation or nested columns. It's crucial to plan the unpivoting approach carefully to ensure the resulting data structure aligns with your analysis needs. Furthermore, consider the performance impact of unpivoting, especially with large datasets. Extensive use of unpivoting can lead to data models with a high degree of granularity, potentially affecting query and report performance.
Advanced Techniques for Transposing Data in Power BI
Once you've established a foundational understanding, Power BI offers an array of advanced techniques to elevate your data transpose skills. For instance, you can utilize the 'Unpivot Columns' function to reverse the process, converting columns back into rows. Alternatively, the 'Append Queries' function empowers you to merge multiple tables into a single cohesive dataset. For highly tailored transformations, scripting enables the creation of custom functions tailored to your unique requirements.
An advanced maneuver in Power BI's data transpose toolkit also involves the 'Pivot Columns' function, allowing you to pivot rows into columns. This proves valuable when data is better presented in a columnar format. Moreover, the 'Group By' function offers a strategic approach to organizing data based on specific criteria, such as date or category, and then transposing the grouped data for more insightful visualizations.
Common Mistakes to Avoid when Transposing Data in Power BI
When working with Power BI's data transposition capabilities, avoiding common errors is crucial. For instance, miss sequencing transformations can yield unexpected outcomes. Neglecting data validation before transposition can introduce data quality problems. Additionally, maintaining awareness of your data's format and structure is paramount, as these factors directly impact the success of your transformations.
Troubleshooting Transpose Errors in Power BI
You can employ troubleshooting measures when facing errors during data transposition in Power BI. Start by revisiting your Power Query Editor transformations, ensuring their proper sequencing. Verify data format and structure alignment with your intended transformations. Leverage Power Query Editor's error messages for pinpointing and resolving specific issues.
Conclusion
- Data Transpose in Power BI is a versatile technique that can enhance data analysis and visualization by reshaping data from rows to columns and vice versa.
- Advanced techniques, such as pivoting, unpivoting, appending queries, and custom scripting, provide powerful tools for tailored data transformations, offering a deeper understanding of complex datasets.
- It's crucial to avoid common mistakes, sequence transformations correctly, validate data beforehand, and maintain awareness of data format and structure to make the most of these capabilities.