Probability in Excel: What should you Use?
Overview
This is an interactive guide to understanding and applying probability in Excel. You'll explore how to use Excel's robust tools to calculate probabilities, generate random numbers, and analyze data. From simple scenarios to intricate simulations, learn to employ probability functions like RAND, RANDBETWEEN, and COUNTIF through practical examples.
Introduction
Probability, a fundamental concept in statistics and decision-making, finds its rightful place within Excel. As a versatile spreadsheet software, Excel offers many tools and functions to quantify and analyze uncertainty. By definition, probability in Excel refers to the likelihood of an event occurring
Why Use Excel to Calculate Probability?
Excel is an excellent choice if you're interested in learning probability calculations. Here are the key reasons why Excel is the preferred tool for probability calculations:
- Built-in Functions:
Excel provides a wide range of built-in functions specifically designed for probability calculations, eliminating manual calculations and ensuring accuracy. - Versatility:
Excel's versatility allows you to seamlessly integrate probability calculations with other data analysis tasks, enabling a holistic approach to understanding and interpreting probabilities. - Reproducibility:
Excel's formula-based approach ensures that probability calculations are easily replicable and auditable. By documenting your formulas and inputs, you can easily share your calculations with others, ensuring transparency and facilitating collaboration. - Practical Application:
Probability calculations in Excel have real-world applications in various fields such as finance, marketing, and operations, making it a valuable skill for career development. - Transferable Skills:
Excel proficiency in probability calculations is highly transferable, allowing you to apply your knowledge and skills across different industries and job roles.
Important Terms when Calculating Probability in Excel
When calculating probability in Excel, familiarity with certain key terms is helpful. Here are some important terms to understand:
- Random Variable:
A variable whose value is determined by chance or probability. - Probability Distribution:
A function that describes the probabilities of different outcomes in a random variable. - Cumulative Distribution Function (CDF):
A function that gives the probability that a random variable takes on a value less than or equal to a given value. - Probability Density Function (PDF):
The PDF represents the relative likelihood of different outcomes for continuous random variables. - Random Number Generation:
The process of generating random numbers according to a specified probability distribution. - Conditional Probability:
The probability of an event occurring given that another event has already occurred. - Expected Value:
A random variable's average value would take over infinite trials. - Standard Deviation:
A measure of the spread or dispersion of a random variable, indicating how much it deviates from its expected value. - Confidence Interval:
A range of values within which an unknown population parameter is estimated to lie with a certain confidence level. - Hypothesis Testing:
A statistical procedure to determine whether the data support a hypothesis about a population parameter.
Understanding these terms will provide a solid foundation for working with probability calculations in Excel and interpreting the results accurately.
How to Calculate Probability in Excel?
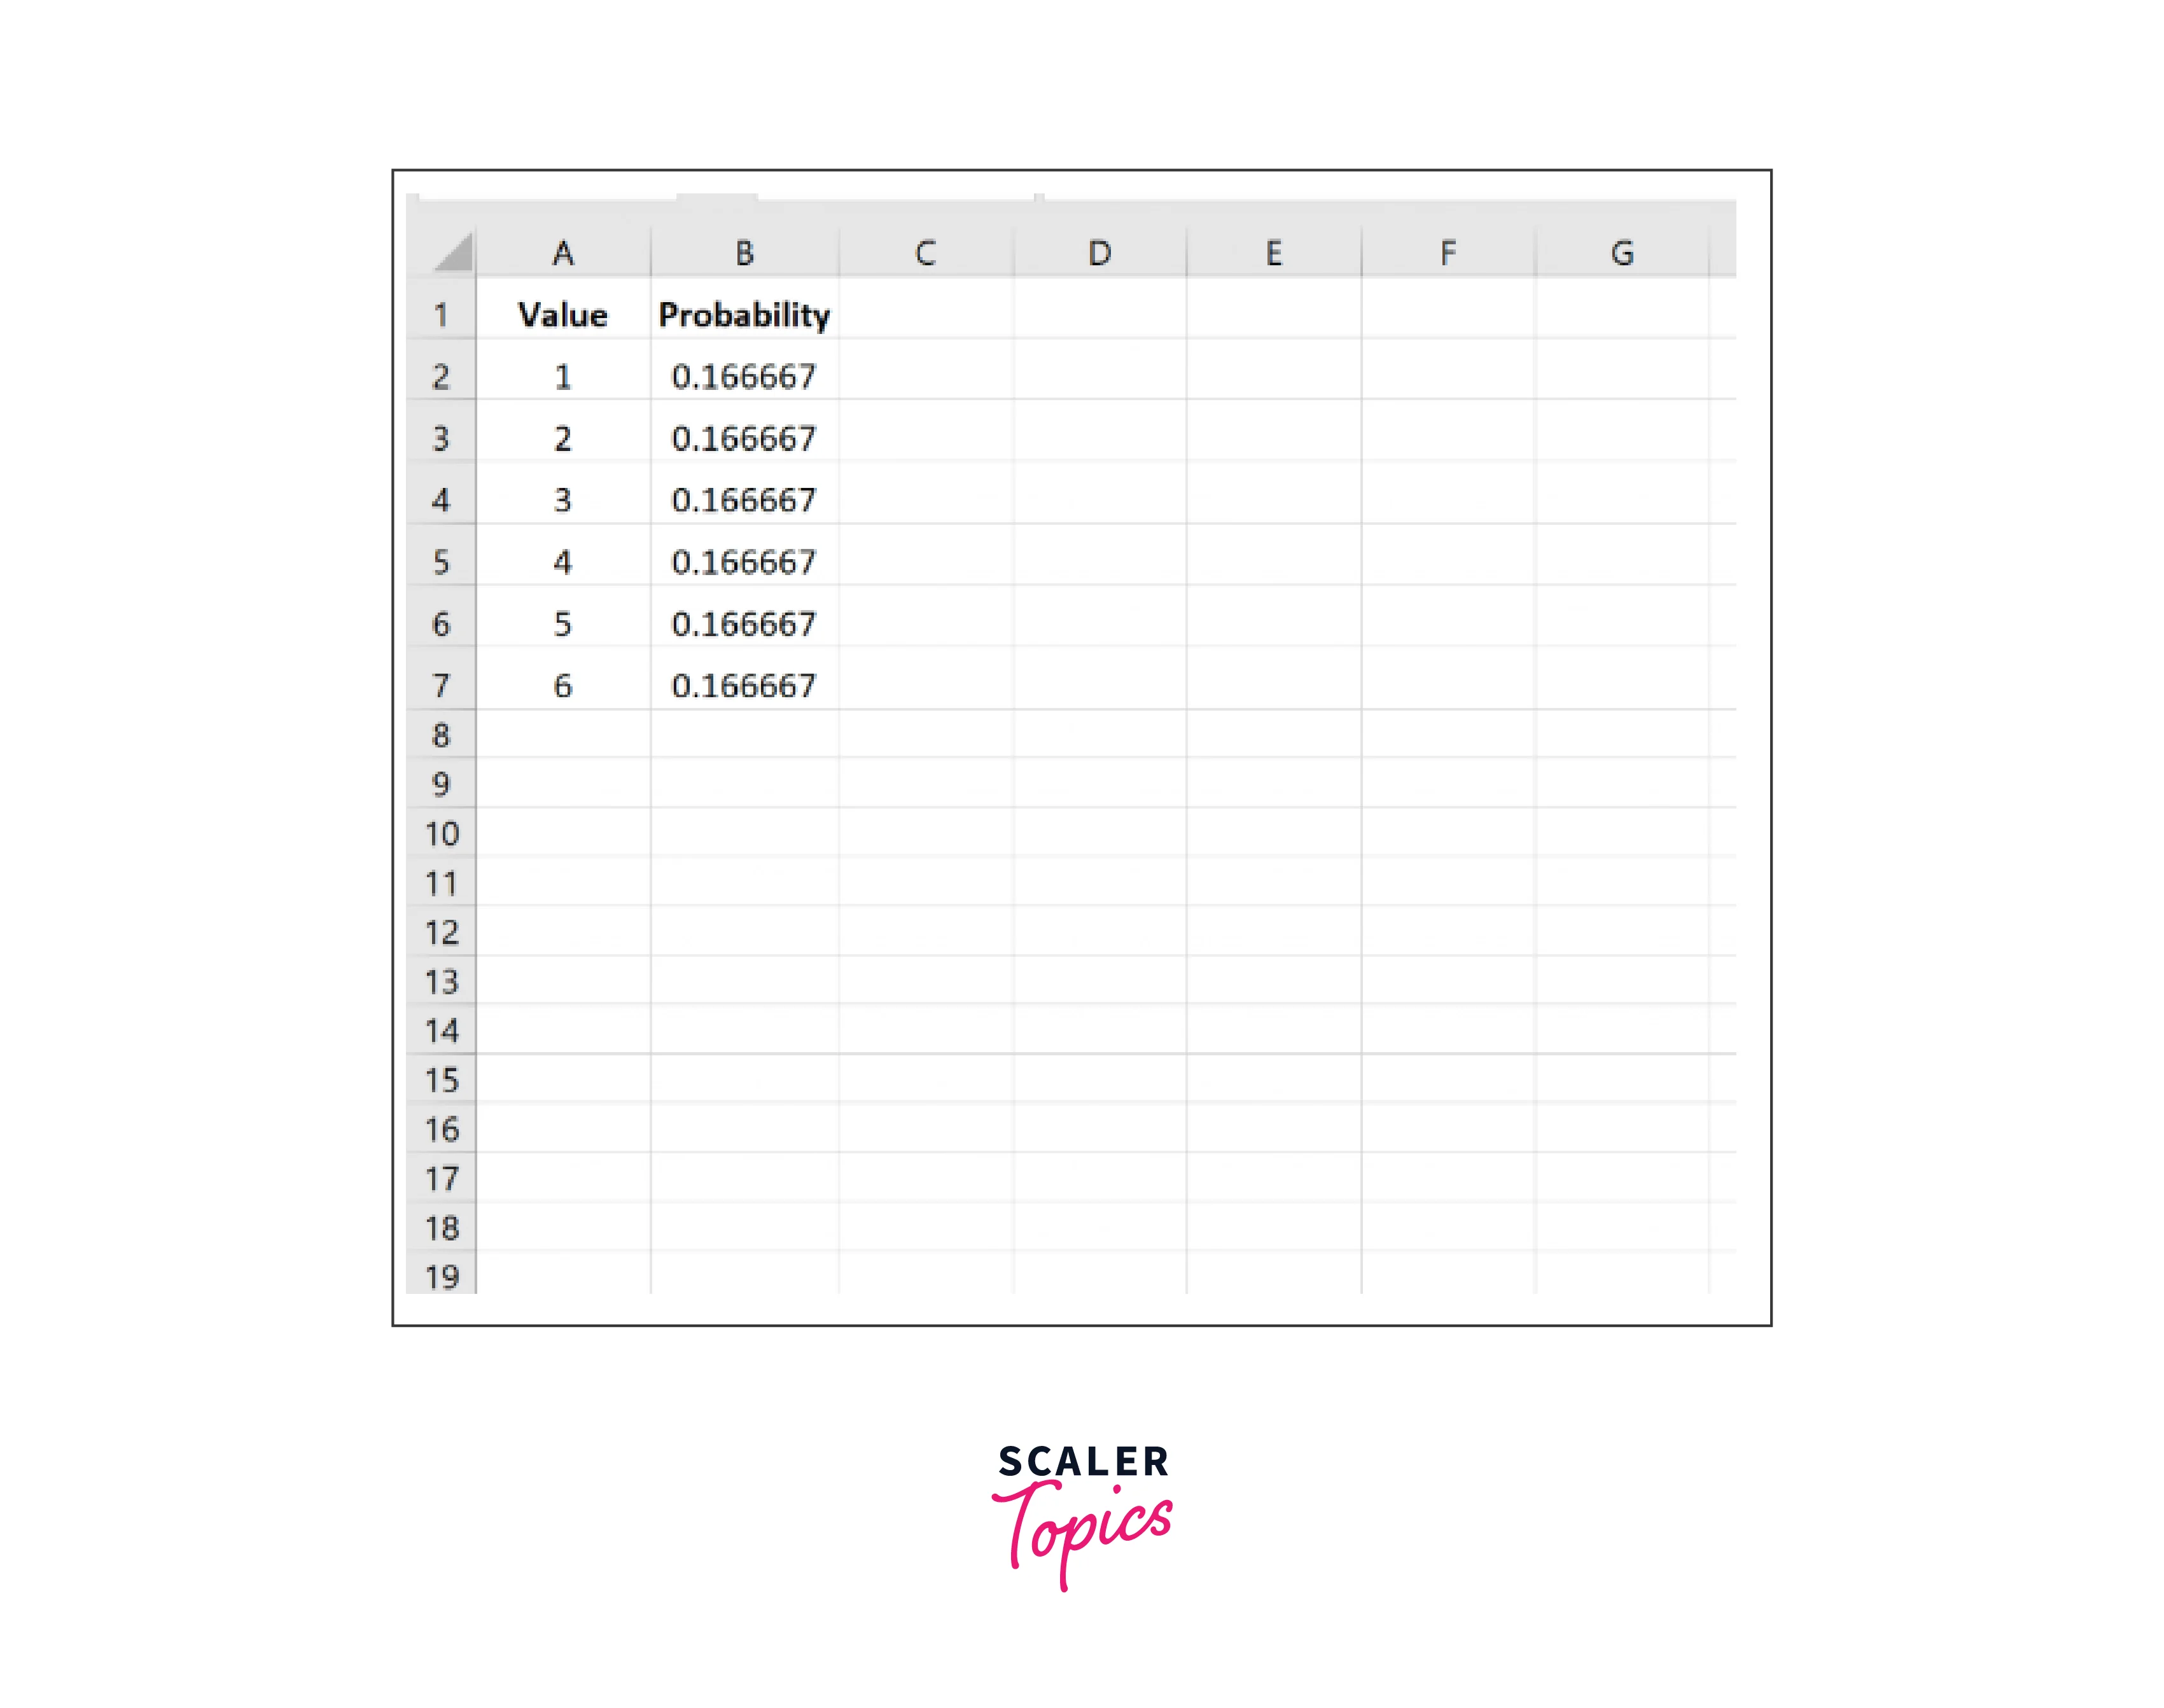
Certainly! Here are the steps to calculate probability in Excel using the PROB function for a dice landing between 3 and 6:
-
Step - 1: Set up your data
Create a column (A2:A7) with the possible outcomes representing the numbers on a die .
-
Step - 2: Enter probability values
In the adjacent column (B2:B7), enter the probability values for each outcome. For example, since fair six-sided dice have equal probabilities for each number, the probabilities would be for each outcome.
-
Step - 3: Determine the desired outcome range
Identify the desired outcome range between 3 and 6 (inclusive).

-
Step - 4: Use the PROB function.
To calculate the probability using the PROB function, follow this syntax:
where,
-
range:
The values representing the possible outcomes (A1:A6). -
probabilities:
The range of probabilities corresponding to each outcome (B1:B6). -
logical_test_range:
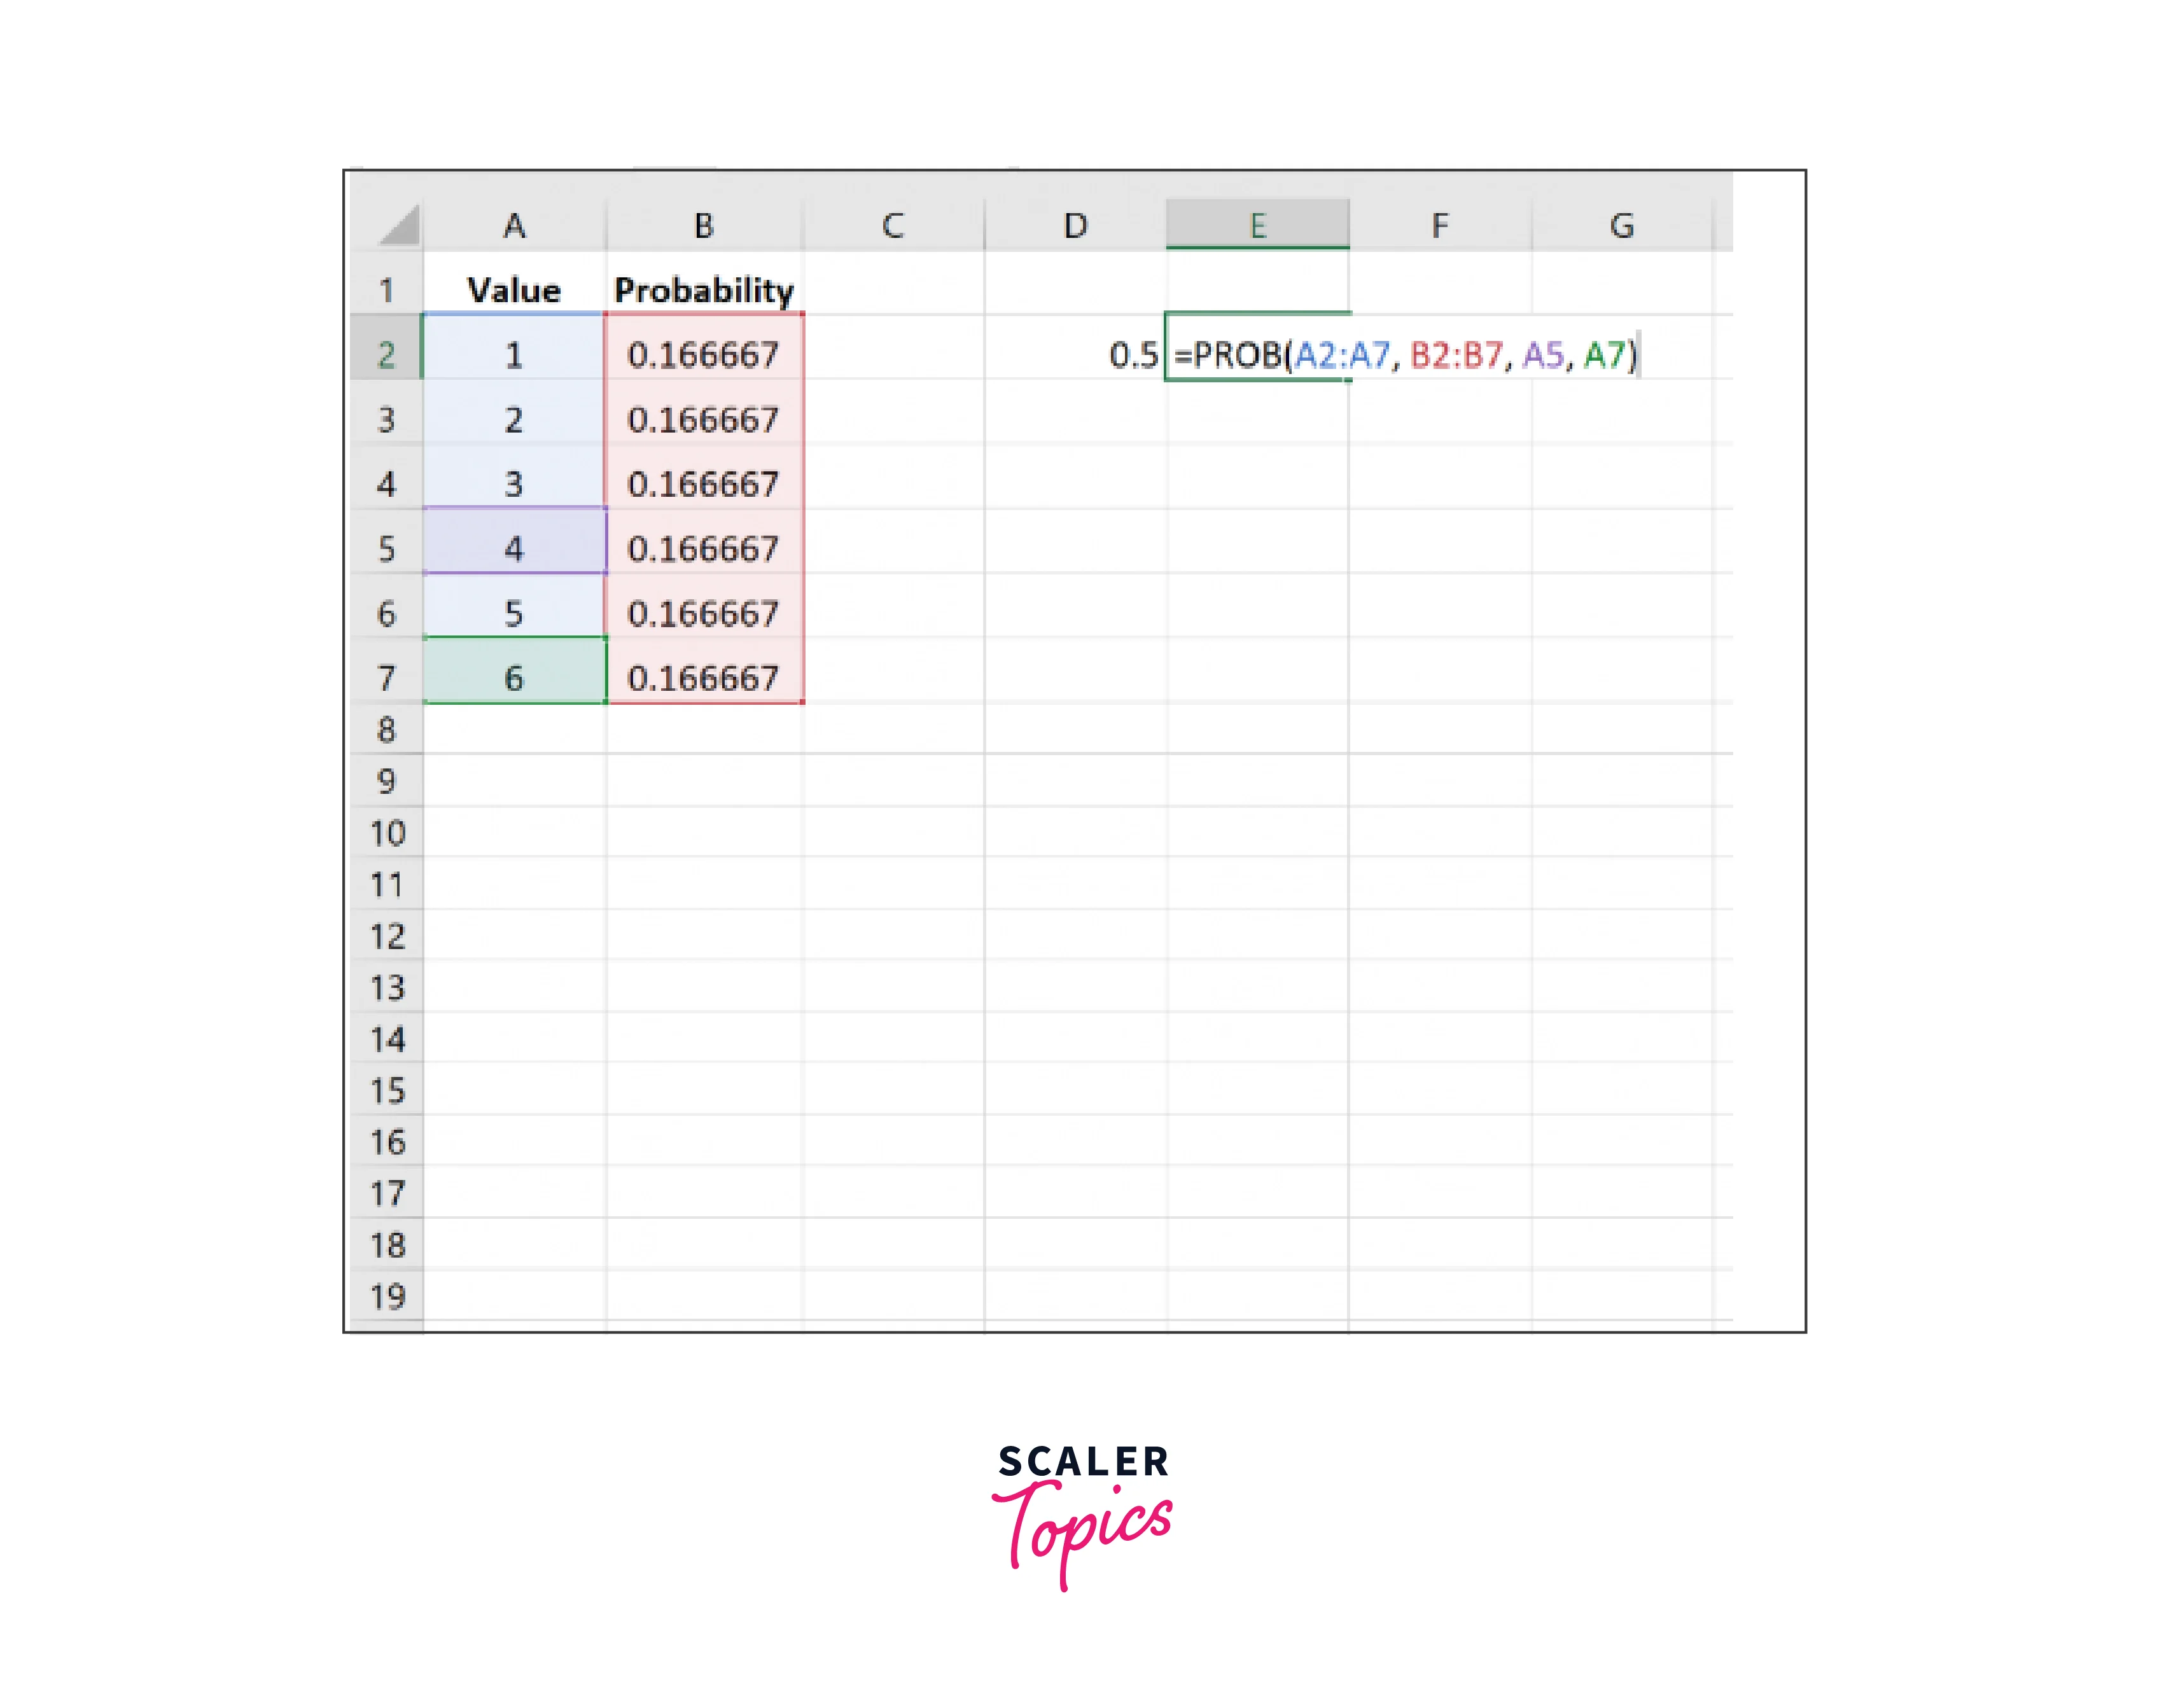
A logical test range that defines the desired outcome range.In a cell, enter the formula:
-
-
Step - 5: Interpret the result.
The result of the PROB function will be the calculated probability for the desired outcome range, i.e., the probability of the dice landing between 3 and 6 (inclusive).

The probability turns out to be 0.5.
-
Step - 6: Format and present your results.
Format the calculated probability as a percentage or decimal and present it with clear labels.
By following these steps and utilizing the PROB function in Excel, you can easily calculate the probability of a dice landing between 3 and 6.
Here, the logical_test_range ">2" and "<7" specify that we want outcomes greater than 2 and less than 7 to be included in the desired range, which covers the numbers 3, 4, 5, and 6 on a dice.
Tips for Calculating Probability in Excel
Here are some tips for calculating probability in Excel, specifically for those who are working with Excel:
Understand probability functions and their parameters:
- Familiarize yourself with the syntax and parameters of Excel's probability functions, such as PROB, BINOM.DIST, NORM.DIST, etc.
- For example, to calculate the probability of a specific outcome using the PROB function, use the formula: =PROB(range, probabilities, x).
Use advanced probability functions for specific distributions:
- Excel offers functions tailored to specific probability distributions, such as the BINOM.DIST for binomial distribution and NORM.DIST for normal distribution.
- For example, calculate the probability of getting three heads in 5 coin flips using the BINOM.DIST function: =BINOM.DIST(3, 5, 0.5, FALSE).
Explore array formulas for efficient calculations:
- Array formulas allow simultaneous calculations on multiple data points, saving time and effort.
- For example, to calculate the probabilities of multiple outcomes using the PROB function, enter the formula for one cell and then drag it across the range of outcomes.
Leverage named ranges for clarity and maintainability:
- Assign meaningful names to data ranges to enhance formula readability and make formulas easier to maintain.
- For example, define a named range of "grades" for the range of cells containing grade values.
Consider using conditional functions for complex scenarios:
- Use conditional functions like IF, COUNTIF, or SUMIF to calculate probabilities based on specific conditions or criteria.
- For example, use the SUMIF function to calculate the probability of an event occurring when certain conditions are met.
Optimize calculations with efficient formulas:
- Use Excel's functions and operators to optimize calculations and minimize formula complexity.
- For example, use the SUMPRODUCT function to calculate the weighted average probability of multiple events.
Continuously expand your knowledge and skills:
- Stay updated on new features and functions in Excel that can aid in probability calculations.
- Explore advanced topics like conditional probability, Bayes' theorem, or Monte Carlo simulations to enhance your expertise.
Probability Calculation Examples
Different Types of Probability Distribution
Several types of probability distributions are commonly used in statistics and probability theory. Here are some of the most important ones:
Normal Distribution:
- Also known as the Gaussian distribution, it is characterized by a symmetric bell-shaped curve. Many natural phenomena follow this distribution, making it widely used in statistical analysis.
- To generate random numbers following a normal distribution, use the NORM.INV or NORM.S.INV function. For example, =NORM.INV(RAND(), mean, standard_deviation) generates a random number from a normal distribution with a given mean and standard deviation.
Binomial Distribution:
- This distribution models the number of successes in a fixed number of independent Bernoulli trials. It is used for binary events where each trial has two possible outcomes (success or failure).
- To generate random numbers following a binomial distribution, use the BINOM.INV function. For example, =BINOM.INV(RAND(), n, p) generates a random number from a binomial distribution with n trials and a success probability of p.
Uniform Distribution:
- It is often represented as a rectangular-shaped probability distribution. In this distribution, all outcomes have equal probability. A classic example is rolling a fair six-sided dice, where each outcome has an equal probability of .
- Using the RAND function to generate random numbers following a uniform distribution. For example, =RAND() generates a random number between 0 and 1 (exclusive).
Exponential Distribution:
-
This distribution models the time between events occurring in a Poisson process, where events occur randomly and independently in continuous time. It is often used to analyze the waiting time or duration until an event happens. Examples include when customers arrive at a service desk or when a machine fails.
-
To generate random numbers following an exponential distribution, use the EXPON.DIST function. For example,
generates a random number from an exponential distribution with a given rate parameter lambda.
Poisson Distribution:
-
This distribution is used to model the number of events that occur in a fixed interval of time or space, given that events occur at a constant average rate and independently of each other. It is commonly used to analyze rare events or count data, such as the number of phone calls received in an hour or accidents at a particular intersection in a day.
-
To generate random numbers following a Poisson distribution, use the POISSON.INV function. For example,
generates a random number from a Poisson distribution with an average rate of lambda.
How to Perform Probability Distribution in Excel?
To perform probability distribution in Excel, you can follow these general steps:
-
Set up your data:
Create a column or range in Excel to represent the possible outcomes of your random variable or events. -
Assign probabilities:
In an adjacent column or range, assign probabilities to each outcome based on the specific probability distribution you are working with. Ensure that the probabilities sum up to 1. -
Choose the appropriate Excel function:
Select the corresponding Excel function Depending on the probability distribution you are working with. -
Enter the formula:
In a cell, enter the formula corresponding to the chosen function and provide the necessary arguments. -
Evaluate the result:
Excel will calculate the desired probability based on the provided inputs and display the result.
Conclusion
In conclusion, here are the key points to remember about performing probability distribution in Excel:
- Probability distribution calculations in Excel involve assigning probabilities to possible outcomes and using appropriate functions to calculate probabilities or generate random numbers.
- Set up your data by creating a column or range representing outcomes and an adjacent column or range for corresponding probabilities.
- Choose the Excel function corresponding to the probability distribution you are working with, such as NORM.DIST for the normal distribution or BINOM.DIST for the binomial distribution.
- Enter the formula in a cell, providing the necessary arguments, such as the value, mean, standard deviation, or success probability.
- Excel will calculate the desired probability or generate a random number based on the provided inputs.
- Evaluate the result to obtain the probability of an event occurring or to generate random values based on the specified distribution.
- Adjust the function and arguments according to the specific probability distribution and parameters of your problem.
