Customer and Products Analysis in Excel : What should you use?
Overview
Customer and Products Analysis in Excel is a project that involves analyzing customer behavior and product performance using Microsoft Excel. The project aims to identify trends, patterns, and insights to help businesses make data-driven decisions to improve their sales and profitability. By analyzing customer purchase behavior, businesses can identify their most valuable customers and tailor their marketing strategies accordingly. Additionally, by analyzing product performance, businesses can identify their best-selling products, understand why they sell well, and make informed decisions on how to optimize their product offerings. This project provides a powerful tool for businesses to gain a competitive edge in their respective markets.
What are We Building?
In customer and product analysis, we are building a data-driven understanding of the behavior of our customers and the performance of our products. By analyzing data such as customer demographics, purchase history, and product sales, we can identify trends and patterns that can inform business decisions.
In Excel, we can use a variety of tools and techniques to analyze customer and product data. These might include pivot tables, charts and graphs, and statistical analysis functions. By visualizing and summarizing the data in these ways, we can gain insights into which products are most popular, which customers are the most profitable, and which marketing campaigns are the most effective.
The goal of customer and product analysis in Excel is to help businesses make data-driven decisions that improve their bottom line. By understanding customer behavior and product performance, businesses can optimize their marketing and sales strategies, improve customer retention, and increase revenue.
a. Pre-Requisites
i. Customer Analysis
Customer analysis is a crucial aspect of customer and product analysis in Excel. It involves the collection and analysis of data related to customer demographics, behavior, and preferences to understand their needs and make informed business decisions. Here are some of the key aspects of customer analysis:
- Demographics: This refers to characteristics such as age, gender, income, education level, and location. Analyzing demographic data can help businesses understand the makeup of their customer base and tailor their marketing and sales strategies accordingly.
- Behavior: This includes factors such as purchase history, frequency of purchases, and loyalty to the brand. By analyzing customer behavior, businesses can identify patterns and trends that can inform product development and marketing strategies.
- Preferences: This refers to factors such as product preferences, communication channels, and brand loyalty. By understanding customer preferences, businesses can create personalized marketing campaigns and improve customer retention.
Techniques used for customer segmentation and profiling:
- Demographic segmentation: This involves dividing customers into groups based on demographic factors such as age, gender, and income.
- Behavioral segmentation: This involves dividing customers into groups based on their behavior, such as frequency of purchases or loyalty to the brand.
- Psychographic segmentation: This involves dividing customers into groups based on their personality traits, values, and lifestyle.
- Customer profiling: This involves creating detailed profiles of individual customers based on their demographics, behavior, and preferences.
Examples of insights and findings obtained from customer analysis:
- Identifying the most profitable customer segments based on their spending habits and loyalty to the brand.
- Determining the most effective communication channels for reaching different customer segments.
- Identifying areas where customer satisfaction can be improved, such as product quality or customer service.
- Understanding customer preferences for product features and using this information to inform product development.
ii. Product Analysis
Product analysis is a crucial part of customer and product analysis in Excel. It involves examining various aspects of a product, such as its sales trends, pricing, and profitability, to gain insights into how it is performing in the market. The following are the different aspects of product analysis:
- Sales trends: By analyzing the sales data of a product over some time, we can identify trends and patterns in its performance. This can help us determine which products are popular and which are not, and make decisions on inventory management and production.
- Pricing: Analyzing the pricing of a product can help us understand how it is priced compared to competitors in the market. We can also determine if the pricing strategy is effective or if it needs to be adjusted.
- Profitability: Analyzing the profitability of a product involves examining the costs associated with production, marketing, and distribution, and comparing them to the revenue generated by sales. This can help us determine if a product is profitable or if changes need to be made to increase profitability.
There are different techniques used for product segmentation and analysis. These include:
- ABC analysis: This involves segmenting products into categories based on their importance and profitability.
- Pareto analysis: This technique involves identifying the products that generate the most revenue and focusing on those products to maximize profits.
- Market basket analysis: This technique involves analyzing the items purchased together by customers to identify cross-selling opportunities.
Some of the insights and findings obtained from product analysis include:
- Identifying the most profitable products and optimizing production and distribution to increase profitability.
- Determining which products are not performing well and making decisions on whether to discontinue them or change the marketing strategy.
- Identifying the most popular products and developing targeted marketing campaigns to increase sales.
iii. Customer and Product Analysis
Customer and product analysis involves examining data related to customer behavior and product performance in the order of correlations and patterns between the two. By integrating customer and product analysis, businesses can gain a more comprehensive understanding of their operations and make data-driven decisions that improve customer satisfaction, increase sales, and improve profitability.
For example, by analyzing customer demographics and purchase history, businesses can identify which products are most popular among different customer segments. This information can be used to tailor marketing campaigns to specific groups of customers, improving the relevance and effectiveness of these campaigns. Similarly, by analyzing product sales data, businesses can identify which products are most profitable and make data-driven decisions about pricing, inventory management, and product development.
One example of a finding obtained from customer and product analysis might be that a particular product is most popular among young adult customers. This information could be used to develop marketing campaigns targeted specifically at this demographic, potentially increasing sales and customer satisfaction. Similarly, customer and product analysis might reveal that a particular product is not performing as well as expected. By examining customer feedback and other data, businesses can identify opportunities to improve the product and boost sales.
b. How are We Going to Build This?
To build a customer and product analysis project in Excel, we will follow a systematic approach that involves several key steps:
- Data collection: The first step is to collect relevant data from various sources, such as sales records, customer feedback, and website analytics. This data should be organized into a format that is easy to work with, such as a spreadsheet.
- Data cleaning and preparation: Once the data has been collected, it must be cleaned and prepared for analysis. This may involve removing duplicate entries, filling in missing data, and formatting consistently formatting the data analysis:** With the data cleaned and prepared, the next step is to analyze it using a variety of Excel tools and techniques. This may involve creating pivot tables, charts, and graphs, and using statistical analysis functions to identify correlations and patterns.
- Interpretation of results: Once the data has been analyzed, the results must be interpreted in the context of the business objectives. This may involve identifying areas where improvements can be made, developing new marketing strategies, or making data-driven decisions about product development.
- Communication of findings: The final step is to communicate the findings of the analysis to stakeholders within the business. This may involve creating presentations, reports, or dashboards that highlight the key insights and recommendations.
- Throughout the project, it is important to maintain a focus on the business objectives and ensure that the analysis is tailored to meet the specific needs of the organization. By following a systematic approach and using Excel tools and techniques, businesses can gain valuable insights into customer behavior and product performance, and make data-driven decisions that improve their bottom line.
Final Output
Requirements
To perform customer and product analysis in Excel, there are several libraries, modules, and other requirements that may be helpful or necessary. Some of these include:
- Microsoft Excel: Excel is the primary software tool used for this type of analysis. It is important to have a version of Excel that includes the necessary data analysis tools, such as pivot tables and statistical functions.
- Data cleaning and preparation tools: Depending on the complexity of the data, it may be necessary to use additional tools or modules to clean and prepare the data for analysis. These may include modules for data wrangling, text parsing, or data visualization.
- External data sources: To perform a comprehensive analysis, it may be necessary to incorporate data from external sources, such as social media, web analytics, or customer relationship management (CRM) software. Access to these data sources may require additional software or modules.
- Statistical analysis modules: Depending on the complexity of the analysis, it may be necessary to use additional statistical analysis modules or libraries, such as R or Python. These modules can provide additional tools for data visualization, regression analysis, and other advanced statistical techniques.
- Business intelligence tools: In some cases, it may be useful to incorporate business intelligence tools, such as dashboards or data visualization software, to help communicate the results of the analysis to stakeholders within the organization.
The specific requirements for a customer and product analysis project in Excel will depend on the scope and complexity of the analysis. However, by using a combination of Excel tools and additional libraries, modules, and data sources, businesses can gain valuable insights into customer behavior and product performance, and make data-driven decisions that improve their bottom line.
Building the Customer and Products Analysis in Excel
a. Data Collection and Preparation
Data collection and preparation is a critical step in any customer and product analysis project in Excel. This involves identifying relevant data sources, extracting the necessary data, and cleaning and transforming it to prepare it for analysis. Some key considerations for data collection and preparation include:
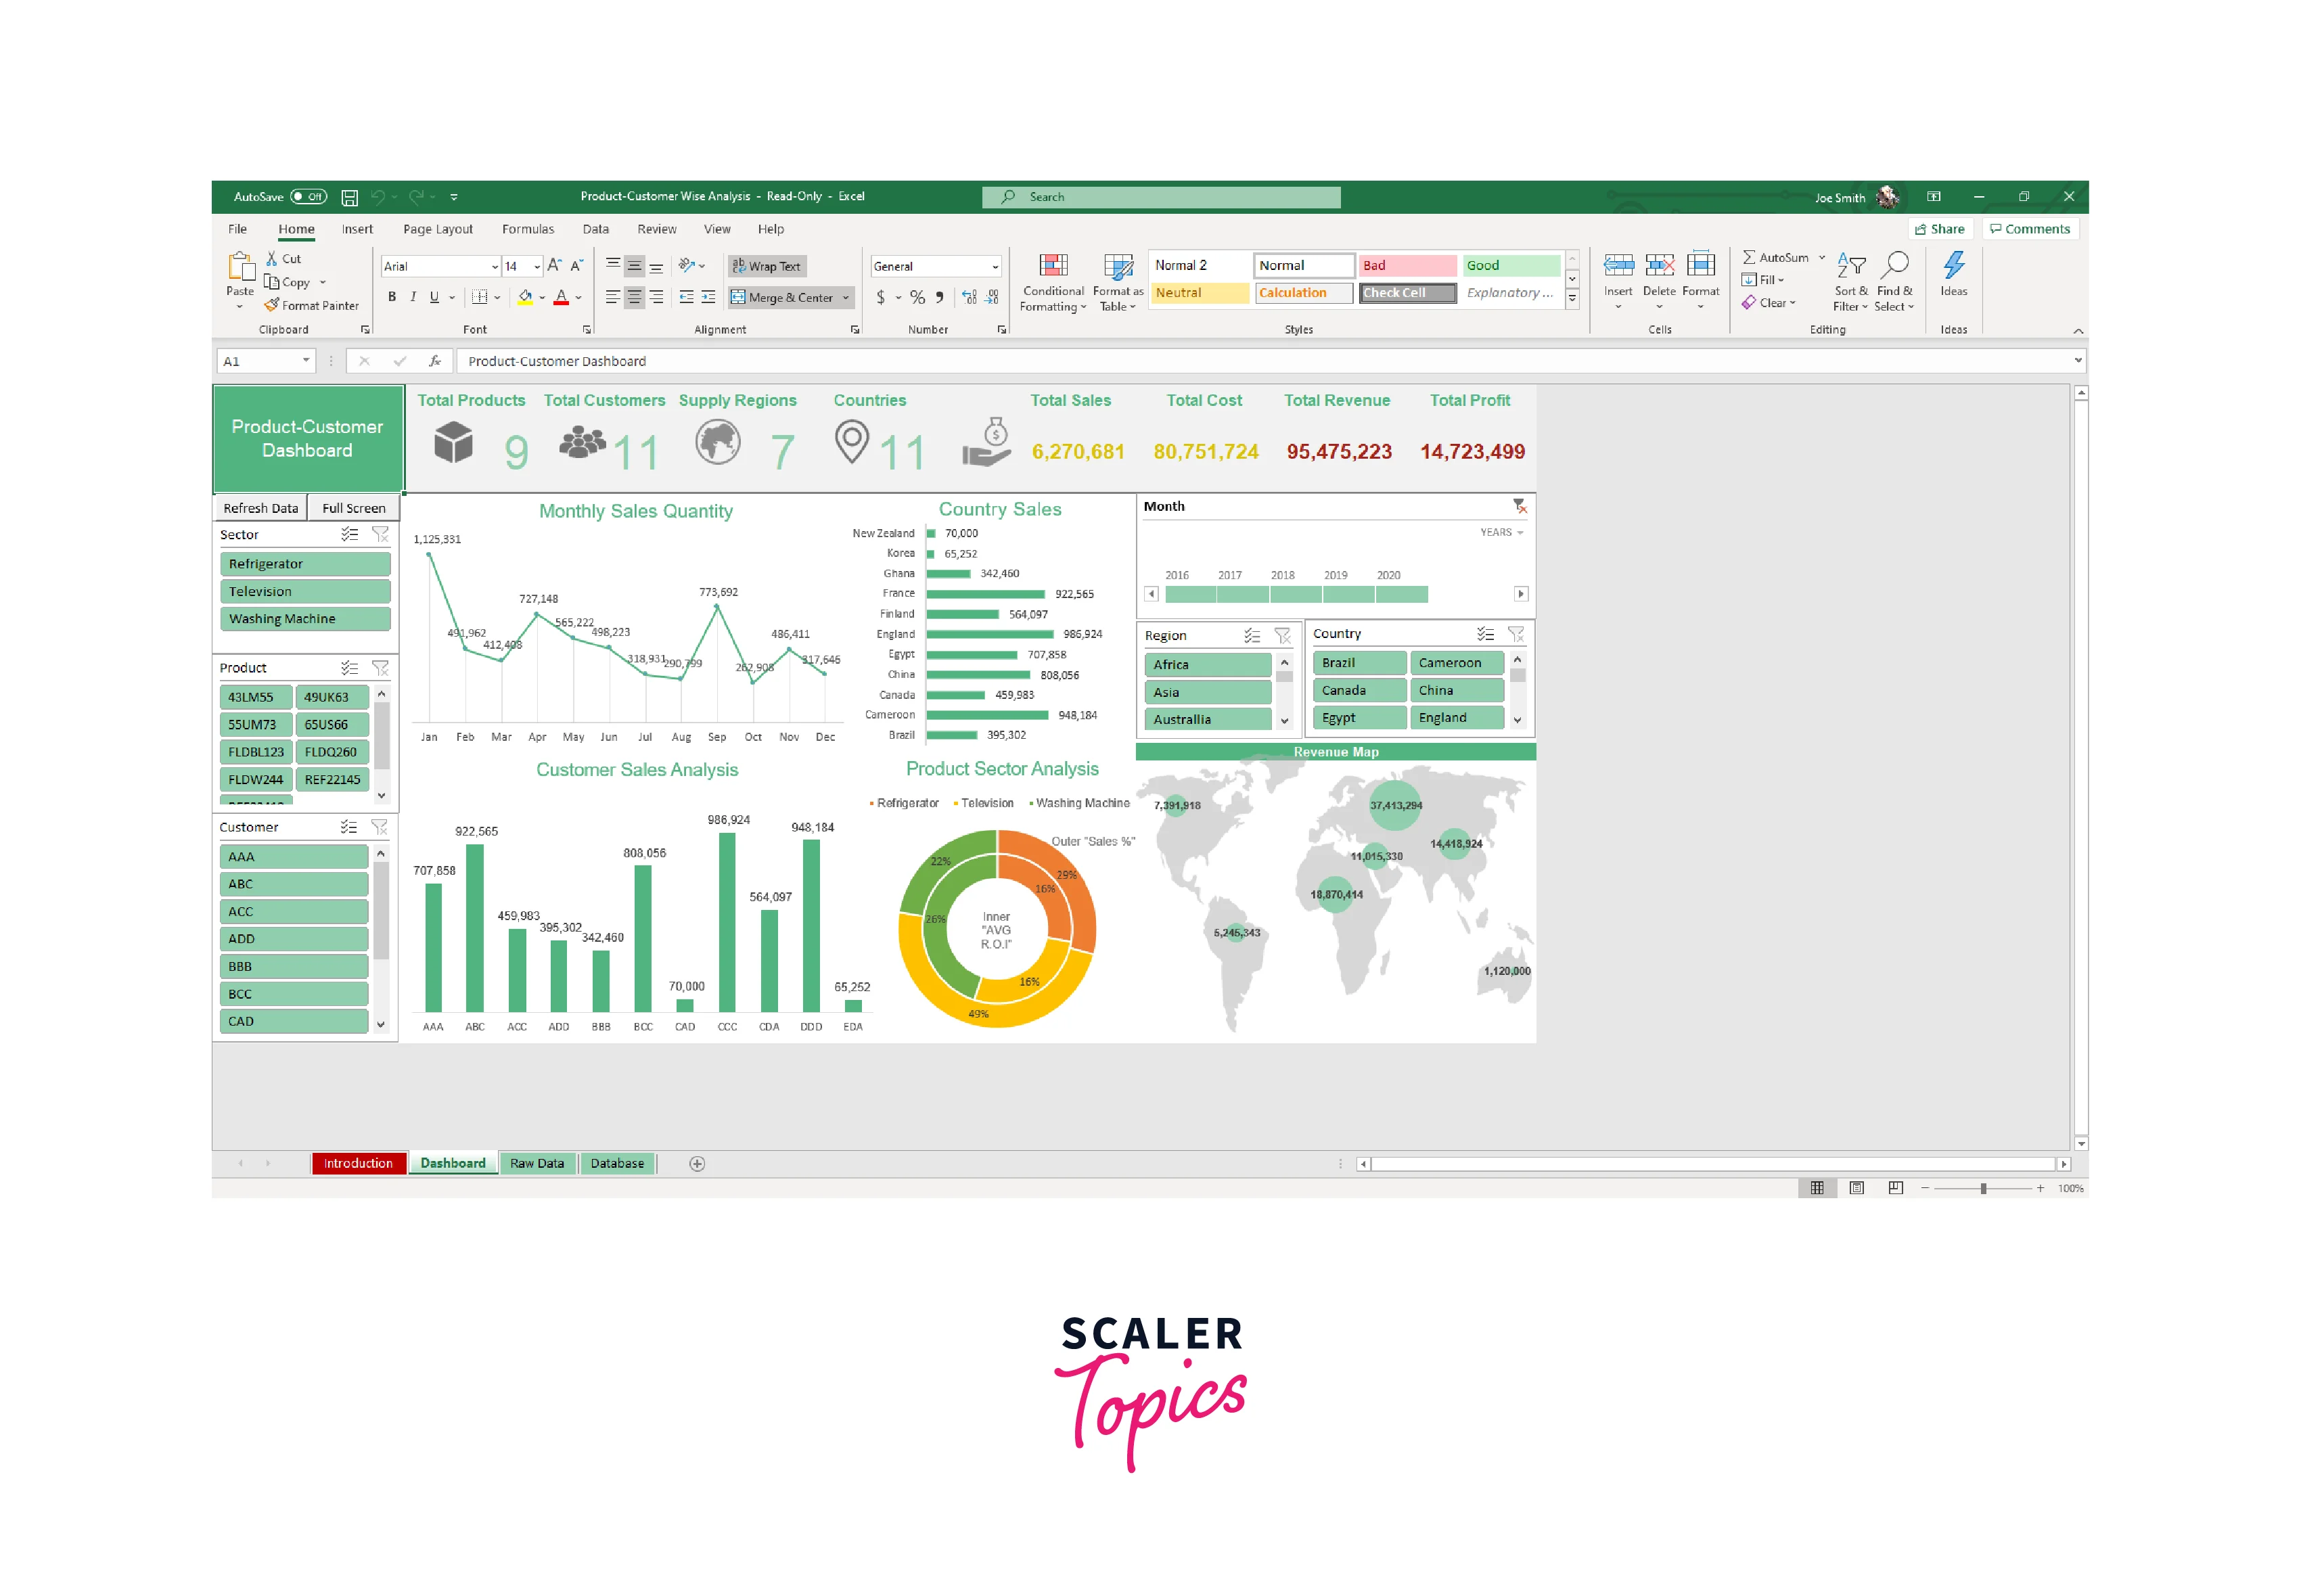
- Data sources: The data sources used for analysis will depend on the business objectives and the specific questions being addressed. Common sources of data include sales records, customer feedback, website analytics, and social media data. In this project, we are taking the example of sales records as all have you already see in the image above.
- Data extraction: Once the data sources have been identified, the next step is to extract the relevant data from each source. This may involve using Excel functions to import data from different file formats, or using APIs to extract data from external sources.
- Data cleaning: Data cleaning is a critical step in preparing the data for analysis. This may involve removing duplicates, filling in missing data, and standardizing formats across different data sources.
- Data transformation: Depending on the specific analysis being performed, it may be necessary to transform the data in various ways. This may involve creating new variables based on existing data, aggregating data across different periods or categories, or creating pivot tables to summarize data.
- Key metrics and KPIs: The analysis should focus on key metrics and KPIs that are relevant to the business objectives. For example, if the objective is to improve customer satisfaction, KPIs may include customer retention rates, net promoter scores, or average order value.
- Overall, the quality of the data collection and preparation will have a significant impact on the accuracy and usefulness of the analysis. By carefully selecting relevant data sources, cleaning and transforming the data, and focusing on key metrics and KPIs, businesses can gain valuable insights into customer behavior and product performance, and make data-driven decisions that improve their bottom line.
b. Get the Different Product Names from the Product List
To get the different product names from the product list in customer and product analysis in Excel, you can follow these steps:
- Open the sales record in Excel and select the column that contains the product names. This column may be labeled as "Product Name" or something similar.
- With the column selected, go to the "Data" tab in the Excel ribbon and click on the "Remove Duplicates" button. This will bring up a dialog box that allows you to select which columns to check for duplicates.
- In the dialog box, make sure that only the column with the product names is selected, and click the "OK" button. Excel will remove any duplicate product names from the list and leave you with a list of unique product names.
- If you want to create a separate table that lists all of the unique product names along with other information, such as the number of units sold or the total revenue generated, you can use the "PivotTable" function in Excel.
- To create a PivotTable, select the entire sales record, including the column with the product names, and go to the "Insert" tab in the Excel ribbon. Click on the "PivotTable" button and select where you want the PivotTable to be located.
- In the PivotTable Fields panel on the right-hand side of the screen, drag the "Product Name" field to the "Rows" section and any other relevant fields, such as "Units Sold" or "Revenue," to the "Values" section. Excel will automatically group the data by product name and calculate the relevant metrics.
c. Find Out Unit Price in Sales Report
To find out the unit price in a sales report in customer and product analysis in Excel, you can follow these steps:
- Open the sales record in Excel and locate the columns that contain the information you need. Typically, this will include columns for "Product Name," "Quantity Sold," "Total Sales," and possibly "Discount" or "Tax."
- If the sales record does not already include a column for unit price, you can create one by dividing the total sales for each transaction by the quantity sold. For example, if a customer bought three items for a total of 50 ($150 / 3).
- To create the unit price column, insert a new column to the right of the "Total Sales" column. Label this column "Unit Price."
- In the first cell of the unit price column, enter the formula to calculate the unit price for the first transaction. For example, if the first transaction is in row 2, and the total sales and quantity sold are in columns C and D, respectively, the formula would be "=C2/D2".
d. Calculate Total Sales of the Day
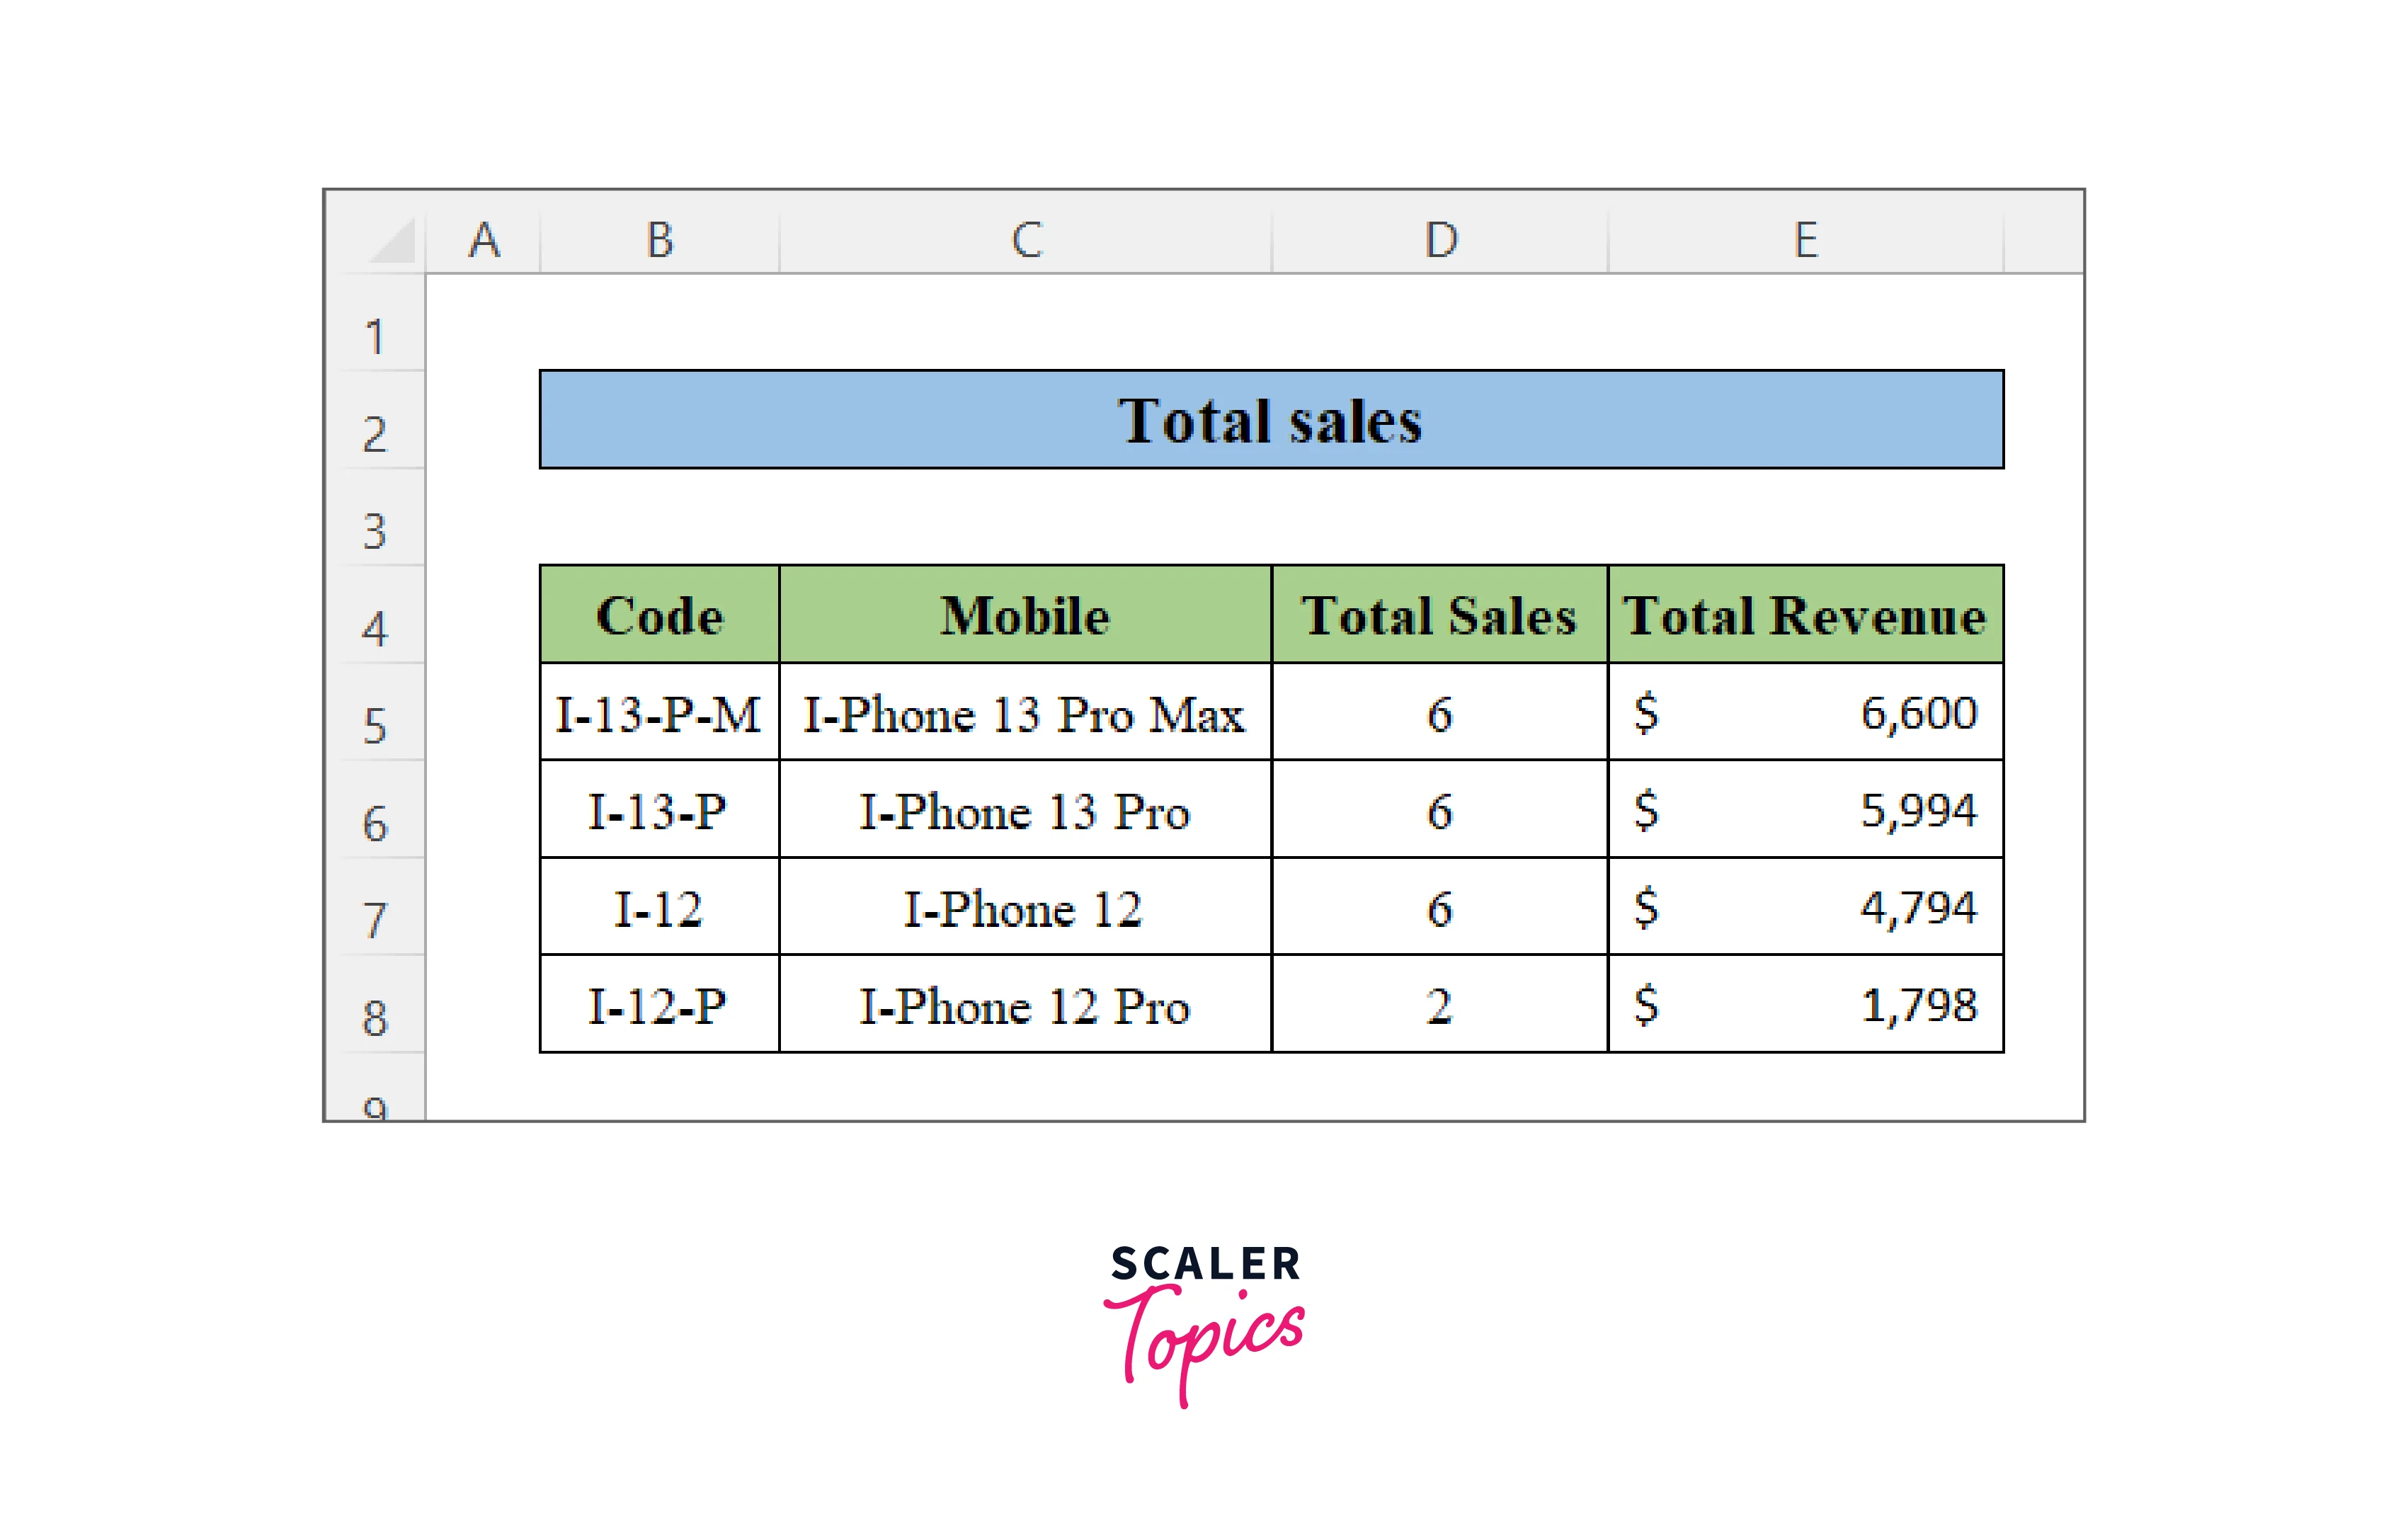
To calculate the total sales of the day in customer and product analysis using the sales record of an electronic shop, you can follow these steps in Excel:
- Open a new worksheet in Excel.
- Enter the sales record in a table with columns for the date, customer name, product name, quantity sold, and total sales amount.
- Use the "SUM" function to calculate the total sales for the day. To do this, select a cell where you want to display the total sales, then enter the formula "=SUM" followed by the range of cells that contain the sales amounts for the day. For example, if the sales amounts are in cells B2
, you would enter "=SUM(B2 )". - Use the "SUMIF" function to calculate the total sales for a specific customer or product. To do this, select a cell where you want to display the total sales, then enter the formula "=SUMIF" followed by the range of cells that contain the customer or product names, the name of the customer or product you want to calculate the sales for, and the range of cells that contain the sales amounts for the day. For example, if the customer names are in cells C2:C10, the sales amounts are in cells E2:E10, and you want to calculate the sales for customer "John", you would enter =SUMIF(C2:C10,"John",E2:E10).
- Use the "SUMIFS" function to calculate the total sales for a specific customer and product. To do this, select a cell where you want to display the total sales, then enter the formula "=SUMIFS" followed by the range.
e. Calculate Monthly Sales of a Single Product in Excel
To calculate the monthly sales of a single product in Excel from a sales record of an electronics shop, you will need to follow these steps:
- Open Microsoft Excel and create a new workbook.
- Import the sales record data into Excel by clicking on the "Data" tab, selecting "From Text/CSV", and navigating to the file location.
- Clean the data by removing any unnecessary columns or rows, and ensure that the data is properly formatted.
- Create a pivot table by selecting the "Insert" tab and clicking on "Pivot Table".
- In the "PivotTable Fields" panel, drag the "Product" column to the "Rows" section and the "Sales" column to the "Values" section.
- Group the data by month by right-clicking on the row labels and selecting "Group". Choose "Months" and click "OK".
- Filter the pivot table to show data for the desired product by selecting the drop-down arrow next to "Product" and selecting the desired product.
- The resulting pivot table will display the total sales for the selected product, grouped by month.
f. Get the Total Quantity of Products Sold
To get the total quantity of products sold in Excel you can follow these steps:
- Open the sales record in Excel.
- Select the entire dataset, including headers.
- Click on the "Insert" tab and select "PivotTable".
- In the "Create PivotTable" dialog box, make sure the correct range is selected and choose where you want the PivotTable to be located.
- Click "OK".
- In the "PivotTable Fields" pane, drag the "Quantity" field to the "Values" area.
- Make sure the "Quantity" field is set to "Sum" instead of "Count".
- Remove any other fields that are not relevant to this analysis.
- The resulting PivotTable should show the total quantity of products sold.
g. Calculate Total Sales to Complete the Sales Report
To calculate the total sales you can use Excel to create a pivot table and perform data analysis. Here are the steps to complete the sales report of customer and products analysis:
- Open the sales record in Excel and select the entire table.
- Go to the "Insert" tab and click on "PivotTable".
- In the "Create PivotTable" dialog box, select the range of data you want to analyze and choose whether to create a new worksheet or use an existing one.
- Drag the "Customer Name" field to the "Rows" area and the "Product Name" field to the "Columns" area.
- Drag the "Sales Amount" field to the "Values" area.
- The pivot table will display the total sales for each customer and product. You can further analyze the data by adding filters, sorting the data, or creating calculated fields.
- To calculate the overall total sales, simply select the entire "Sales Amount" column and use the "AutoSum" function to add up the values.
h. Analysis Visualization
When managing sales records for an electronics shop, it's important to be able to analyze the data to understand which products are selling well, which customers are making purchases, and how much revenue is being generated. One effective tool for performing this analysis is Excel, which allows you to create a pivot table to calculate the total sales for a sales record.
To get started, open the sales record in Excel and select the entire table. Then, go to the "Insert" tab and click on "PivotTable." In the "Create PivotTable" dialog box, select the range of data you want to analyze and choose whether to create a new worksheet or use an existing one.
Next, drag the "Customer Name" field to the "Rows" area and the "Product Name" field to the "Columns" area. This will create a table that shows the total sales for each customer and product. To see the total sales for each combination of customer and product, drag the "Sales Amount" field to the "Values" area.
Once the pivot table is created, you can further analyze the data by adding filters, sorting the data, or creating calculated fields. For example, you can filter the data to only show sales records for a specific period or customer segment, or you can sort the data to see which products are selling the most.
More Customer and Products Analysis Templates
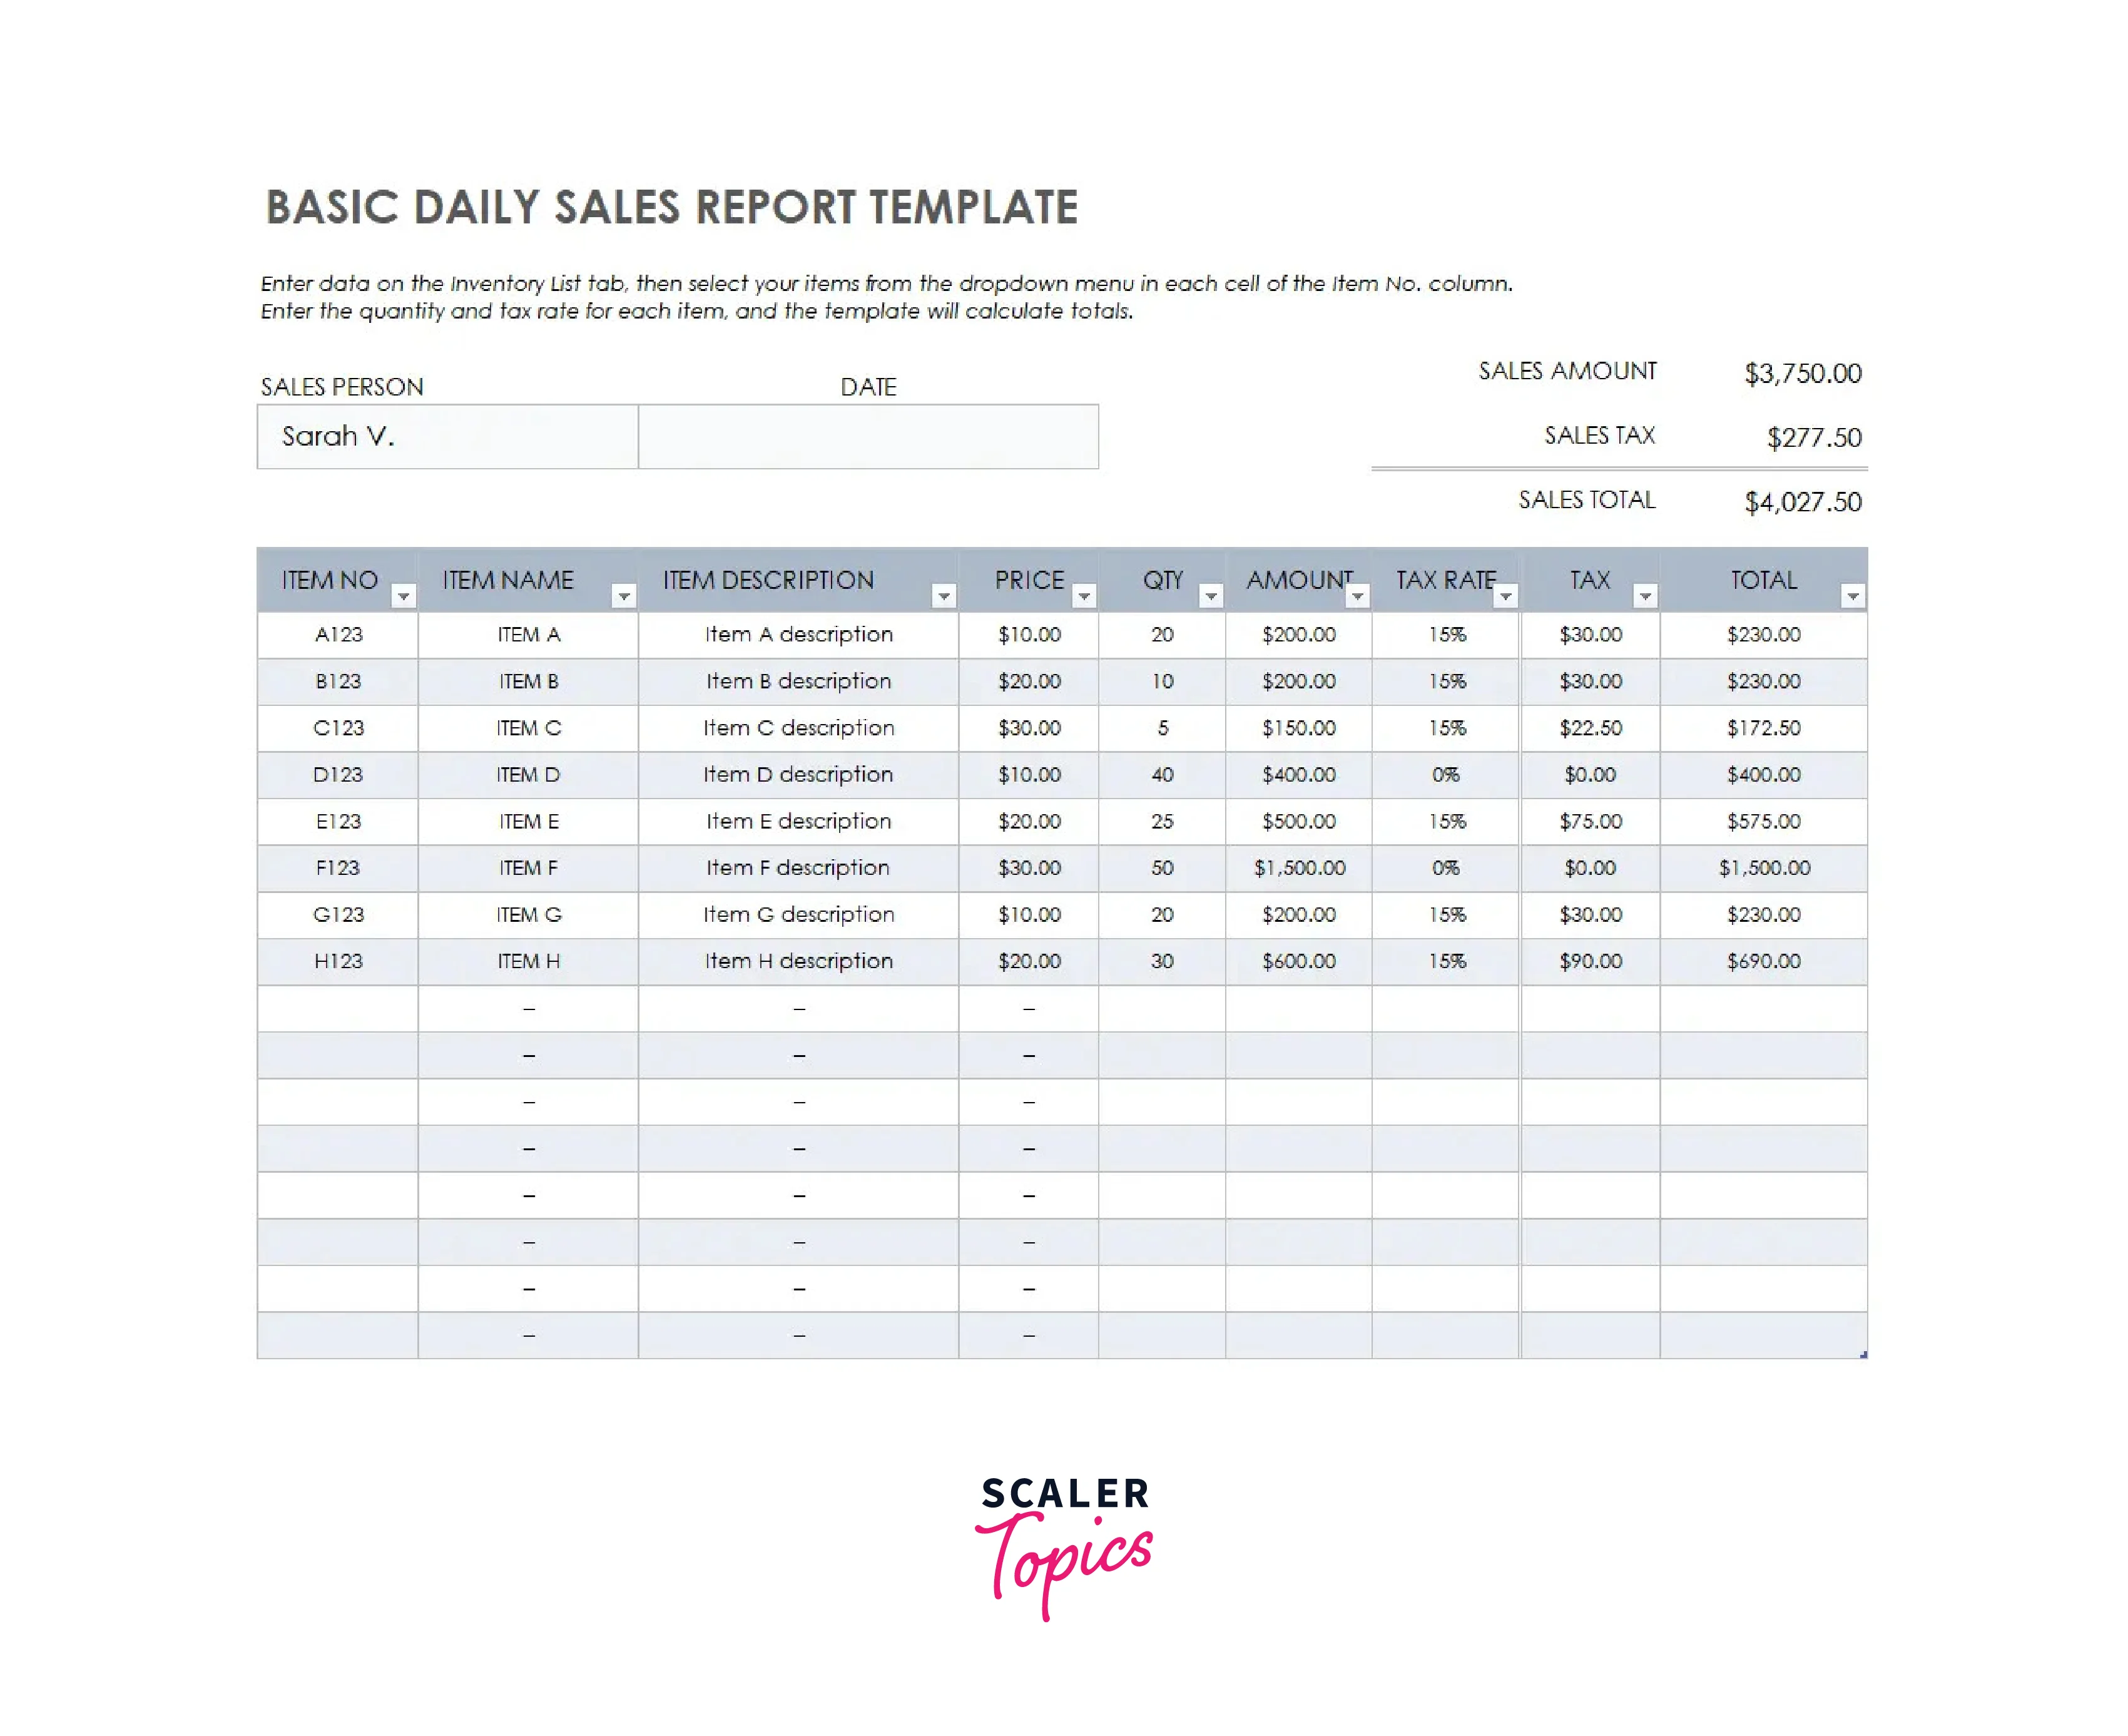
Basic Daily Sales Report Template for Excel
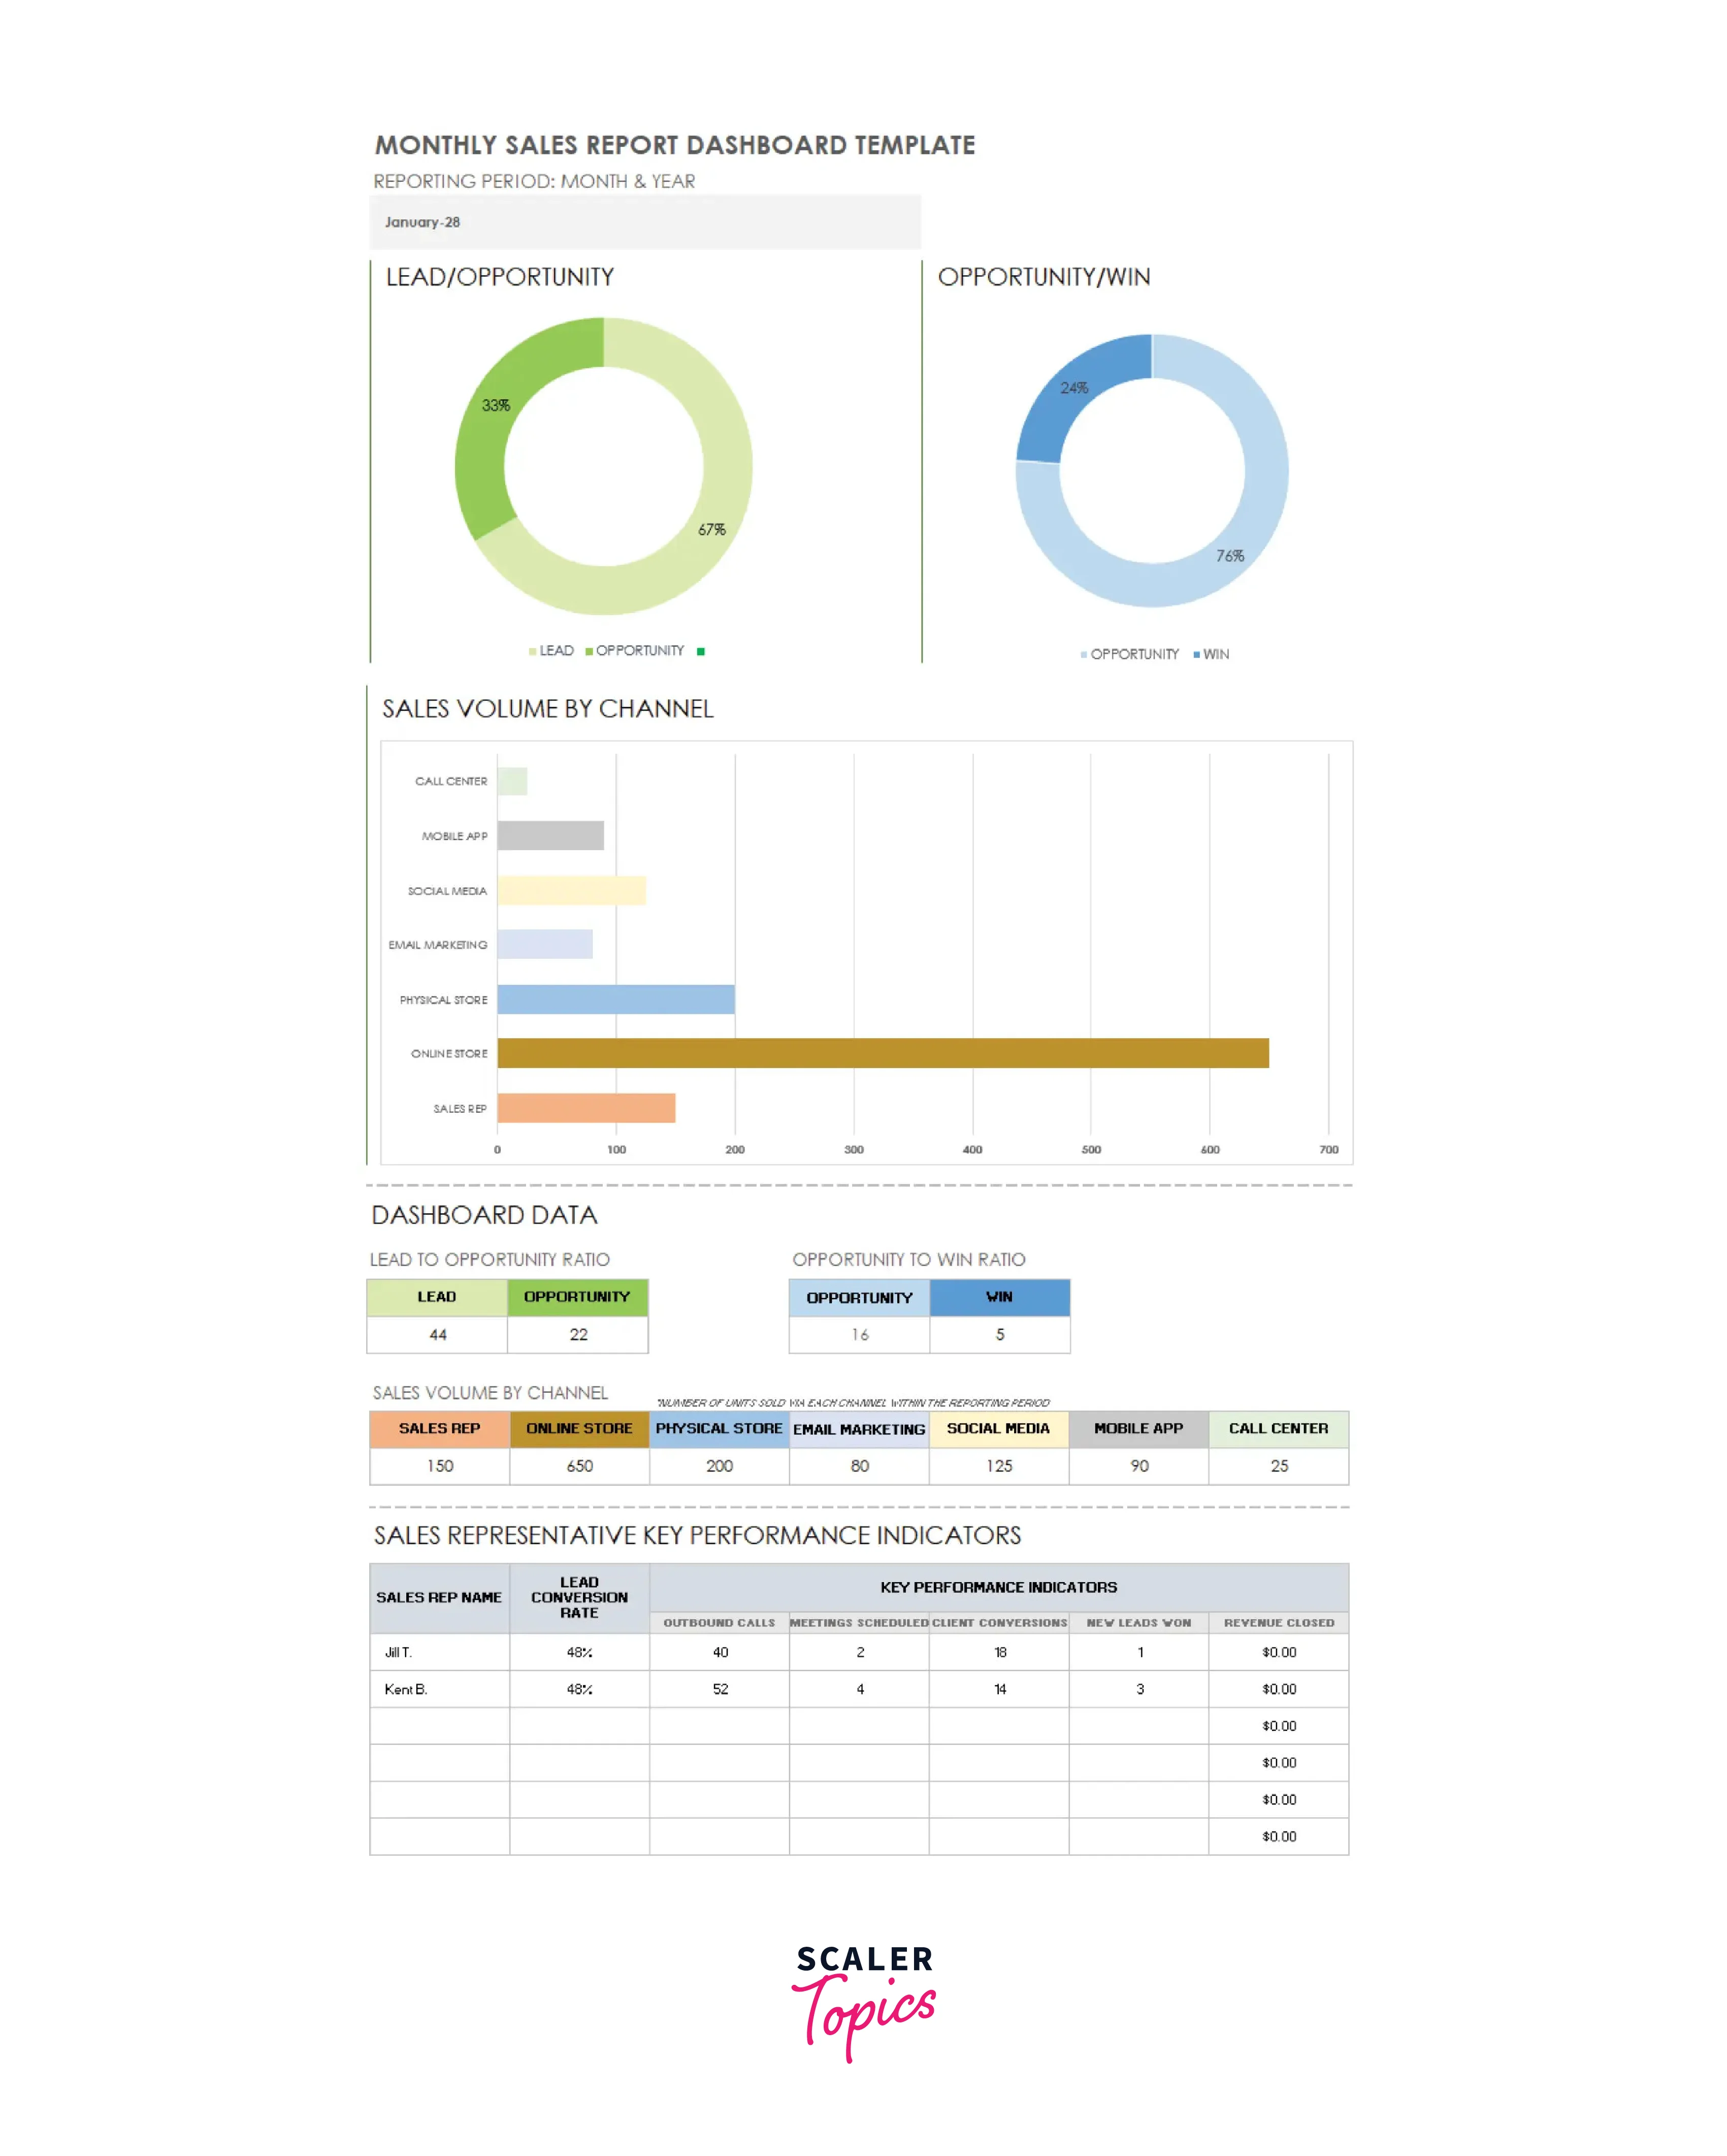
Monthly Sales Report Dashboard Template for Excel
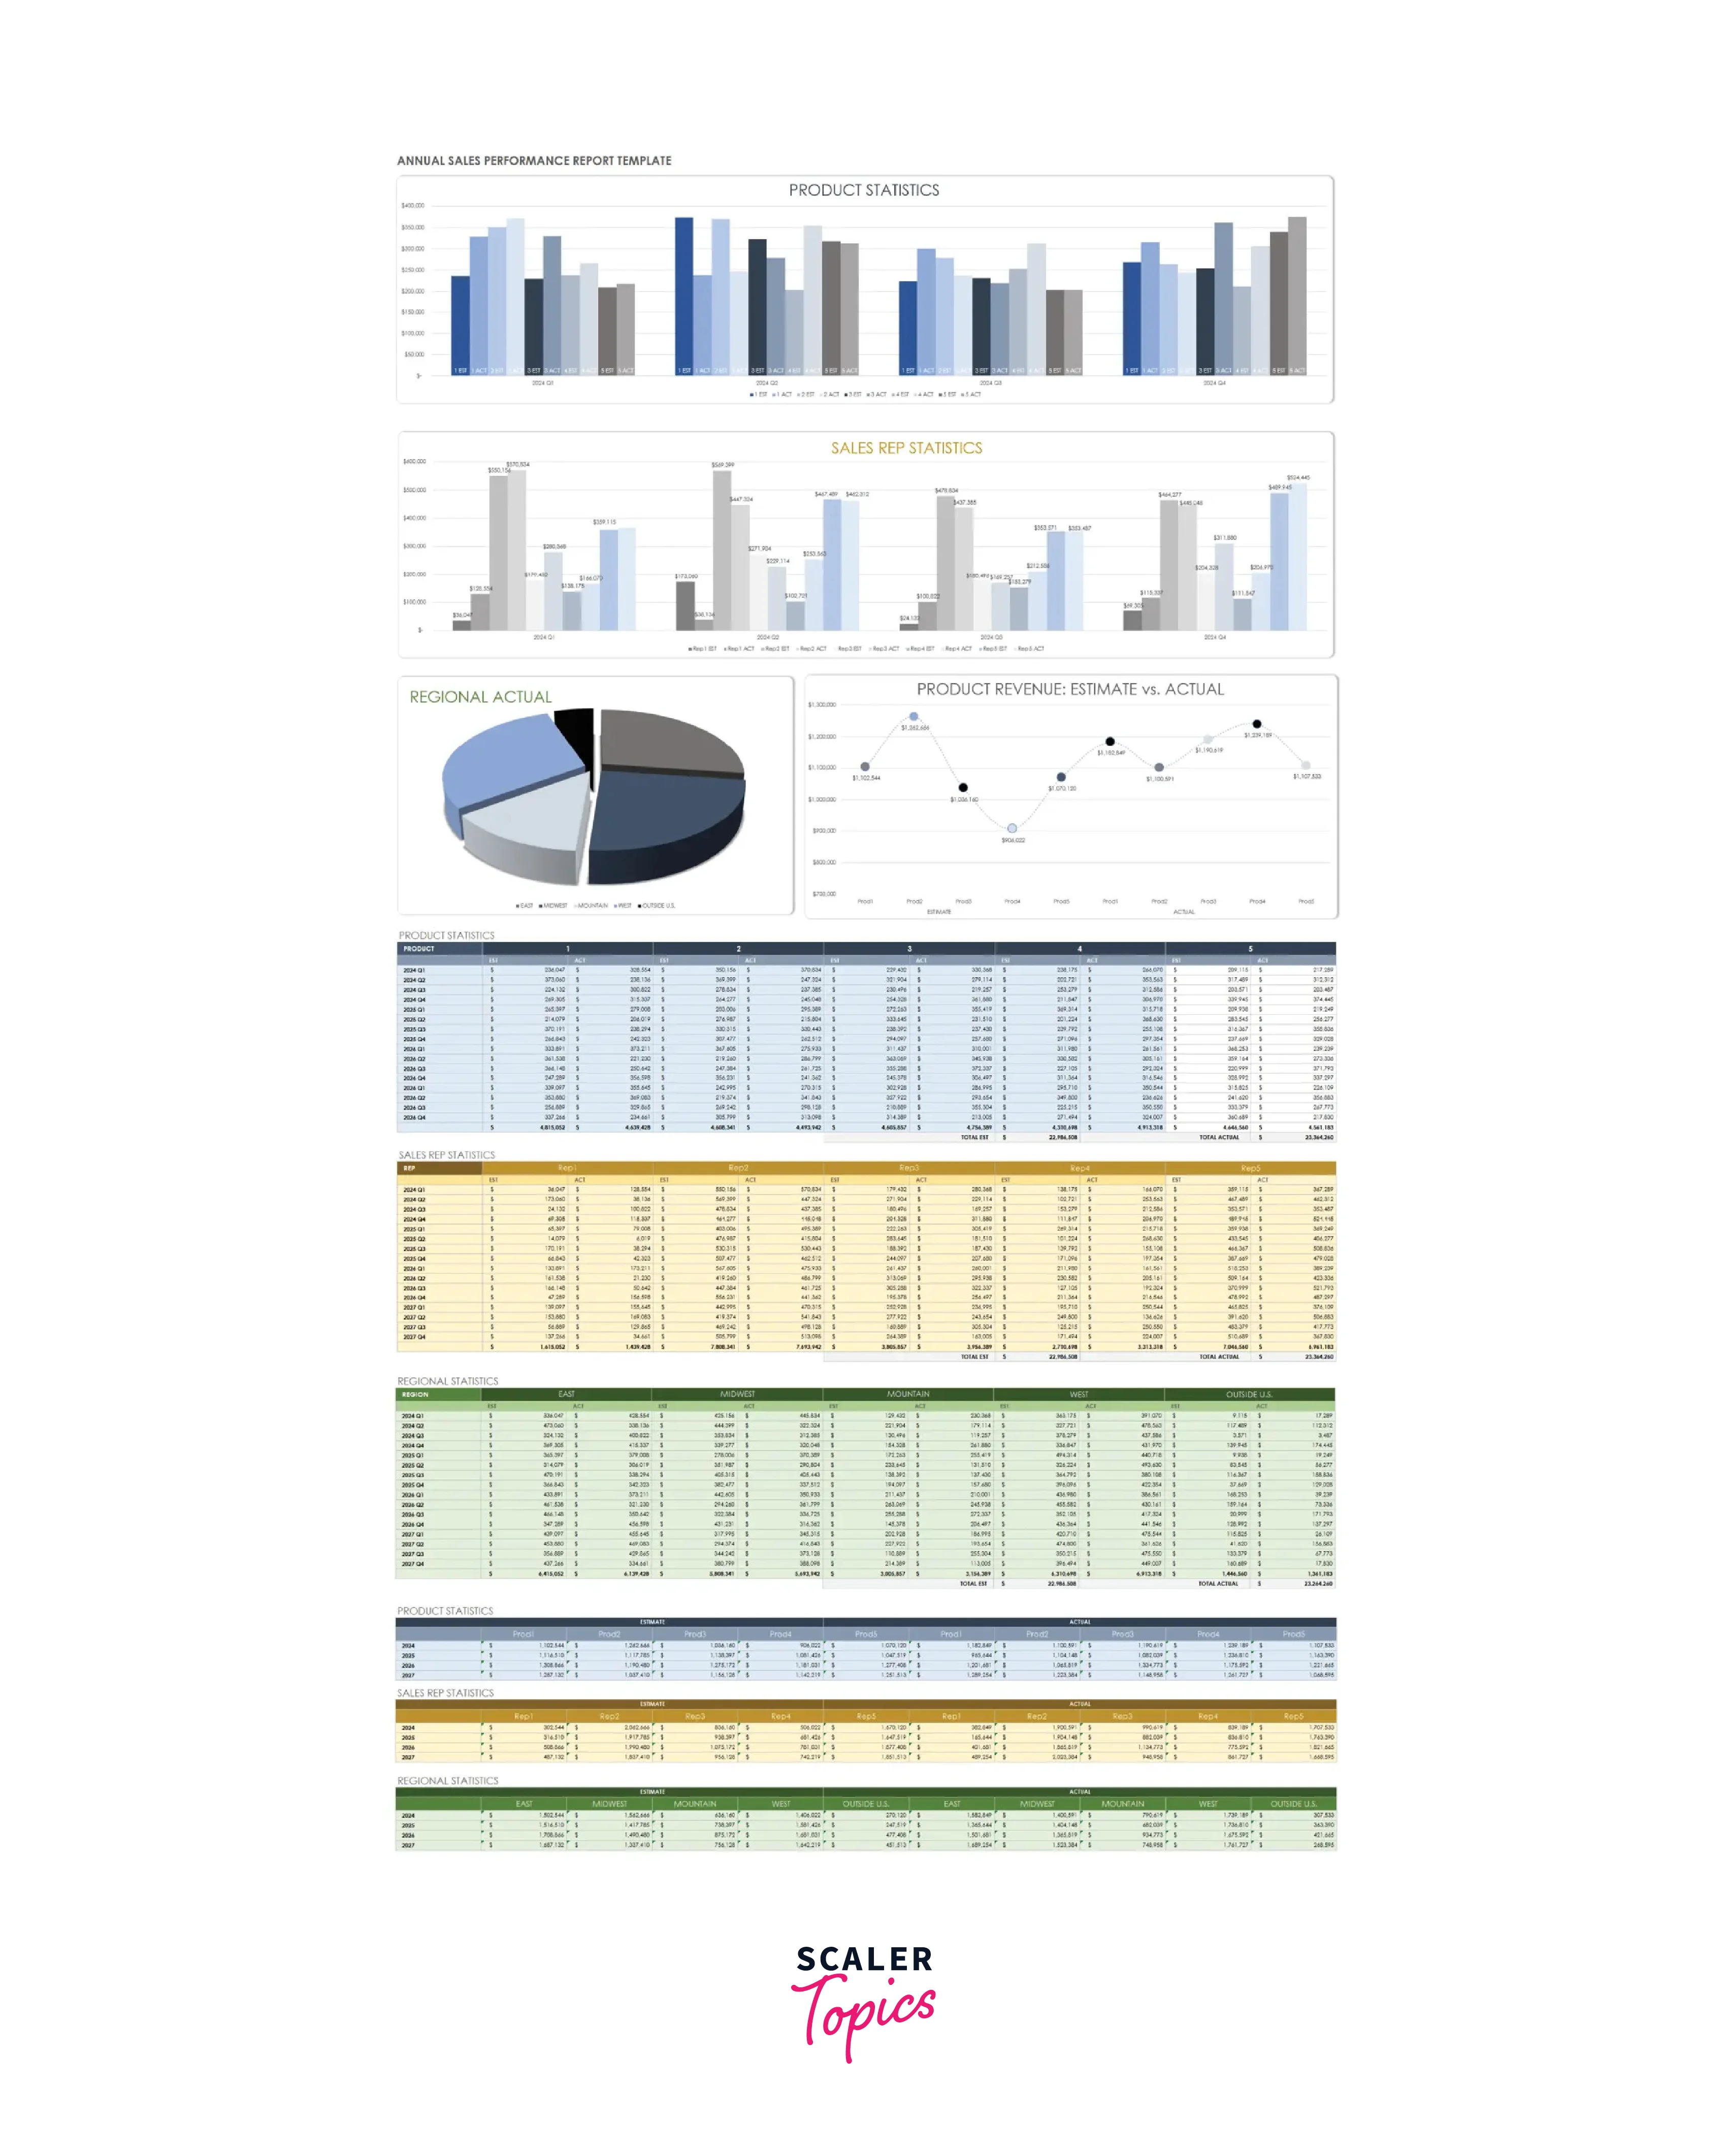
Annual Sales Performance Report Template for Excel
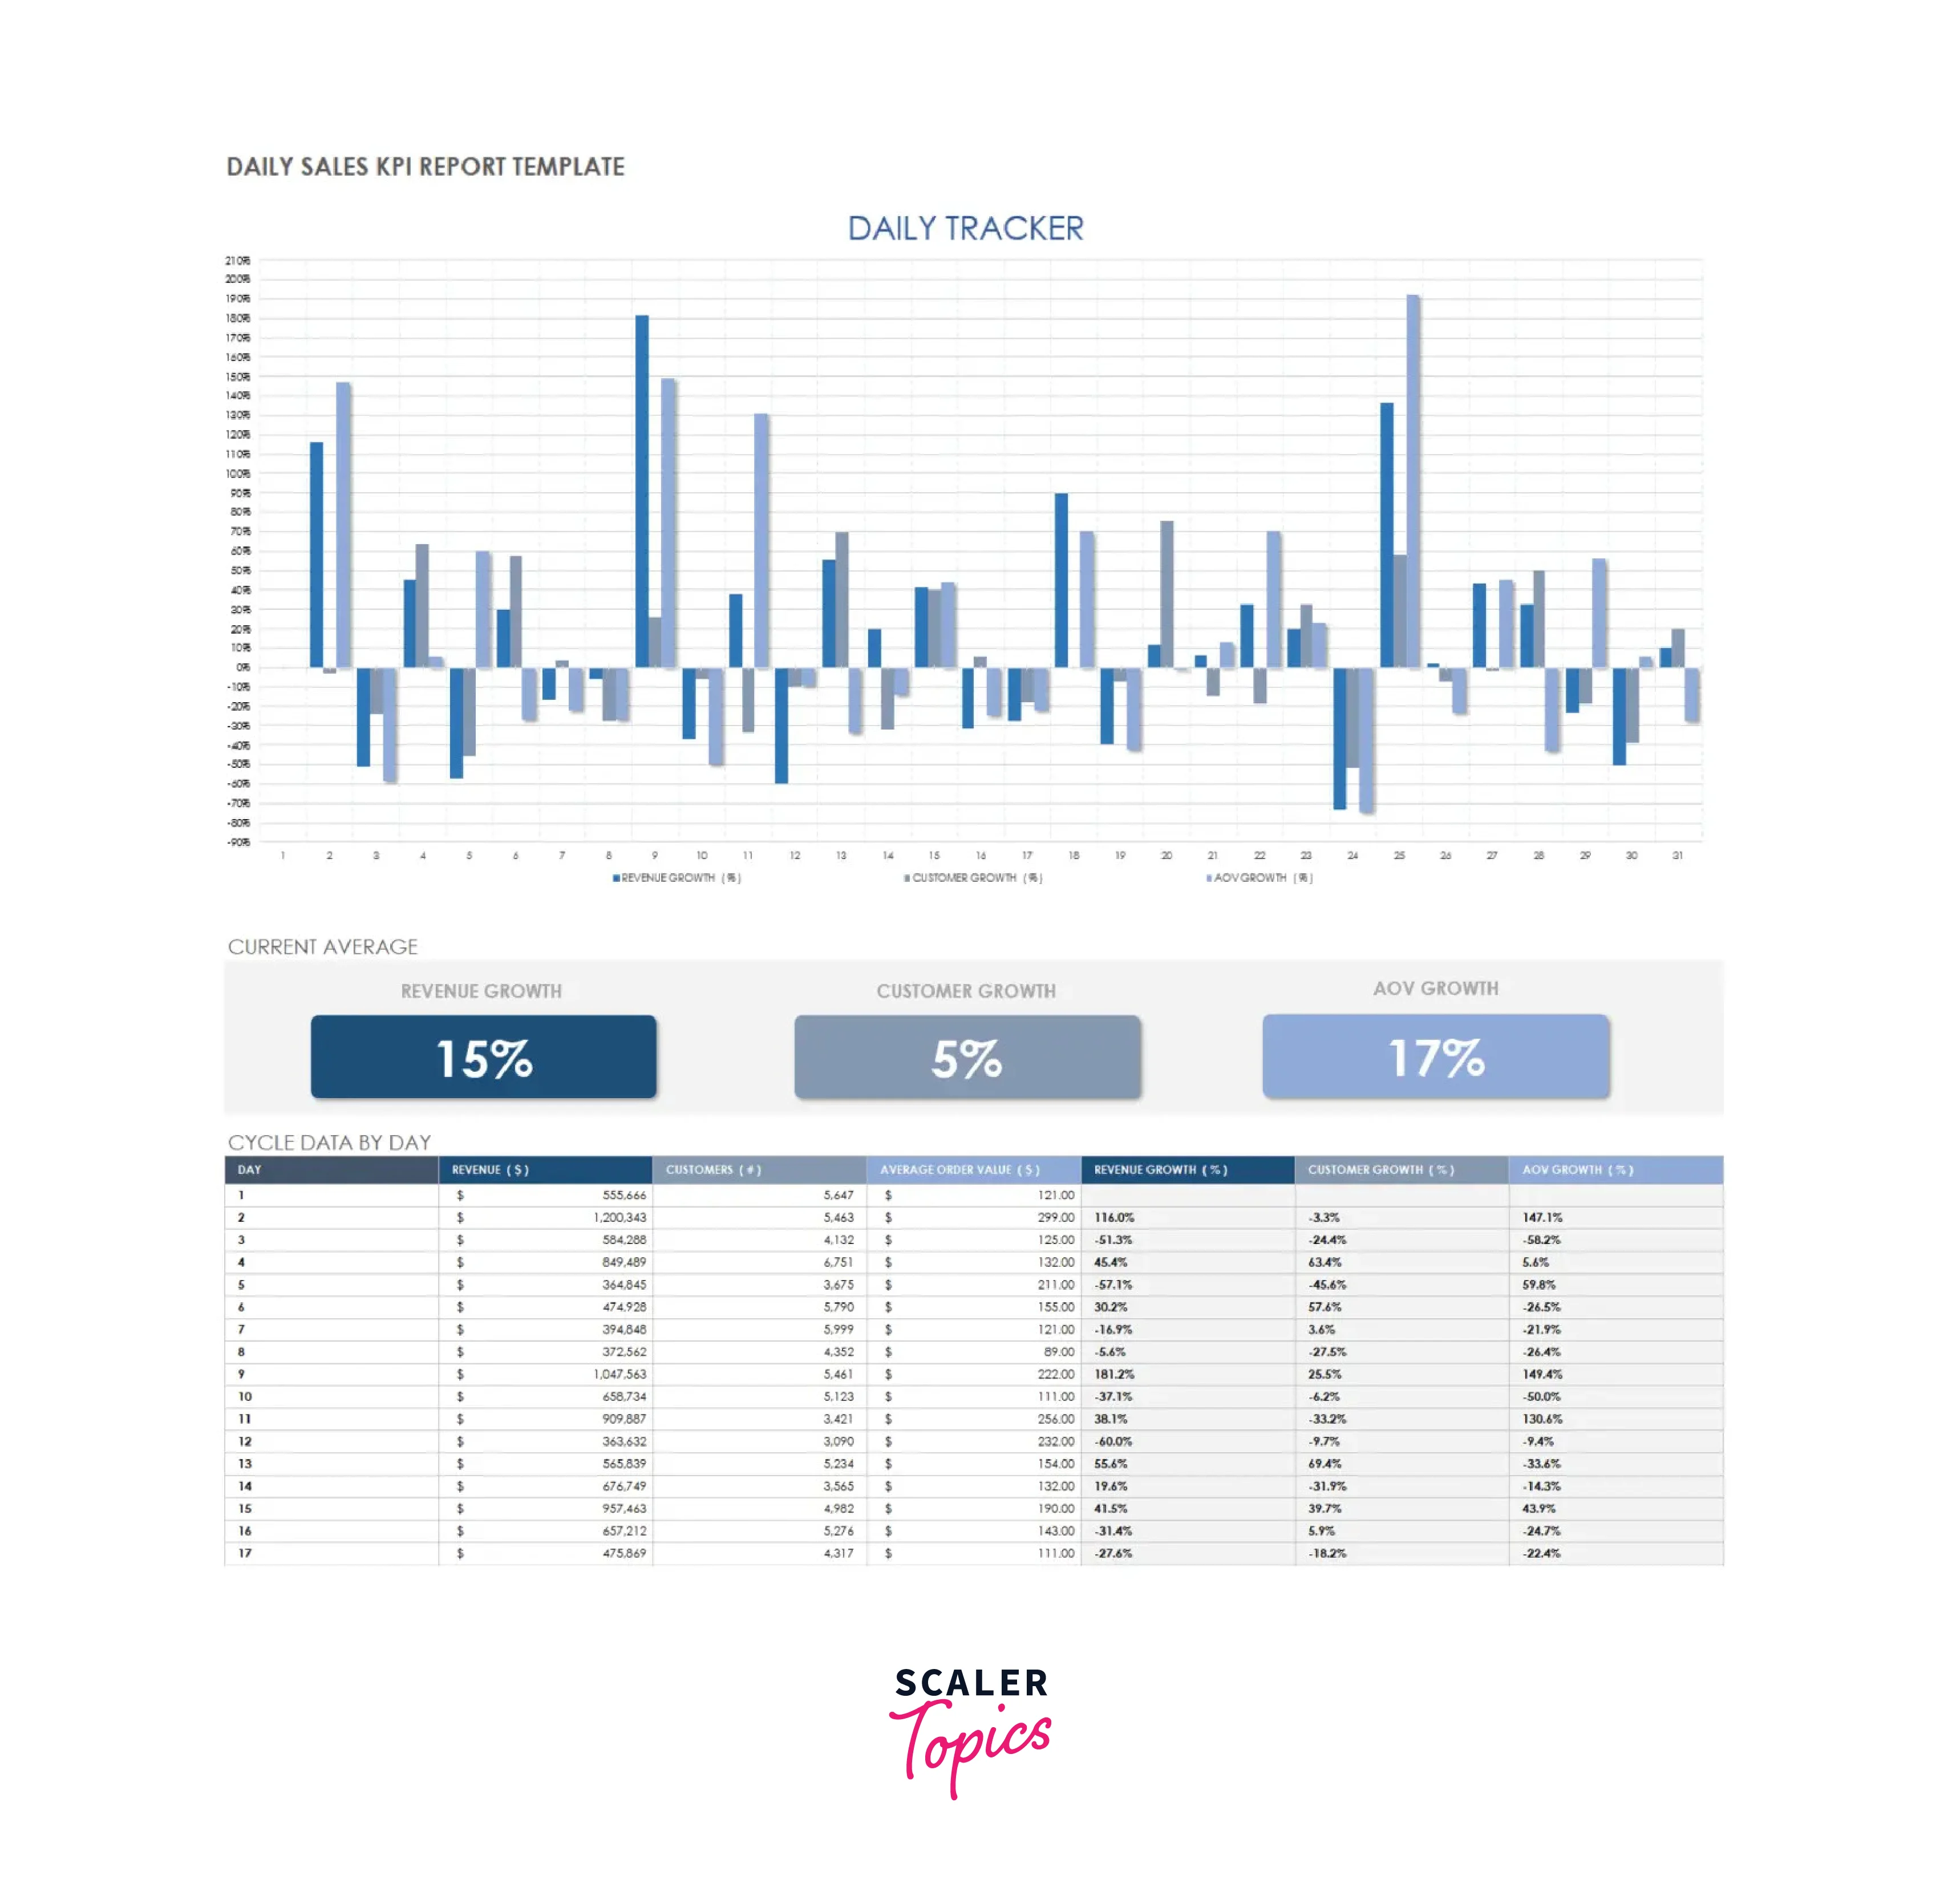
Daily Sales KPI Report Template for Excel
Conclusion
- Through this project, we were able to gain valuable insights into customer and product data using Excel.
- We analyzed customer behavior by examining purchase history, frequency, and amount spent.
- We also analyzed product performance by looking at sales volume, revenue, and profitability.
- By combining customer and product data, we were able to identify trends and patterns that can inform future business decisions.
- For example, we found that certain products were popular among specific customer groups, which could inform targeted marketing efforts.
- We also identified high-value customers who could be targeted for loyalty programs or personalized promotions.
- Overall, this project demonstrates the power of data analysis in making informed business decisions and improving performance. By continuing to analyze and leverage customer and product data, businesses can stay ahead of the competition and meet customer needs effectively.
