R Programming for Data Science
Overview
R, a versatile programming language and environment, has firmly established itself as a powerhouse in the realm of data science. With its extensive libraries, statistical tools, and data manipulation capabilities, R has become the go-to choice for professionals and enthusiasts engaged in data science projects. In this article, we delve into the intricacies of utilizing R for data science endeavors, exploring its features, libraries, and applications that make it a force to be reckoned with.
What is Data Science in R Programming?
Data science in the context of R programming involves the art of extracting insights and knowledge from data, typically through various processes such as data cleaning, data analysis, data visualization, and predictive modeling. R empowers data scientists to transform raw data into meaningful information, aiding in informed decision-making across various domains.
R programming for data science serves as the bridge between raw data and actionable insights. The inherent capabilities of R to handle intricate data structures, conduct rigorous statistical analyses, and create captivating visualizations make it an indispensable tool in the data scientist's toolbox. As the demand for data-driven decision-making intensifies across various industries, the significance of R for data science becomes increasingly evident.
Why R is Used for Data Science?
When it comes to data science, the choice of programming language can significantly impact your efficiency and effectiveness. R programming has carved a niche for itself in this field, offering a range of features and advantages that make it a strong contender. Let's explore why R programming for data science stands out and compare it to Python programming, a popular alternative.
Difference between R and Python Programming
| Aspect | R Programming for Data Science | Python Programming for Data Science |
|---|---|---|
| Statistical Emphasis | Specialized for statistics and analysis | General-purpose programming language |
| Data Manipulation | Integrated data manipulation functions | Requires additional libraries/modules |
| Visualization | Rich and customizable plotting libraries | Visualization libraries available |
| Community and Packages | Flourishing community with data-specific packages | General programming community |
| Learning Curve | Relatively steeper learning curve due to specialized syntax | More accessible syntax for beginners |
| Data Science Libraries | Extensive range of data-focused packages (dplyr, ggplot2, etc.) | Data science libraries available (Pandas, NumPy, etc.) |
| Statistical Modeling | Strong emphasis on statistical modeling and analysis | Robust support for statistical tasks |
| Data Reporting | Integrated reporting through R Markdown | Reporting tools available |
How is R Used in Data Science?
R finds its application across the entire data science workflow:
1. Load and Display Data
R excels in importing and cleaning diverse datasets, ensuring data is in optimal condition for analysis. Here's a code snippet that demonstrates data collection and preparation, including importing and cleaning a dataset using R:
2. Data Transformation
Here's an example of using tidyr for data transformation, where we gather columns into rows using the gather() function:
3. Data Analysis and Modeling
R's statistical libraries empower analysts to perform complex analyses. Consider a scenario where a linear regression analysis is conducted to predict house prices based on their area and number of bedrooms:
Output:
In this example, the lm() function performs a linear regression analysis.

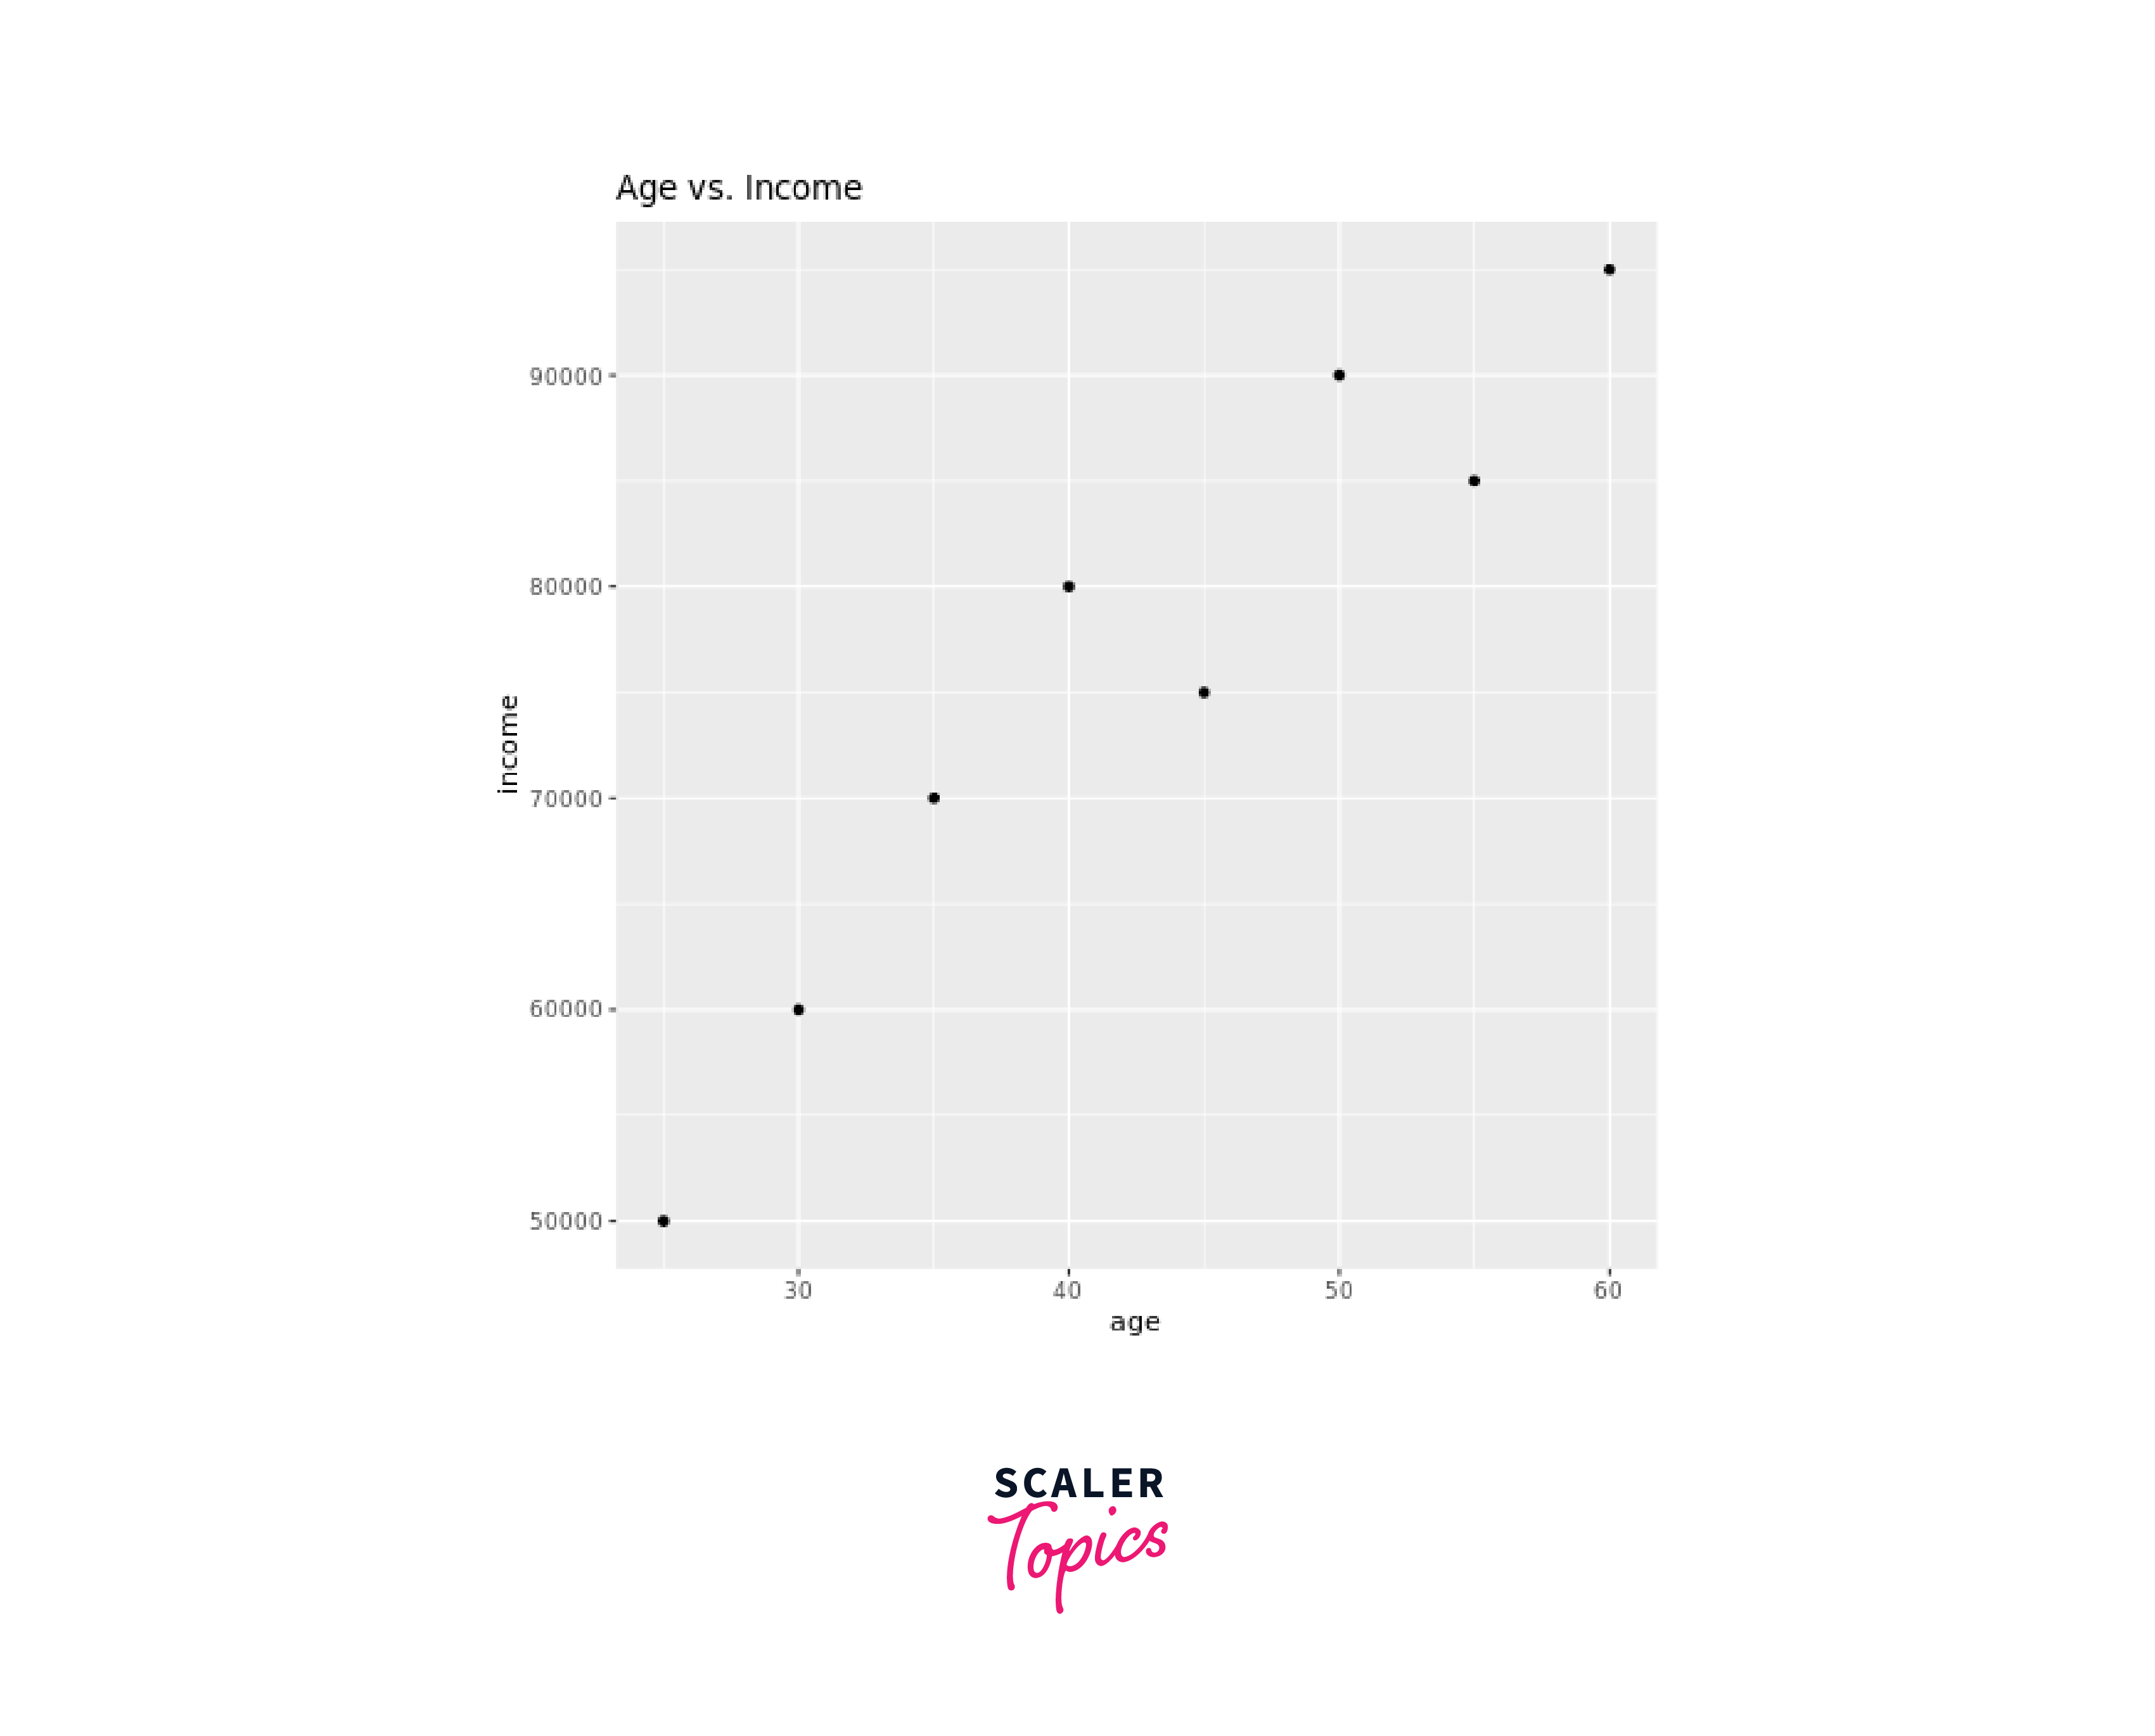
4. Data Visualization
The ggplot2 package revolutionizes data visualization. Here's an example of creating a scatter plot:
Output:
Features of R - Data Science
In the world of data science with R, the R programming language emerges as a powerhouse equipped with features that fuel effective data analysis. Let's delve into the top attributes that make R for data science an indispensable tool:
- Statistical Precision: R's specialized statistical functions and libraries cater directly to data analysis, making it a natural choice for professionals who demand accuracy in their insights.
- Data Manipulation Ease: With packages like dplyr, R simplifies complex data manipulation tasks, enabling users to clean, transform, and shape data swiftly.
- Detailed Visualization: The ggplot2 package transforms data into stunning visualizations, allowing users to tell compelling stories and convey complex findings with ease.
- Dynamic Reporting: R Markdown seamlessly blends code, analysis, and narrative, facilitating the creation of interactive reports that engage stakeholders and communicate insights succinctly.
- Community-driven Innovation: R's open-source ecosystem ensures a continuous influx of specialized packages, driven by a vibrant community, that caters specifically to diverse data science needs.
Important R Libraries for Data Science
Let's explore the top R libraries that empower professionals to unravel insights from complex data:
- ggplot2: This powerhouse library revolutionizes visualization, allowing users to create captivating and informative plots, making data exploration and communication seamless.
- dplyr: Simplifying data manipulation, dplyr streamlines filtering, summarizing, and transforming data, elevating the efficiency and quality of analysis.
- caret: Catering to machine learning needs, caret offers tools for building predictive models, automating workflows, and assessing model performance.
- tidyr: With tidyr, data transformation and tidying become intuitive tasks, ensuring data is structured for analysis and visualization.
- stringr: Addressing text analysis, stringr simplifies string manipulation tasks, essential for sentiment analysis and natural language processing.
Applications of R for Data Science
The influence of data science with R extends across diverse sectors, revolutionizing how insights are extracted and decisions are made. Let's explore the prominent applications where R programming plays a pivotal role:
- Finance: R's statistical precision and modeling capabilities drive risk assessment, algorithmic trading, fraud detection, and portfolio optimization in the finance sector.
- Healthcare: From disease outbreak modeling to patient outcome prediction, R empowers medical professionals to make informed decisions and enhance patient care.
- E-commerce: R aids in customer behavior analysis, personalized marketing, demand forecasting, and recommendation systems, elevating the e-commerce experience.

- Social Sciences: R supports sentiment analysis, opinion mining, and demographic studies, allowing researchers to gain insights into human behavior and preferences.
- Environmental Science: R contributes to climate data analysis, ecological modeling, and biodiversity studies, aiding in understanding and addressing environmental challenges.
- Marketing: R enables marketers to analyze consumer trends, segment audiences, and optimize marketing campaigns for maximum impact and engagement.
Important Data Science Projects on R
Let's explore some impactful data science projects undertaken using R programming:
- Titanic Survival Prediction: Leveraging machine learning algorithms to predict survival probabilities of passengers aboard the Titanic, offering insights into factors influencing survival rates.
- Iris Flower Classification: Employing statistical methods to classify iris flowers based on petal and sepal attributes, demonstrating the power of R in species identification.
- Customer Segmentation: Utilizing clustering techniques to group customers with similar behaviors, aiding businesses in targeted marketing and personalized experiences.
- Stock Price Forecasting: Building time series models to predict stock price movements, enabling investors to make informed decisions based on historical data patterns.
- Movie Recommender System: Creating collaborative filtering models to suggest movies based on user preferences, enhancing user engagement and satisfaction on streaming platforms.
- Credit Scoring: Developing predictive models to assess credit risk, assisting financial institutions in making informed lending decisions and managing risk exposure.
Conclusion
- R's specialized focus on statistics and data manipulation makes it a powerful ally for data science with R, offering precision and efficiency.
- The elegance of ggplot2 and other visualization libraries amplifies the impact of insights, enabling effective communication of findings.
- From caret to mlr, R equips users with tools for predictive modeling, unlocking potential in diverse domains.
- R Markdown seamlessly blends code, analysis, and narrative, forging engaging reports that bridge the gap between data and decision-makers.
- The synergy of R's libraries, coupled with a vibrant community, fosters innovation, making R a vital catalyst in propelling industries forward through data-driven strategies.