R runif() Function
Overview
R is a versatile programming language and environment for statistical computing and data analysis. It excels in handling and visualizing data. One of its essential functions, runif(), generates random numbers from a uniform distribution. This function plays a vital role in simulations, statistical experiments, and generating random data for testing and exploration. Whether you're conducting statistical analysis or exploring data, R's runif() function is a valuable tool for generating random numeric values to suit a wide range of applications.
R runif() Function
The R function known as runif() holds significant utility for producing random numbers that adhere to a uniform distribution. It empowers users to generate numeric values randomly within defined limits. This function serves as a valuable asset in statistical simulations, experiments, and diverse data analysis endeavours. By employing runif(), one can effortlessly generate random data points that adhere to a uniform distribution pattern, rendering it a versatile tool for generating artificial data or conducting statistical trials. Essentially, runif() offers a way to introduce controlled randomness, catering to a broad spectrum of applications within the R programming language.
Syntax
The runif() function in R is used to generate random numbers following a uniform distribution. Here's the syntax for runif() along with an explanation of its parameters:
Parameters
- n: This parameter specifies the number of random numbers you want to generate. It controls the length of the output. You can generate a single random number or a vector of random numbers by specifying n.
- min: This parameter indicates the minimum value for the range of random numbers. By default, it is set to 0, meaning the generated numbers will be greater than or equal to 0.
- max: This parameter represents the maximum value for the range of random numbers. By default, it is set to 1, meaning the generated numbers will be less than 1.
Return Value
The runif() function returns a numeric vector of length n containing random numbers drawn from the specified uniform distribution. These random numbers will fall within the range [min, max).
Here's an example of how to use runif():
Output:
The random_numbers variable will contain an array of 5 random numbers, each between 1 and 10 (inclusive of 1 and exclusive of 11). The specific values will vary each time you run the code because they are random.
Examples
Example 1: Generating Random Values with runif()
To generate random values with the runif() function in R, you can follow the example below. In this example, we will generate a vector of 10 random values between 0 and 1:
Output:
In this Code:
- We use runif(10) to generate 10 random values. By default, runif() assumes a minimum value (min) of 0 and a maximum value (max) of 1. So, it will generate 10 random values between 0 (inclusive) and 1 (exclusive).
- The generated random values are stored in the random_values variable.
- We then print the contents of random_values to see the generated random values.
When you run this code, you'll get 10 random values between 0 and 1, and the specific values will vary each time you run the code.
Example 2: Generate Random Values Rounded to Decimal Place
You can generate random values rounded to a specified number of decimal places using the runif() function in R by adjusting the generated values and rounding them to your desired precision. Here's an example of how to do it:
Output:
In this Code:
- You specify the number of random values you want to generate (n), the minimum value (min_value), and the maximum value (max_value) for the range. You also set the number of decimal places you want to round to (decimal_places).
- You use runif() to generate n random values between min_value and max_value.
- You then use the round() function to round the generated random values to the specified number of decimal places (decimal_places).
- Finally, you print the generated and rounded random values.
Adjust the values of n, min_value, max_value, and decimal_places to suit your specific requirements.
Example 3: Generate Random Values Rounded to Whole Numbers
If you want to generate random whole numbers using runif() and round them to the nearest whole number, you can do so by using round() to round the generated random values. Here's an example of how to generate random whole numbers rounded to the nearest integer:
Output:
In this code:
- You specify the number of random values you want to generate (n), as well as the range of whole numbers you want to generate (min_value and max_value).
- You use runif() to generate n random values between min_value and max_value.
- You then use the round() function to round the generated random values to the nearest whole number, effectively converting them to integers.
- Finally, you print the generated and rounded random whole numbers.
Example 4: How to Create Histogram of Uniform Distribution with runif()
To create a histogram of a uniform distribution generated with the runif() function in R, you can follow these steps. In this example, we'll generate random numbers from a uniform distribution and then create a histogram to visualize the distribution:
Output:
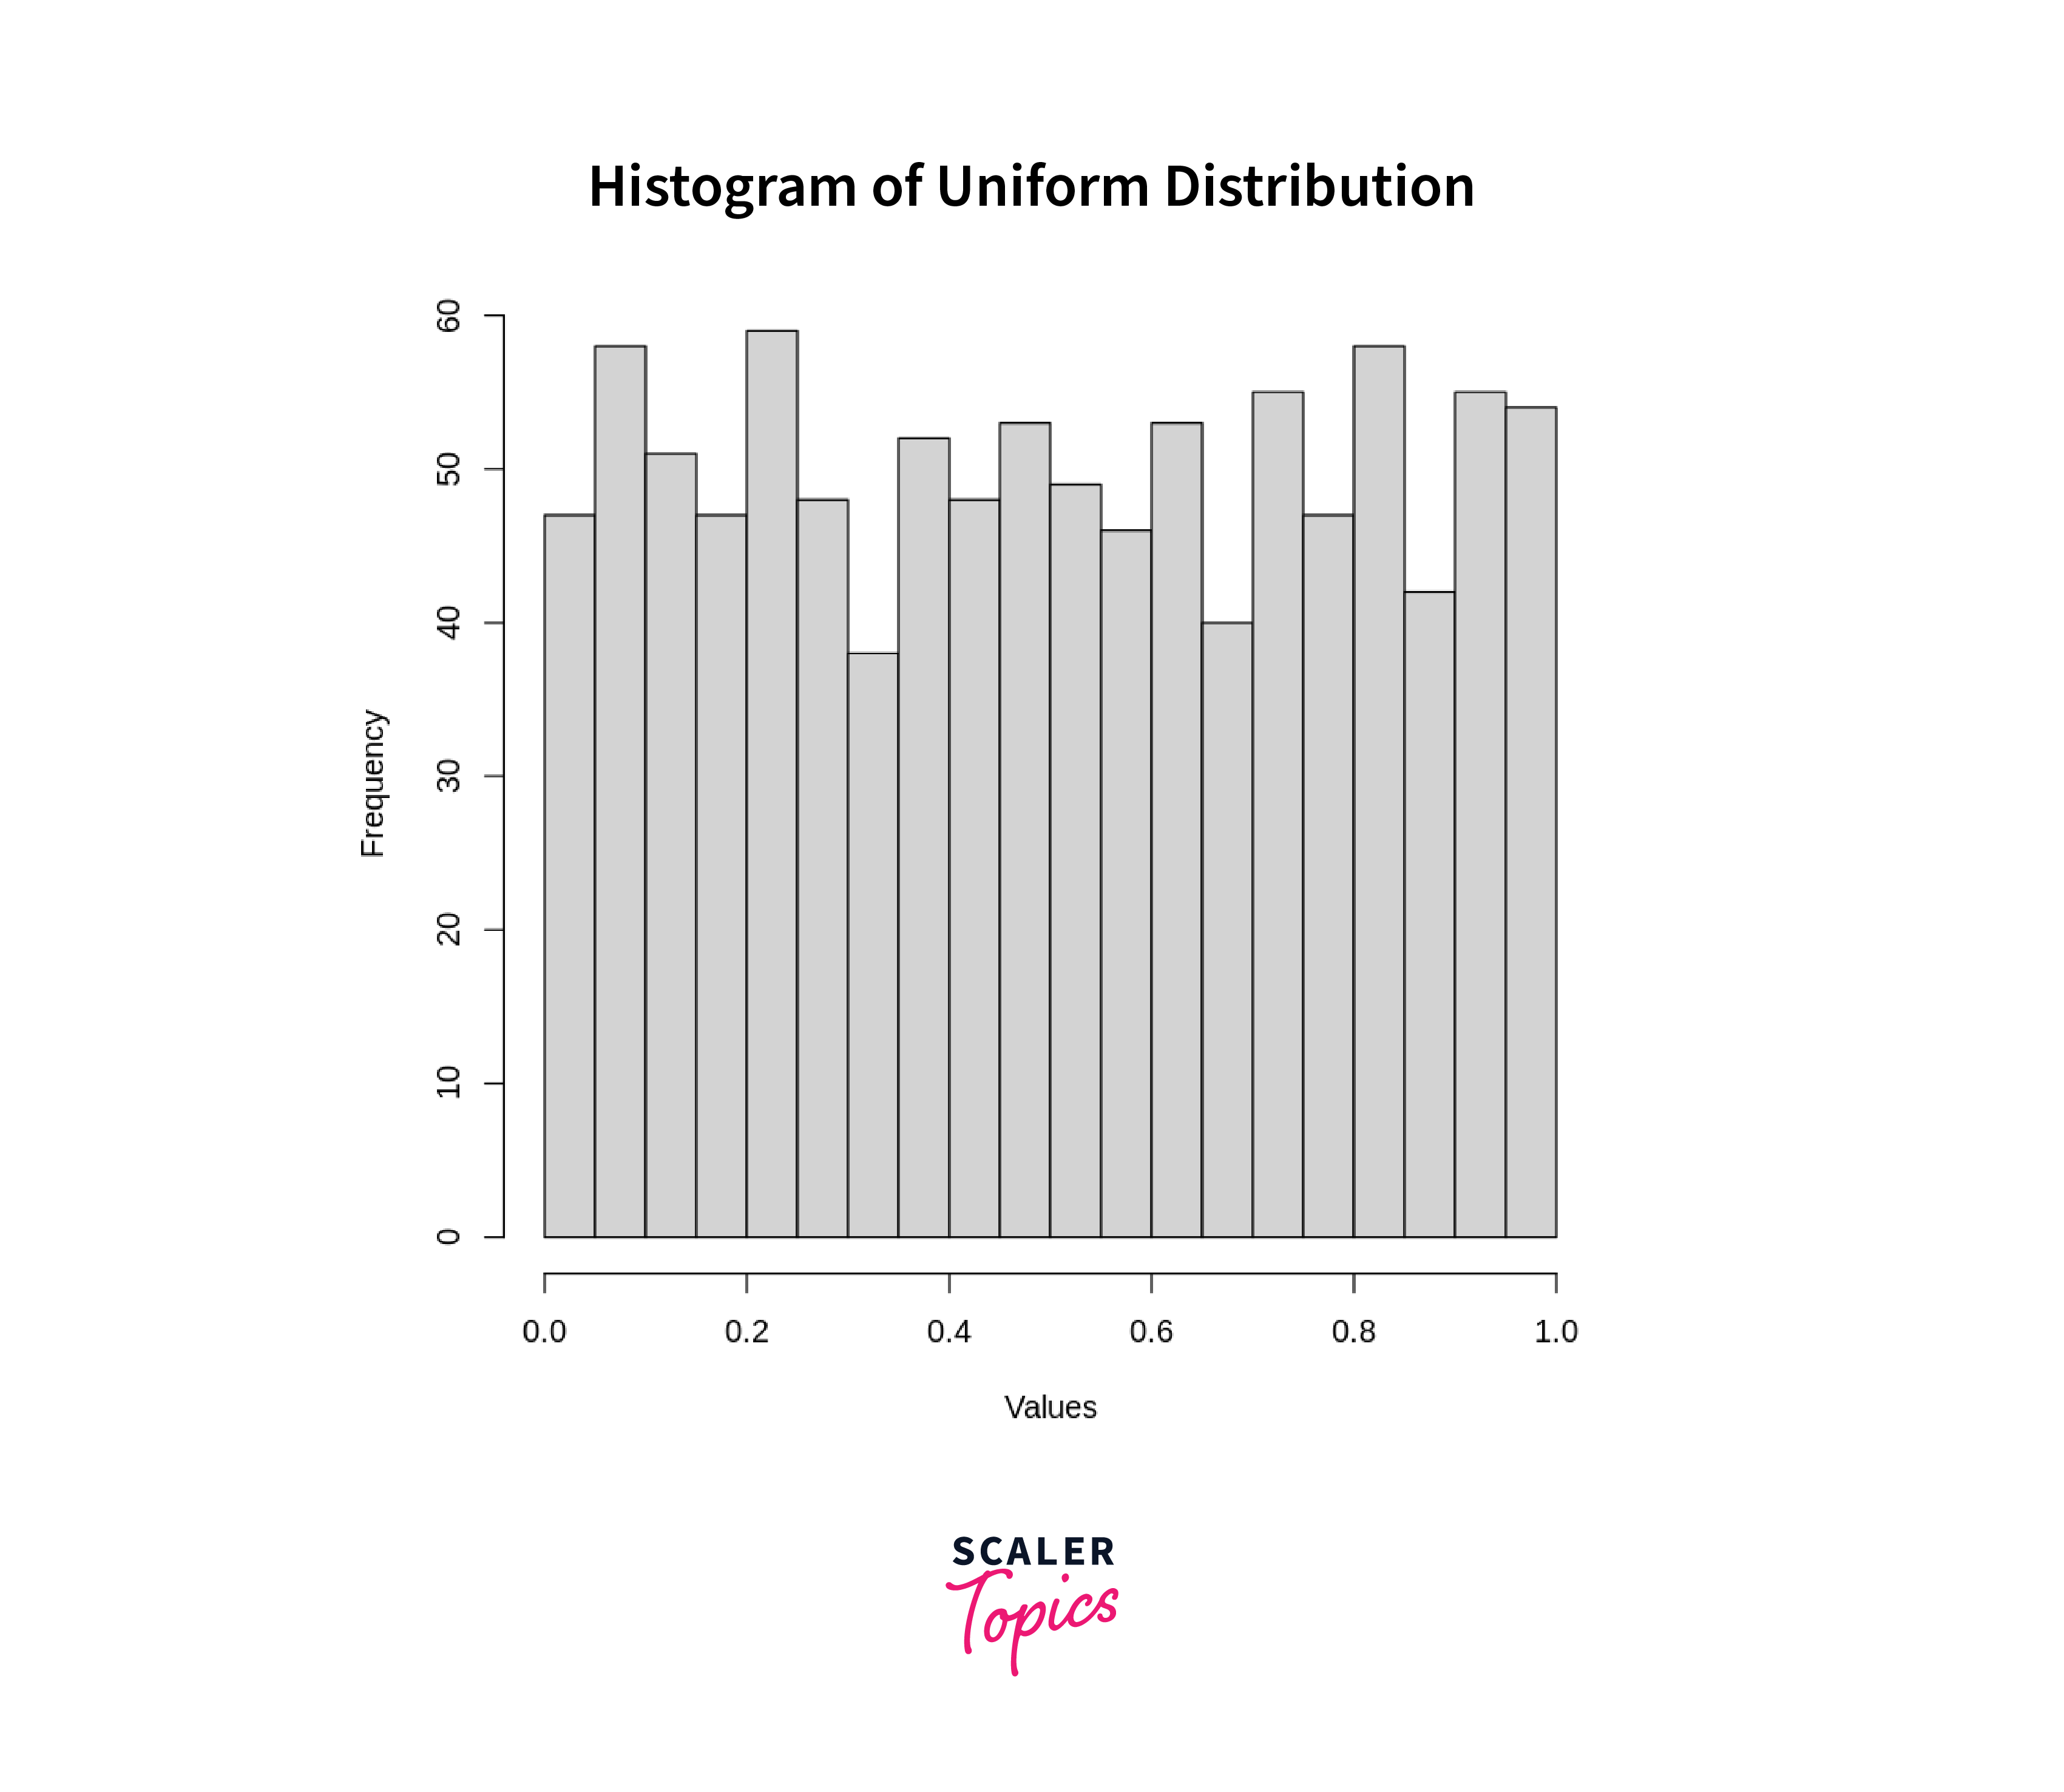
In this Code:
- You specify the number of random values you want to generate (n) and the range of the uniform distribution (min_value and max_value).
- You use runif() to generate n random values from the uniform distribution.
- You create a histogram using the hist() function. The breaks argument specifies the number of bins or intervals in the histogram. You can adjust this value to control the granularity of the histogram. The main argument sets the title of the histogram, and the xlab and ylab arguments label the x and y-axes, respectively.
- When you run the code, it will display a histogram that shows the distribution of the random values generated from the uniform distribution.
You can customize the parameters, such as the number of random values (n), the range (min_value and max_value), and the number of bins (breaks), to match your specific requirements and explore different aspects of the uniform distribution.
Conclusion
- Versatile Tool for Random Data Generation: The runif() function in R serves as a versatile tool for generating random numeric values adhering to a uniform distribution. Whether you need random data for simulations, experiments, or statistical analysis, runif() empowers users to create controlled randomness tailored to their needs.
- Syntax and Parameters: Understanding the syntax and parameters of runif() is crucial. Users can specify the number of random values (n) to generate, set the range of random values using min and max, and control the precision of generated values, making it adaptable to various scenarios.
- Rounding and Customization: You can further enhance the utility of runif() by rounding the generated values to a specified number of decimal places or rounding them to the nearest whole numbers. This customization allows users to fine-tune the randomness according to their specific requirements.
- Visualization with Histograms: The article also demonstrates how to create histograms to visualize the distribution of random values generated with runif(). This visualization technique is valuable for understanding the characteristics of the uniform distribution and exploring the generated data.
In summary, the runif() function in R is a valuable asset for data scientists, statisticians, and analysts seeking to introduce controlled randomness into their work, conduct experiments, and explore data distributions. By mastering its syntax and parameters, users can harness its power for a wide range of applications in statistical computing and data analysis.