Debugging in React Native
Overview
React Native is a popular framework used for developing mobile applications. Debugging is an essential process when working with React Native, as it helps developers identify and fix errors in their code. The React Native Debugger is a powerful tool that allows developers to debug and inspect their React Native code in real time. In this article, we will discuss the basics of debugging in React Native.
Introduction to Debugging in React Native
Debugging is the process of finding and fixing errors in code. React Native provides several tools and techniques for debugging applications. With the React Native Debugger, developers can easily view the state and props of their components, as well as the network requests and errors that occur during runtime.
In-App Developer Menu Accessing
The In-App Developer Menu is a valuable tool in React Native that enables developers to access various debugging features directly within the application. By simply shaking their device or using keyboard shortcuts such as ctrl + m on Android or cmd + m on iOS, developers can quickly bring up the menu.
Once opened, developers can access essential features such as reloading the application, enabling remote debugging, and other options to diagnose and fix issues in their code. This feature can save developers time and effort in the debugging process and makes it more convenient to access the necessary tools.

Fast Refresh
Fast Refresh is a feature in React Native that allows developers to see changes they make to the code immediately reflected in the application without having to reload the entire app. This can save a lot of time and make the development process more efficient.
Keyboard Shortcut Enabling
React Native provides support for a few keyboard shortcuts on the iOS Simulator, which can help developers navigate and test their applications more efficiently.
To enable these keyboard shortcuts on a macOS computer, developers can follow these steps:
- Open the iOS Simulator app on your computer.
- From the menu bar, select the I/O option.
- Click on Keyboard from the dropdown menu.
- Make sure the Connect Hardware Keyboard option is checked.
LogBox in React Native
LogBox is a feature in React Native that helps developers identify and fix errors in their applications. It is essentially a log system that captures errors and warnings that occur during runtime and displays them in an organized and easy-to-read format.
When an error or warning occurs, LogBox will display a yellow or red box in the application, indicating the severity of the issue. Developers can then click on the box to view additional details about the error, including the source file, line number, and stack trace. LogBox also groups similar issues, making it easier for developers to identify recurring problems and address them efficiently.
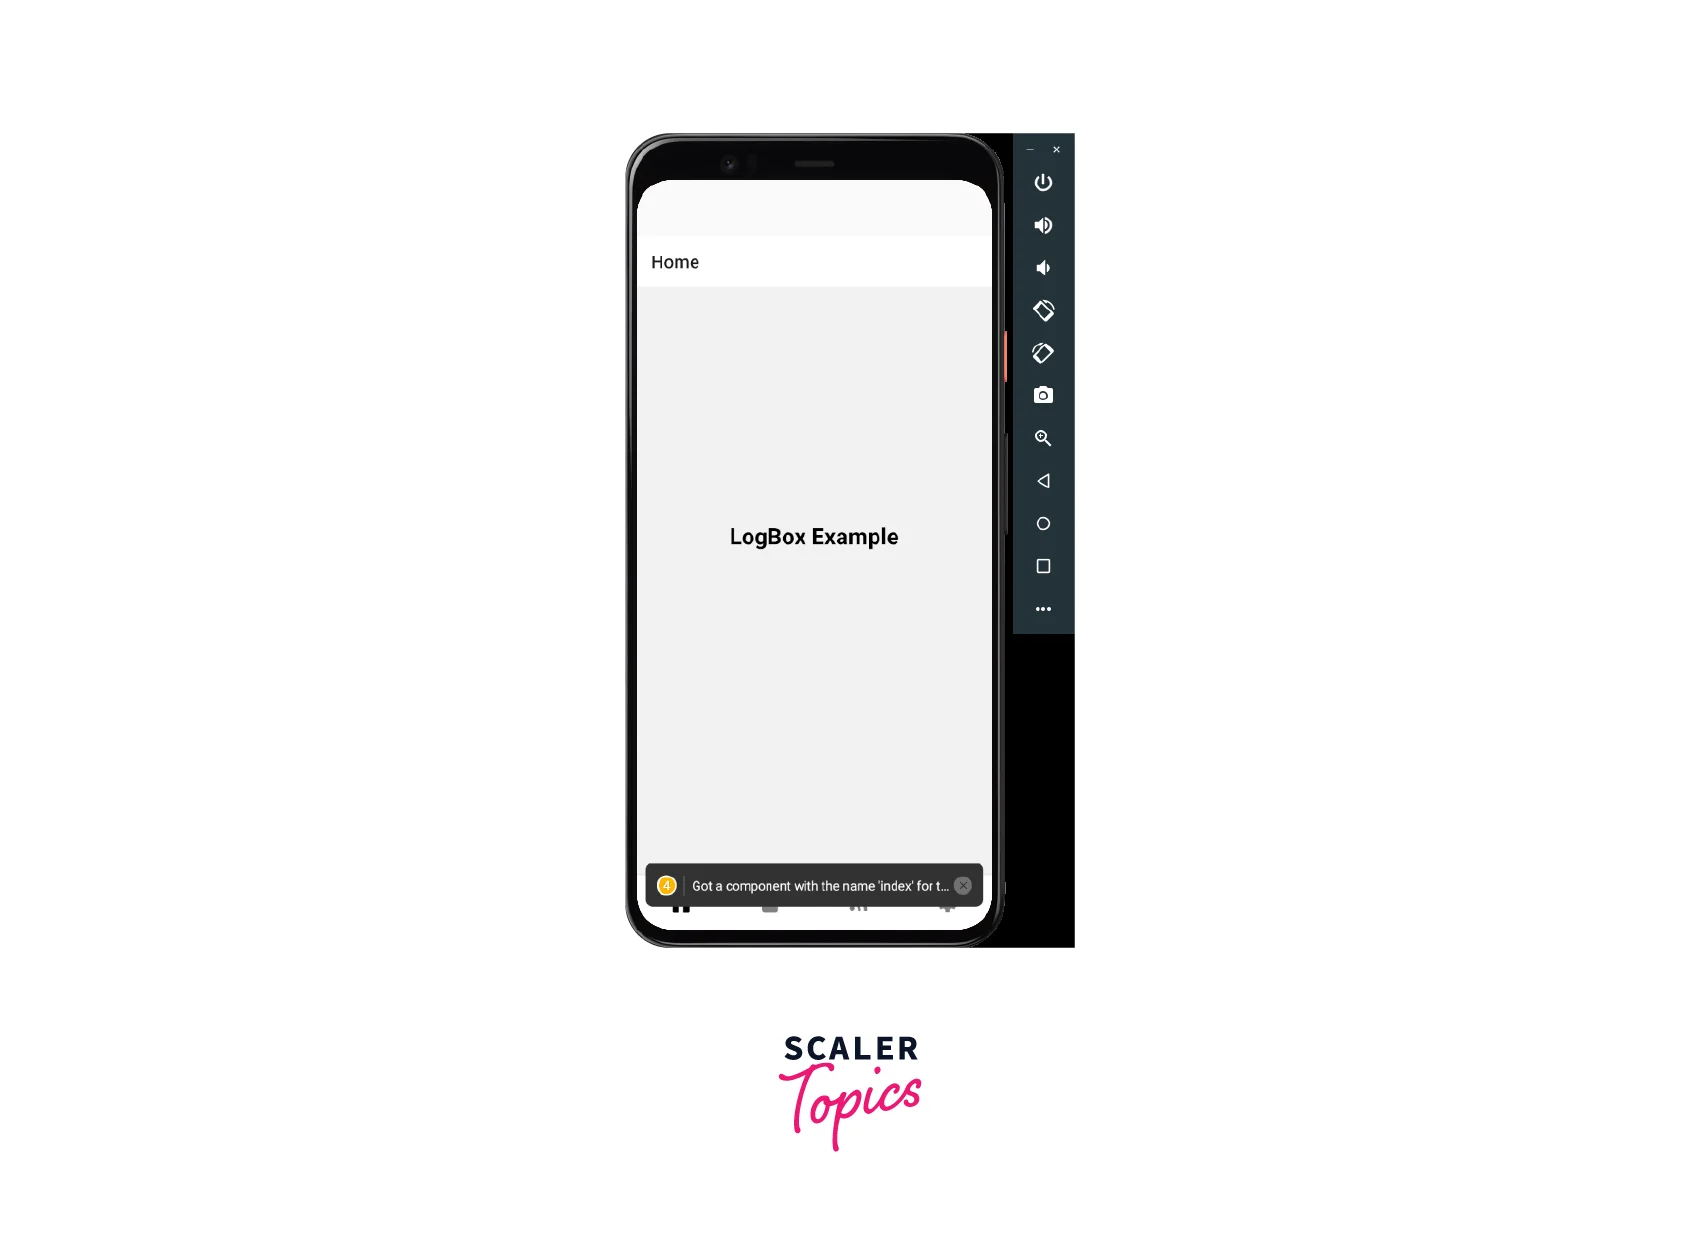
Warnings and Console Errors
LogBox can capture warnings and console errors that occur during runtime and display them in an organized and easy-to-read format. These issues may not necessarily break the application but can indicate potential problems that need to be addressed. For example, a warning message may indicate that a deprecated method is being used or that a component name is not correct, etc.
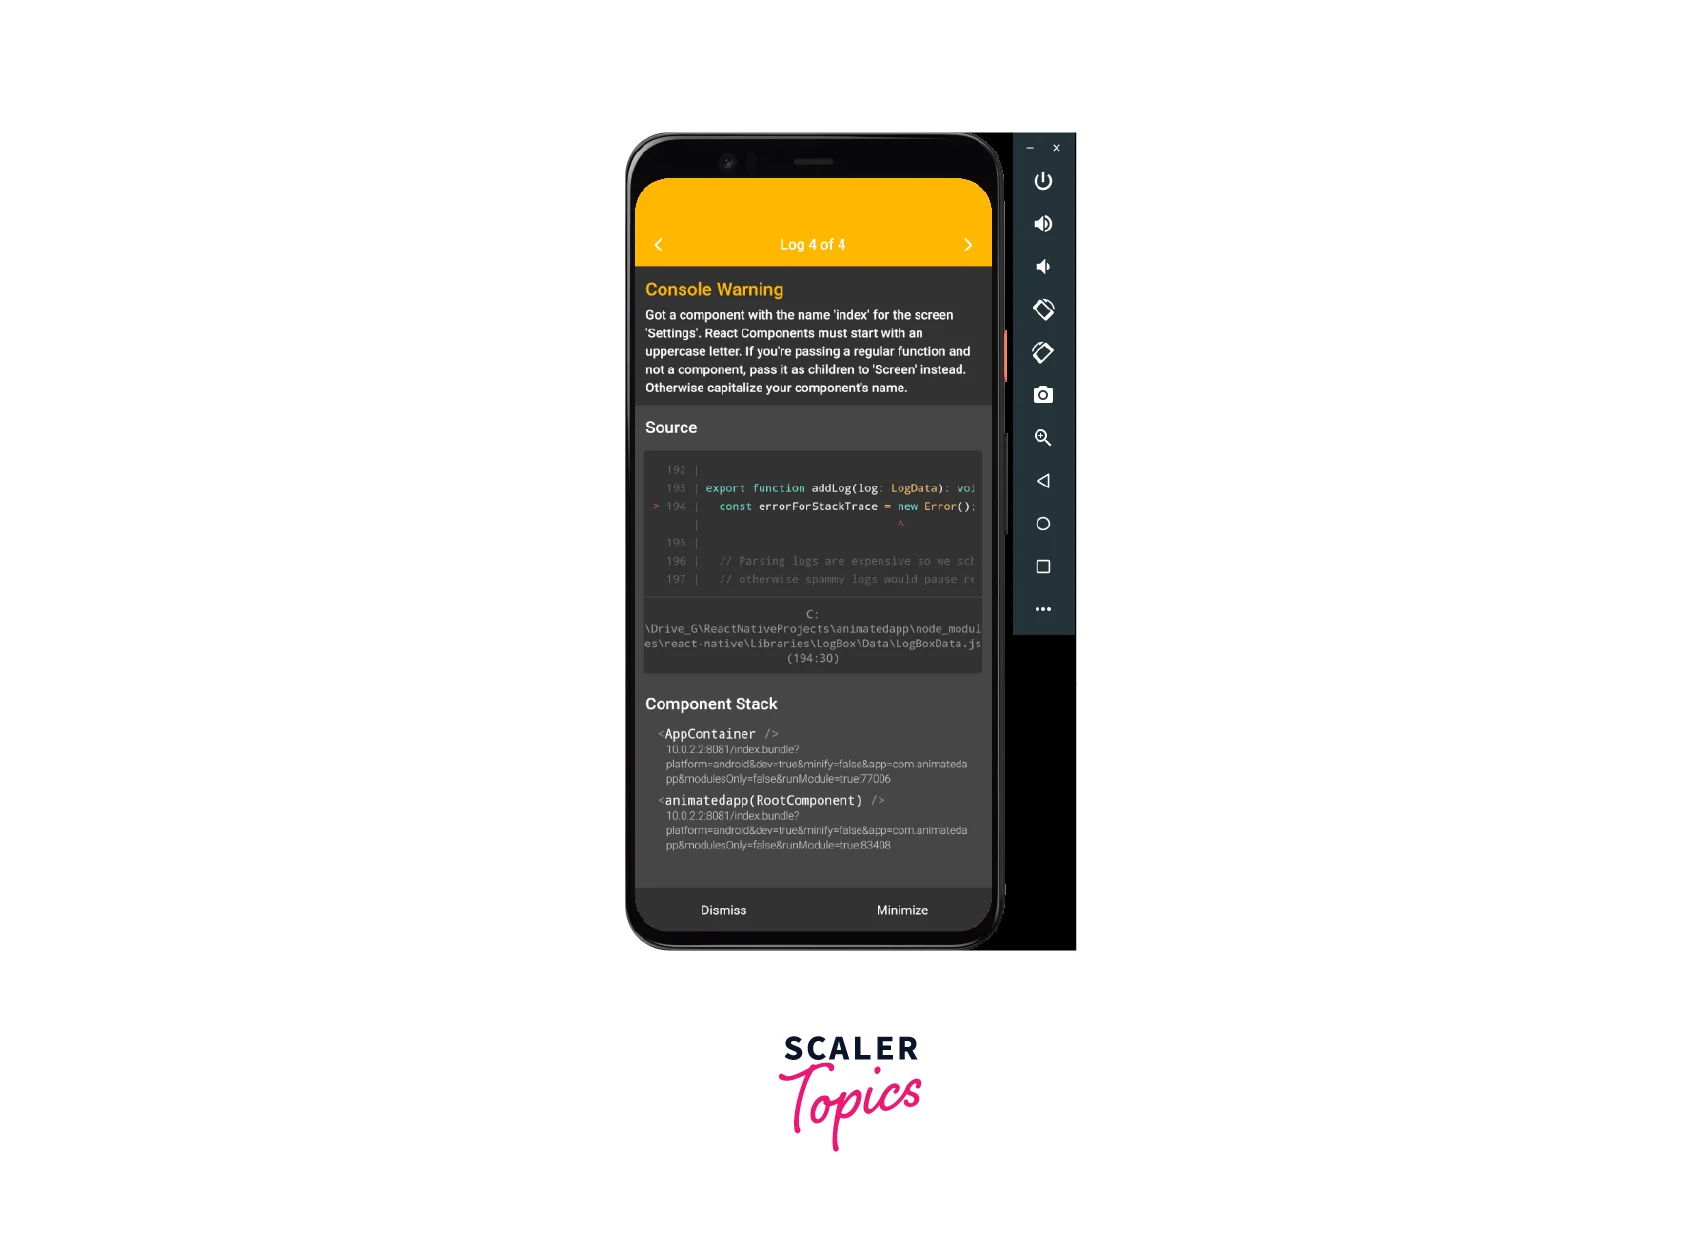
Syntax Errors
Syntax errors occur when there is a mistake in the code that prevents it from being executed properly. LogBox can help developers identify syntax errors by displaying a red box in the application, indicating the severity of the issue. Clicking on the box will show the source file, line number, and other relevant details to help developers pinpoint the problem.
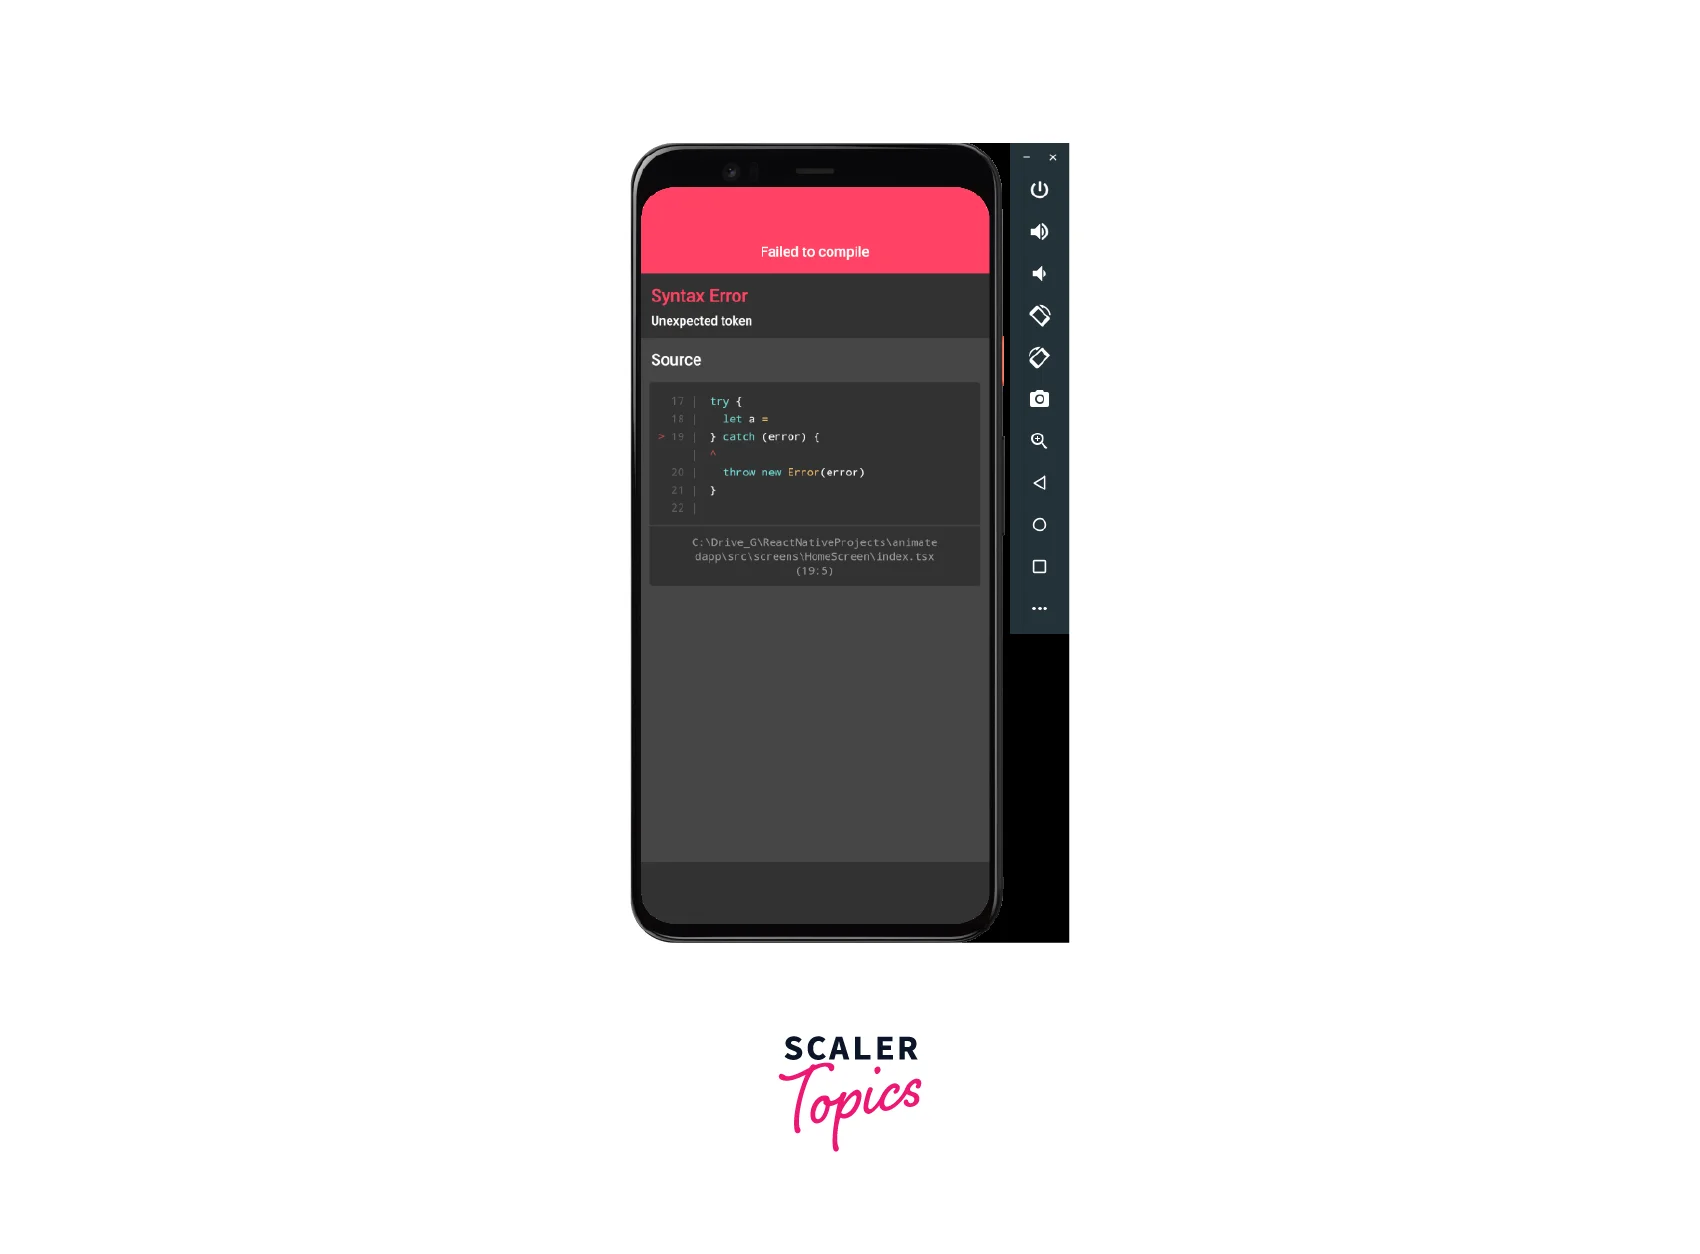
Unhandled Errors
Unhandled errors occur when an error is thrown but not caught by any code in the application. These errors can cause the application to crash or behave unexpectedly. LogBox can help developers identify unhandled errors by displaying a red box in the application and providing details about the error, allowing them to quickly diagnose and fix the issue.

Debugging in Chrome
To debug JavaScript code in React Native using Chrome, developers can also select Debug JS Remotely from the Developer Menu, which will open a new tab at http://localhost:8081/debugger-ui. This will allow developers to use Chrome's developer tools to inspect and debug the JavaScript code running in their React Native application.
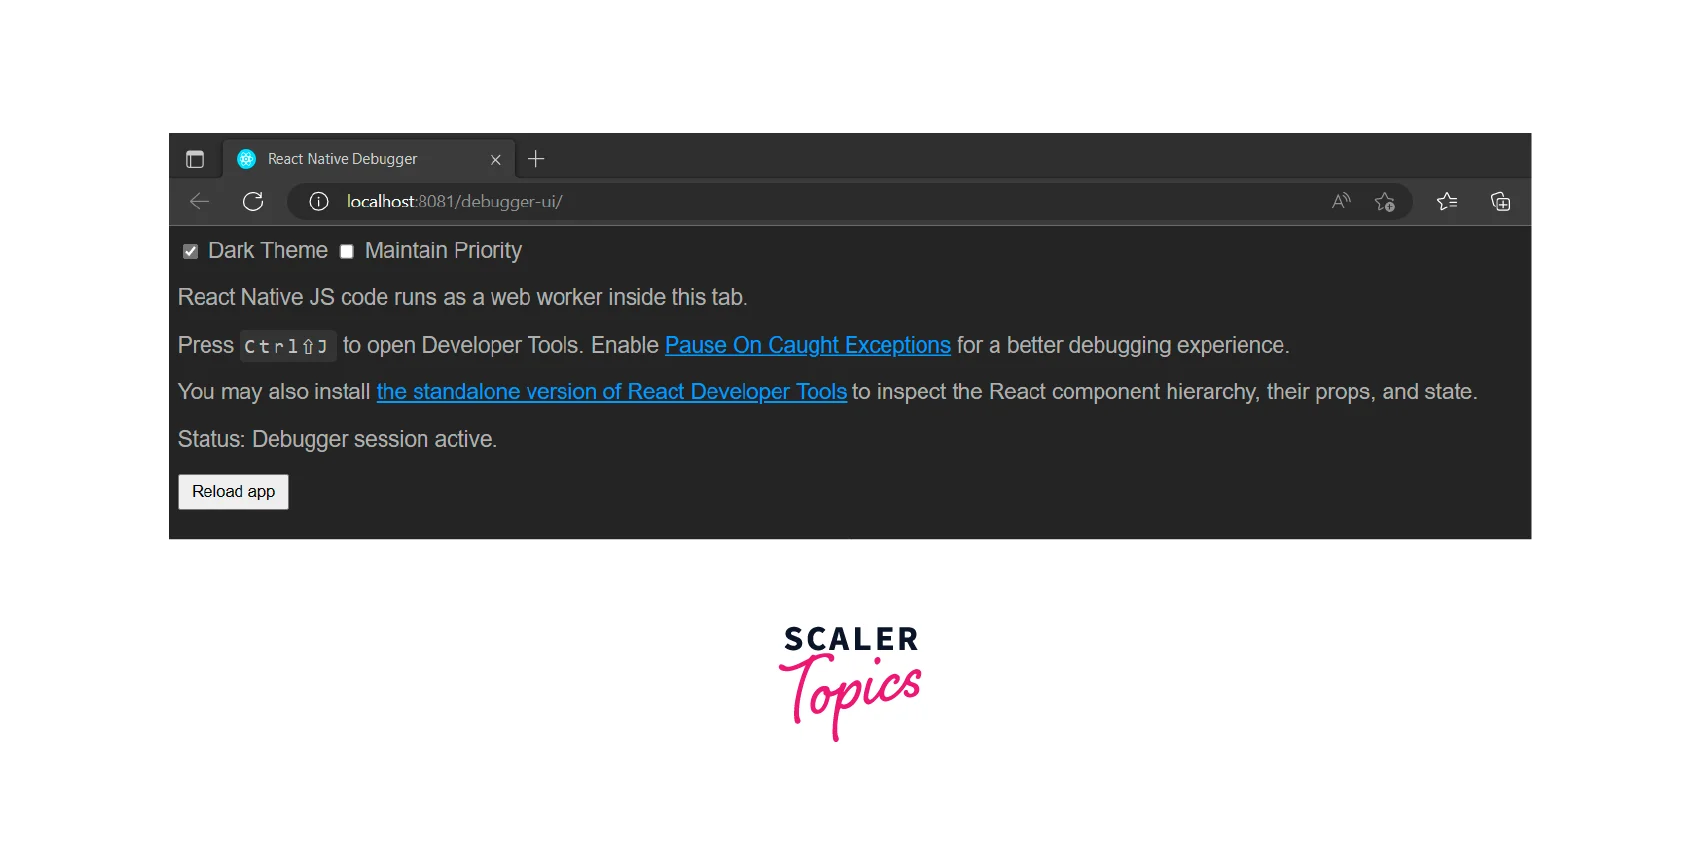
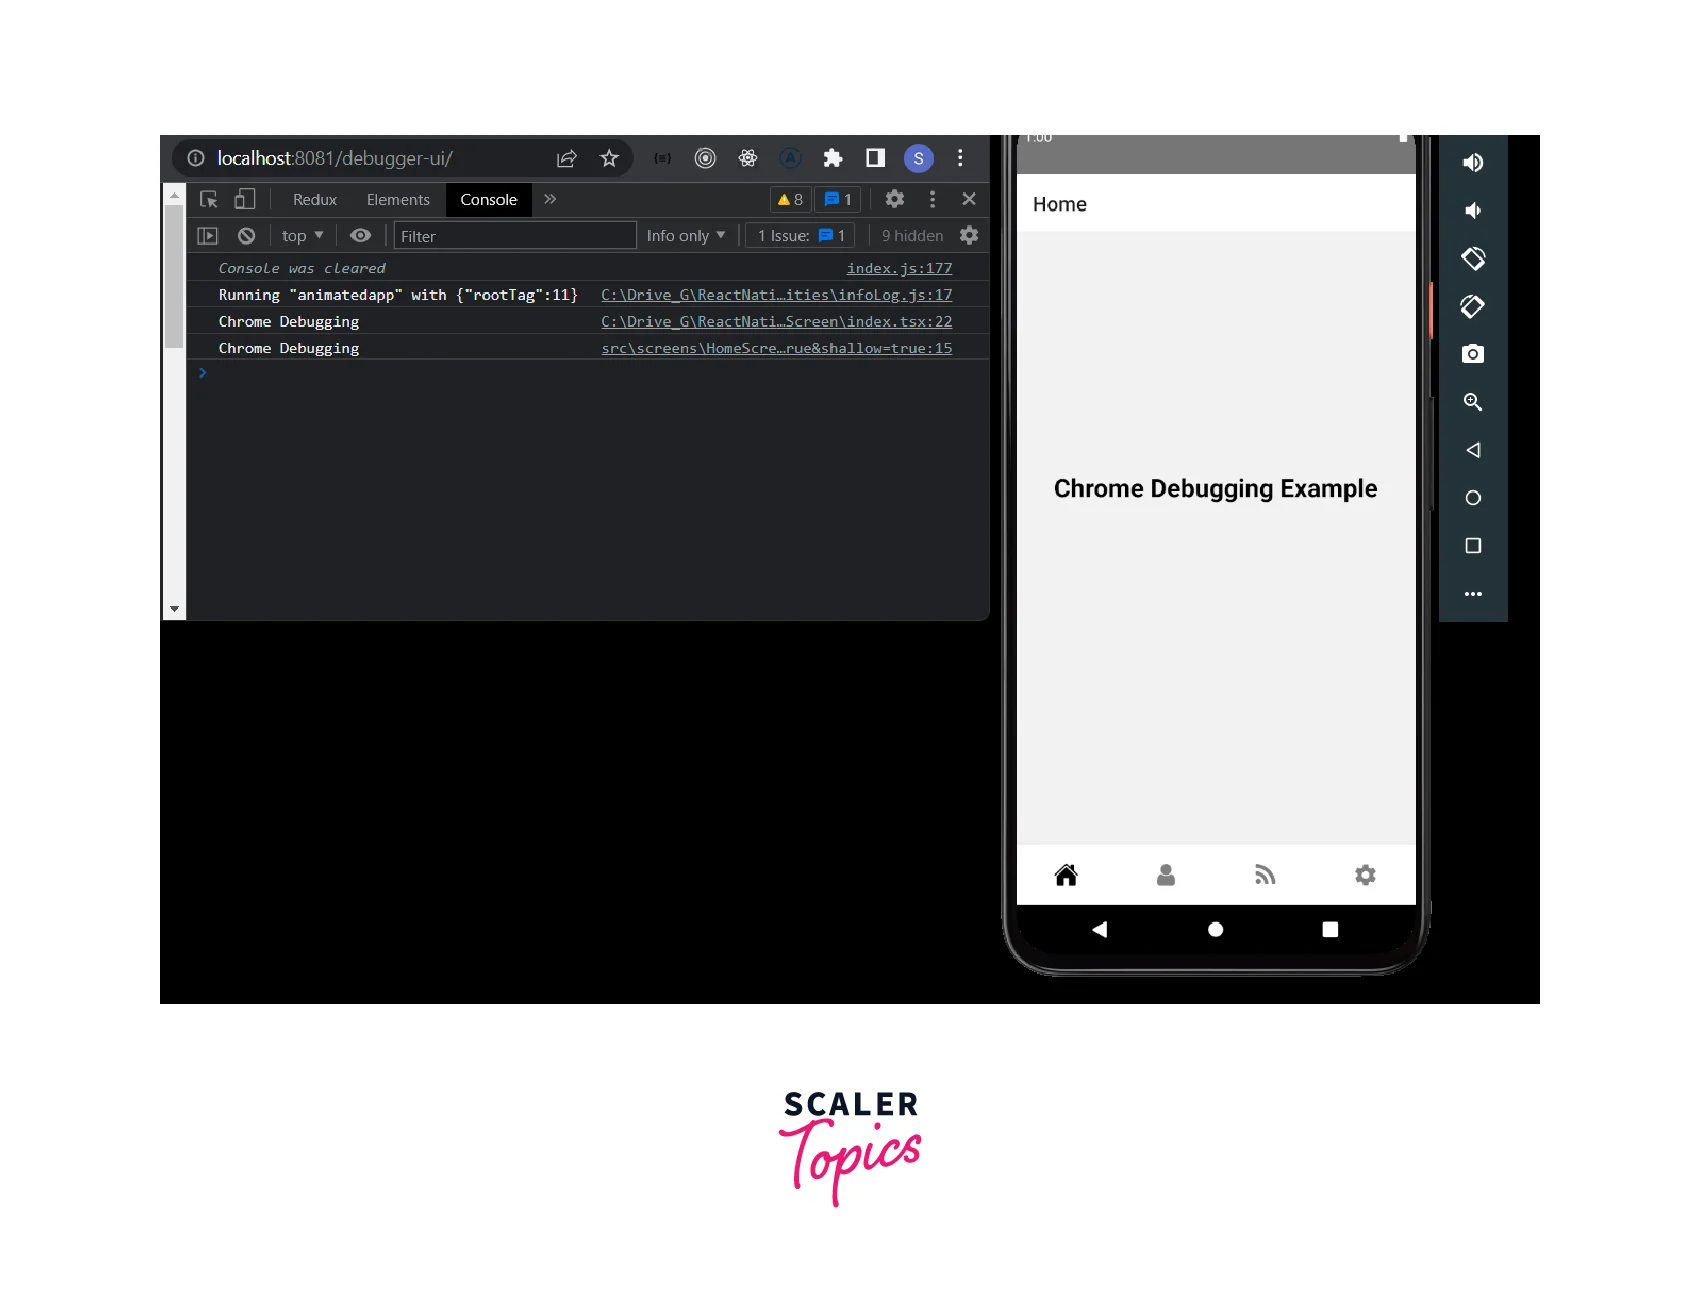
The React Native Debugger also has a standalone desktop app that can be used with both iOS and Android apps. You can launch the React Native Debugger from the command line using the react-native-debugger command.
Using a Custom for Debugging
React Native also supports using custom debuggers. Developers can use any debugger that supports the Chrome DevTools Protocol, such as VS Code or WebStorm, to debug their React Native code. To use a custom debugger, you'll need to configure your app to use the debugger by adding the appropriate configuration to your package.json file.
JavaScript Debugging
React Native allows developers to use a custom JavaScript debugger instead of Chrome Developer Tools to debug their applications. To do this, you need to set the REACT_DEBUGGER environment variable to a command that will start your custom debugger.
For example, if you have a custom debugger script located at /path/to/launchDebugger.js that accepts a --portland --typeargument, you can set theREACT_DEBUGGERvariable to node/path/to/launchDebugger.js --port 2345 --type ReactNative`.
Once you've set the REACT_DEBUGGER environment variable, you can select Debug JS Remotely from the Developer Menu to start debugging. The custom debugger script will receive a list of all project roots, separated by a space, and use the specified command to start the debugger.
Debugging in VS Code
Debugging in VS Code for React Native involves setting up the debugging environment to help identify and fix issues in your React Native application. Here are the steps to follow:
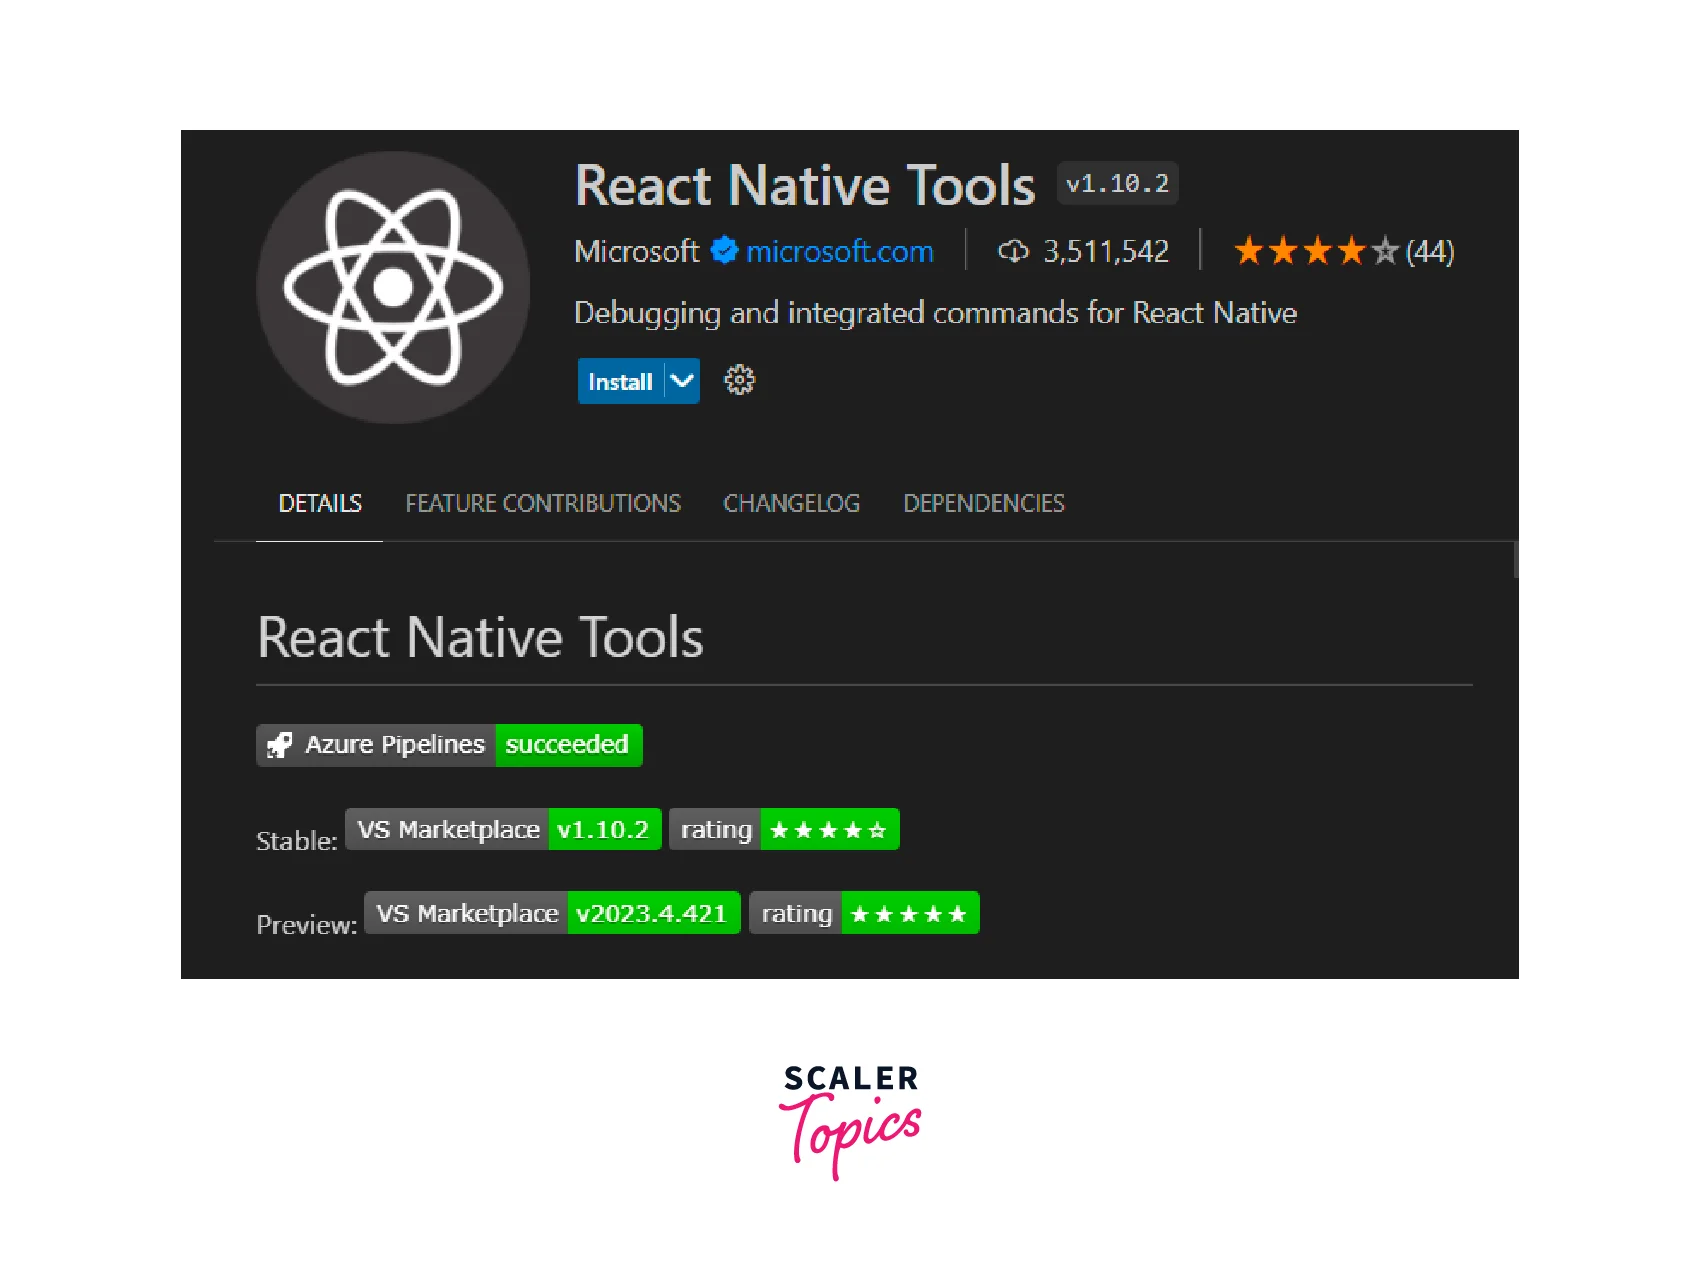
- Install the React Native Tools extension: First, install the React Native Tools extension in VS Code. You can do this by searching for the extension in the Extensions tab, or by navigating to the Extensions tab in the sidebar, typing React Native Tools in the search bar, and clicking Install.
- Set up your project for debugging: To set up your project for debugging, you need to modify your project's launch configuration file (launch.json). This file tells VS Code how to start the debugger and where to find your code. You can either create a new launch configuration file or modify an existing one.
- Start the debugger: Once your project is set up for debugging, start the debugger by clicking on the Run button in the sidebar or by pressing F5 on your keyboard.
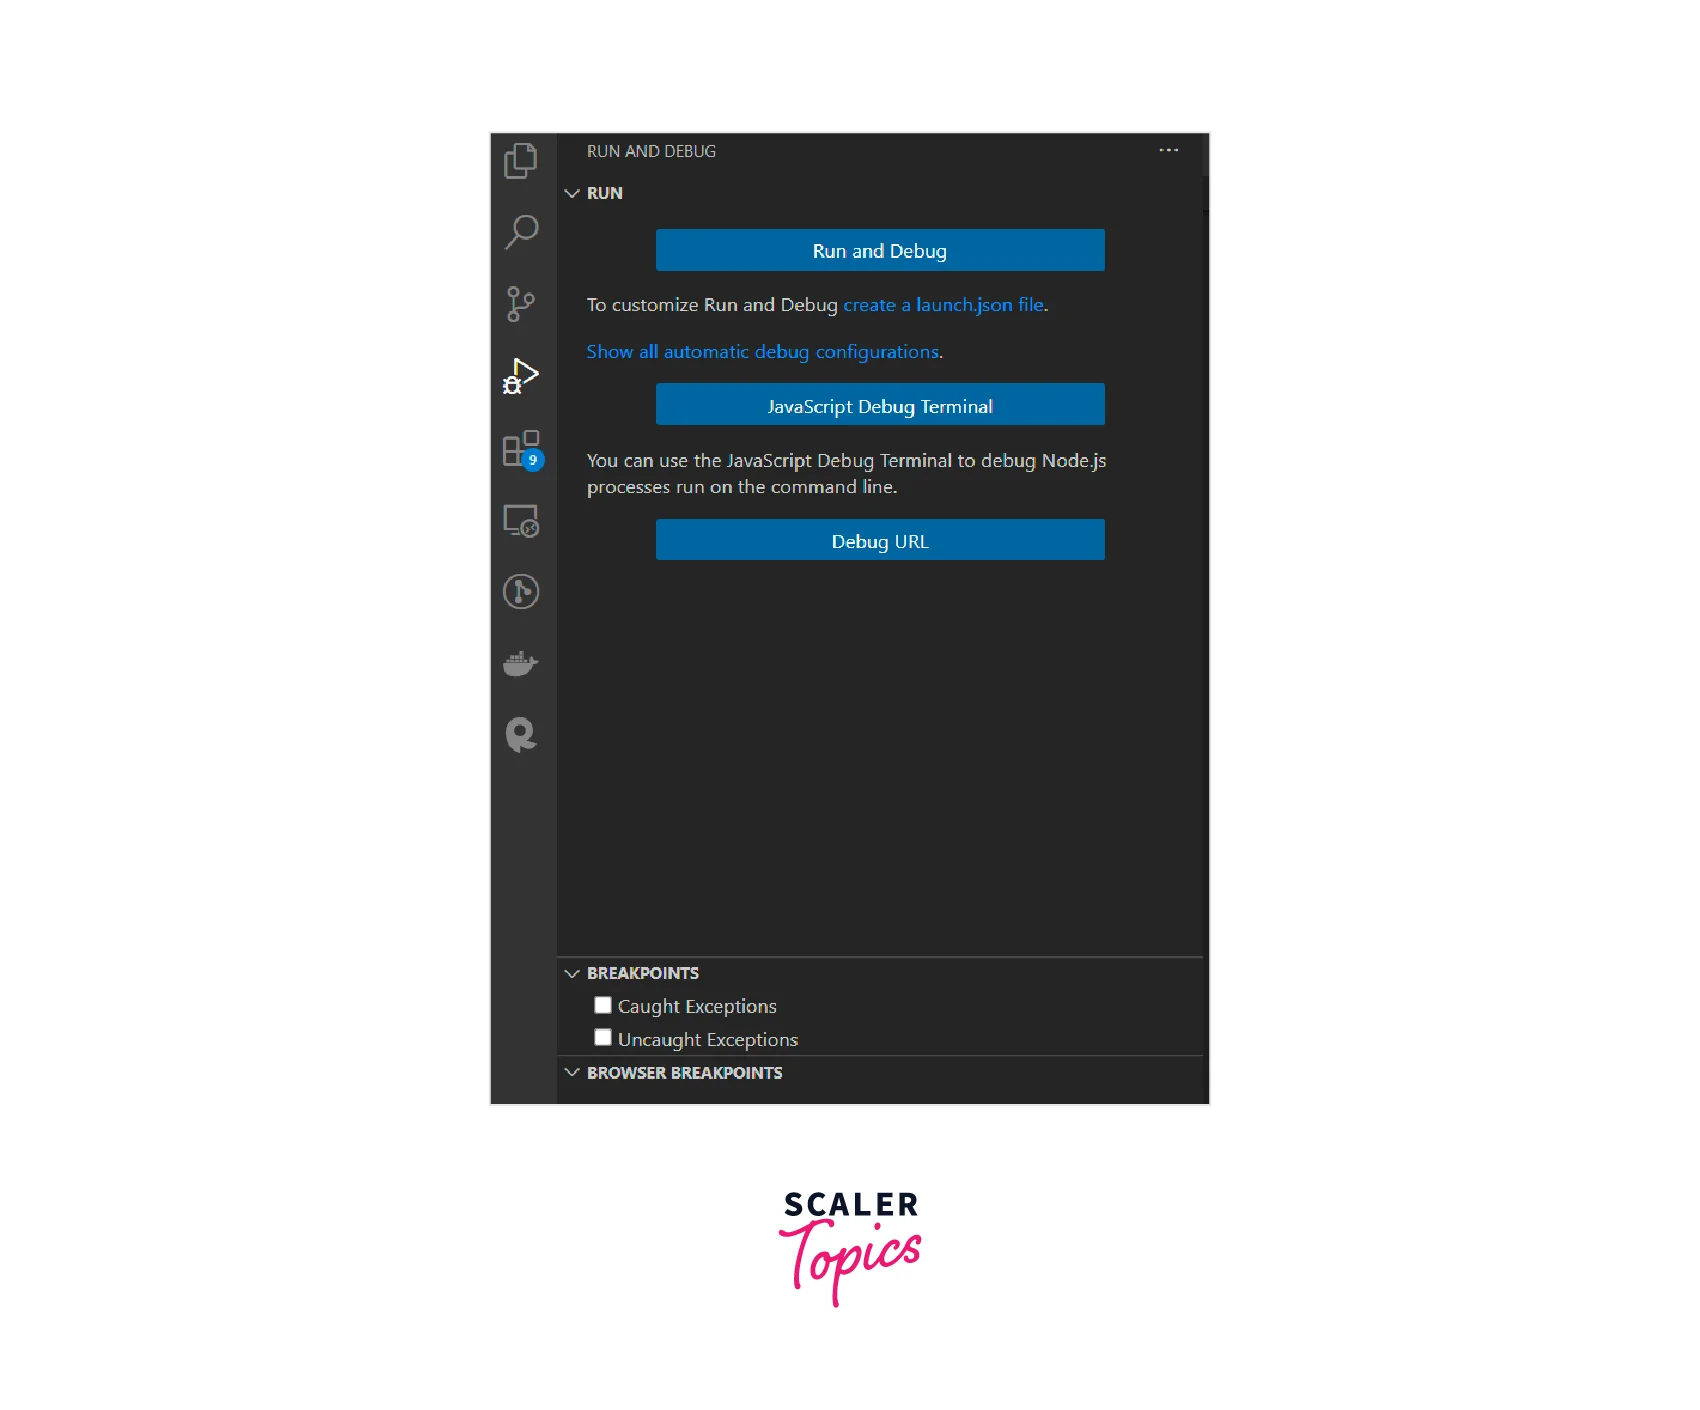
- Set breakpoints: Set breakpoints in your code where you suspect there may be issues. A breakpoint is a point in your code where the debugger will pause execution so you can examine the current state of your application. You can set a breakpoint by clicking on the line number where you want to set the breakpoint, or by right-clicking on the line number and selecting Add Breakpoint.
- Debug your code: Once the debugger is running and you've set breakpoints, run your code as you normally would. When the debugger hits a breakpoint, it will pause execution and you can examine the current state of your application.
- Use the debugging tools: Use the debugging tools in VS Code to examine variables, call stacks, and other information about your application. You can also step through your code line-by-line to see how it's being executed.
You can also integrate React Native Debugger with VS Code and Atom for a seamless development experience. The React Native Debugger includes a console that allows developers to log messages and errors, as well as interact with their app's state and props in real time.
Debugging on a Real Device
Debugging on a real device for React Native involves setting up the device to communicate with your computer, and then using debugging tools to identify and fix issues in your application. Here are the steps to follow:
- Enable USB Debugging: First, enable USB debugging on your Android or iOS device. The steps to do this will vary depending on your device and operating system but generally involve going to the Developer Options section in your device's Settings app and enabling USB debugging.
- Connect your device: Connect your device to your computer using a USB cable. Make sure that the device is detected by your computer and that it appears in the list of connected devices.
- Set up your project for debugging: To set up your project for debugging on a real device, you need to modify your project's configuration file (usually app.json or metro.config.js) to specify the IP address of your computer. You can find your IP address by running the ipconfig command on Windows or the ifconfig command on macOS or Linux.
- Start the Metro bundler: Start the Metro bundler by running the npm start command in your project directory. This will compile your JavaScript code and make it available to your device.
- Start the app on your device: Start the app on your device using either the command line or your device's app launcher. Once the app is running, you should see a message in your terminal indicating that your device is connected and debugging is enabled.
- Use the debugging tools: Use the debugging tools in your browser or the React Native Debugger app to examine variables, call stacks, and other information about your application. You can also set breakpoints and step through your code to see how it's executing.
- The React Native Debugger supports both iOS and Android platforms, making it a cross-platform tool for debugging and testing React Native apps.
Safari Developer tools
Safari Developer Tools is a powerful set of tools that can be used to debug React Native applications running in the Safari browser on macOS. Here are the steps to follow to use Safari Developer Tools for debugging React Native applications:
-
Enable Web Inspector on your device: If you're using a physical device, go to Settings > Safari > Advanced and make sure Web Inspector is turned on. This step is not necessary on the simulator.
-
Enable Develop menu in Safari on your Mac: On your Mac, go to Safari Preferences > Advanced and select Show Develop menu in the menu bar.
-
Select your app's JSContext: From the Develop menu, select the simulator or other device that you're using to run your app. Then, select your app's JSContext.
-
Use Safari's Web Inspector: Once you've selected your app's JSContext, Safari's Web Inspector should open, which includes a Console and a Debugger. You can use these tools to examine variables, call stacks, and other information about your application. You can also set breakpoints and step through your code to see how it's executing.
React Developer tools
To debug React native apps, you can use the standalone version of React Developer Tools. The React Native Debugger tool is built on top of the open-source Chrome DevTools, which provides a familiar debugging experience for web developers. Here's how to set it up:
- Install the react-dev tools package globally: Make sure you have React Native version 0.62 or higher.
-
Launch the standalone DevTools app: Run react-devtools in the terminal. It should connect to your simulator within a few seconds.
-
Optional step: If connecting to the emulator is difficult, try running it in a new terminal.
The React Native Debugger tool also supports the use of breakpoints, which allow you to pause your code at specific points and inspect the call stack.
Performance Monitor React Native
Performance Monitor in React Native is a tool that allows you to measure and analyze the performance of your app. It can help you identify and fix performance issues that may affect your app's speed and responsiveness.
To use the Performance Monitor in React Native, you can use the Developer Tools Perf Monitor. Here's how to use it:
-
Enable Developer Tools: To enable Developer Tools, shake your device or press cmd + M on iOS or Ctrl + M on Android. This should open the Developer Menu.
-
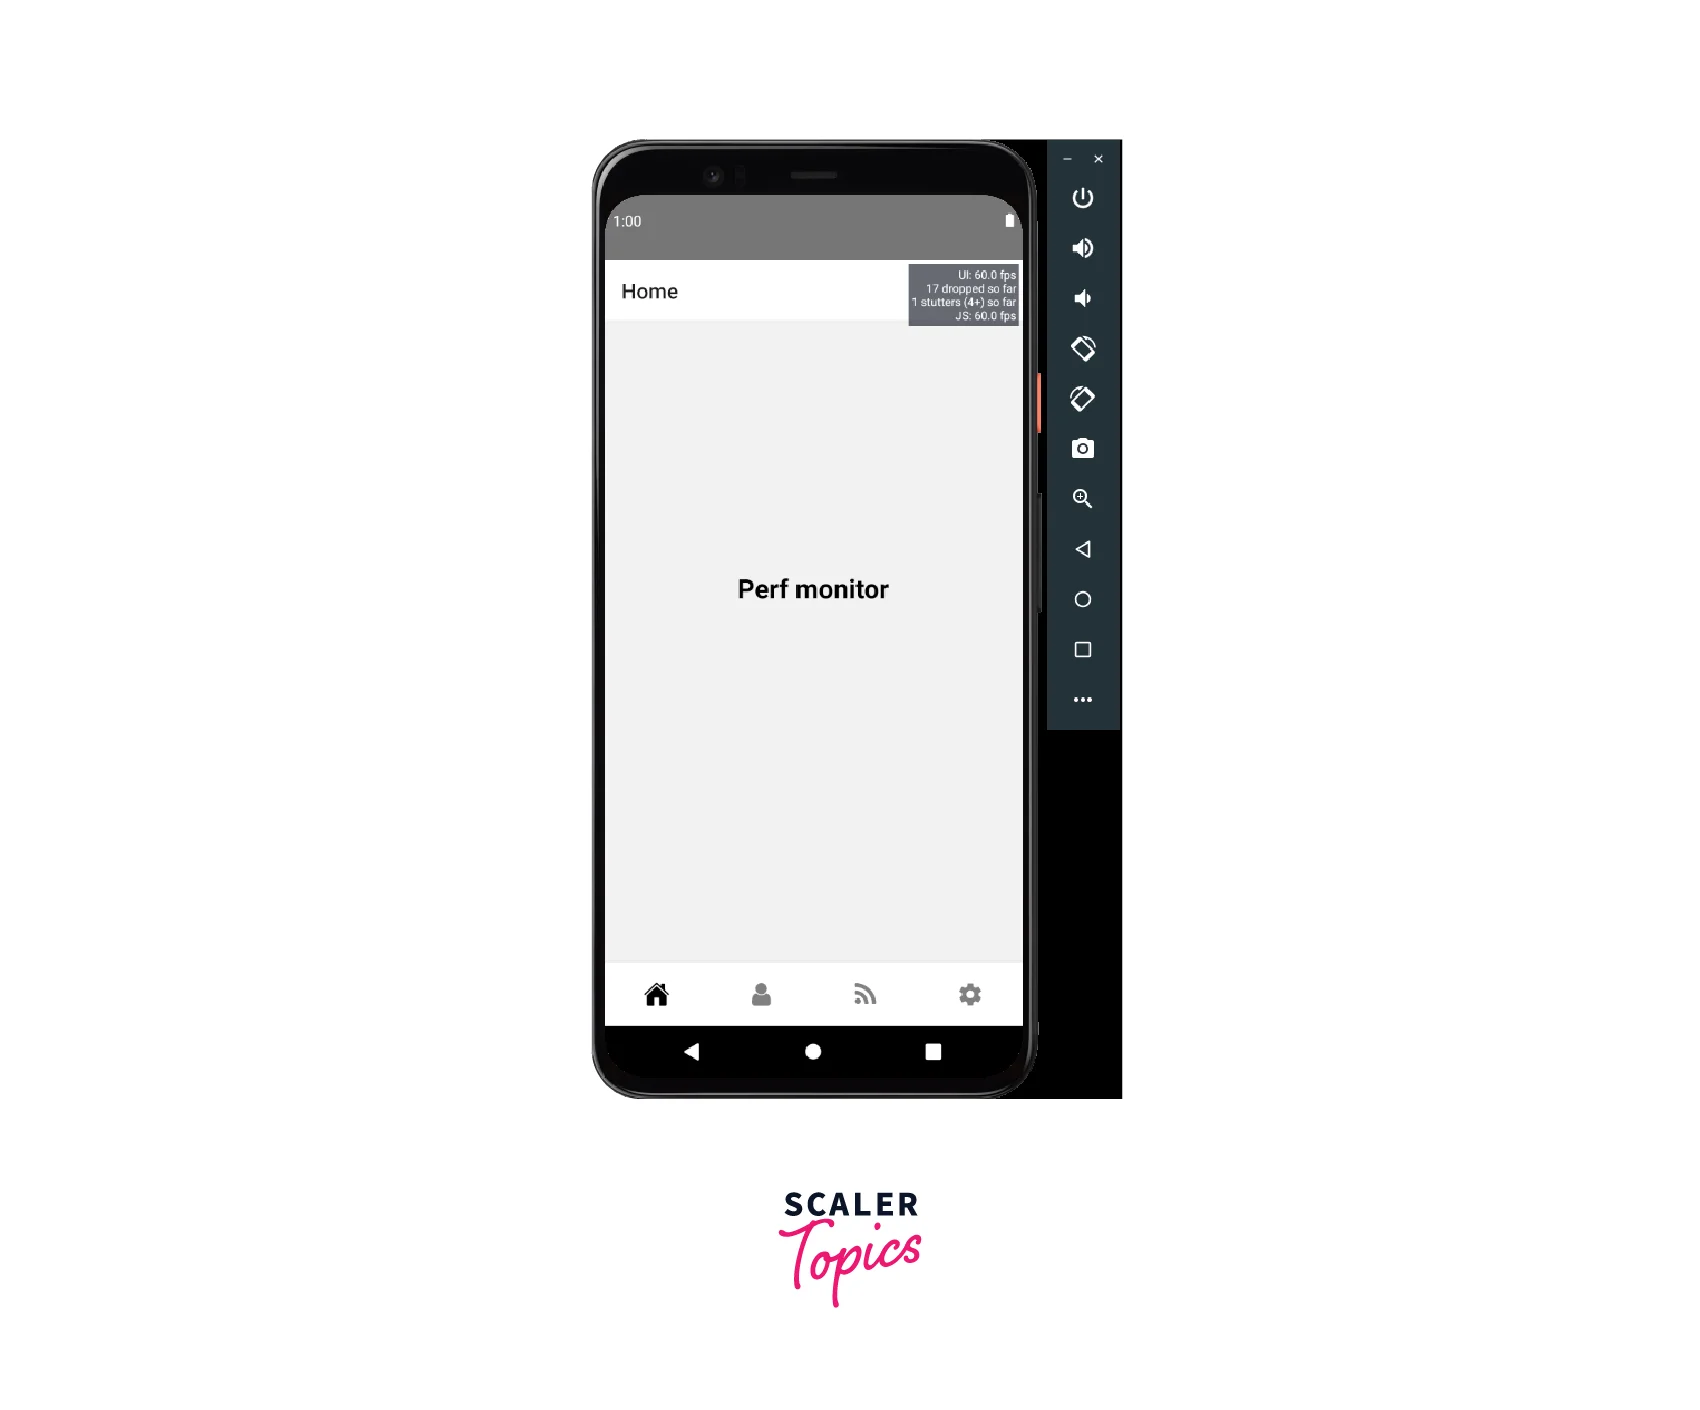
Open the Perf Monitor: From the Developer Menu, select Perf Monitor. This will open the Perf Monitor in your app.
-
Analyze the performance: The Perf Monitor will display various metrics related to your app's performance, such as FPS, JS, and UI. You can use these metrics to identify any performance issues and optimize your app's performance.
Application State Debugging
Debugging the application state in a React Native app can help you identify issues related to your app's state management. Reactotron is a desktop application that can help you inspect your app's state in real time.
You can use the React Native Debugger tool to inspect and modify your app's state, props, and other important data.
With Reactotron, you can do the following:
-
Inspect Redux or MobX-State-Tree application state: You can view the current state of your app's state management library, which can help you identify any unexpected or incorrect data.
-
View custom logs: Reactotron allows you to log custom messages from your app, which can be helpful for debugging purposes.
-
Run custom commands: You can run custom commands, such as resetting the state or store and restoring state snapshots, to help you test different scenarios and identify issues.
-
Other helpful debugging features Reactotron has other helpful debugging features, such as network request tracking and performance monitoring.
Console Logs Accessing
When you are developing a React Native app, it is important to be able to access the console logs `to help identify any issues and debug your application. There are several ways to access console logs in React Native.
If you are running your app on a physical device or emulator, you can use the following commands in a terminal to display the console logs:
- For iOS: `npx react-native log-in
- For Android: npx react-native log-android
In addition, you can access the console logs through the following methods:
- For iOS: In the iOS Simulator, go to Debug → Open System Log...
- For Android: In a terminal, run adb logcat "*:S" ReactNative: V ReactNativeJS: V while the app is running on a device or emulator.
If you are using Create React Native App or Expo CLI, the console logs will already appear in the same terminal output as the bundler. This means you can see the console logs in the same place where you started the project.
Native Code Debugging
When working with native code in React Native, you can use either Android Studio or Xcode to debug your application.
The first option is to launch your app from Android Studio or Xcode, and then use the native debugging features such as setting up breakpoints, stepping through code, etc., just like you would when building a standard native app.
The second option is to run your application using the React Native CLI and then attach the native debugger of the respective native IDE (Android Studio or Xcode) to the process.
- To attach the debugger in Android Studio, select the Run option from the menu bar, click on Attach to Process... and select the running React Native app.
- To attach the debugger in Xcode, select Debug from the top menu bar, then choose the Attach to Process option, and finally select the application from the list of Likely Targets.
FAQs
Q. What are some common debugging tools used in React Native?
A. Some common debugging tools used in React Native include React Developer Tools, Chrome Developer Tools, Safari Developer Tools, and Reactotron.
Q. How can I debug network issues in my React Native app?
A. To debug network issues in your React Native app, you can use the Network tab in the Chrome Developer Tools or the Network Monitor in Firefox Developer Tools to monitor network requests and responses.
Q. How can I debug Redux in my React Native app?
A. To debug Redux in your React Native app, you can use the Redux DevTools extension in Chrome or Firefox, or use a third-party tool like Reactotron or Redux Debugger. These tools allow you to inspect the state of your Redux store and track actions as they are dispatched.
Conclusion
- Debugging is an essential part of the development process for React Native applications. By effectively debugging your code, you can identify and fix errors, optimize performance, and ensure that your app is working as intended.
- Use the console & LogBox to log information and troubleshoot issues.
- With the React Native Debugger, you can inspect the component hierarchy, view network requests, and access the Redux store.
- Take advantage of React Native developer tools, such as React DevTools, Safari Developer Tools, and Reactotron, to help you debug your code.
- Use performance monitoring tools, such as React Native Performance Monitor, to optimize your app's performance.
- Debugging native code requires a different approach and the use of the native debugger in Android Studio or Xcode.
