Highcharts React
Overview
Ever wondered how graphs are made in react or how the dynamic data is used with these graphs? These graphs can be made with the help of a library called highcharts. React Highcharts is a useful tool for creating interactive and visually engaging charts in a React-based project.
Introduction
React Highcharts is a library that helps developers add interactive charts to their React web applications. It allows developers to use Highcharts, a popular JavaScript charting library, simply and easily. The library uses React components to create charts, which makes it easy to use and understand. It also supports all the features of Highcharts, such as different types of charts, customization options, and events.
Prerequisites
To use React Highcharts in a project, you will need to have a basic understanding of React and web development concepts. The following prerequisites are recommended:
- Knowledge of React: React Highcharts is a React-specific wrapper for the Highcharts library, so a basic understanding of React is necessary to use it.
- Knowledge of JavaScript: Highcharts is a JavaScript library, so a basic understanding of JavaScript is required to work with it.
- Web development environment: you'll need to have a web development environment set up, including a web server and a text editor or integrated development environment (IDE).
- Understanding of HTML and CSS: To customize the appearance of your charts, it's recommended to have some basic knowledge of HTML and CSS.
- Highcharts library: React Highcharts is a wrapper for the Highcharts library, so you will need to have Highcharts installed in your project.
It is also important to note that Highcharts requires a browser that supports SVG, which is the most modern web browser. If you meet these prerequisites, you should be able to start using React Highcharts in your project. It is important to note that Highcharts is a commercial library and it requires a valid license to use in commercial projects.
Installing
To install React Highcharts in a React project, you can use npm or yarn.
To install React Highcharts (highcharts react official) using npm, you can run the following command in the terminal:
npm install highcharts-react-official highcharts
To install React Highcharts using yarn, you can run the following command in the terminal:
yarn add highcharts-react-official highcharts
Once you have React Highcharts installed, you can import the library into your React component and use it to create your chart.
Here is an example of how to import and use React Highcharts in a component:
Options Details
When using React Highcharts, you will need to pass a configuration object, also known as options, to the component to define the chart's appearance and behavior. This configuration object is passed as a prop to the React Highcharts component.
Here is an example of how you can pass the options to the component:
The options object can contain a wide range of properties that define the chart's appearance and behavior. Some of the most important options include:
- chart: This option holds the chart's general settings, such as the type of chart, the height and width of the chart, and the background color.
- Title: This option holds the title of the chart, its style, and its position.
- xAxis and yAxis: These options hold the settings of the x-axis and y-axis of the chart, such as the title, labels, and gridlines.
- Series: This option holds the data to be plotted on the chart, including the data points and the series' name.
- tooltip: This option holds the settings of the tooltip that appears when you hover over a data point on the chart.
- legend: This option holds the settings of the legend that appears on the chart, including its position and style.
- credits: This options holds the settings for the credits that appear on the chart.
These are just a few examples of the options that are available when using React Highcharts. The library offers many more options that can be used to customize the chart as per your need. It's recommended to refer to the Highcharts documentation for more information on all the available options.
Examples
Basic Usage Example
Here is a basic example of how to use React Highcharts to create a simple line chart:
In this example, we start by importing the React, Highcharts, and HighchartsReact modules. We then create a new component called MyChart, which will render the chart.
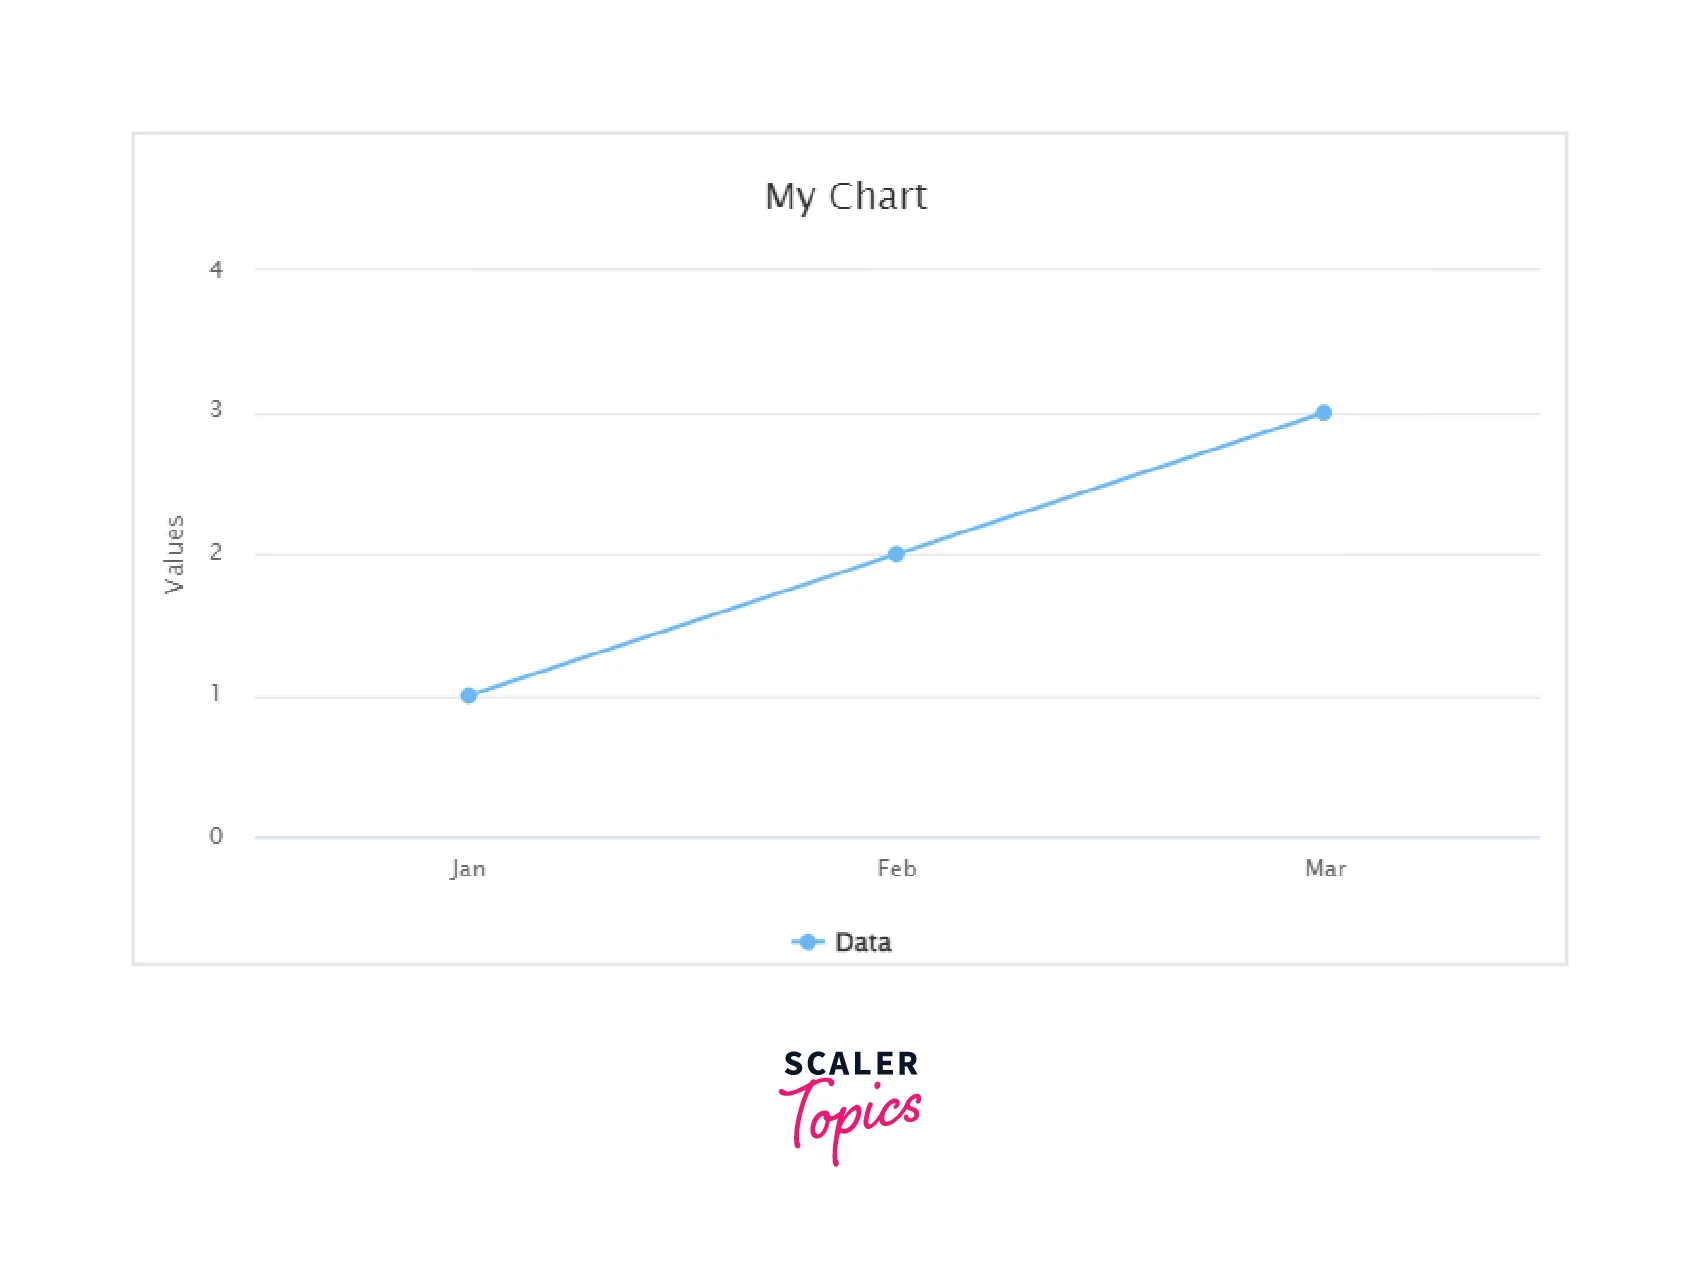
In the render function of the component, we define the configuration object for the chart. The object includes several properties to define the chart's appearance and behavior. We set the type of chart to be a line chart, give it a title, set the x-axis categories, and define the data to be plotted.
In the return statement of the render function, we use the HighchartsReact component and pass it to the Highcharts module and the configuration object as props.
When this component is rendered, it will display a line chart with the given data and configurations.
Highcharts with NextJS
Let's use highcharts in NextJS. It is very much similar to react.
You have to make a component MyChart.
[MyChart.js]
You'll also need to install the highcharts package by running the following command:
Then, you can import this component into your pages and use it just like any other component in Next.js.
For example, let's say you have a page called index.js in your pages folder. You can import the component and render it in the render method of the index component like this:
[Index.js]
When you build and run your Next.js application, it will render a line chart with the given data and configurations on the index page.
Highcharts in TypeScript
Here is an example of how to use Highcharts with TypeScript:
In this example, we start by importing the React, Highcharts, and HighchartsReact modules. We then create a new component called MyChart, which will render the chart. We define an interface called ChartProps to define the properties that are passed to the component.
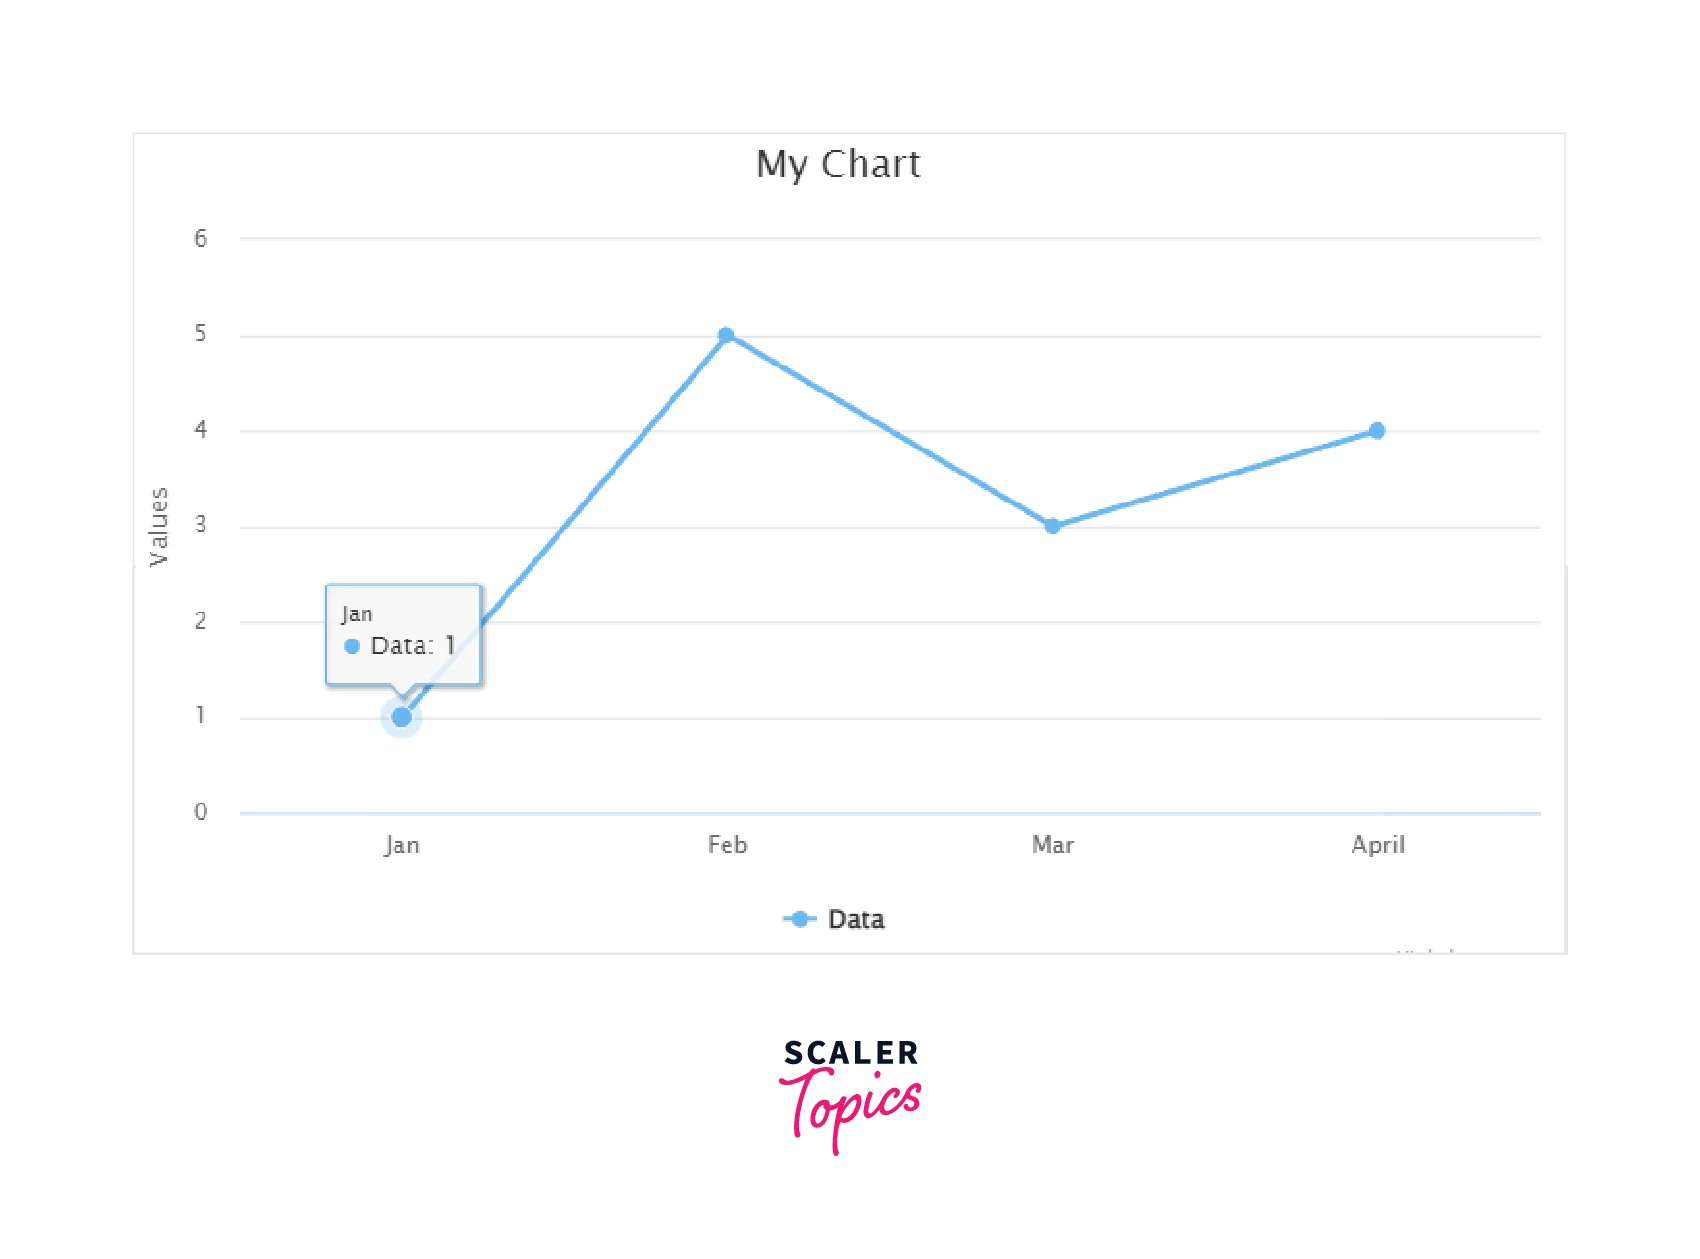
In the render function of the component, we define the configuration object for the chart. The object includes several properties to define the chart's appearance and behavior. We set the type of chart to be a line chart, give it a title, set the x-axis categories, and define the data to be plotted. The title and data are passed as props.
In the return statement of the render function, we use the HighchartsReact component and pass it to the Highcharts module and the configuration object as props.
When this component is rendered, it will display a line chart with the given data and configurations.
Optimal Way to Update
When working with React Highcharts, it is important to update the chart correctly to avoid performance issues and unexpected behavior.
One way to update the chart is to use the setState method in the React component to update the data or options of the chart. This will trigger a re-render of the component, and the chart will be updated accordingly.
Here is an example of how you can use the setState method to update the data of a chart:
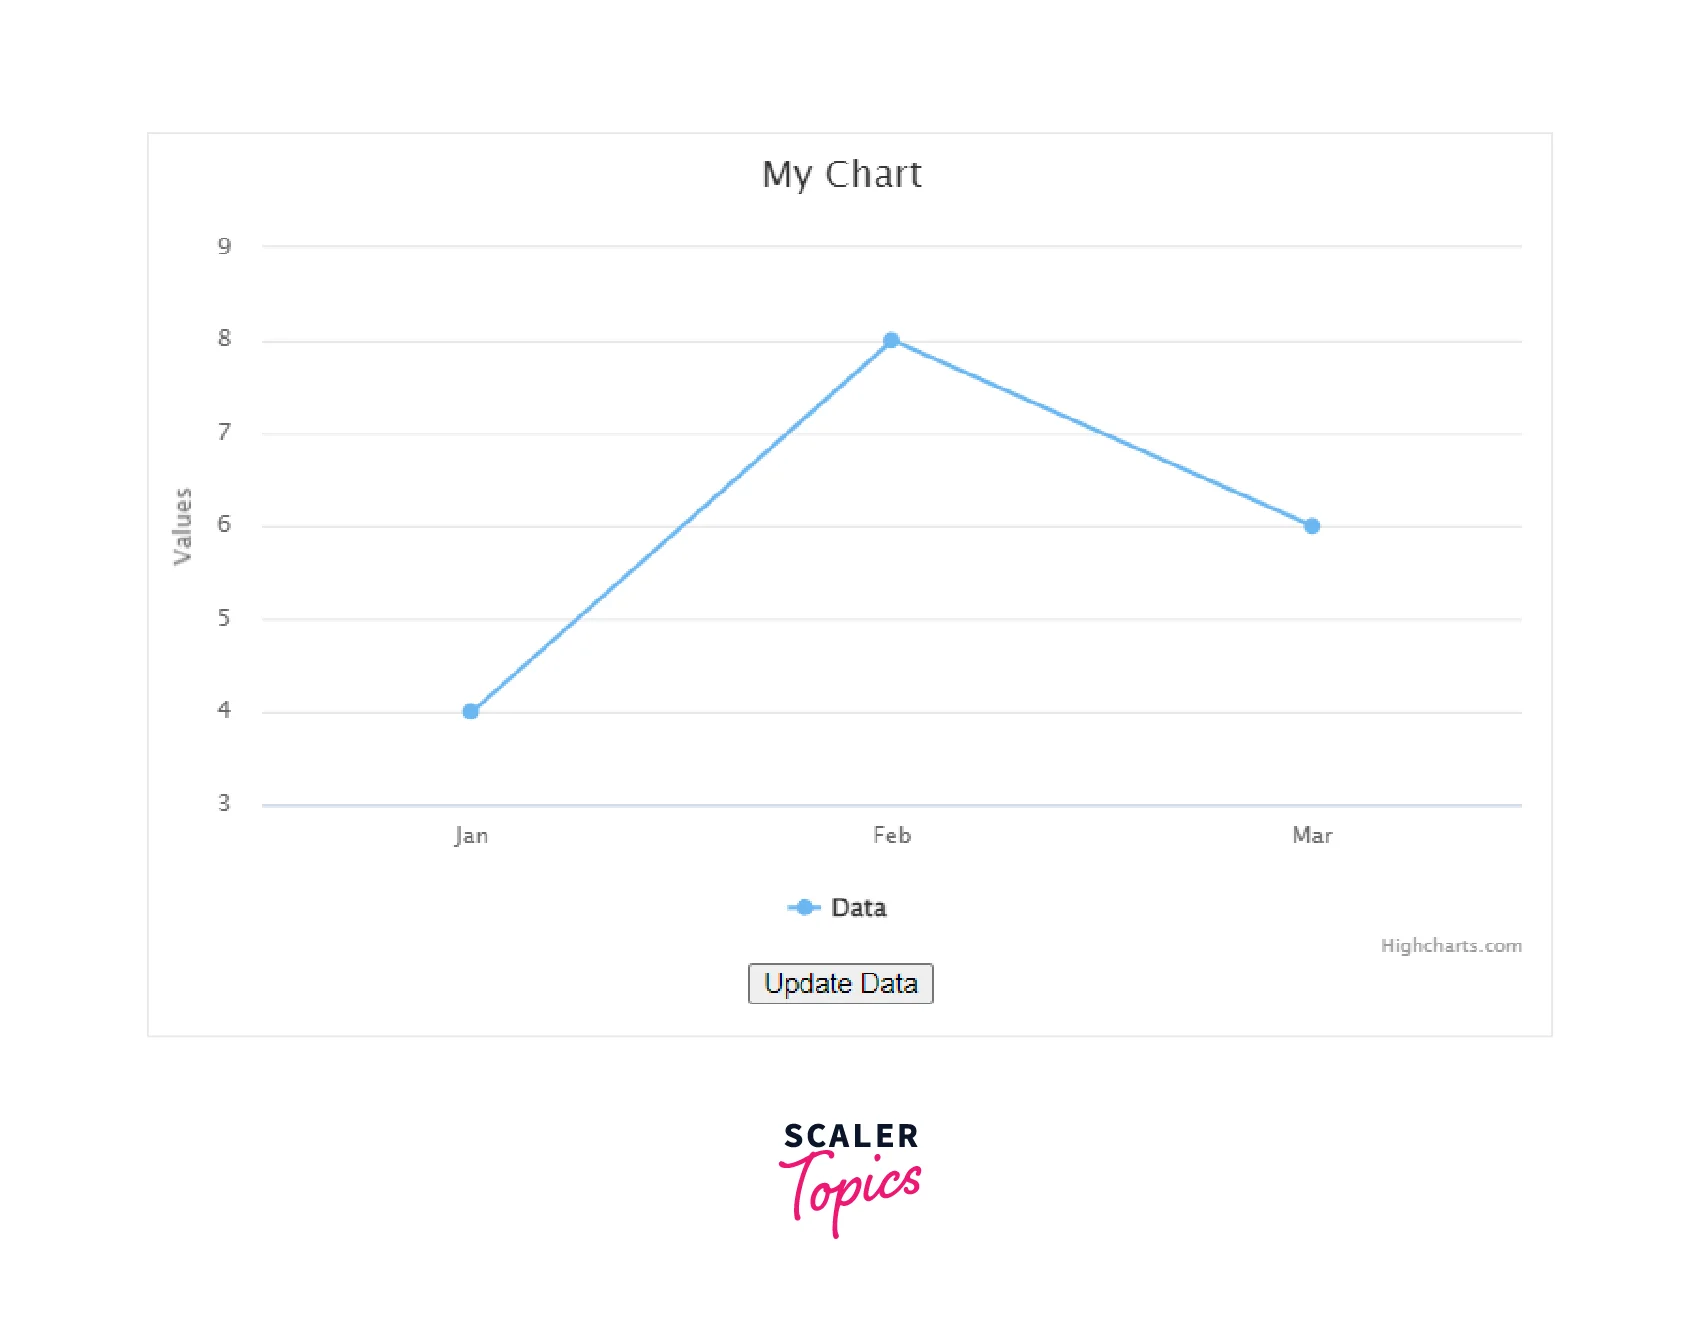
This will generate a line graph and a button to change data as :
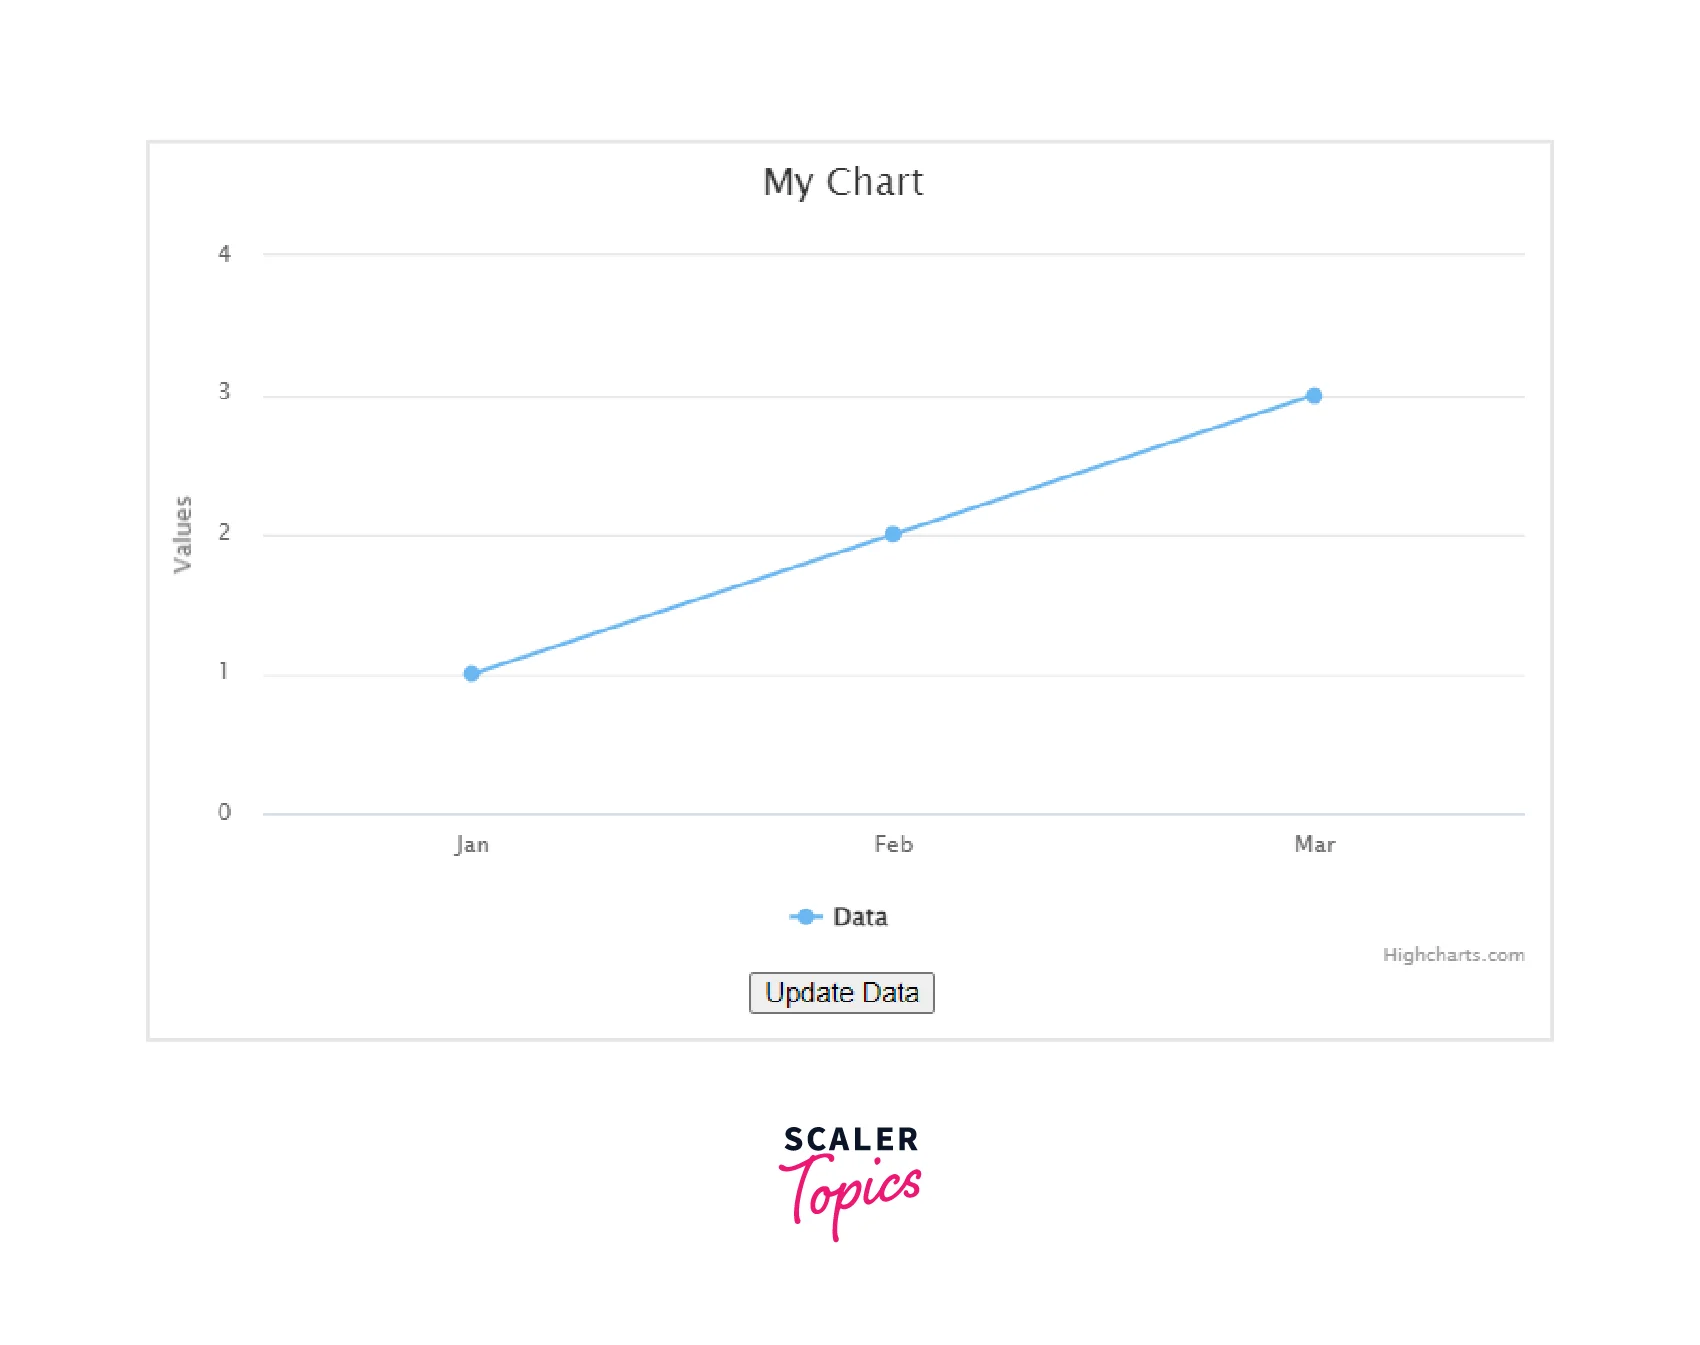
the chart's data is stored in the component's state and the button is used to update the data when the user clicks on it. This will trigger a re-render of the component, and the chart will be updated with the new data.
Another way to update the chart is to use the update method provided by the Highcharts library. This method allows you to update the chart's options or data without triggering a re-render of the component.
Example with Custom Chart Component
Here is an example of how to create a custom chart component with React Highcharts:
[MyChart.js]
In this example, we create a custom chart component called CustomChart that takes in props for the title, data, x-axis categories, and series name. We use these props to configure the chart's options in the configuration object. We also create a ref and assign it to chartRef which we will use later to update the chart.
Once you've created the custom chart component as an object, you can use it in other React components by importing it and rendering it. Here is an example of how you can use the CustomChart component in another React component:
[Index.js]

Conclusion
In this article, we have learned about react highcharts, which include:
- what are react highcharts and their usage.
- Prerequisites of react highcharts.
- Installing react highcharts in our react app.
- What are various options, we can pass in highcharts.
- Some different ways to use react highcharts
- Creating a basic graph using highcharts in react.
- Using highcharts react in NextJS.
- Implementing react highcharts in Typescript.
- Optimal way to update data in react highcharts.
- Creating a custom chart component and using it in our react app.