What is Regression in Data Mining?
What is Regression in Data Mining?
- Regression in data mining is a statistical technique that is used to model the relationship between a dependent variable and one or more independent variables. The goal is to predict the value of the dependent variable based on the values of the independent variables. The dependent variable is also called the response variable, while the independent variable(s) is also known as the predictor(s).
- For example, let's say we want to predict the price of a house based on its size, number of bedrooms, and location. In this case, price is the dependent variable, while size, number of bedrooms, and location are the independent variables. By analyzing the historical data of houses with similar characteristics, we can build a regression model that predicts the price of a new house based on its size, number of bedrooms, and location.
- There are several types of regression models, including linear regression, logistic regression, and polynomial regression. Linear regression in data mining is the most commonly used type, which assumes a linear relationship between the independent and dependent variables. However, nonlinear relationships may exist between the variables in some cases, which can be captured using nonlinear regression models.
Types of Regression Techniques
There are several types of techniques used for regression in data mining and statistical analysis. Some of the most commonly used regression techniques are mentioned below -
Linear Regression
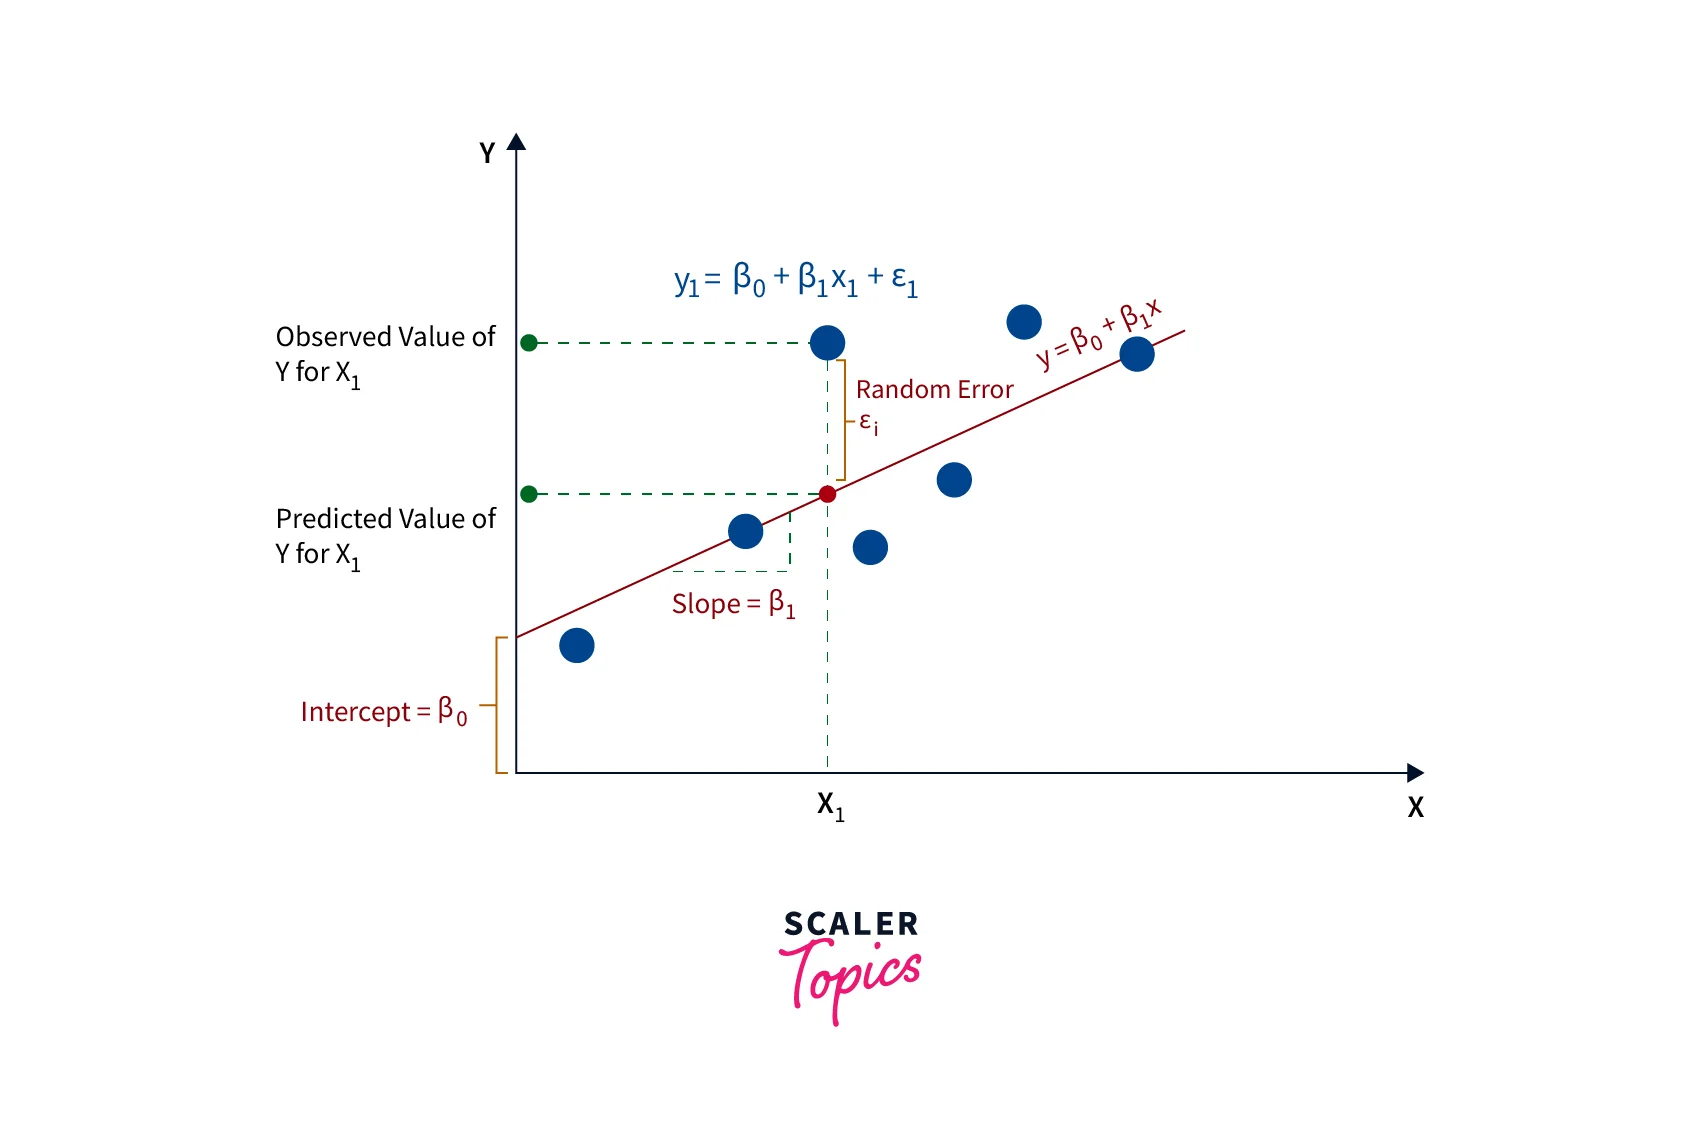
Linear regression in data mining is a statistical technique used to model the relationship between a dependent variable and one or more independent variables, assuming a linear relationship between them. The goal is to find the best-fit line that minimizes the distance between the observed and predicted values.
The equation of a simple linear regression model is - , where is the dependent variable, is the independent variable, is the intercept, is the slope, is the error term. The slope () represents the change in the dependent variable for every one-unit change in the independent variable, while the intercept () represents the value of the dependent variable when the independent variable is zero. The parameters of the linear regression model are estimated using the least squares method, which minimizes the sum of the squared differences between the observed and predicted values. Linear regression in data mining can also be extended to multiple linear regression, where there are multiple independent variables.
Logistic Regression
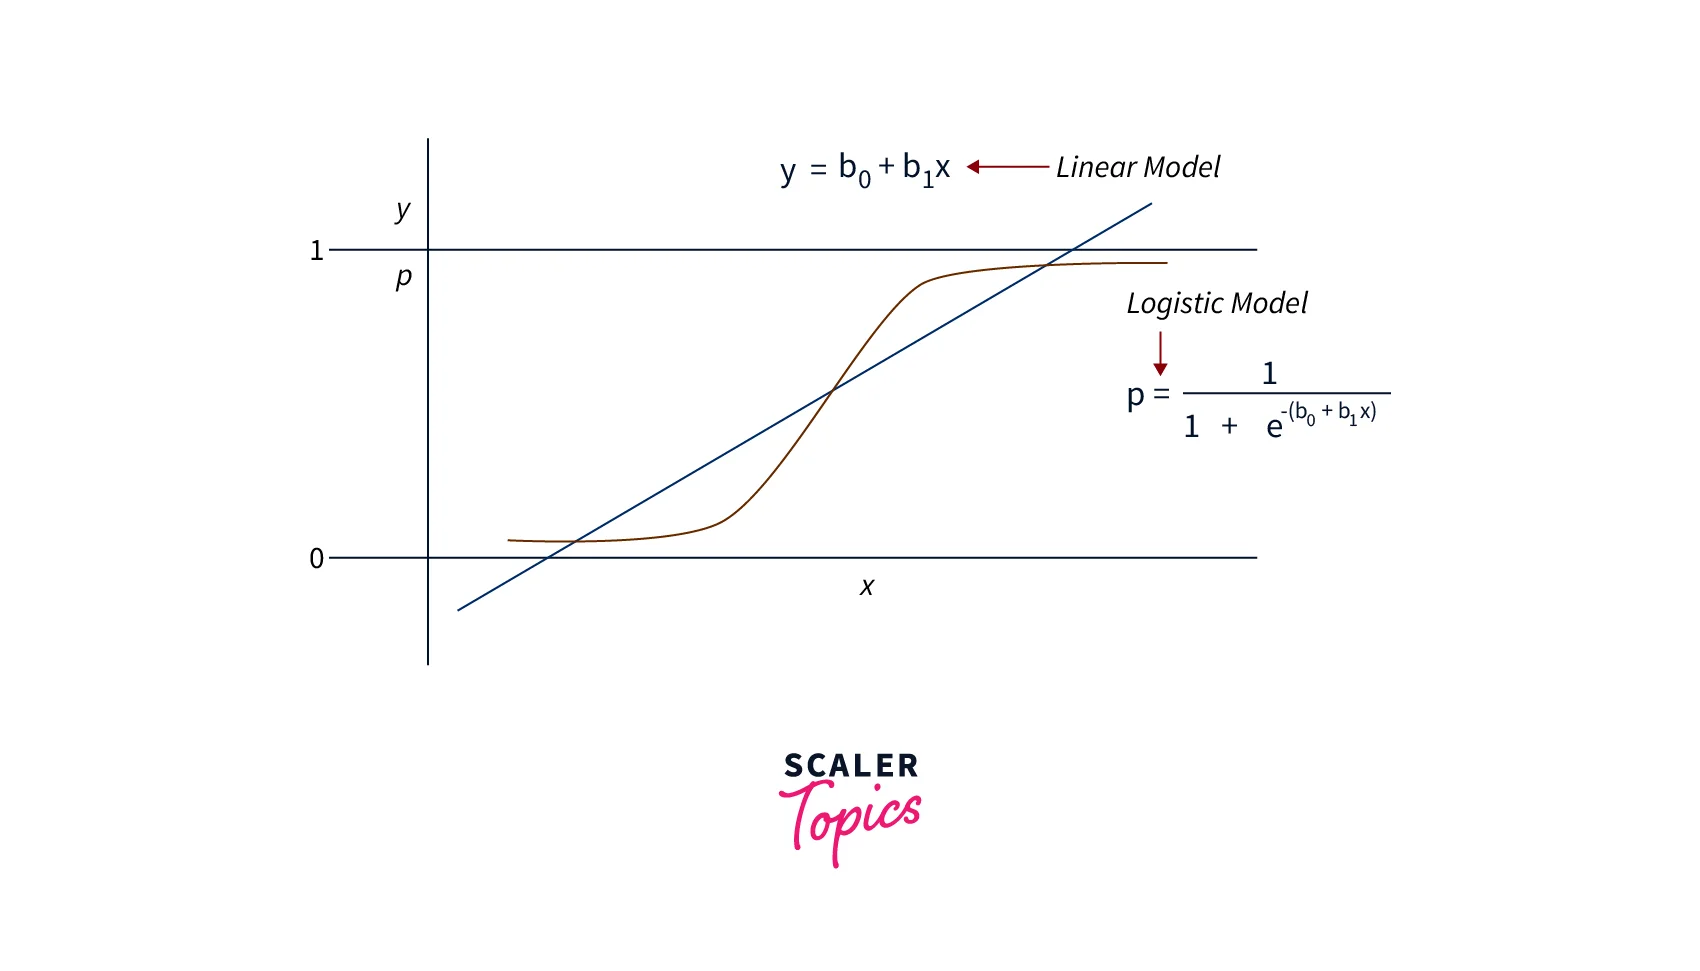
Logistic regression in data mining is a statistical technique used to model the relationship between a binary or categorical dependent variable and one or more independent variables. The goal is to predict the probability of the dependent variable taking a particular value based on the values of the independent variables.
The logistic regression model uses the logistic function to model the relationship between the independent variables and the dependent variable. The logistic function transforms the output of the linear regression model to a value between 0 and 1, representing the probability of the dependent variable taking a particular value.
The equation of a logistic regression model is - , where is the probability of the dependent variable taking a particular value, is the linear combination of the independent variables and their coefficients, and is the exponential function. The parameters of the logistic regression model are estimated using the maximum likelihood method, which maximizes the likelihood of the observed data given the model.
Polynomial Regression
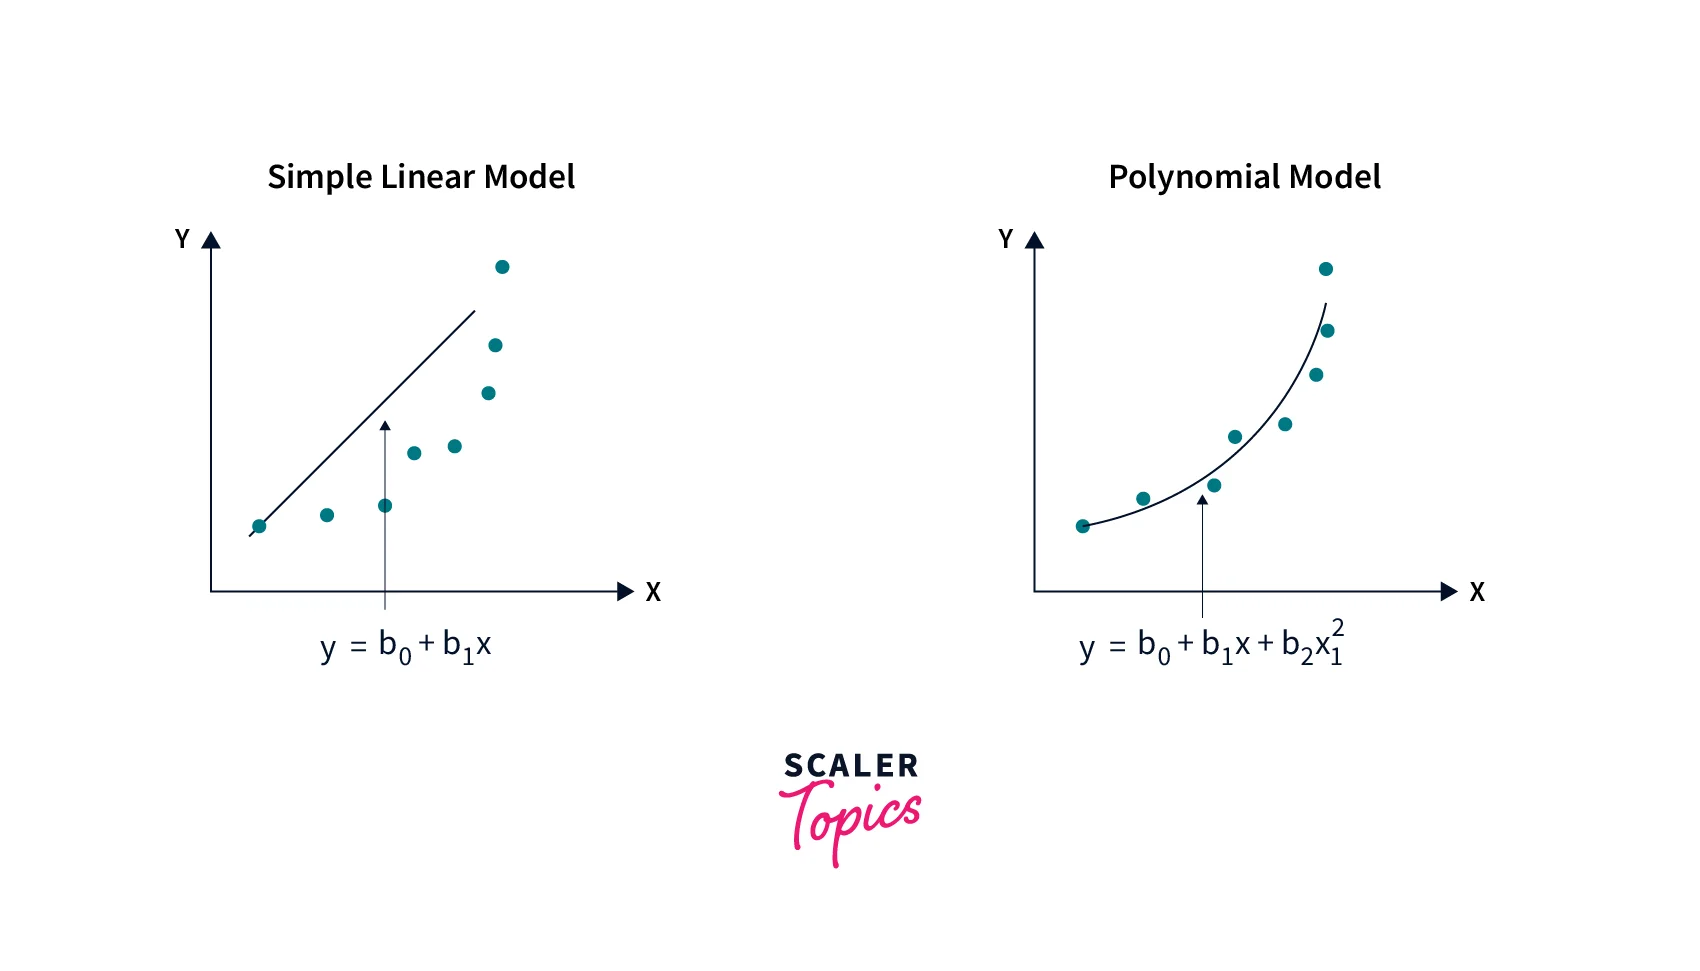
Polynomial regression in data mining is a statistical technique used to model the relationship between a dependent variable and one or more independent variables, assuming a polynomial relationship between them. In polynomial regression, the relationship between the independent and dependent variables is modelled as an nth-degree polynomial function. Polynomial regression in data mining is useful when the relationship between the independent and dependent variables is nonlinear, but a linear model is inadequate.
The equation of a polynomial regression model is - , where is the dependent variable, is the independent variable, are the coefficients of the polynomial, is the degree of the polynomial, and is the error term.
The degree of the polynomial determines the shape of the curve that fits the data, with higher degrees resulting in more complex curves. The parameters of the polynomial regression model are also estimated using the least squares method, which minimizes the sum of the squared differences between the observed and predicted values.
Lasso Regression
Lasso regression in data mining is a linear regression technique used for feature selection and regularization by adding a penalty term to the cost function. The penalty term is the L1 norm of the coefficients, which shrinks the coefficients towards zero and can result in some of them being exactly zero, effectively performing feature selection. The L1 norm of coefficients refers to the sum of the absolute values of the regression coefficients. The L1 norm is also known as the Manhattan norm. Lasso regression is useful when there are many independent variables, some of which are irrelevant or redundant.
Ridge Regression
Ridge regression in data mining is a linear regression technique used for regularization by adding a penalty term to the cost function. The penalty term is the L2 norm of the coefficients, which shrinks the coefficients towards zero but does not result in exact zeros, unlike Lasso regression. The L2 norm of coefficients refers to the square root of the sum of the squared values of the regression coefficients. The L2 norm is also known as the Euclidean norm. Ridge regression is useful when there is multicollinearity among the independent variables, which can lead to unstable and unreliable coefficient estimates.
Difference Between Regression, Classification and Clustering in Data Mining
Here is a tabular comparison of regression, classification, and clustering in data mining -
| Aspect | Regression | Classification | Clustering |
| Goal | To predict continuous values | To classify data into groups | To discover hidden patterns or groups in data |
| Output Variable Type | Continuous variable | Categorical variable | No output variable |
| Type of Algorithm | Supervised learning | Supervised learning | Unsupervised learning |
| Evaluation Metric | RMSE, MAE, R-square | Accuracy, precision, recall | SSE, Silhouette coefficient |
| Common Algorithms | Linear regression, Polynomial regression, etc. | Decision trees, SVM, random forest, etc. | K-means, K-medoids, etc. |
| Examples | Predicting house prices, predicting stock prices, etc. | Spam email detection, sentiment analysis, etc. | Customer segmentation, topical modelling, etc. |
Conclusion
- Regression in data mining is a powerful technique in data mining that allows us to predict or estimate the value of a dependent variable based on one or more independent variables.
- There are various types of techniques used for regression in data mining, including linear, polynomial, logistic, Lasso, and Ridge regression, each with its strengths and weaknesses.
- Regression in data mining is widely used in many fields, including finance, economics, marketing, healthcare, and social sciences, to uncover relationships between variables, make predictions, and inform decision-making.