How to Make Sales Report in Excel
Overview
A monthly sales report in Excel, which tracks, assesses, and examines sales patterns monthly, shows sales activity inside a corporation. Making a monthly sales report at the end of the month is essential for a sales manager. You've come to the correct place if you're seeking some tips and methods for creating an Excel monthly sales report that is simpler. Any field manager should consider learning how to create a sales report using common tools like Excel and PowerPoint as essential knowledge. When properly implemented, they give managers a basic degree of insight into a team's performance and let them know how close they are to reaching their sales objectives.
What are we building?
We are building a monthly sales report in Excel which consists of the following information:
- Daily sales earnings.
- Total number of sales in a month.
- Sales by product.
- Total number of sales in the month.
With this knowledge, managers can modify the sales process, formalize one-on-one coaching sessions with certain team members, or put together a presentation of the sales report for management.
Also, because the majority of organizations purchase the Microsoft Office 365 bundle, most of these products are (free). After you get the hang of using them, they are also fairly simple.
Pre-requisites
- Basic understanding of Excel.
- Basic knowledge of Data Analysis.
How are we going to build this?
Following are the steps that we would take in order to complete this report creation for sales report in Excel:
- Gathering all the data and putting it into a table
- Highlighting all the important data in the chart
- Generate weekly sales report
- Changing the forecasted revenue in order to check the change in the chart
- Adding numeric value to the target line in the chart
Final Output
Requirements
For this project, make sure you have a Microsoft Excel subscription.
Building the Monthly Sales Report in Excel
In this article, I'll walk you through two simple steps for creating a sales report in Excel.
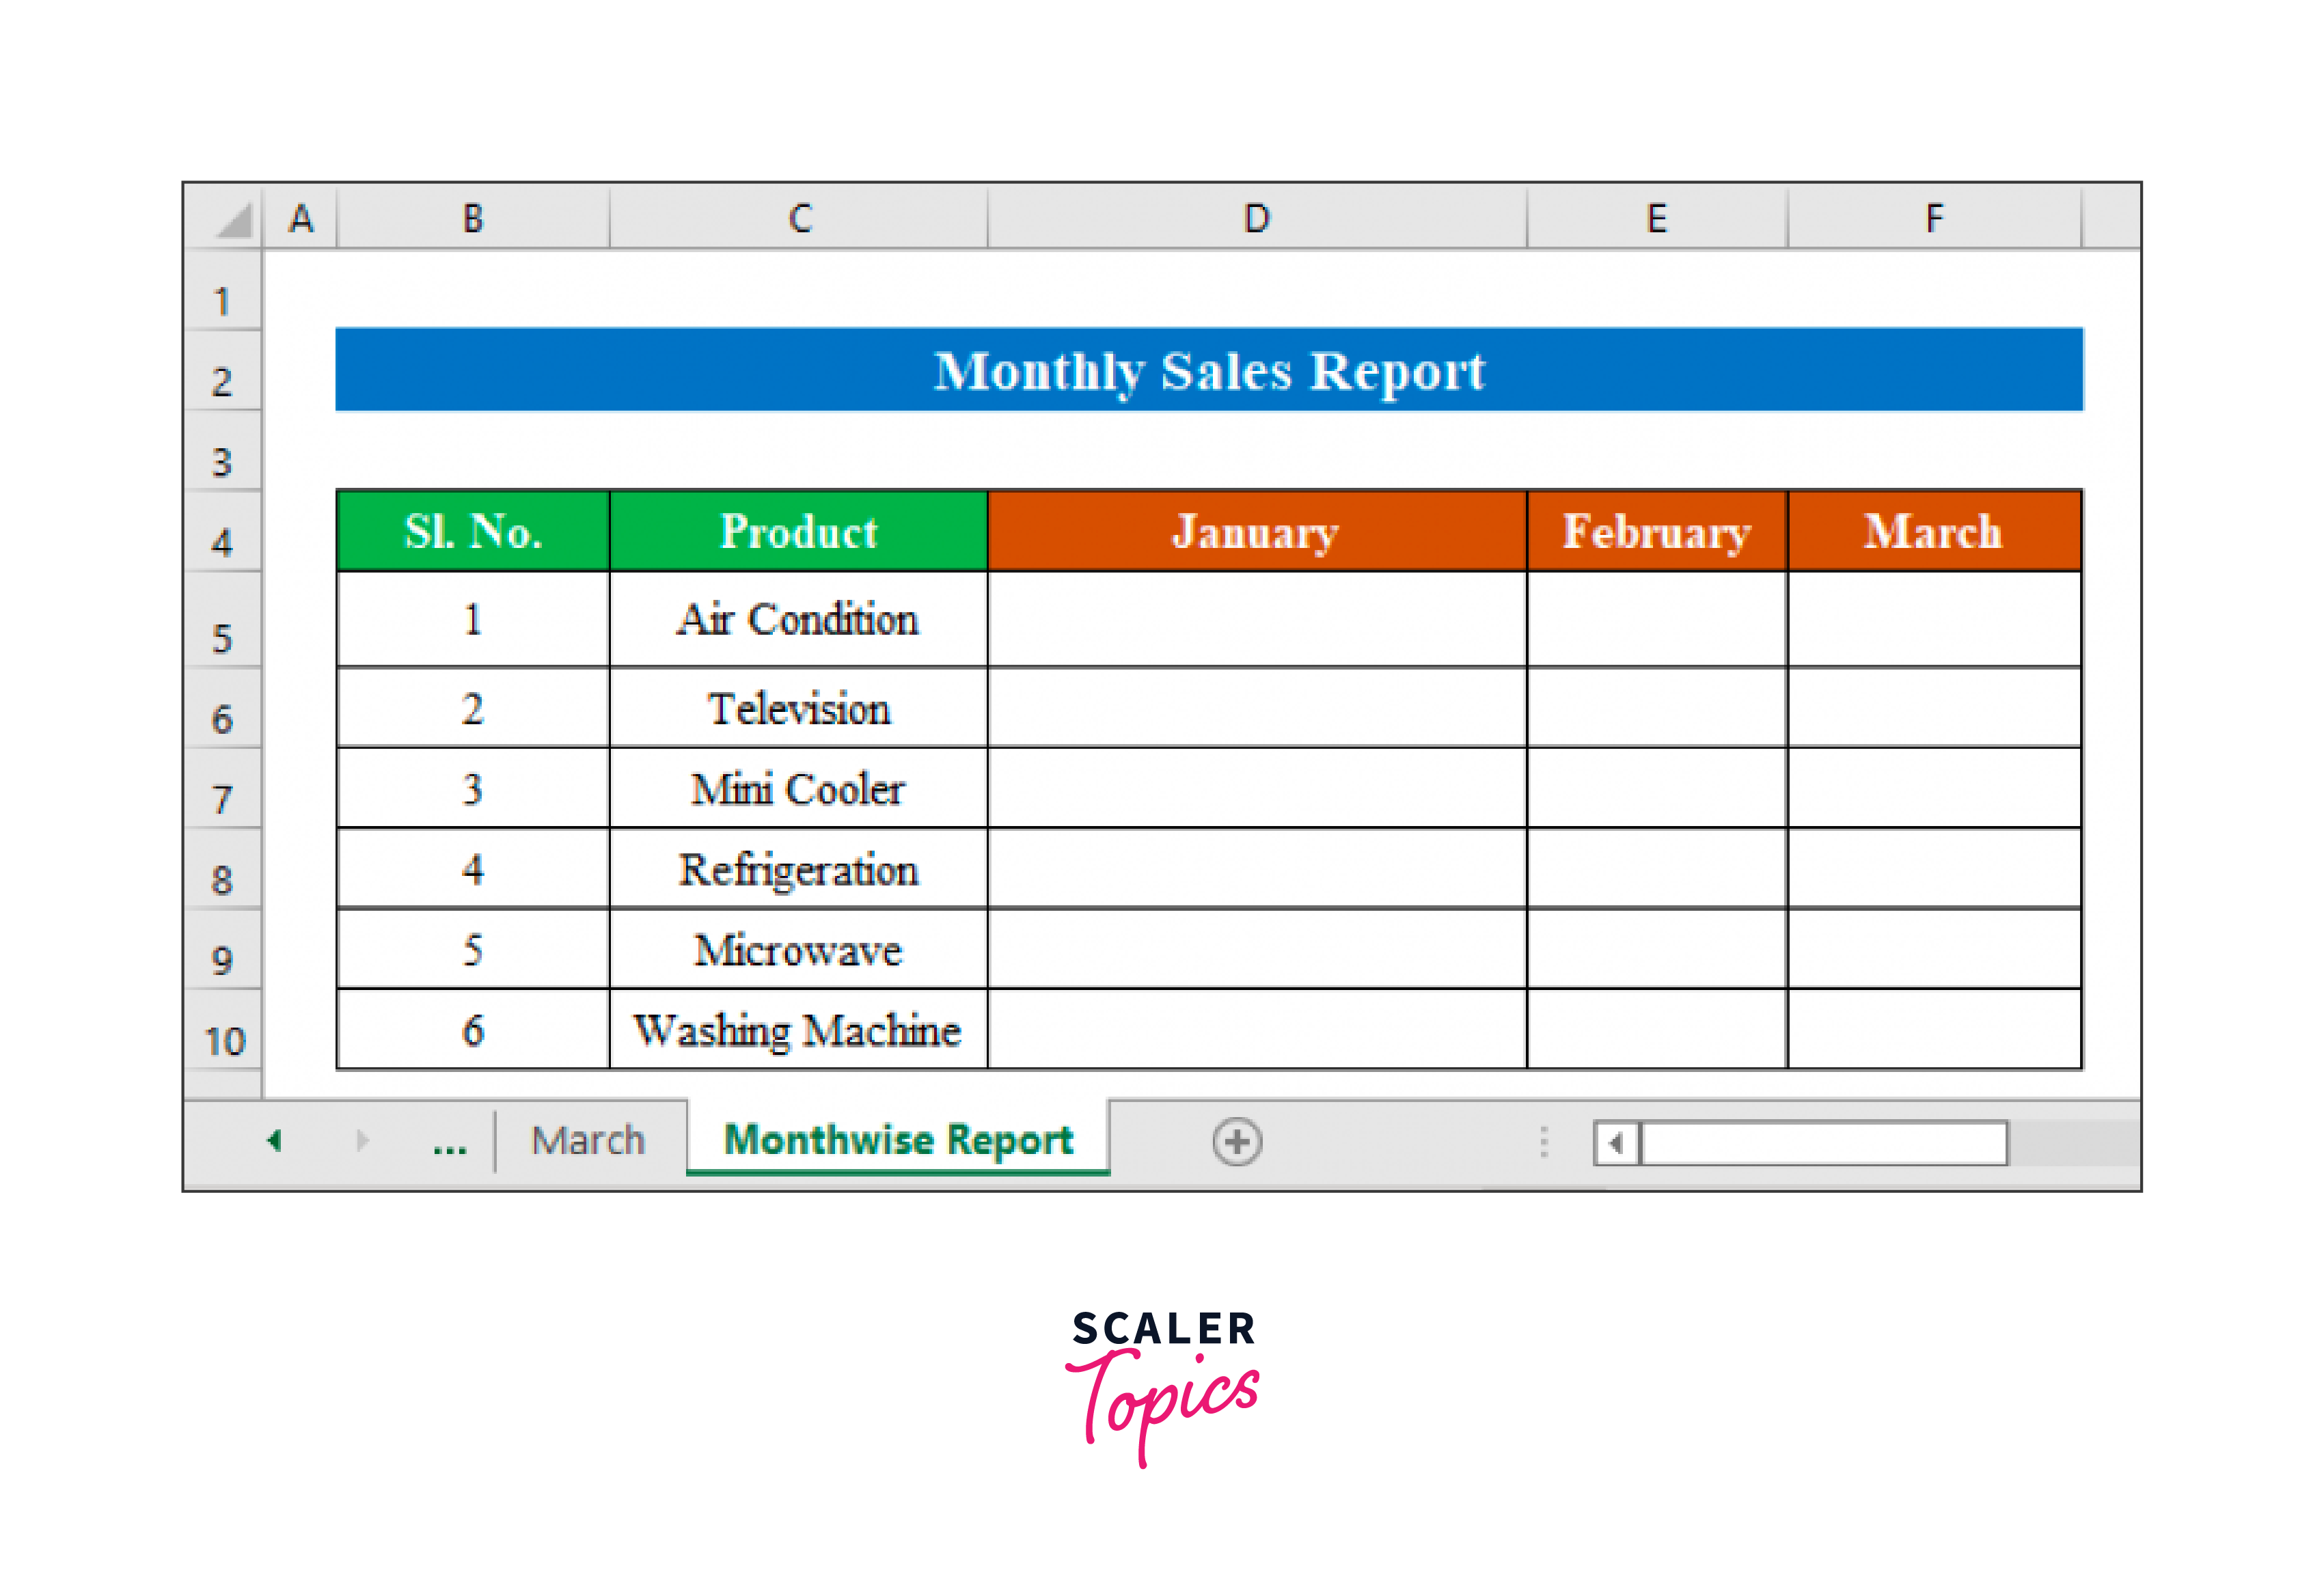
Let's say we have data on an electronics store. The sales for January, February, and March are broken out into separate sheets in the dataset. Now, using information from each sheet, we will compute the three months' worth of sales in a new sheet.
Get the Product Name from the Product List
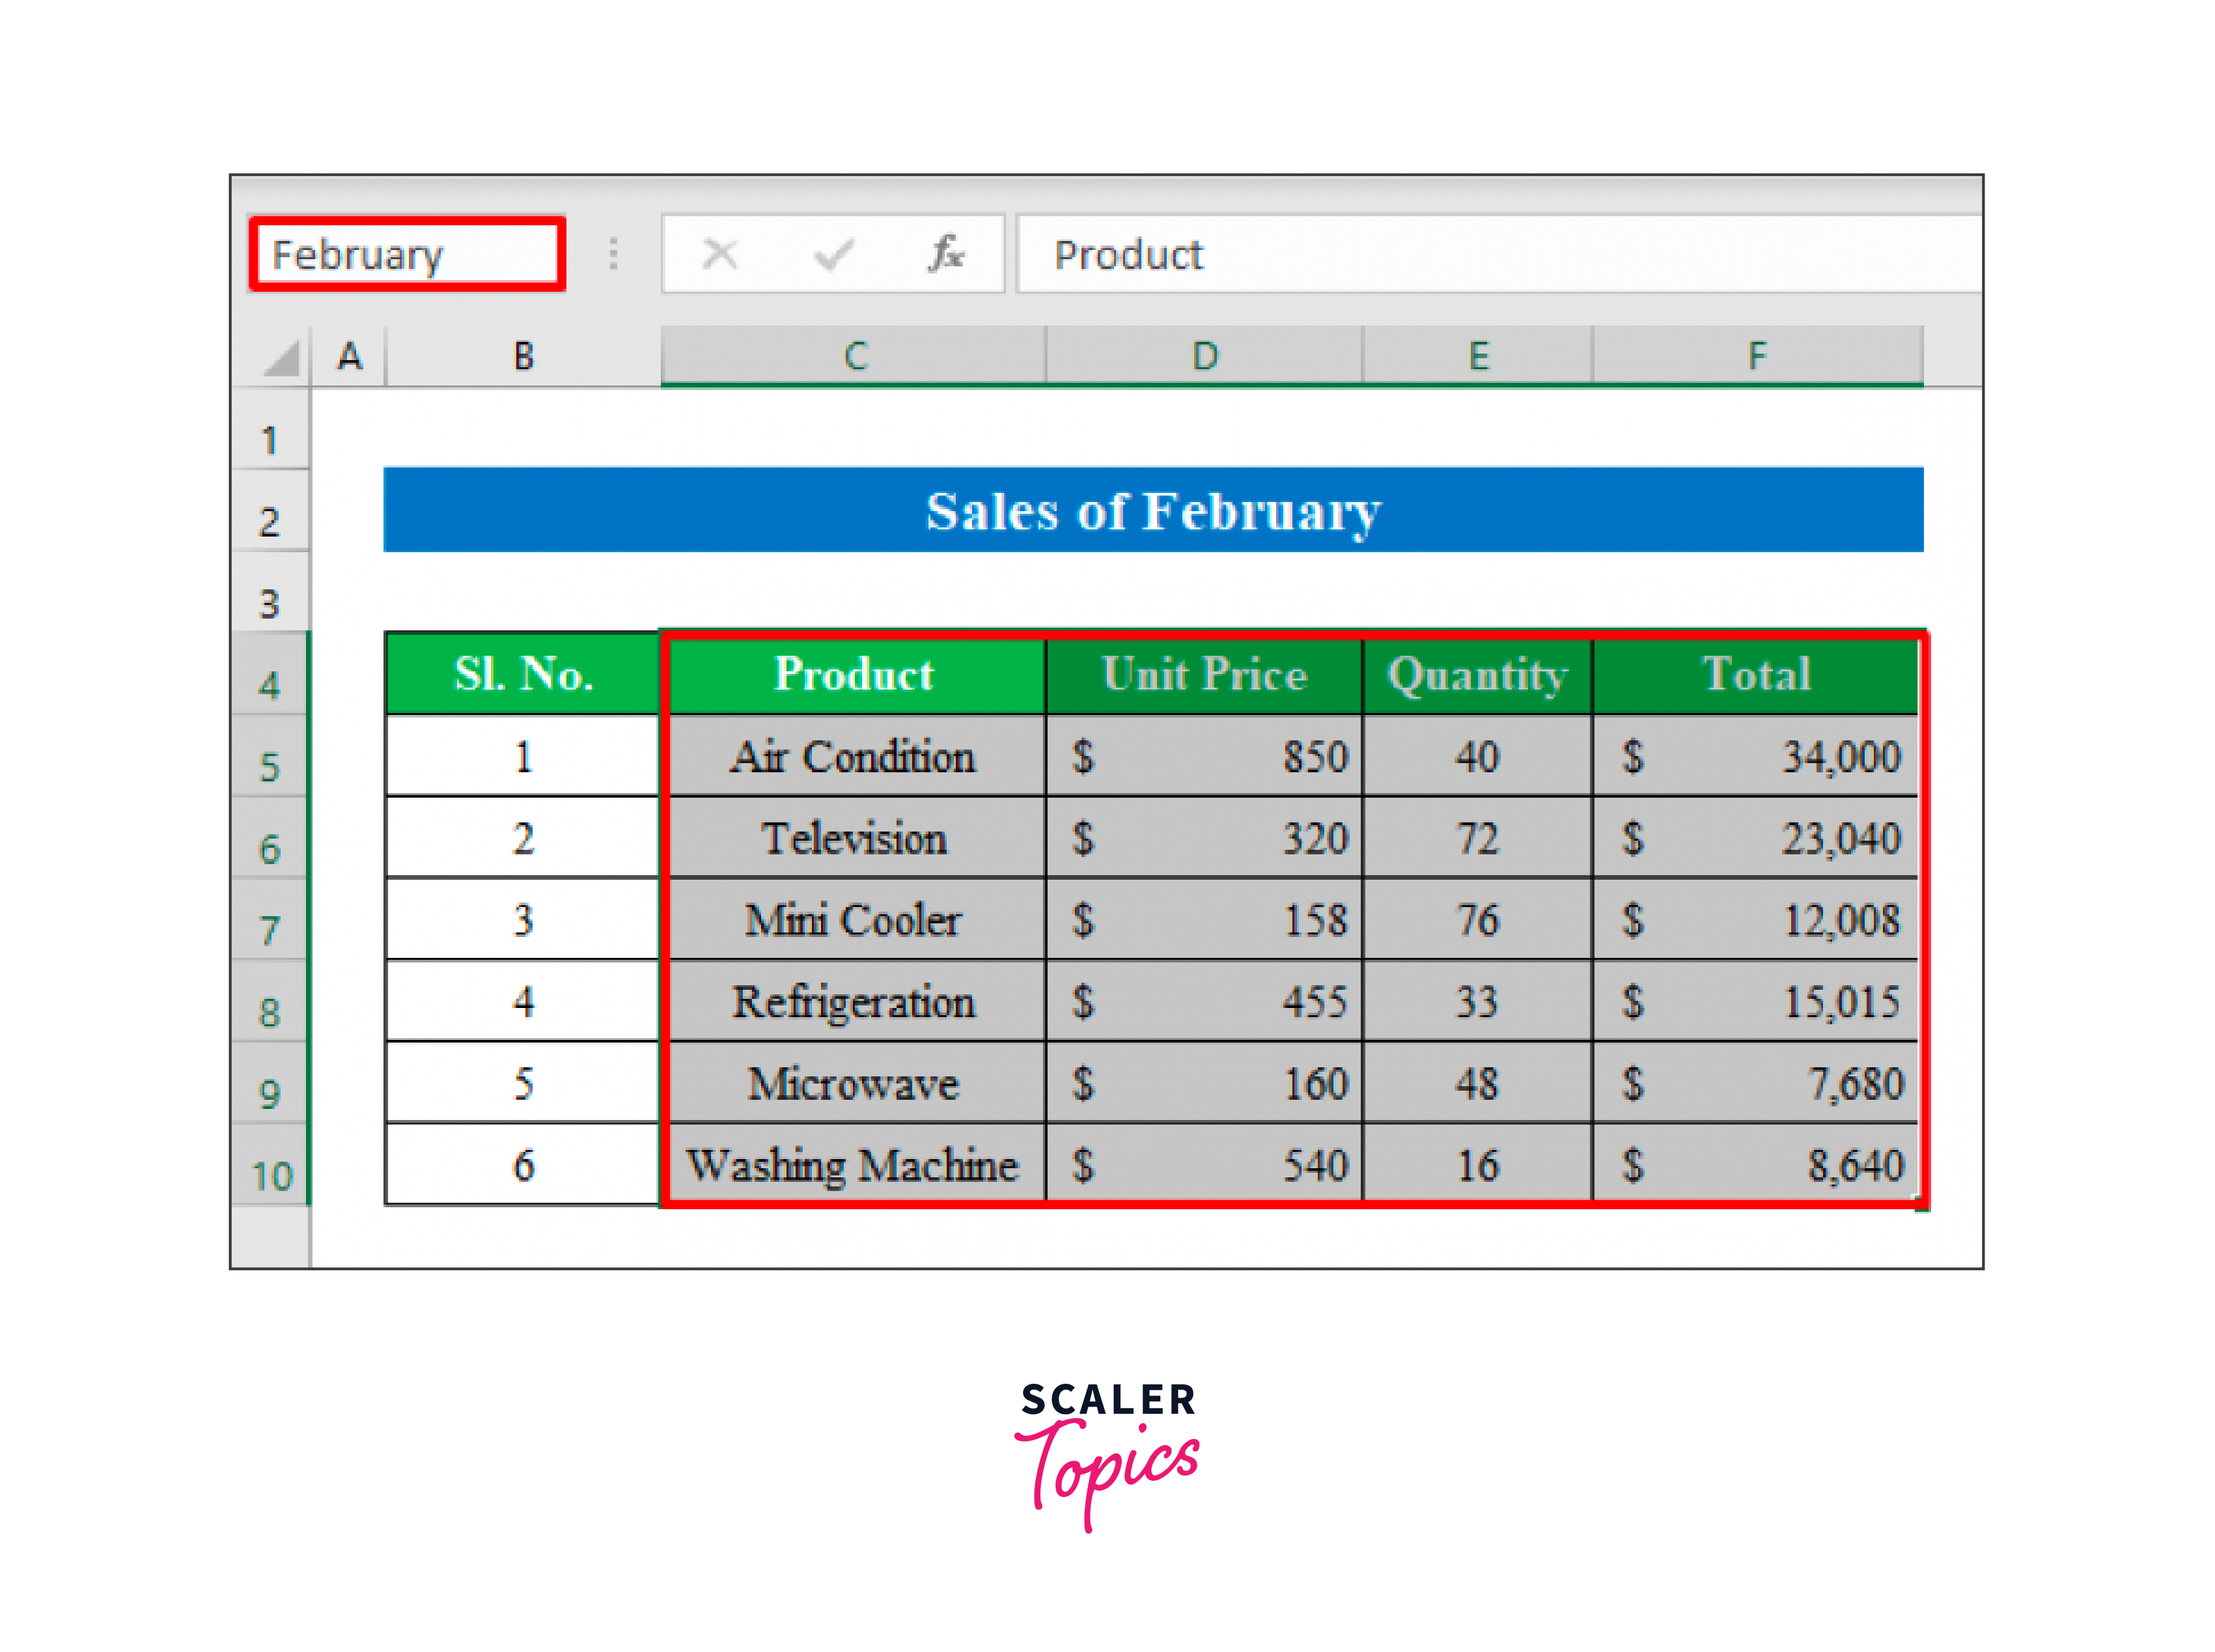
The first image displays sales for January, followed by those for February, and so on.
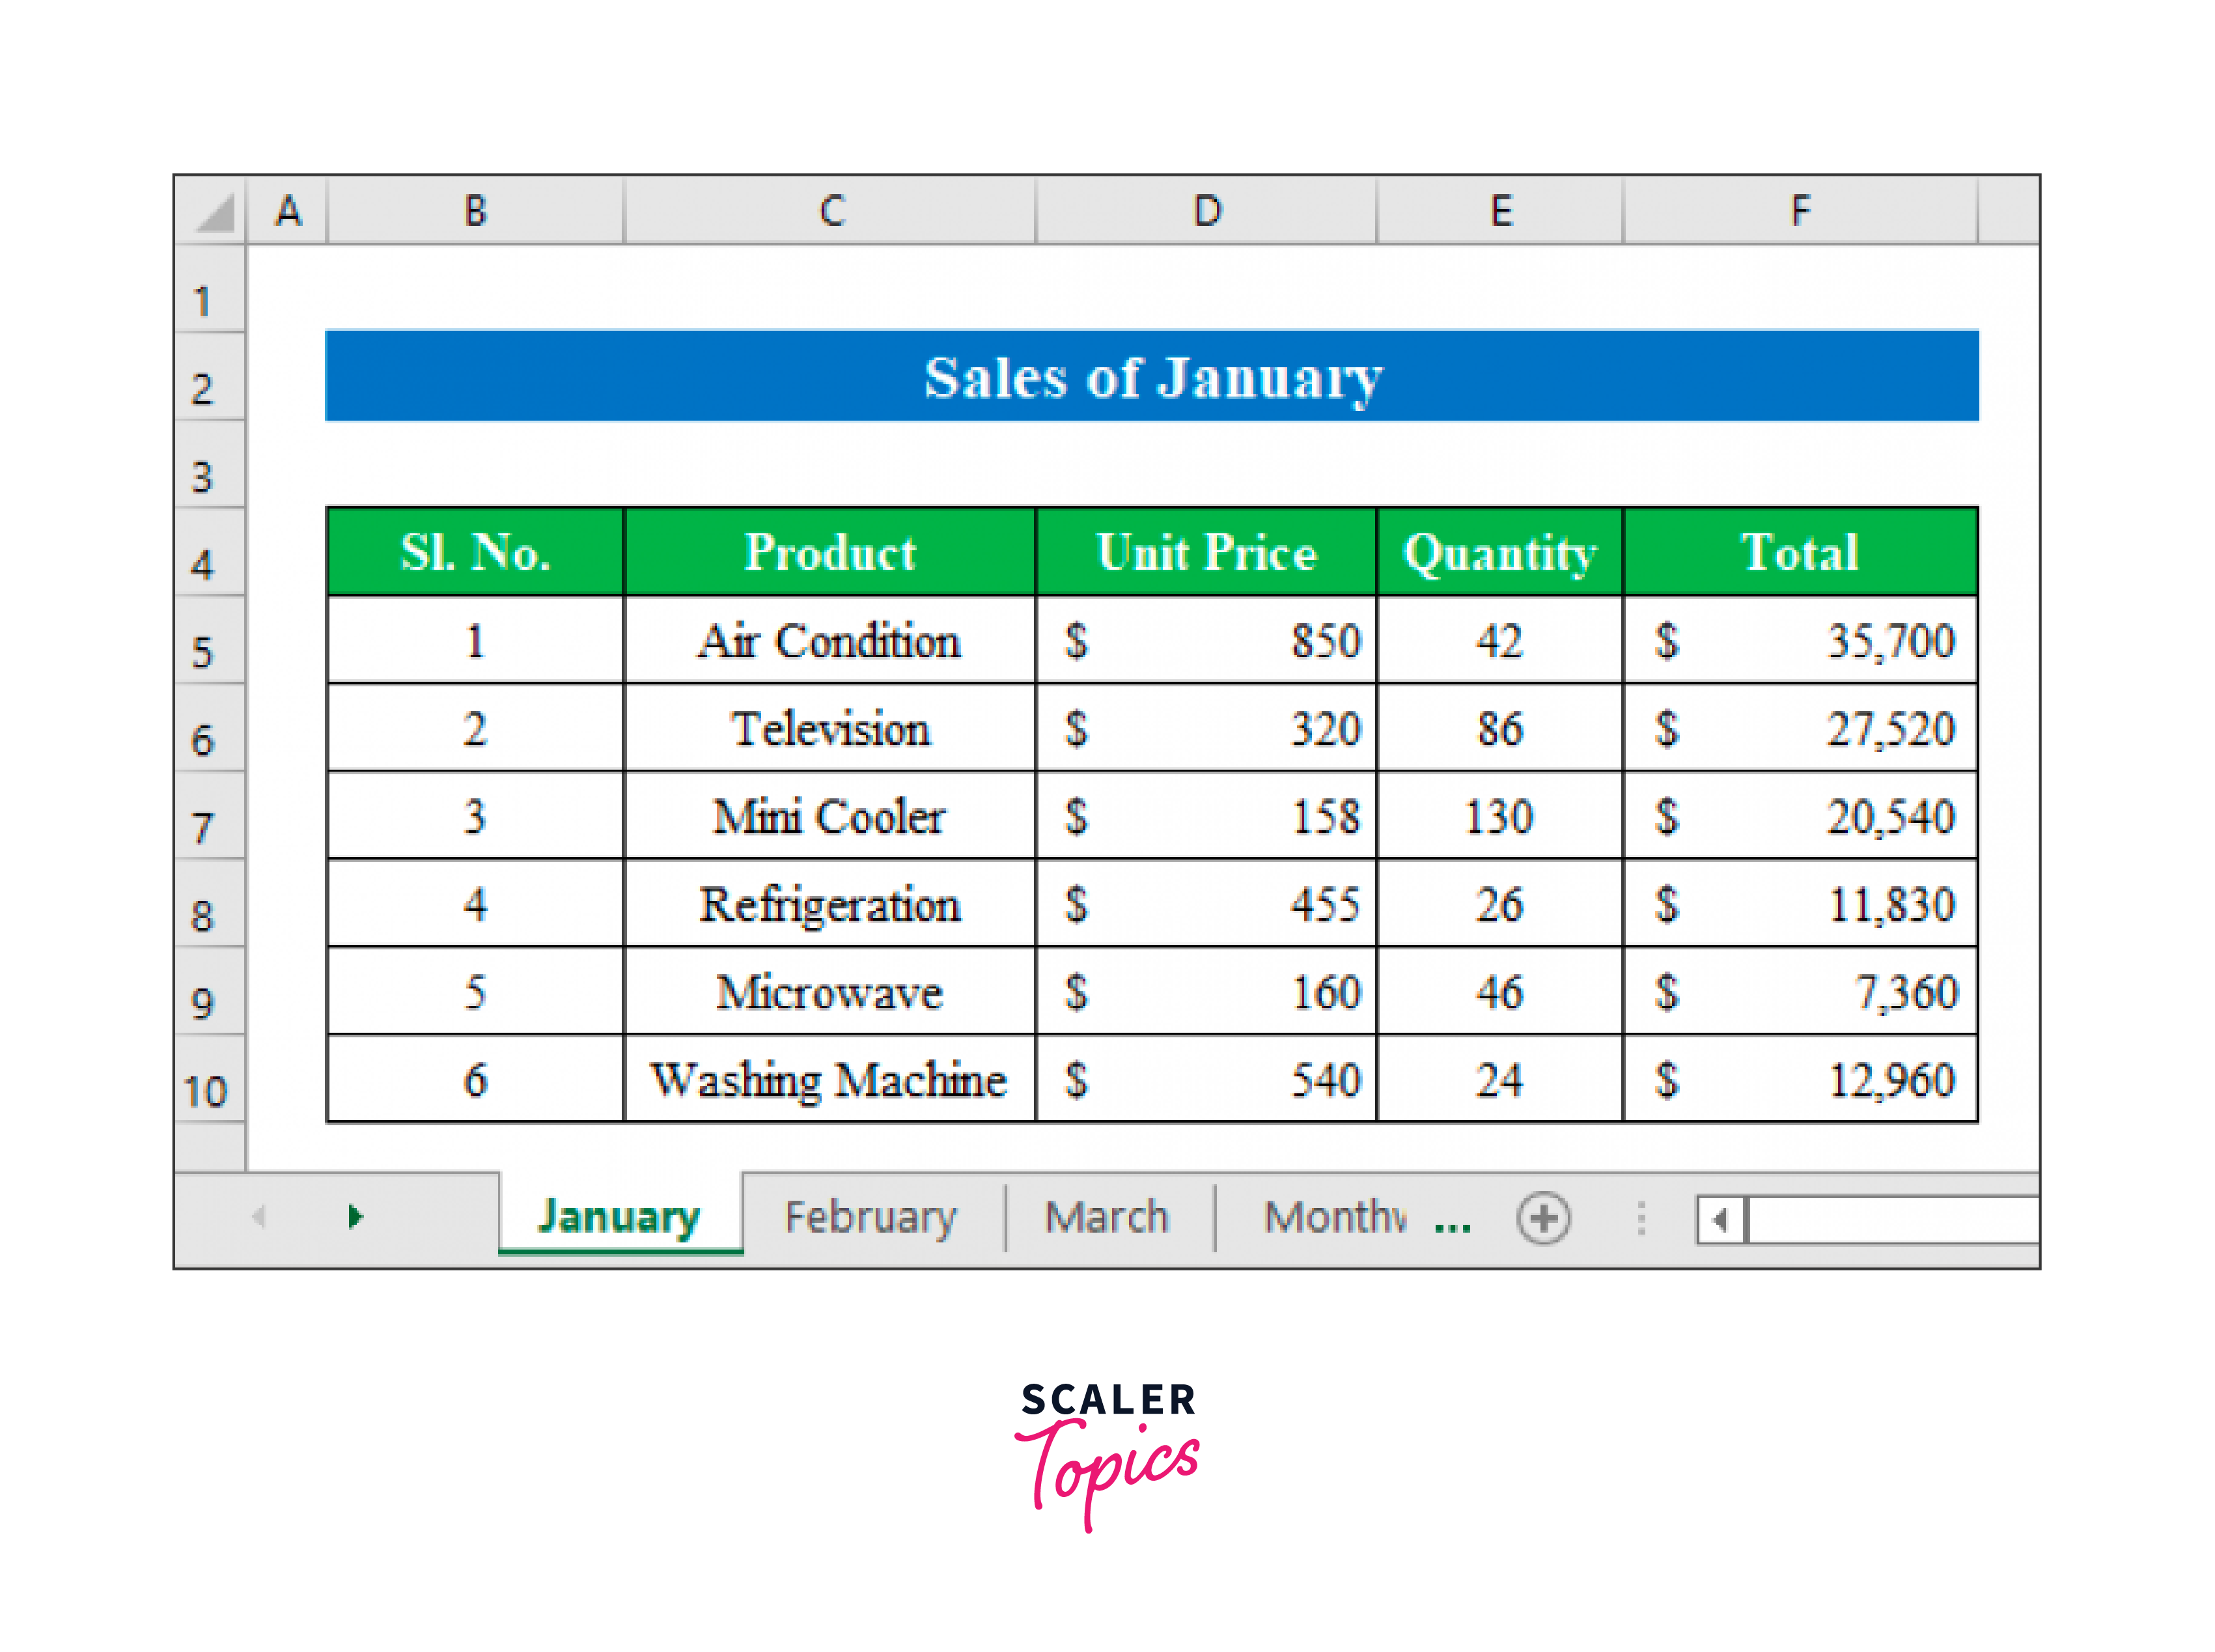
Find Out Unit Price in Sales Report
Every month, we used a fresh worksheet to determine the sales report in Excel for each item.
Calculate Total Sales of the Day
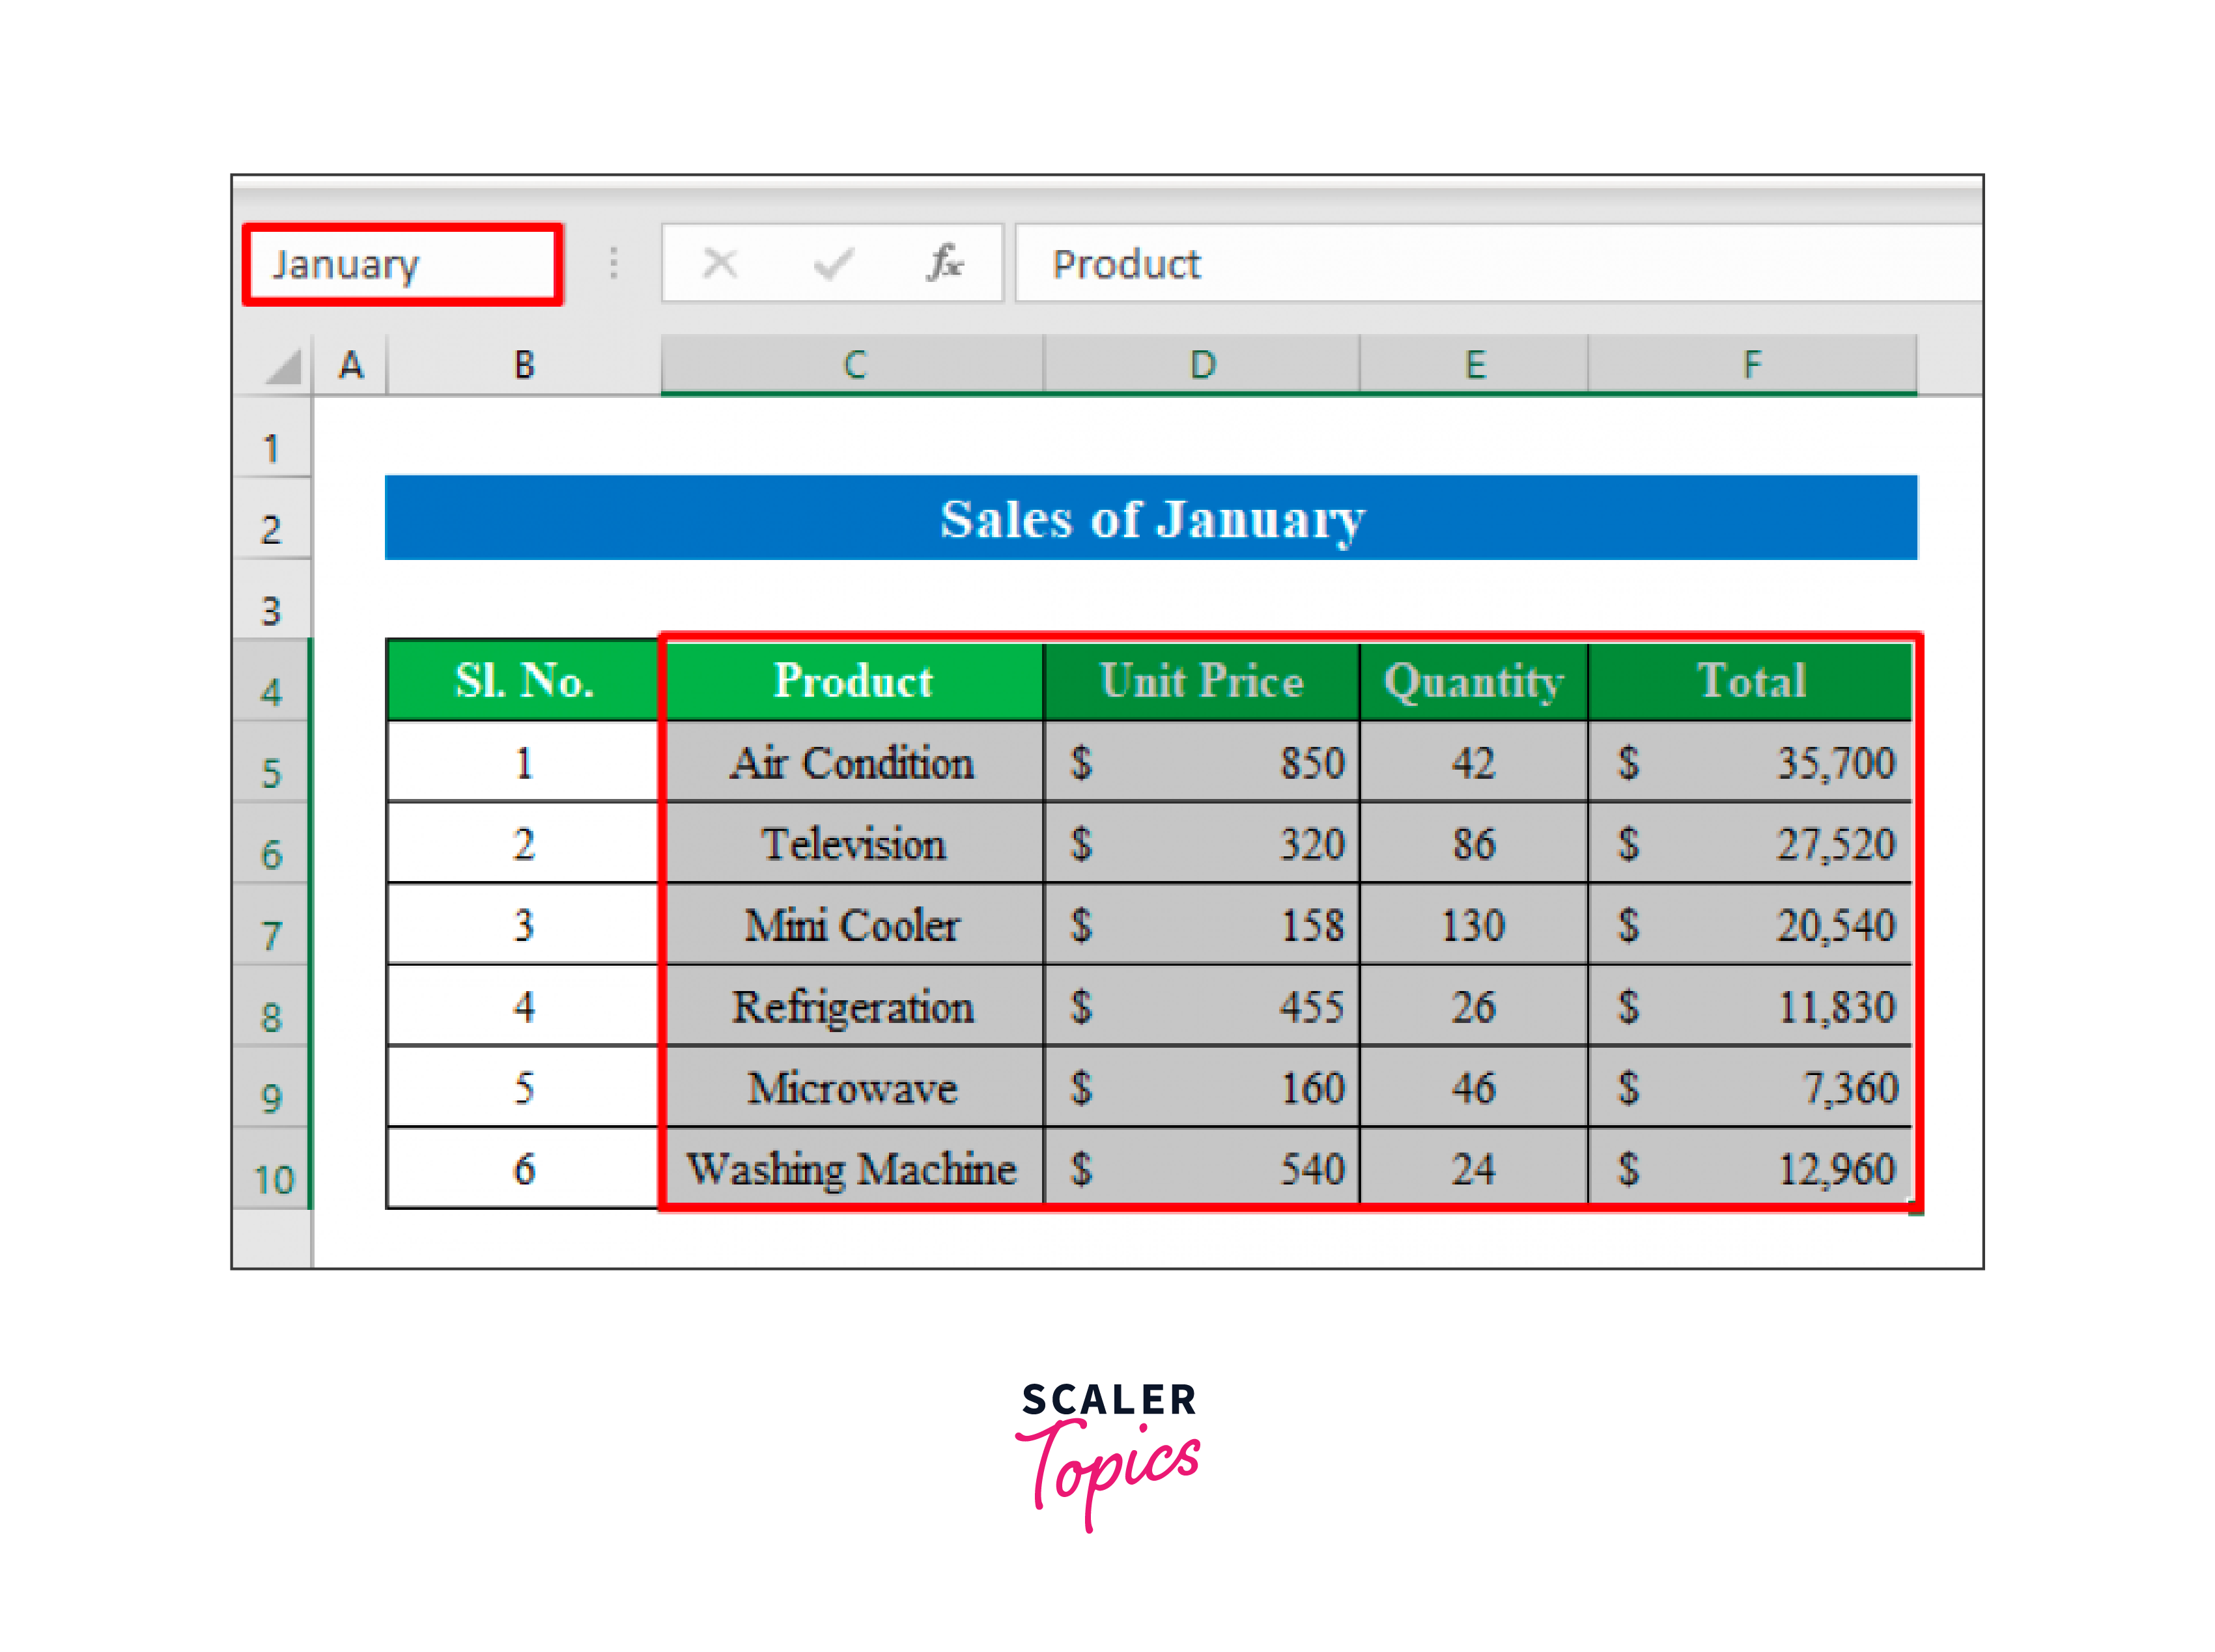
To make it easier to put the formula in the final sales report in Excel, you must first determine the range from each sheet.
Choose cells (C4
As we choose the data range from "Sales of January," type "January" in the name box while the data is being selected. To continue, use the Enter key.
Choose the data range on the following sheet. I've chosen cell here (C4
To proceed, enter "February" in the name field and hit Enter.
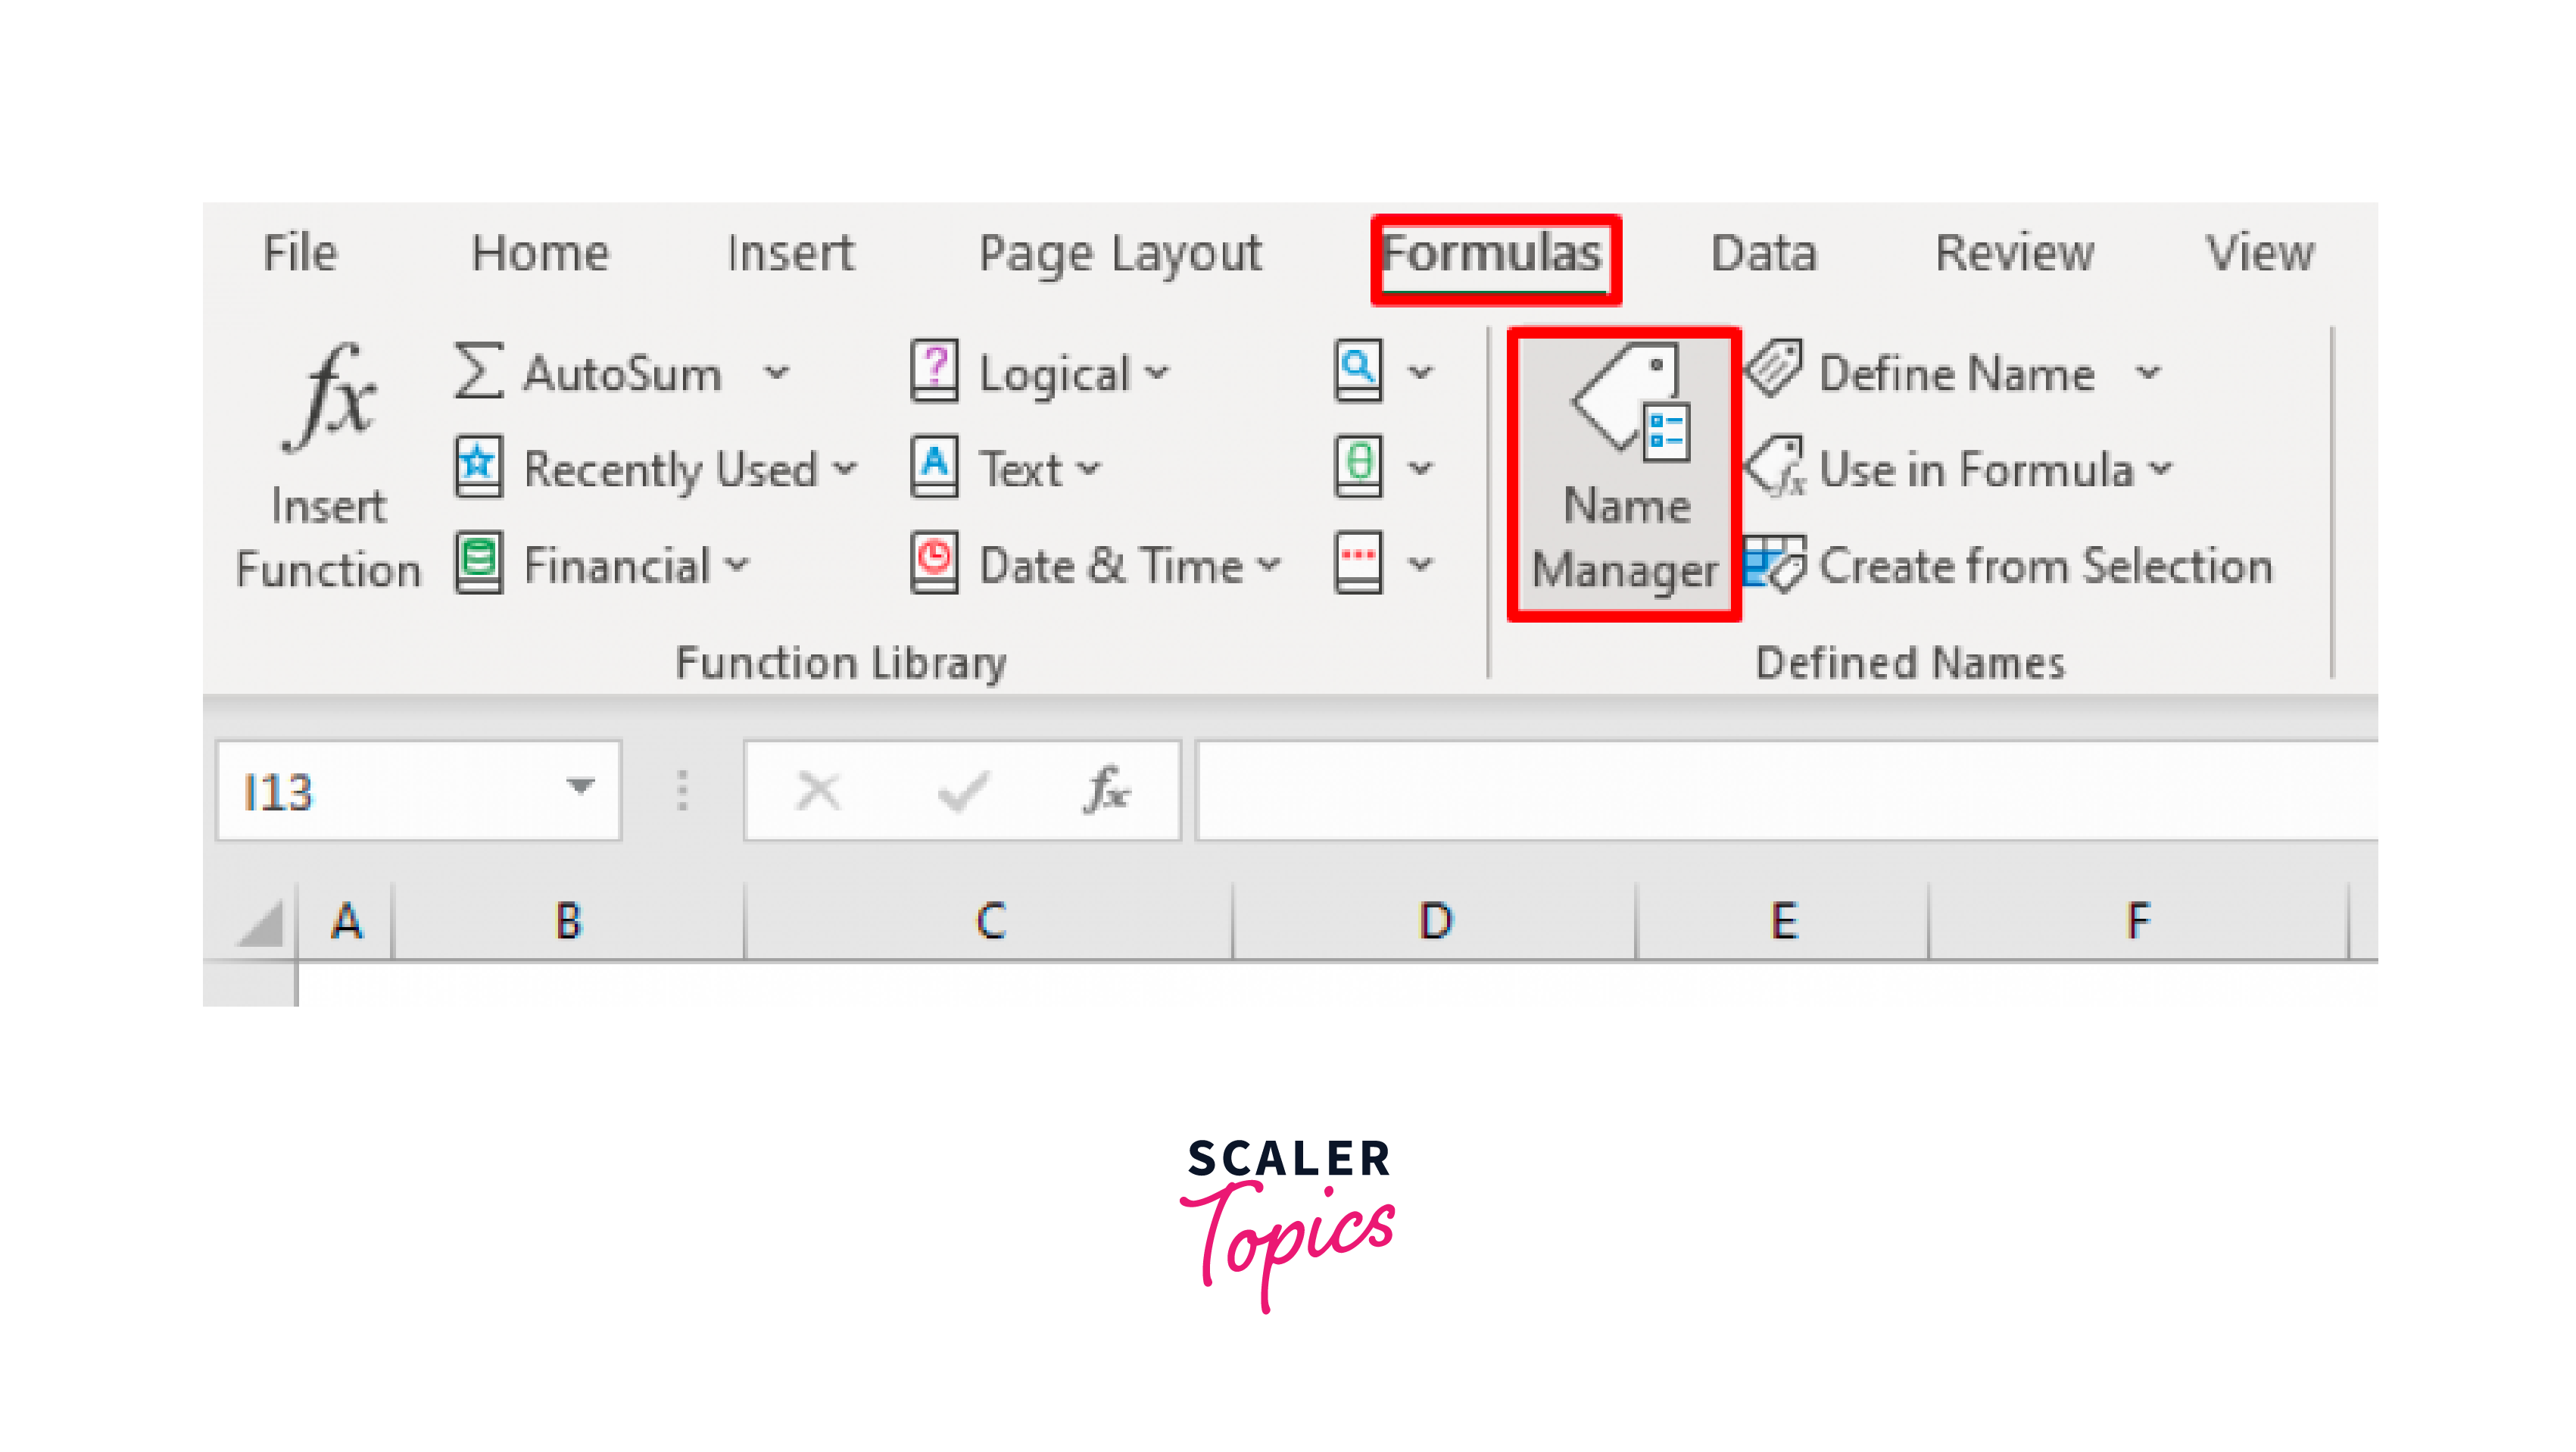
Go to the "Formulas" menu and select "Name Manager" to view or modify the specified range.
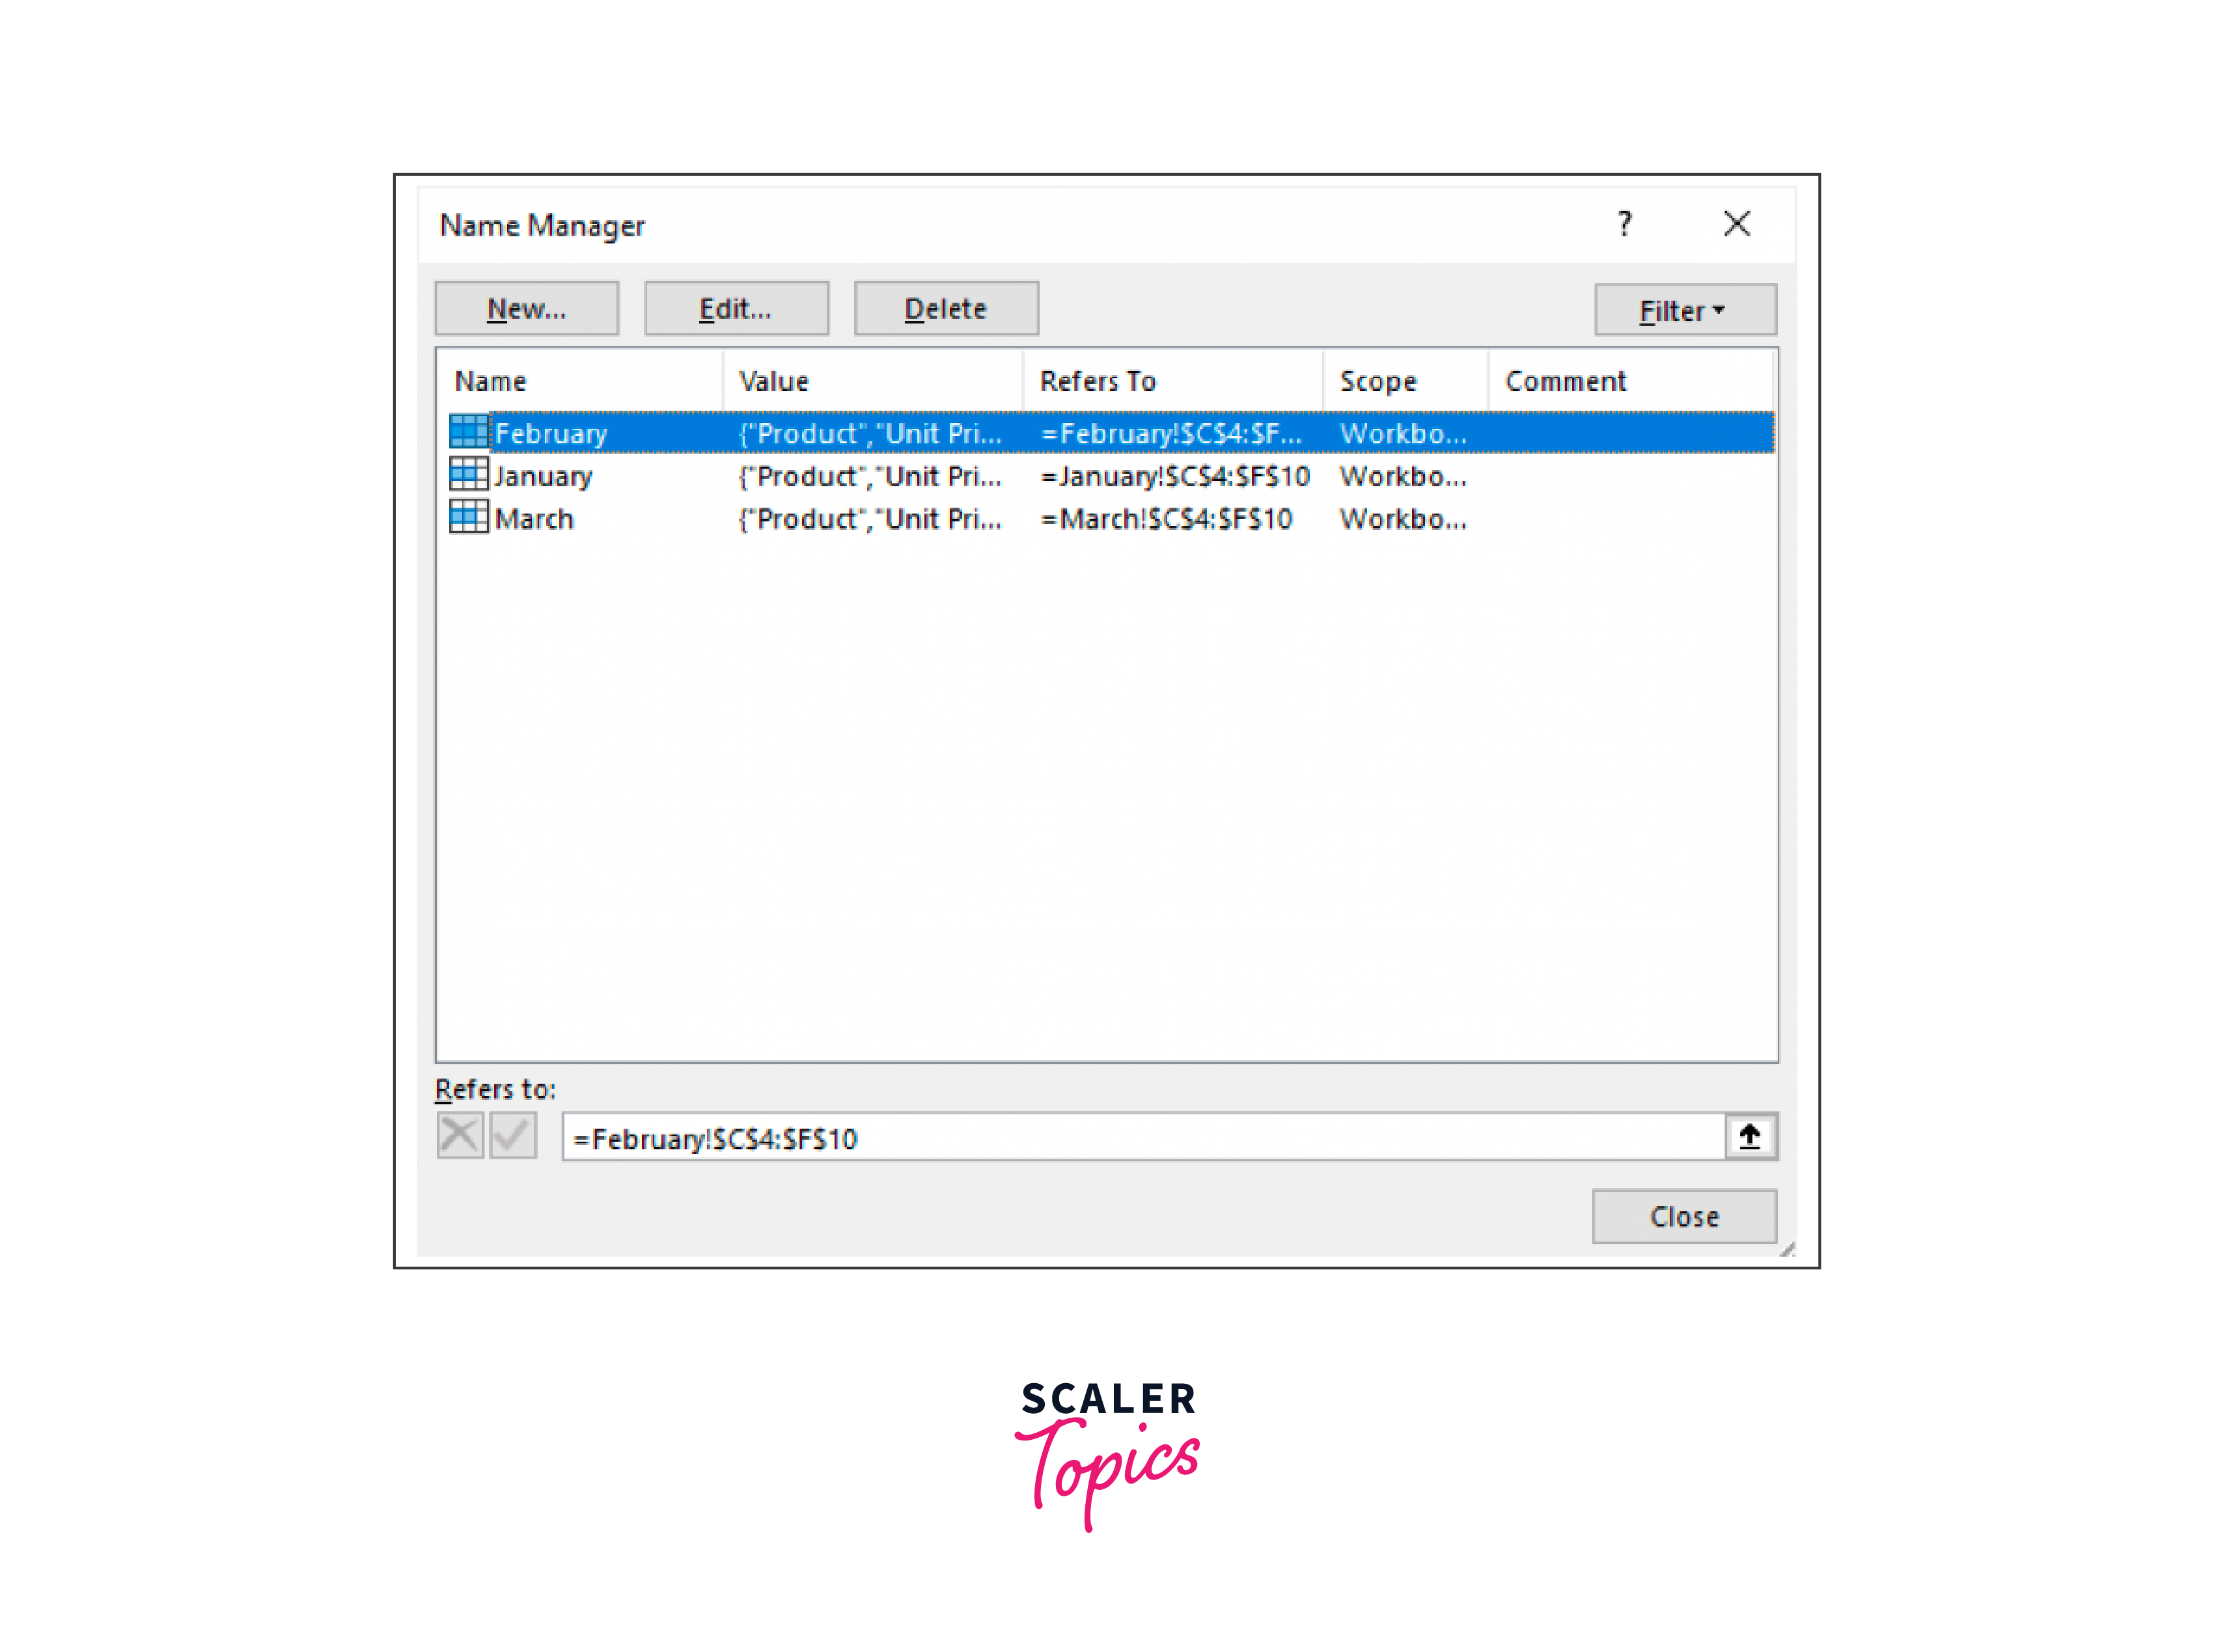
"Name Manager" will be the new window that opens. From this new window, you can change names or the range.
Calculate Monthly Sales of a Single Product in Excel
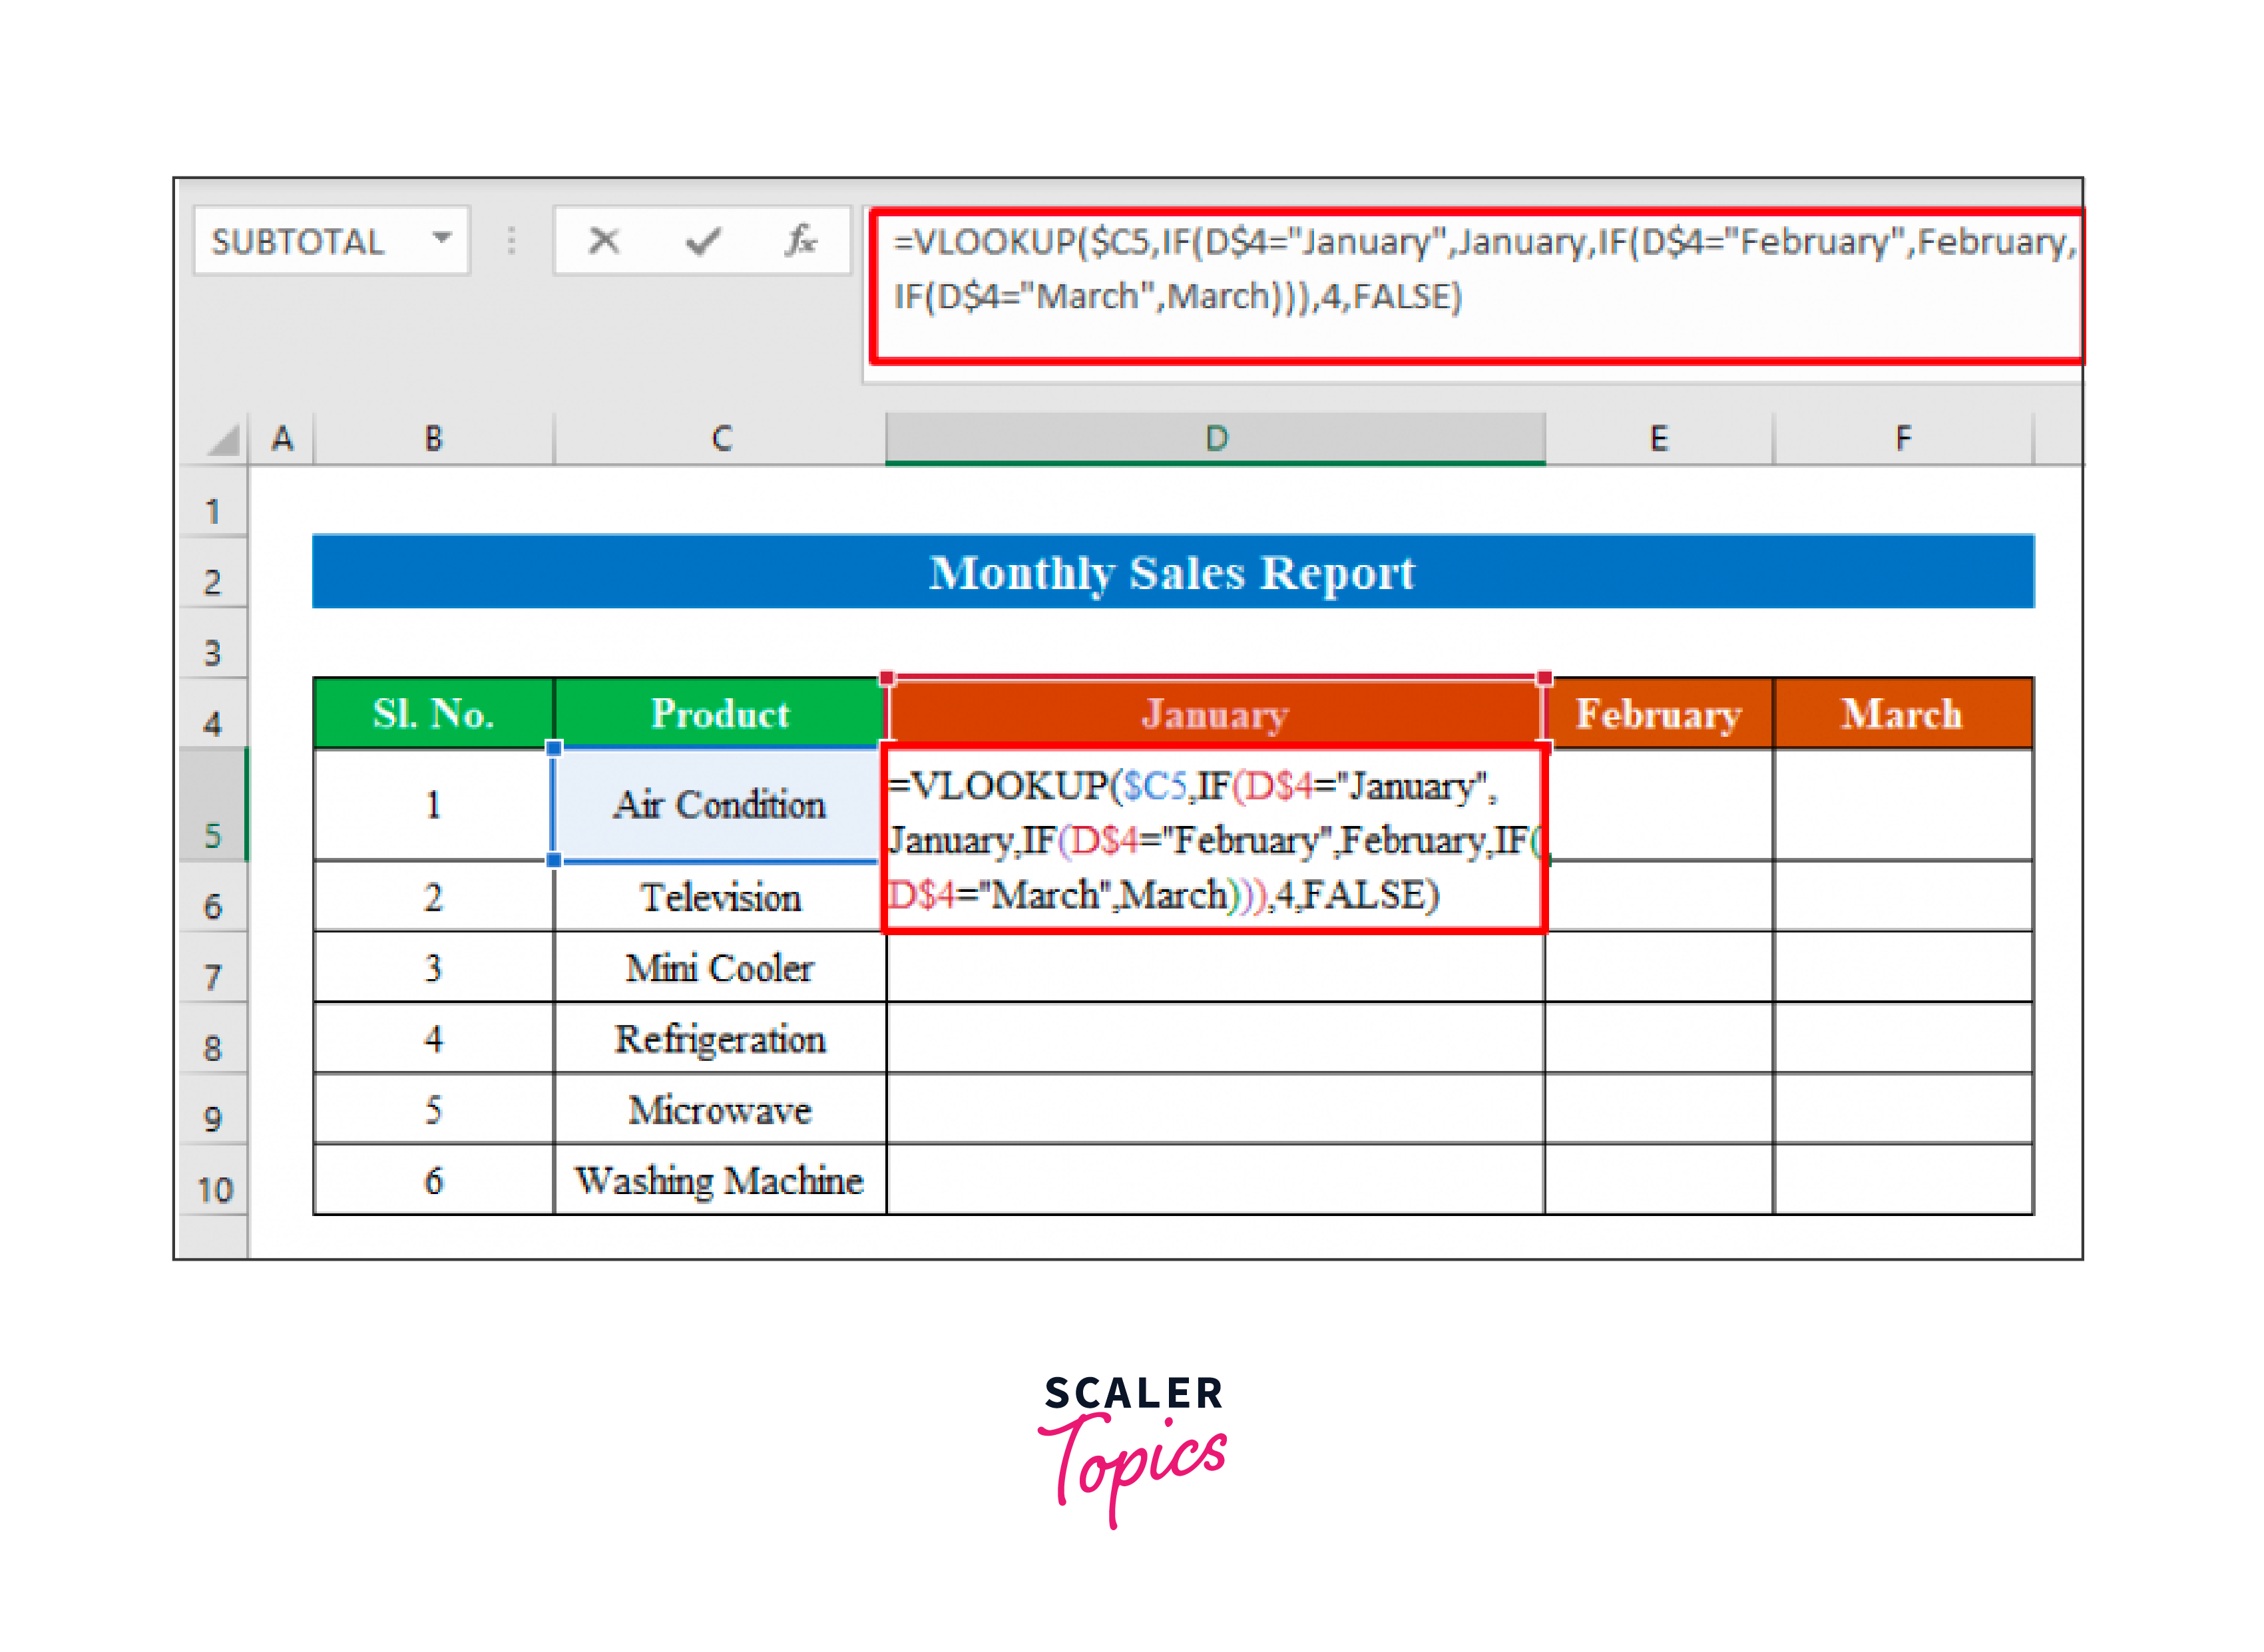
Since the appropriate data range was chosen. Let's use a formula in our last sheet to calculate the monthly sales report. To execute so, take the following actions:
- In order to use the formula, choose a cell. I've chosen a cell here (D5). Enter the formula in the chosen cell: =VLOOKUP(4="January",January,IF(D4="March",March))),4,FALSE)
Where,
-
A pre-built function called VLOOKUP searches a data range or string for information.
-
If a particular condition is true, the IF function returns one value; if it is false, it returns a different value.
-
If true, data from "Sales of January" will be collected in the Table Array (D$4="January"). If untrue, it will move to either February or March.
-
4 is Col index num. The total sales for each item will be found in this column.
-
We will choose FALSE since we want an exact match for our lookup value.
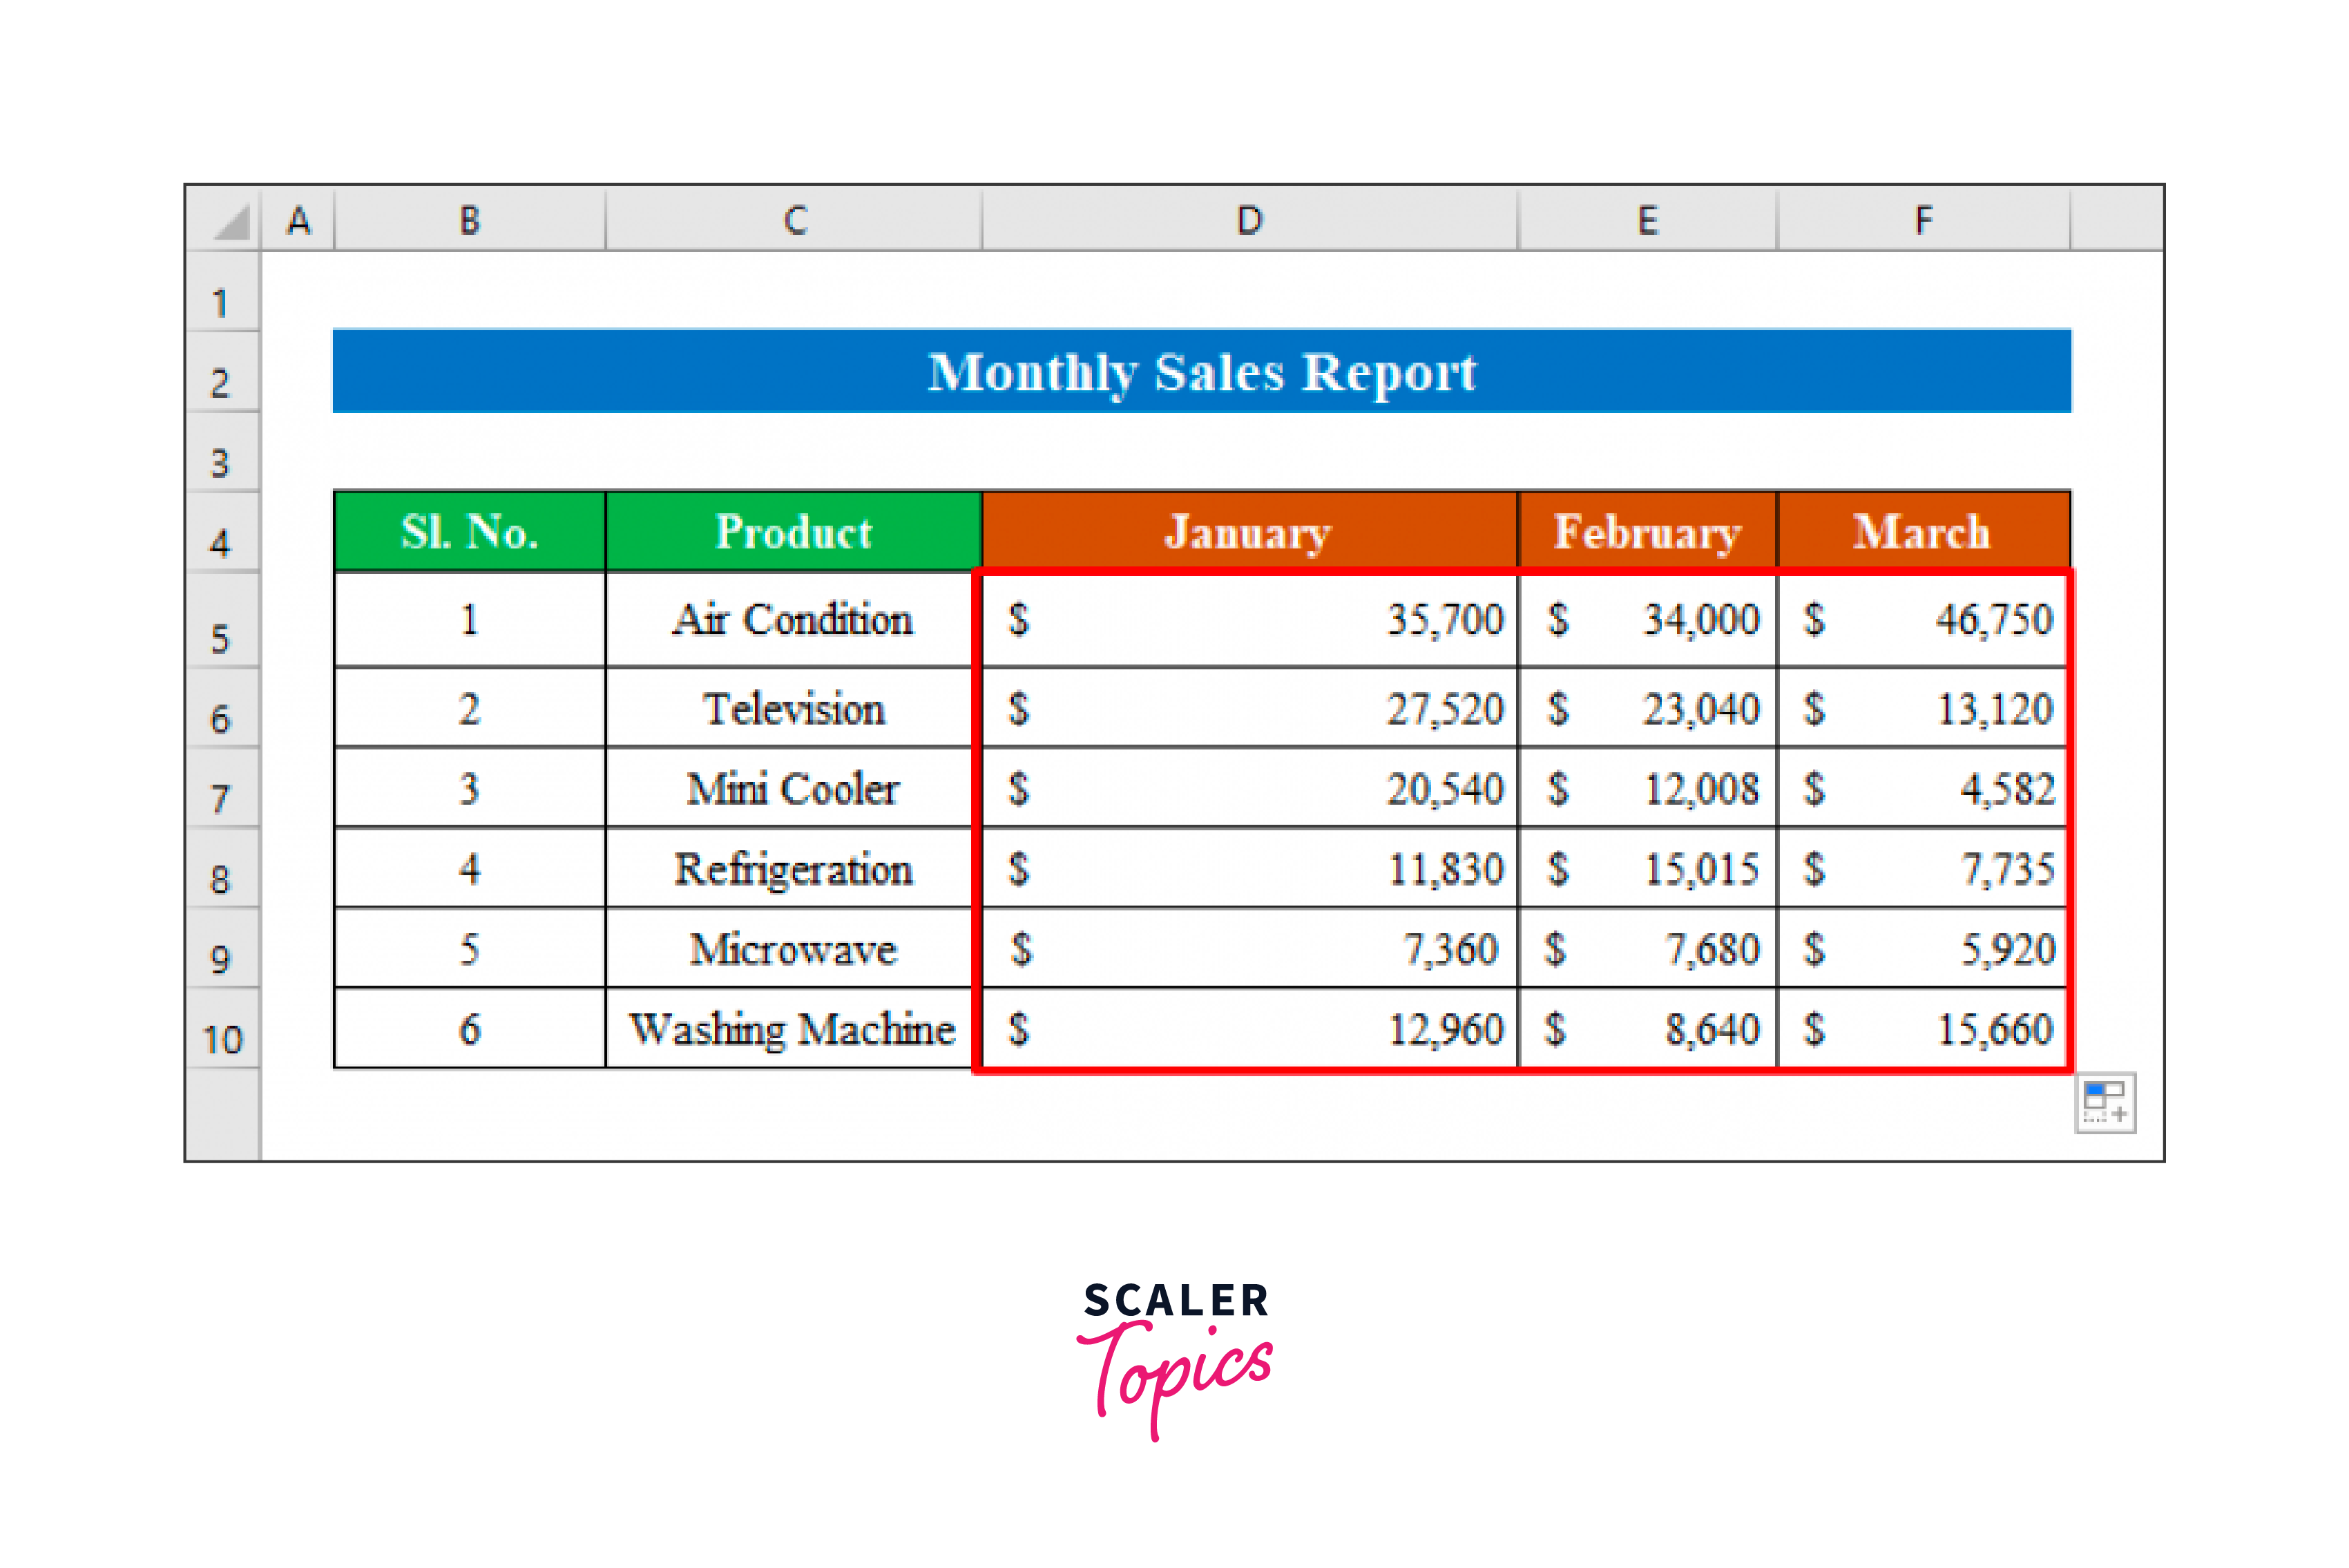
Get Total Quantity of Products Sold
To get the output, press Enter.
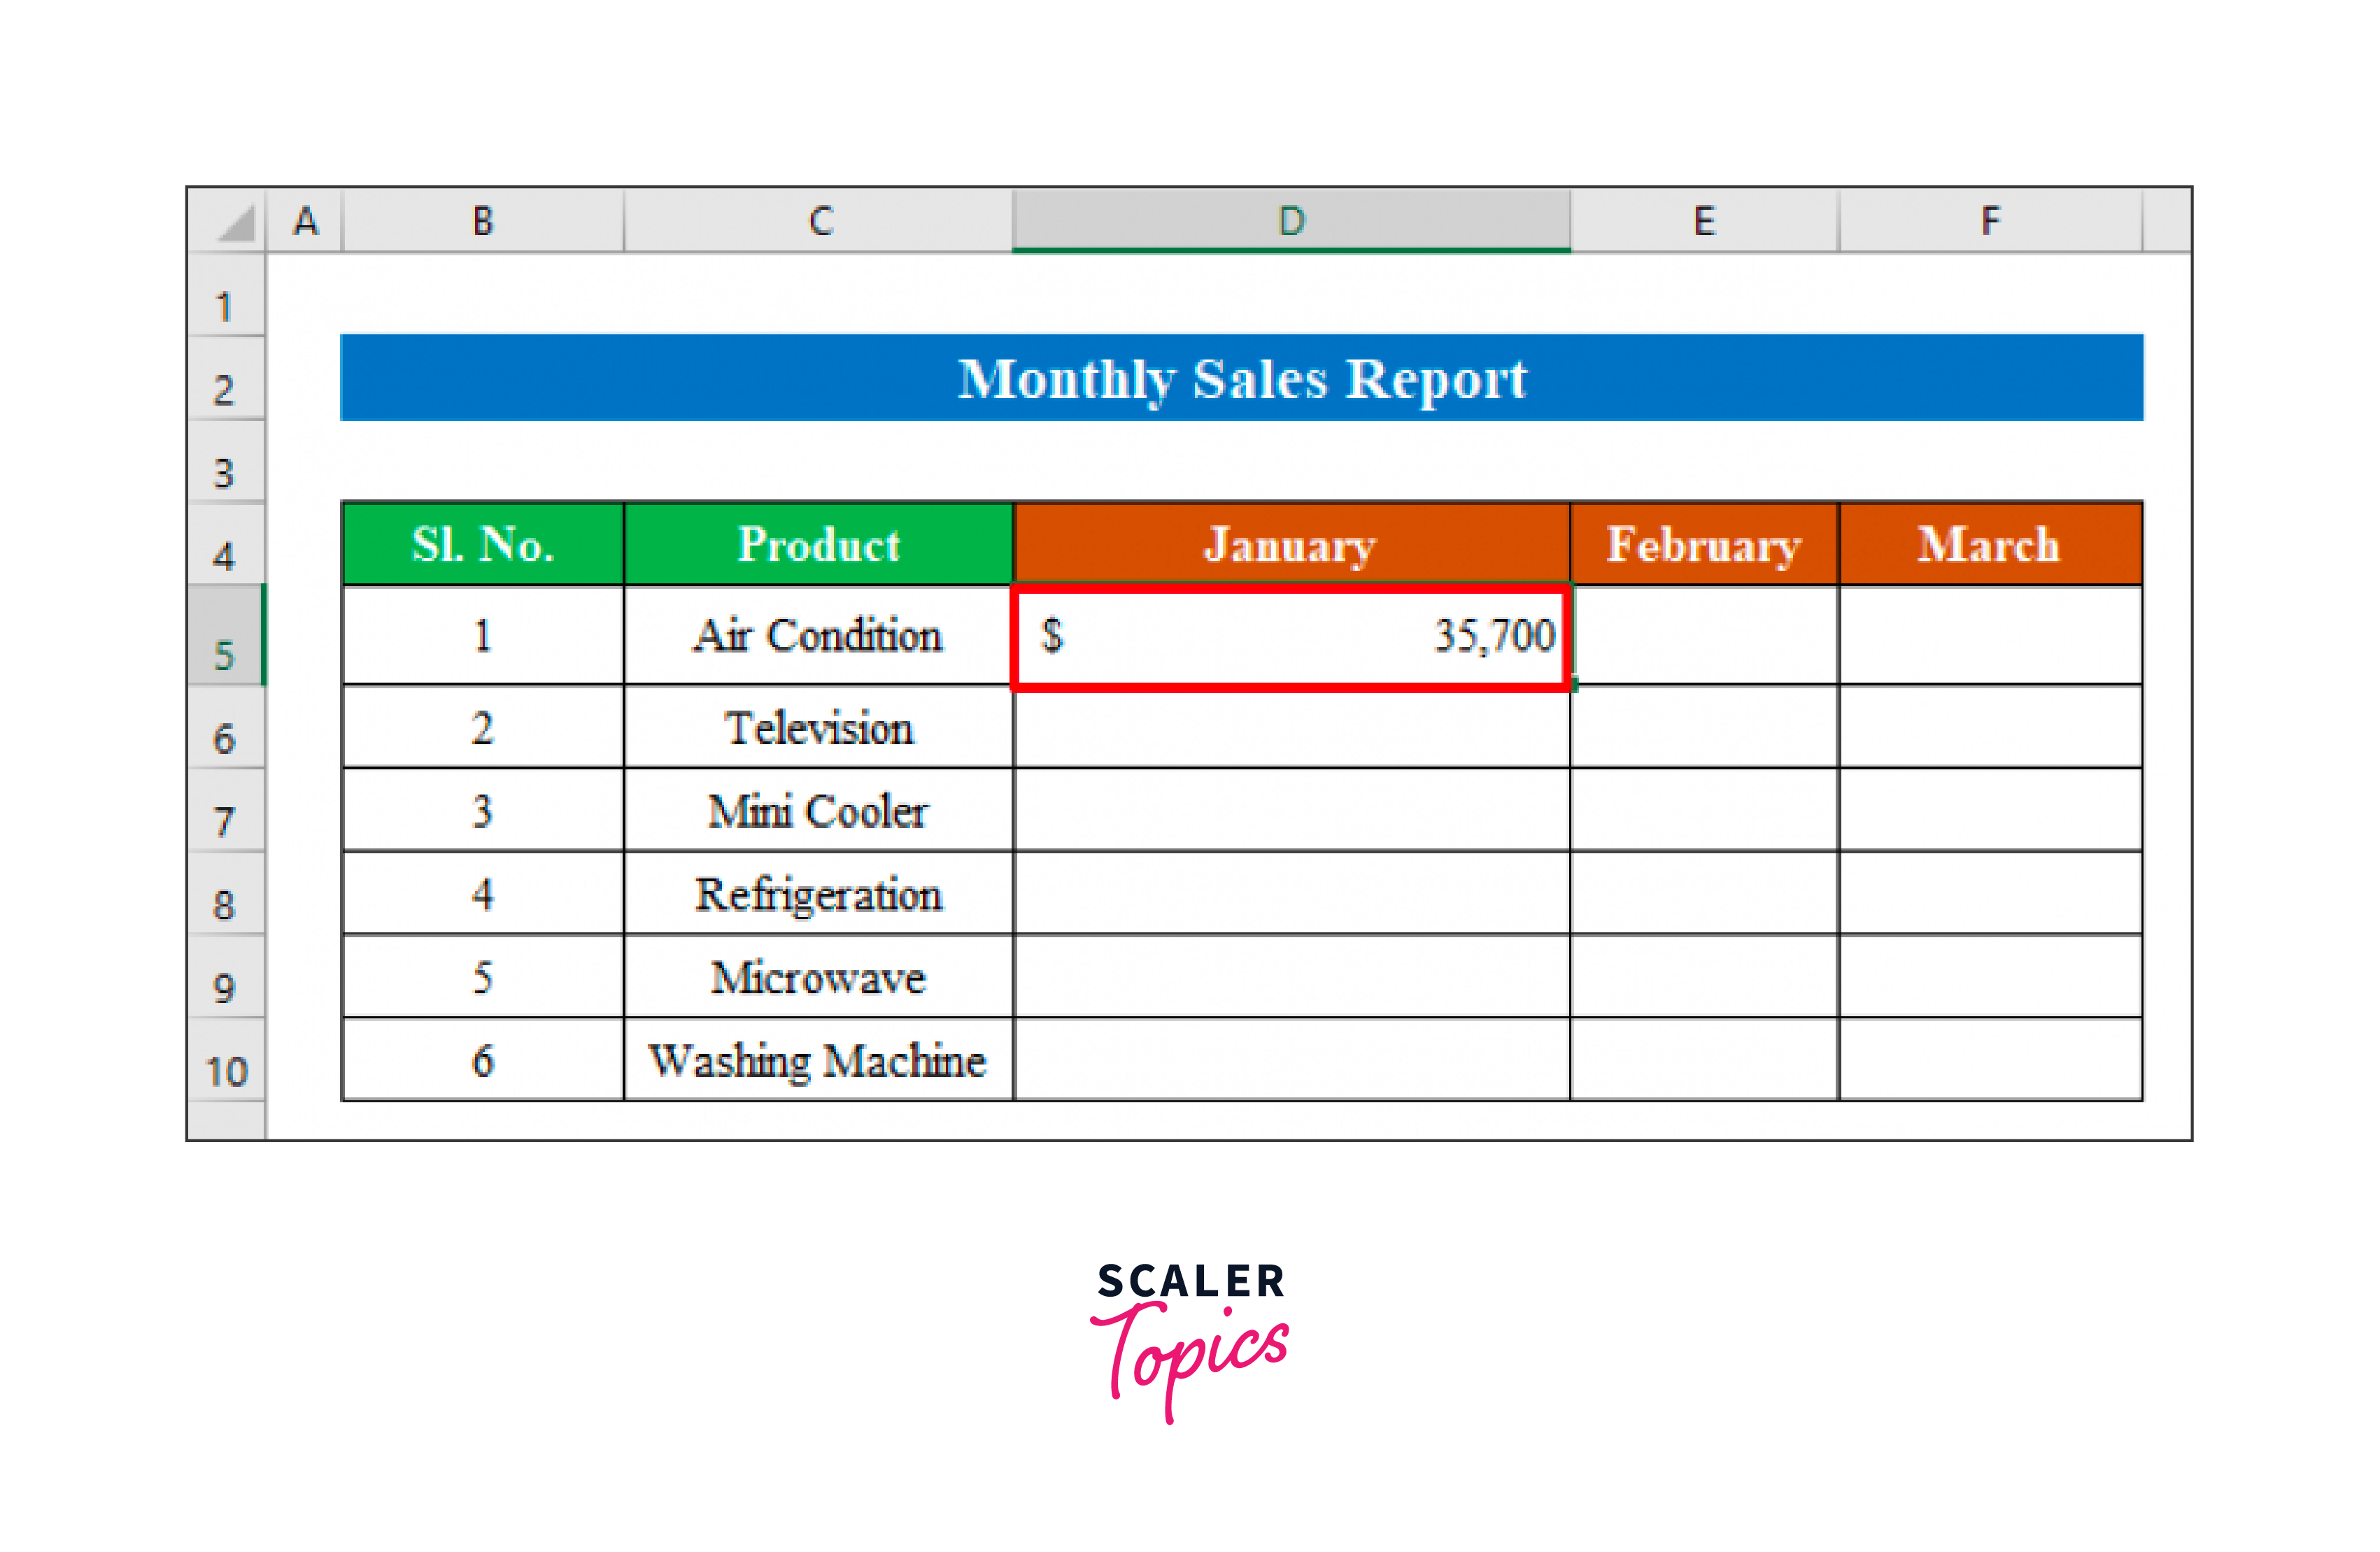
We can see from the screenshot below that we have the air conditioning price for the month of January.
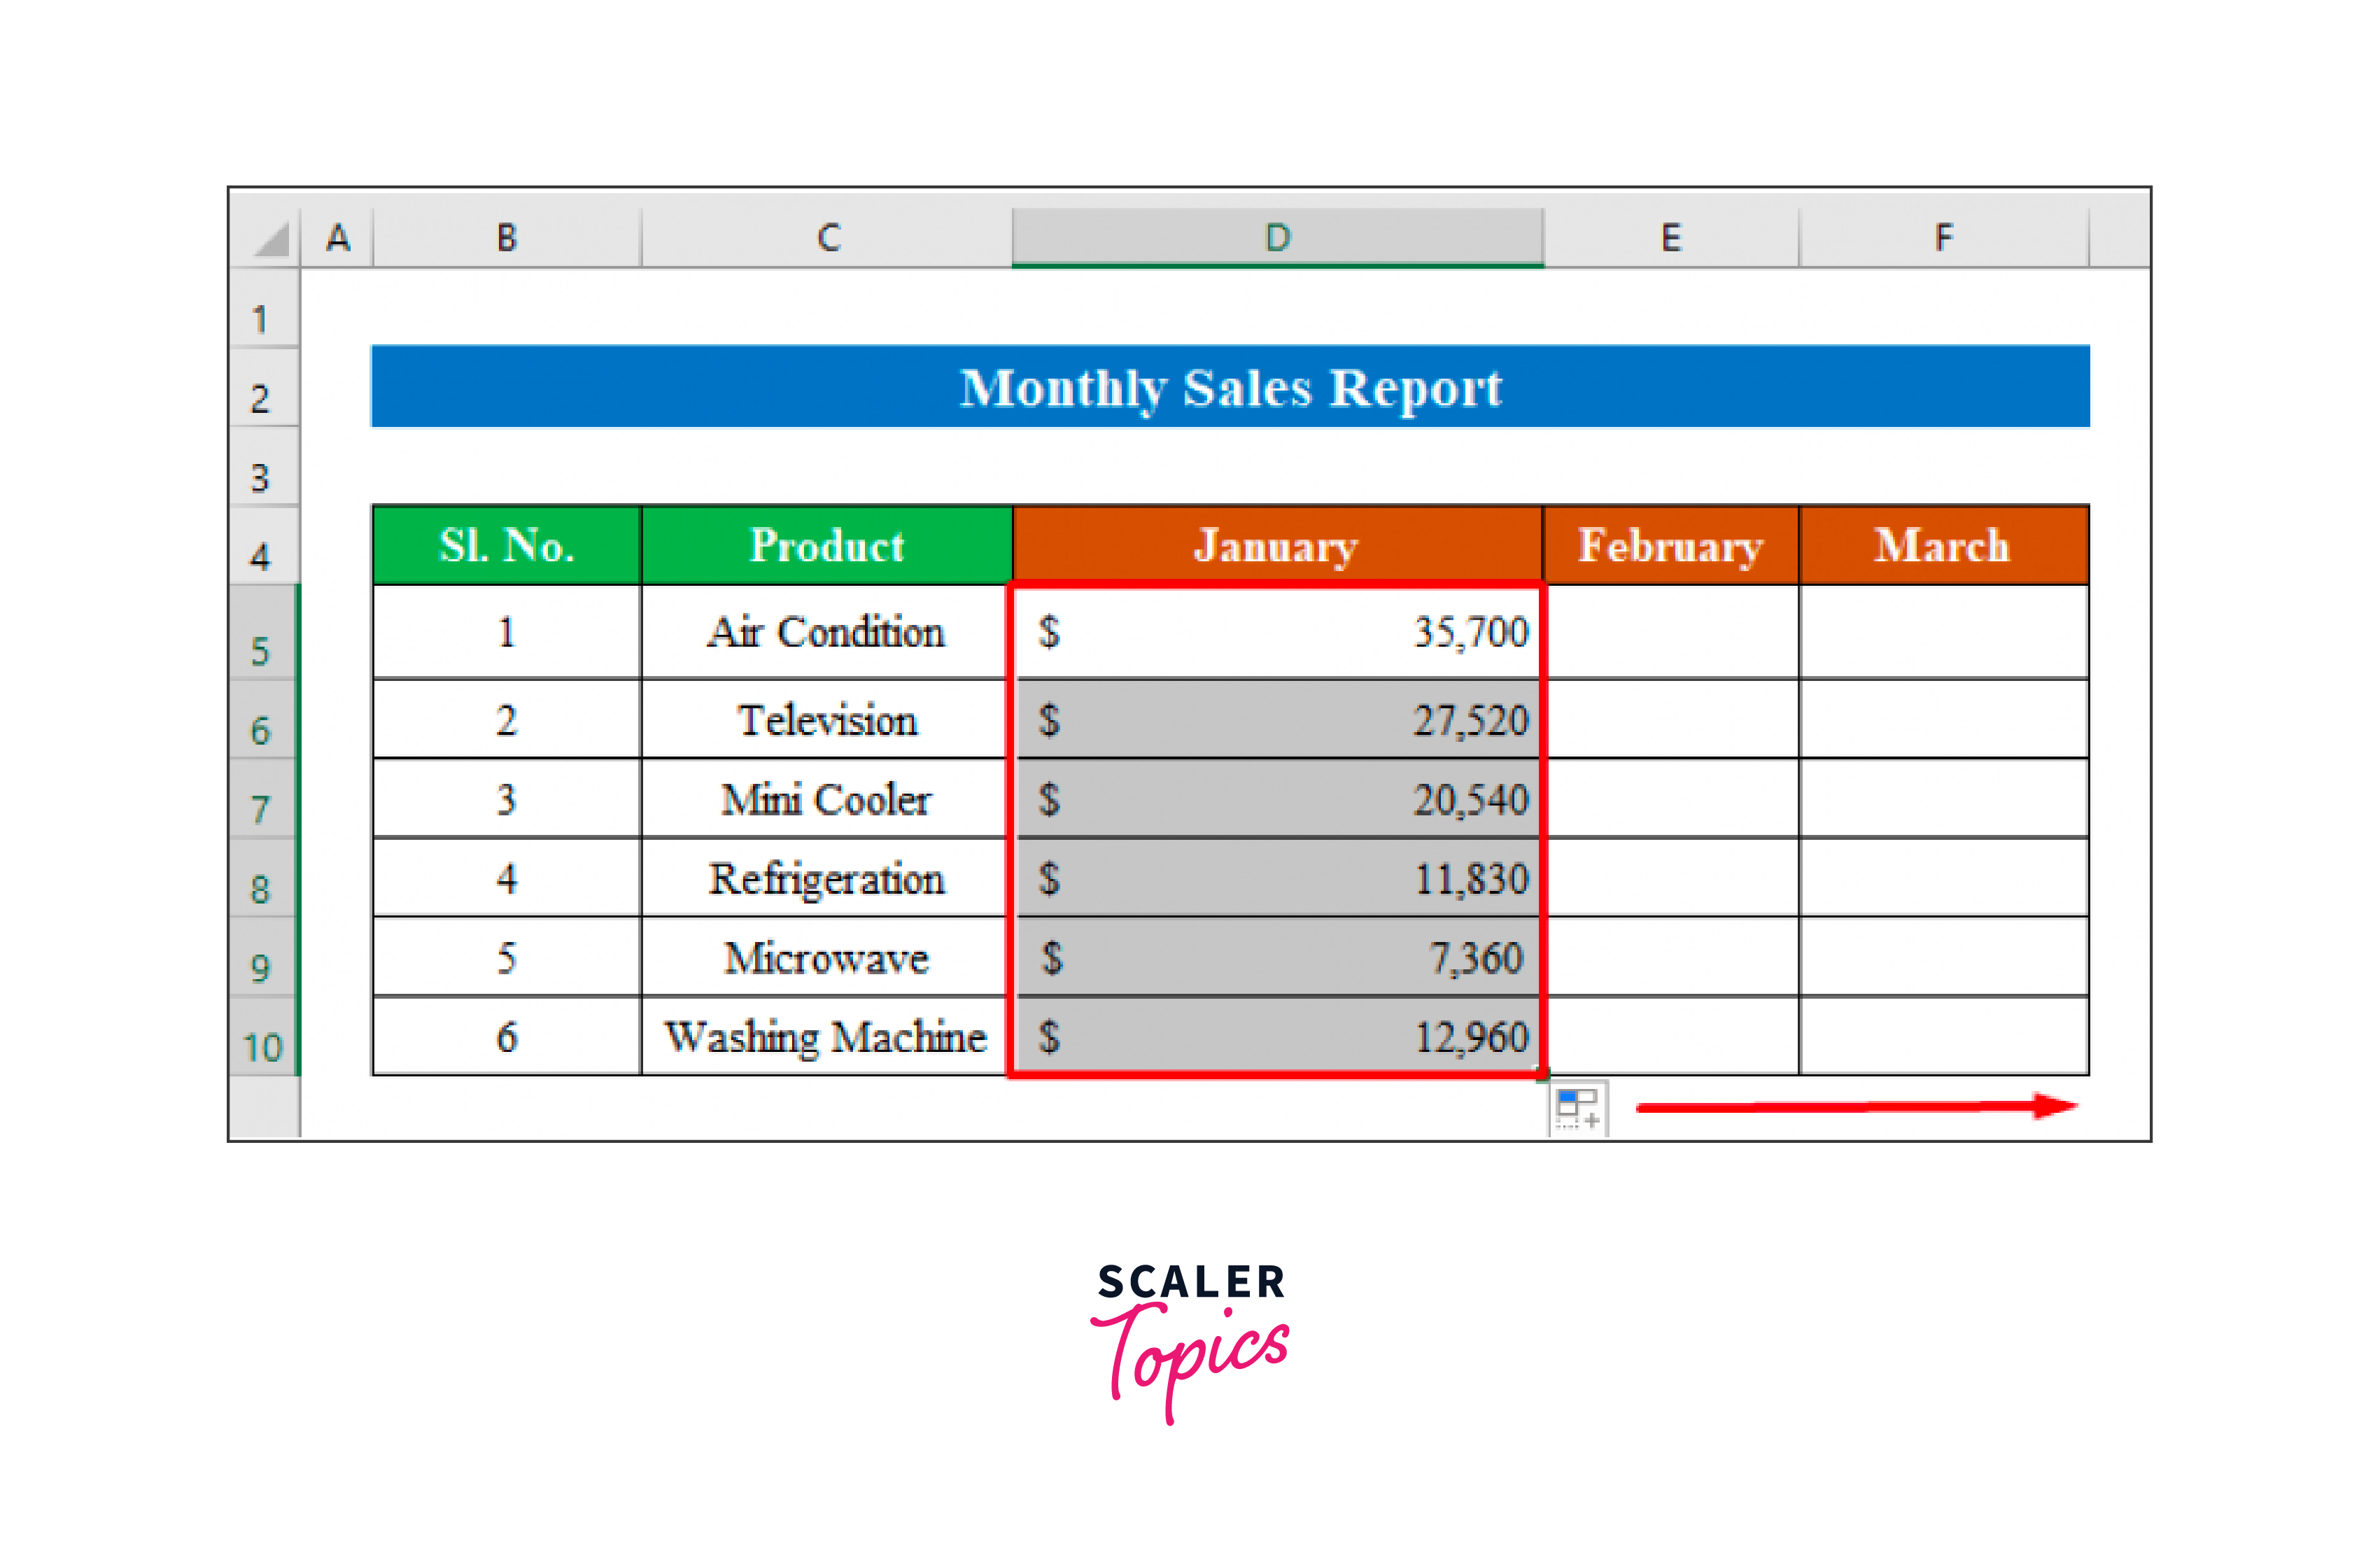
To view the outcome of all the entries in the column, drag the "fill handle" down.
To obtain the result for February and March as well, drag it to the right now.
Our monthly sales report in excel was successfully created in Excel by using just a few simple formulas.

Calculate Total Sales to Complete the Sales Report
For total sales, you can just add up sales of all the products for each month and then add all the sales, For example:
- The sales for January would be the addition of all the product sold in that month.
- You have to do the same for all the months in order to get the total sales.
Testing
However, after applying the formula, the error code #N/A may appear, which typically means that the formula was given an incomplete search parameter. In that situation, make sure the range and references are properly chosen by carefully reviewing the formula.
More Monthly Sales Report Templates
Restaurant Monthly Sales Report Template
- Create a monthly restaurant sales report in excel using information from your weekly sales reports.
- See total monthly and yearly sales by keeping track of sales performance over time.
- The template presents an itemized summary of sales broken down by transaction type and categorizes restaurant sales into food and beverage categories (e.g., credit card or cash). and the same price as the second one. The same price for the second one. The same price for the third one.
End-of-Month Sales Report Template
- This dashboard sales template gives a quick overview of significant end-of-month KPIs.
- See outbound calls, meetings, client conversions, and new lead analytics for each sales representative as well as for the entire team.
- See how your end-of-month revenue compares to previous months and get a visual representation of the lead-to-opportunity ratio, opportunity-to-win ratio, and sales volume per channel.
- By copying and pasting the dashboard template into new tabs for every month, you may create an ongoing monthly sales report in excel.
Monthly Retail Sales Summary Report Template
- Get a summary report of your monthly retail sales using this template, which will be presented in tables and charts.
- Three sections make up the template: The Sales Overview displays monthly total sales, customer orders, and sold goods together with a graph that illustrates how sales have changed over time.
- The Product Overview contains a pie chart to compare product performance as well as units sold and sale amounts for various products.
- The template also includes a comparison of sales for the current and previous months. For template variants, you can swap out products with the names of sales reps or store addresses.
Monthly Sales Activity Report Template
- Use this template to keep track of sales activities for a single month or to produce a continuous monthly report.
- The template will automatically compute revenue for each item and display total amounts when you enter the type of sales activity, completed or anticipated sales quantities, and associated expenditures.
- Create a unique sales report template for your company by adding or removing columns.
Monthly Sales Call Report Template
- This report template gives a month's worth of sales call metrics in weekly increments.
- This template can be used by sales representatives to track calls, assess performance in relation to objectives, and provide sales managers with this data. (The template has a spot at the top for the name, month, and year of the salesperson.) The template automatically determines the calls made, sales totals, and percentages of goal sales value for each month.
Simple Monthly Sales Report Template
- Use this straightforward, printable sales report template to compare anticipated and actual sales.
- Get information on sales volume, revenue, margin, total orders, and average order value using the preformatted tables, and use the other sections for further in-depth reports.
- Explain any strengths, weaknesses, opportunities, or threats (a SWOT analysis) that have an impact on sales in your overview of sales performance. At the conclusion of the report, provide any recommendations or further remarks.
Hotel Monthly Sales Report Template
- View monthly hotel sales information, such as total revenue from lodging, the number of rooms sold, the typical room rate, and the occupancy rate for each month.
- A visual chart showing monthly room sales is included in the design along with a list of monthly statistics. Use this template as a monthly and annual sales report to show data for individual months as well as annual totals.
Small Business Monthly Sales Forecast Report
- With the help of this straightforward forecast report template, small enterprises can calculate monthly sales report in excel over a 12-month period.
- Although it is intended for a particular product, this template can also be used to display a forecast of overall sales in its entirety.
- The template will automatically calculate total sales and percentage totals for each month as well as display the projected annual sales total once you enter your data into the non-shaded cells, including the number of units sold and the price per unit.
Conclusion
- This article provides a comprehensive guide for creating a monthly sales report in Excel, highlighting its importance for sales managers in tracking and analyzing sales patterns, modifying sales processes, and setting goals.
- It outlines the steps involved in creating the report, including gathering data, highlighting important information, generating weekly reports, adjusting forecasts, and adding numeric values to target lines.
- The article includes examples, such as calculating total sales for a specific product and determining total monthly sales, demonstrating practical application with formulas like VLOOKUP and IF statements.
- It addresses potential issues like the #N/A error code in formulas and emphasizes the importance of accurate range and reference selection.
- The article provides various templates for different types of monthly sales reports (e.g., restaurant, retail, hotel, small business forecasts) to cater to diverse business needs, enhancing its utility for a wide range of users.