R Save Plot
Overview
In data analysis and visualization, creating high-quality plots is crucial for effectively communicating insights. However, equally important is the ability to save these plots for sharing, presentation, or publication. In this article, we will explore various methods to save plots in R, a widely used programming language for data analysis and visualization.
Introduction
In the realm of data analysis and visualization, R has emerged as a powerful programming language, offering a plethora of tools and packages to create stunning and informative plots. As analysts and researchers dive into exploring their data, they often produce compelling visualizations that convey valuable insights. However, these plots hold greater significance when they can be preserved and shared effectively with a broader audience.
Creating visually appealing plots is made easier by popular packages like ggplot2, lattice, and base R graphics. Once a plot is created, it can be saved in various formats to suit different requirements.
Saving plots enables data professionals to store their visualizations in various formats, ensuring accessibility and consistency across different platforms and presentations.
Save a Plot in R
In R, saving plots can be achieved through various techniques. These methods include using the ggsave() function from ggplot2 for saving ggplot2 plots and employing dev.copy() and dev.off() functions for base R graphics. Additionally, plots can be saved as bitmap images in formats like JPEG, PNG, BMP, and TIFF. For resolution-independent images, plots can be saved as vector images in PDF and PostScript formats. Furthermore, interactive plots can be preserved in formats like HTML widgets and web pages, offering an engaging data exploration experience. The upcoming sections will delve into each of these methods in detail, empowering users to effectively save and share their data visualizations in R.
How to Save a Plot as a Bitmap Image in R?
Bitmap images, such as JPEG, PNG, BMP, and TIFF, have fixed resolutions and are composed of individual pixels, resulting in pixelation when zoomed significantly. In R, we can use specific functions like jpeg(), png(), bmp(), and tiff() to save plots as bitmap images. Let's go through each format and see how to save the plot in R.
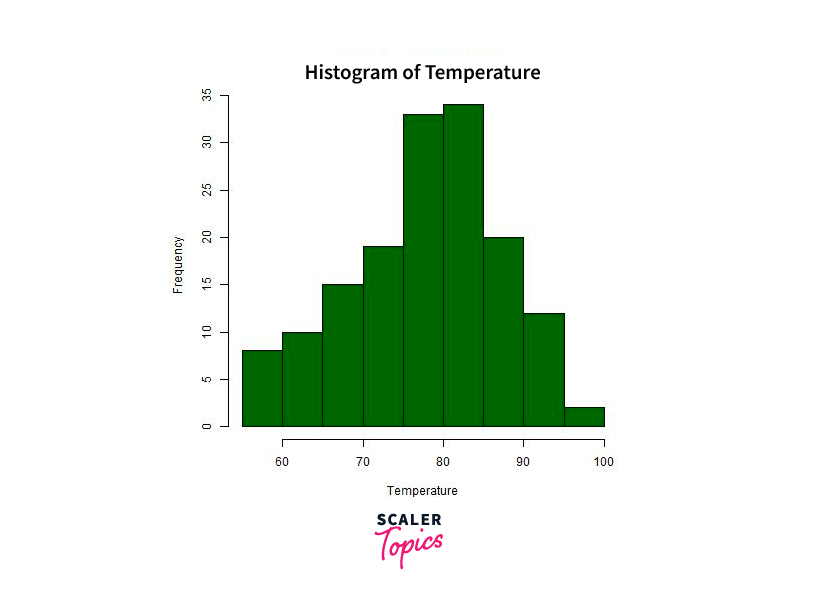
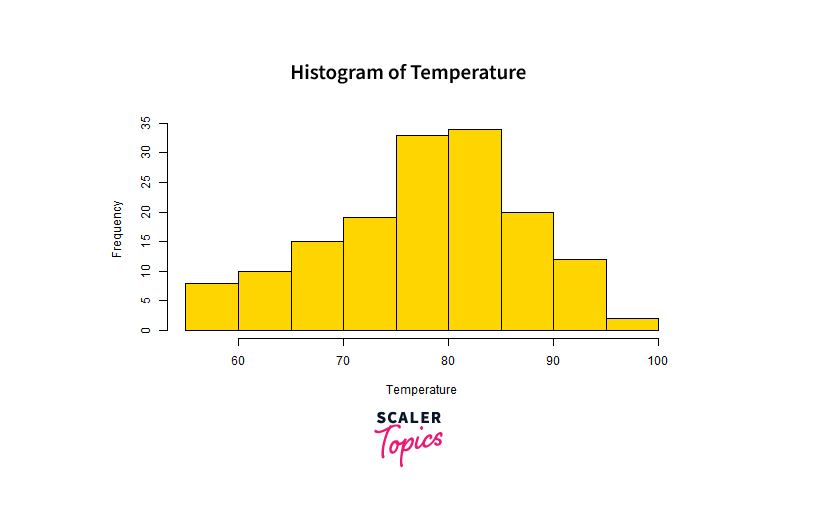
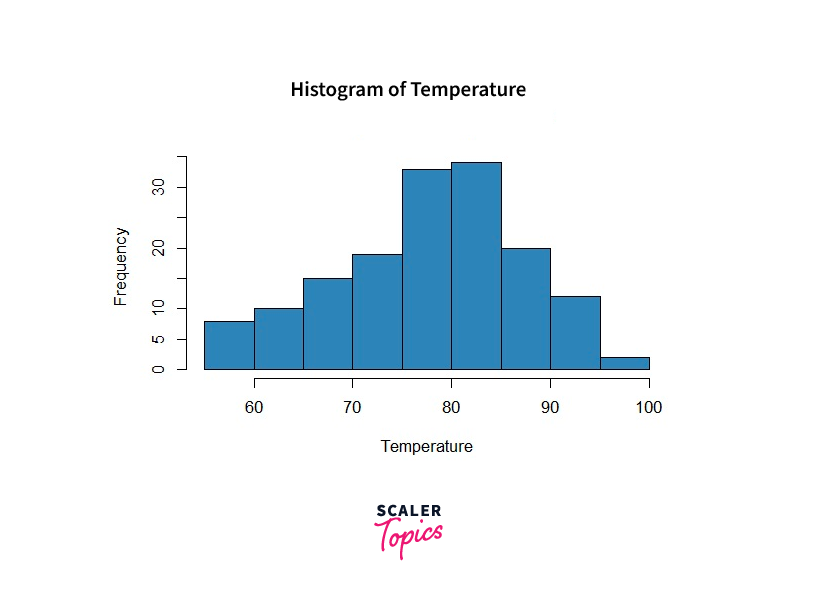
We will use the temperature column of the built-in dataset airquality for the remainder of this section as an example.
Output:
Save as JPEG Image
JPEG is a popular format for photographs and plots with complex color gradients. It offers good compression while maintaining a decent level of image quality.
To save a plot as a JPEG image, we use the jpeg() function. After plotting, we must call dev.off() to save the file and return control to the screen.

Save as PNG Image
We can specify the resolution using the width and height arguments in the png() function. Additionally, we can provide the full path for the file if we don't want to save it in the current directory.

Save as BMP Image
For BMP images, we can specify the size of the image in inches, centimetres, or millimetres using the width, height, and units arguments. The resolution can be set with the res argument.

Save as TIFF Image
To save plots in the TIFF format, we use the tiff() function and provide the desired size and resolution, similar to saving BMP images.
How to Save a Plot as a Vector Image in R?
Vector images are resolution-independent and can be scaled without any loss of quality. R provides two popular formats for saving plots as vector images: PDF (Portable Document Format) and PostScript. Let's explore each format in detail and see how to save plots in these vector image formats.
Save as PDF File
PDF is widely used for documents, reports, and publications. Saving plots as PDF files ensures that the visualizations can be easily integrated into various documents while maintaining their high-quality appearance.
Code Example:
In this example, we created a histogram of the temperature data and saved it as a PDF file using the pdf() function. The dev.off() function is called to finalize the plot-saving process.
Save as Postscript File
PostScript is another vector image format widely used for professional printing and document interchange. Saving plots as PostScript files allows for compatibility with various printing devices and software applications.
Code Example:
In this example, we created a histogram of the temperature data and saved it as a PostScript file using the postscript() function. As with PDF, the dev.off() function is called to finalize the plot-saving process.
Advantages of Saving as Vector Images:
- Scalability: Vector images can be resized without any loss of quality, making them suitable for printing in different sizes or displaying on high-resolution screens.
- High Quality: Vector images retain smooth lines and sharp edges, ensuring a professional appearance, especially when zoomed in.
- Editable: It are typically editable in vector graphics software like Adobe Illustrator, allowing users to make changes or add annotations.
- Print-Ready: Vector images are ideal for high-quality printing, ensuring crisp and clear output on paper.
By saving plots as vector images in R, data analysts and researchers can effectively preserve their visualizations in formats suitable for various professional applications. Whether for publications, presentations, or high-quality printing, vector images provide the flexibility and quality required to convey insights with precision and clarity.
Importance of Saving Plots
In data analysis and visualization, creating informative and visually appealing plots is a fundamental aspect of understanding patterns, trends, and insights hidden within datasets. However, the true value of these plots extends beyond their initial creation. The ability to save plots in different formats holds immense importance in the data analysis workflow.
- Data Sharing and Communication: Saving plots enables effective data sharing and communication. Visual representations of data insights are more easily understood than raw numbers. By saving plots, data analysts can share their findings with stakeholders, team members, or the wider community in a visually engaging manner. This facilitates better understanding and interpretation of complex data patterns.
- Preservation of Insights: Plots are valuable visual summaries of data analysis results. Saving plots ensures that these insights are preserved for future reference, analysis, or comparison. Data analysts can revisit and build upon previous visualizations, facilitating continuous learning and improvement in the analytical process.
- Publication and Presentation: In academic research or professional presentations, saving plots in publication-ready formats, such as PDF or PostScript, is crucial. High-quality plots enhance the overall appearance of research papers or presentations, making them visually appealing and credible to readers and audiences.
- Offline Accessibility: By saving plots as images or vector graphics, users can access and view visualizations offline without requiring access to the original data or the R environment. This is particularly useful when presenting findings in environments without internet connectivity or sharing insights with collaborators who may not have immediate access to the data source.
- Web and Social Media Sharing: Plots saved as images or interactive web pages can be easily shared on websites, blogs, or social media platforms. This facilitates data analysts in reaching a broader audience, including those who may not be familiar with R or data analysis tools, and fosters greater engagement with data-driven insights.
- Integration in Reports and Dashboards: Plots saved as images or interactive elements can be seamlessly integrated into data dashboards or business reports. This streamlines the process of data-driven decision-making, as stakeholders can quickly grasp and act upon insights without the need for complex data analysis tools.
How to Save Interactive Plots in R?
Interactive plots offer an immersive and engaging way to explore data, allowing users to interactively manipulate and analyze visualizations. In R, we can create interactive plots using libraries like plotly or htmlwidgets. Saving these interactive plots in formats that retain their interactivity is essential for sharing dynamic data visualizations. Let's explore two ways to save interactive plots in R: as HTML widgets and web pages.
HTML Widgets
HTML widgets are interactive elements that can be embedded in web pages or R Markdown documents. They allow users to interact with visualizations, such as zooming, panning, or filtering data, directly within the plot. To save interactive plots as HTML widgets, we can use the htmlwidgets::saveWidget() function.
Code Example:
In this example, we used the plot_ly() function from the plotly library to create an interactive scatter plot. We then saved the interactive plot as an HTML widget using the saveWidget() function, which generates an HTML file containing the interactive plot.
Web Pages
Saving interactive plots as web pages provides a standalone and dynamic representation of the visualization. Users can access and interact with the plot without needing any specific data analysis tools. To save interactive plots as web pages, we can use the htmltools::html_print() function.
Code Example:
In this example, we used the plot_ly() function to create an interactive scatter plot. We saved the interactive plot as a web page using the html_print() function, which generates a standalone HTML file with the interactive plot.
Advantages of Saving Interactive Plots:
- Enhanced Data Exploration: Interactive plots enable users to explore data dynamically, allowing for zooming, panning, and other interactive features, providing a deeper understanding of the data.
- User-Friendly Presentations: Sharing interactive plots as HTML widgets or web pages makes presentations more engaging, as viewers can interact with the visualizations directly.
- Cross-Platform Compatibility: Interactive plots can be shared easily across different platforms and devices, as HTML is supported on various web browsers.
- Data Storytelling: Interactive plots facilitate data storytelling, allowing data analysts to present data insights interactively and tailor the narrative based on the audience's interactions.
- Web Integration: Interactive plots can be easily integrated into web pages, blogs, or online reports, enhancing data-driven content with interactive elements.
How to Automate Plot Saving in R?
Automating plot saving in R is a valuable technique that saves time and effort, especially when dealing with a large number of plots or when regular updates are required. By utilizing loops or functions, data analysts can efficiently generate and save multiple plots in a batch. Let's explore two common approaches to automate plot saving in R: using loops and custom functions.
Automating Plot Saving with Loops
Loops allow us to iterate over a set of plots and save each plot with a unique filename. We can use a loop like for or apply to create and save multiple plots in a single run.
Code Example:
In this example, we use a for loop to generate five scatter plots, each saved as a PNG image with a unique filename ("plot_1.png", "plot_2.png", etc.). The ggsave() function from the ggplot2 package is used to save each plot.
Automating Plot Saving with Custom Functions
Creating a custom function to generate and save plots allows for more flexibility and reusability. Users can customize the function parameters to generate different plots with specific configurations.
Code Example:
In this example, we define a custom function save_custom_plot that takes parameters for data, x-axis variable, y-axis variable, plot title, and filename. The function uses ggplot2 to create a scatter plot and saves it as a PNG image.
Advantages of Automating Plot Saving:
- Time Efficiency: Automating plot saving eliminates the need to manually generate and save each plot, saving time and effort, especially when dealing with a large number of visualizations.
- Consistency: Automating the process ensures that all plots are saved with the same settings and formats, maintaining visual consistency across multiple plots.
- Scalability: Automation allows users to generate and save a large number of plots effortlessly, making it ideal for tasks that require frequent updates or dynamic data visualizations.
- Reproducibility: Automation promotes reproducibility by generating the same set of plots consistently, enabling future analyses to refer to the saved visualizations.
- Batch Processing: The ability to save plots in batches simplifies the workflow, making it easier to manage and organize multiple visualizations.
Conclusion
- Saving plots in various formats facilitates effective data communication and sharing with stakeholders, colleagues, and a wider audience, ensuring the impact of data-driven insights.
- Plot preservation ensures valuable data insights are retained for future reference and continuous learning, promoting research reproducibility and knowledge retention.
- Saving plots alongside code enhances research reproducibility and provides transparent records of the data analysis process, fostering trust in research outcomes.
- Different formats allow easy integration of plots into publications, presentations, web pages, and social media, enabling seamless dissemination of visualizations.
- Automating plot saving streamlines the workflow, enabling efficient batch processing of multiple visualizations, and saving valuable time and effort in data analysis and reporting.
