Shiny Package in R
We often use static graphs while building data visualizations. However, these graphs have some limitations in effectively conveying insights to a wider audience. The primary drawback of static graphs is that they lack interactivity, so users can't explore the data beyond pre-defined visualizations. It can limit the ability of our audience to fully understand and engage with the presented data. But what if we could present our data in a way that users can interact with it directly? Here Shiny comes to help. Shiny serves as both an R package and a web framework allowing us to build web applications using R. With the Shiny R package; we can let our users explore the different aspects of data and see how the data responds in real-time.
In this article, we will explore the R Shiny package and discuss different examples to see how it works.
How to Install Shiny Package in R Programming?
To begin using the Shiny package, we need to make sure it's set up in our R environment. If it's not already installed, we can do so by running the following command:
After installation, we can load the Shiny package using the following command:
With the Shiny R package installed and loaded, let us discuss how we can use it to create interactive and engaging data visualizations in R.
Structure of Basic Shiny Application
A basic Shiny application is divided into the following sections:
- User interface (UI) section
- Server section
- Combining UI and Server with the shinyApp() function
1. User Interface Section:
The user interface is also referred to as the front end of an application. It includes the visual and interactive elements that users see and interact with. These elements can include input controls (text boxes, sliders, radio buttons, etc.) and output elements (plots, tables, text outputs, etc.).
2. Server Section:
The server section is also referred to as the application's back end. While the user is unaware of the activities performed in this part, it is where significant data processing takes place. The server section collects input data, processes and produces the HTML output, and communicates it back to the user interface (UI).
3. Combining UI and Server with shinyApp(): Here, we use the shinyApp() function to create a complete Shiny application by combining the UI and server components.
We can separate the two sections (UI and server) into two distinct files named ui.R and server.R or consolidate them into a single file named app.R.
We can follow the following syntax to build the basic Shiny app:
Functions in Shiny Package
The Shiny package in R provides various verb functions that allow us to create interactive web applications. These verb functions help us define the behaviour and interactivity of our Shiny app. Let us discuss the top key verb functions in the Shiny package:
UI control and Layout Functions
These functions allow us to create organized and visually appealing layouts that enhance user experience. Let us explore some important UI control and layout functions in Shiny:
- fluidPage(): This function creates a fluid layout that adjusts to the available screen space. It's a commonly used choice for responsive designs.
For Example:
Output:
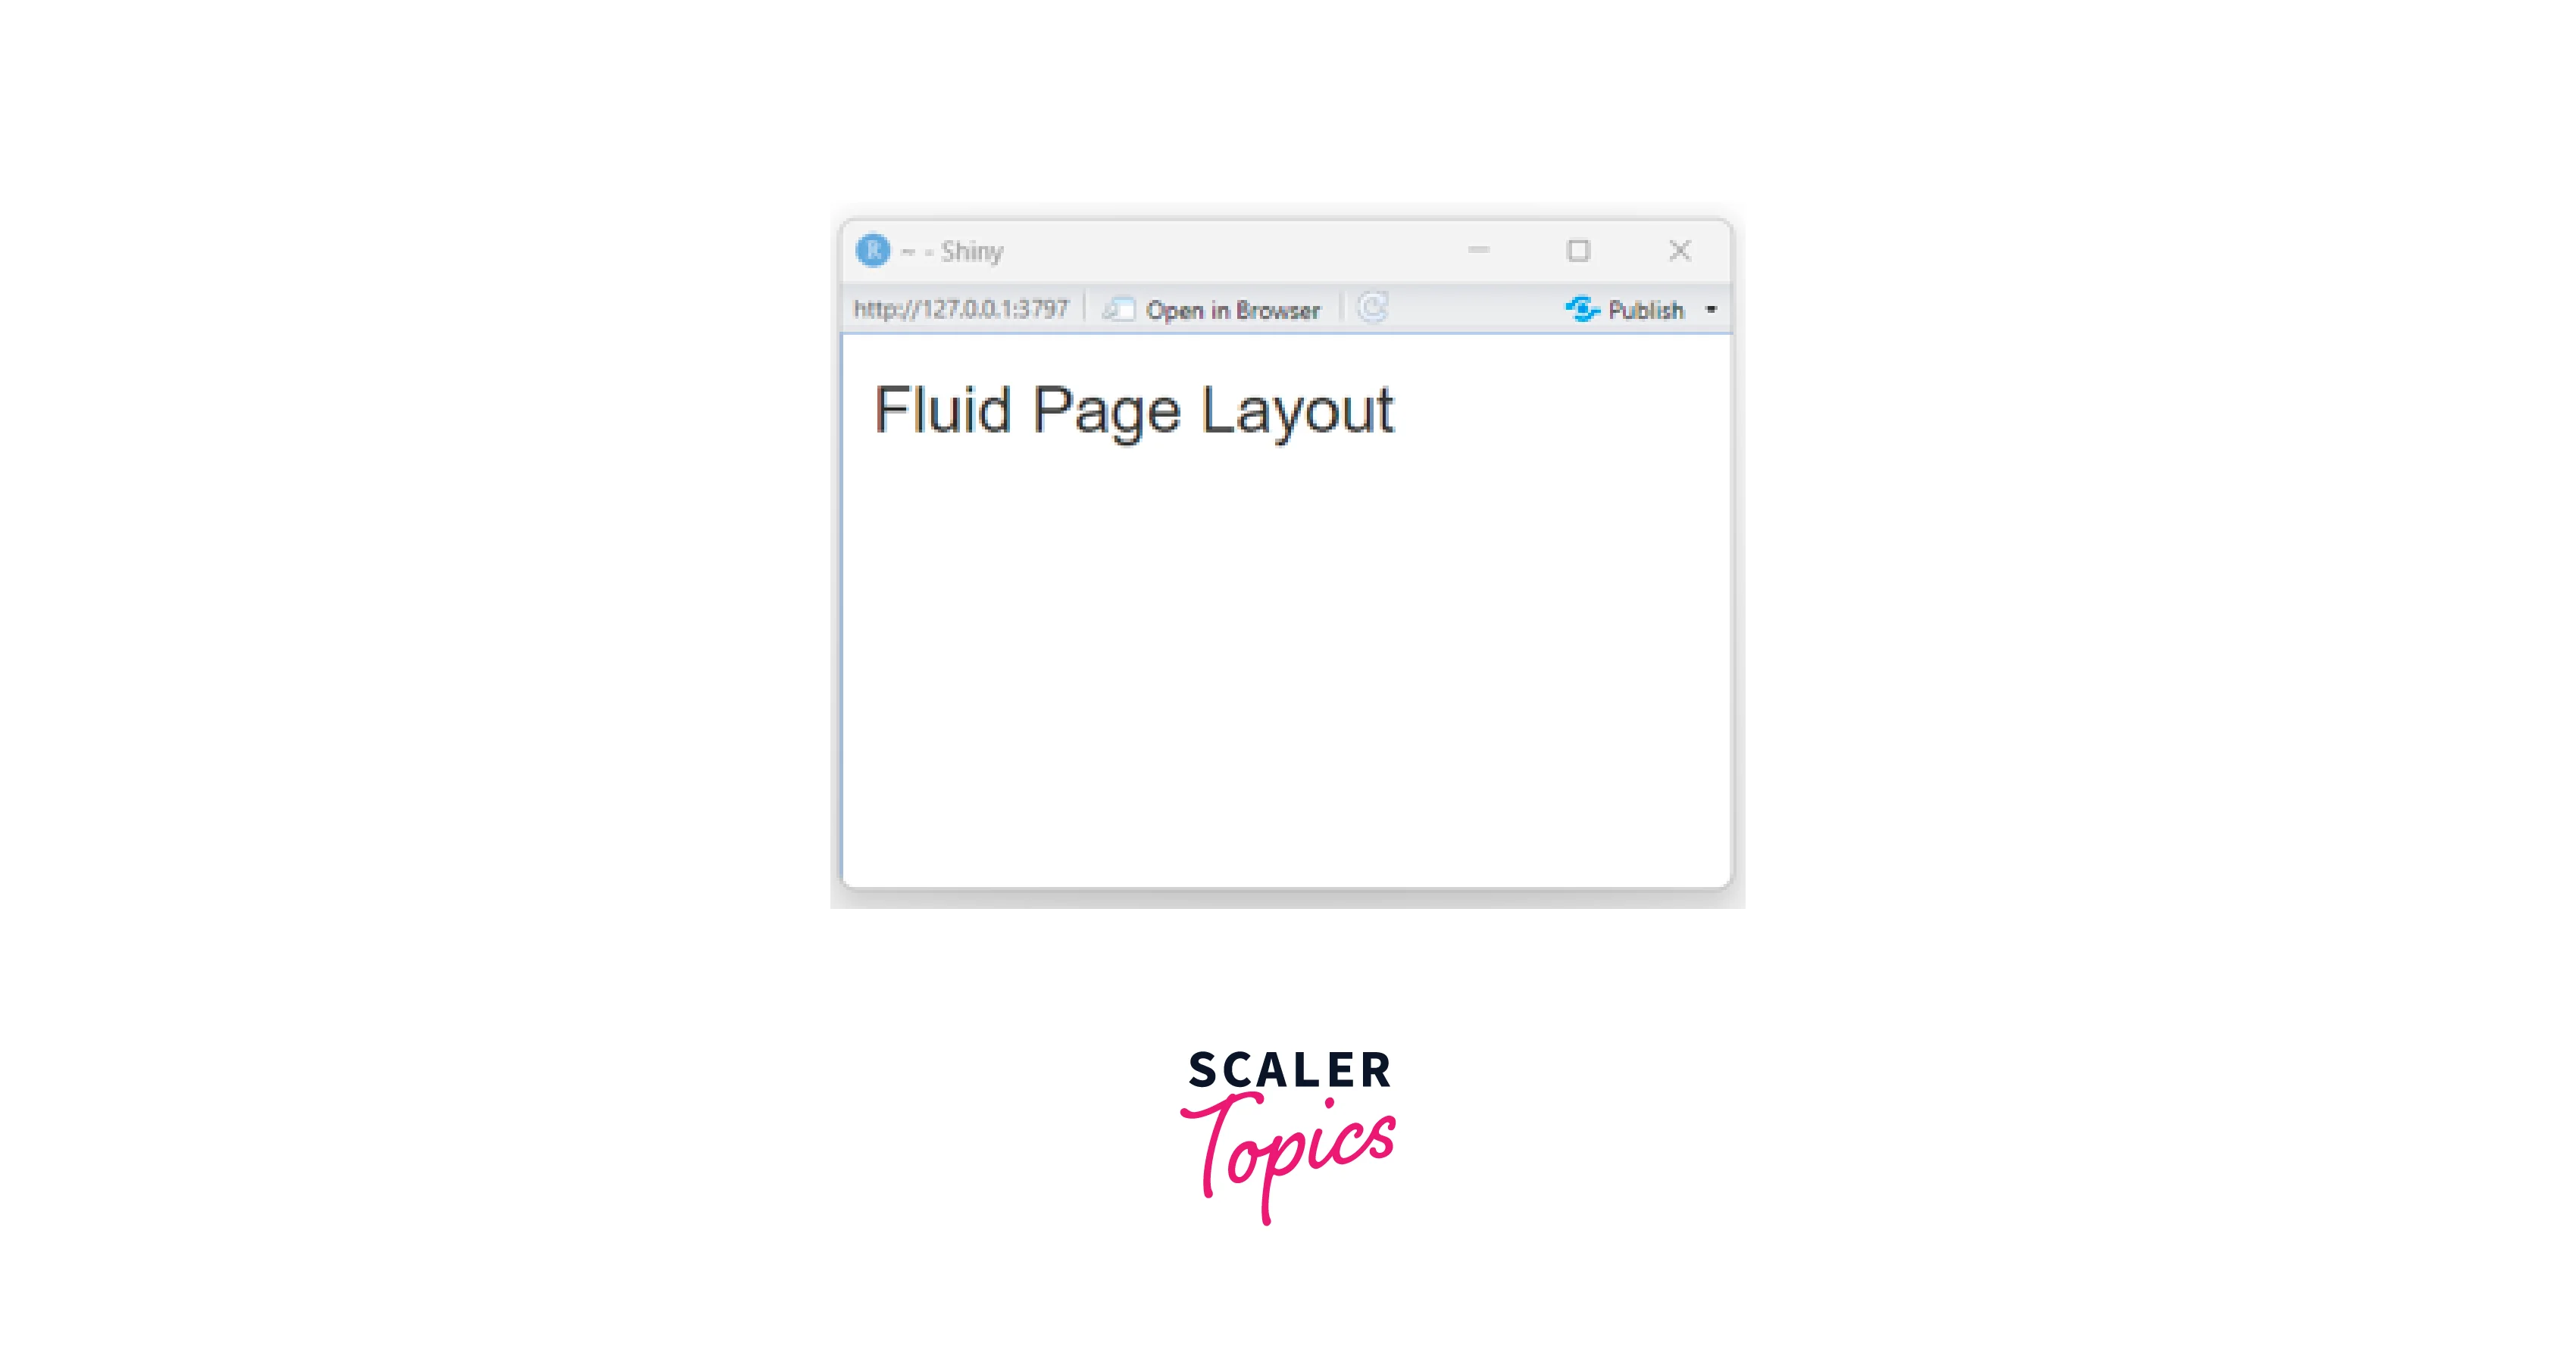
Here, we used the fluidPage() function to define a UI layout with a title panel containing headings to introduce the page's content. This layout can be further customized by adding additional UI elements.
- fluidRow() and column(): These functions help us to define or structure the layout by creating rows and columns.
For Example:
Output:
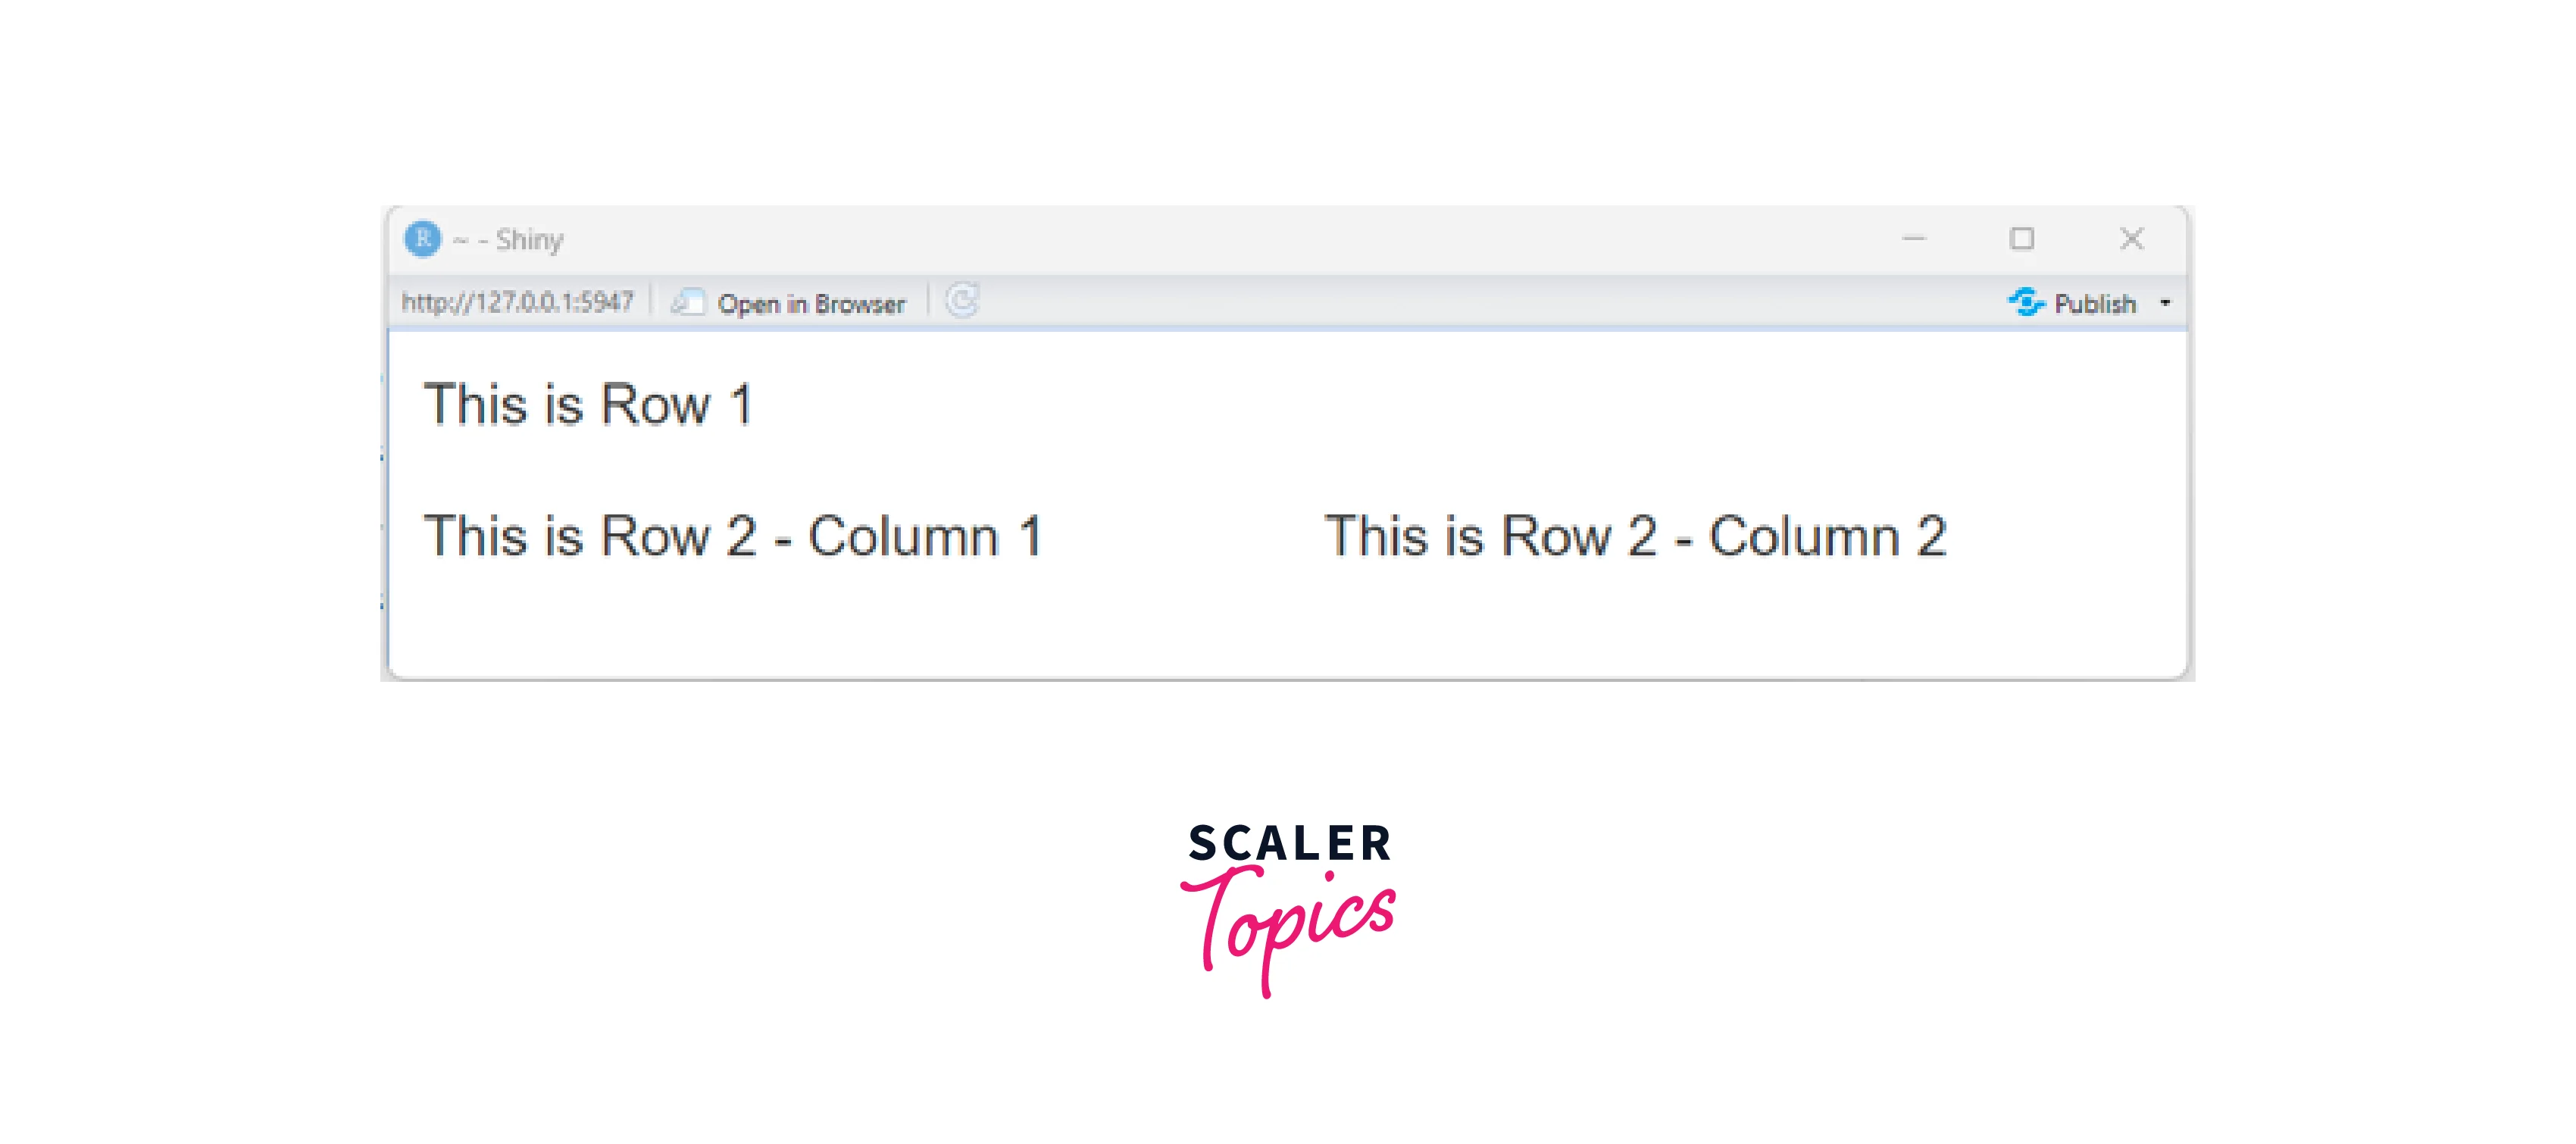
Here we used the fluidRow() and column() functions to create a responsive layout with rows and columns.
- tabsetPanel() and tabPanel(): These functions allow us to create a tabbed interface with multiple tabs.
For Example:
Output:
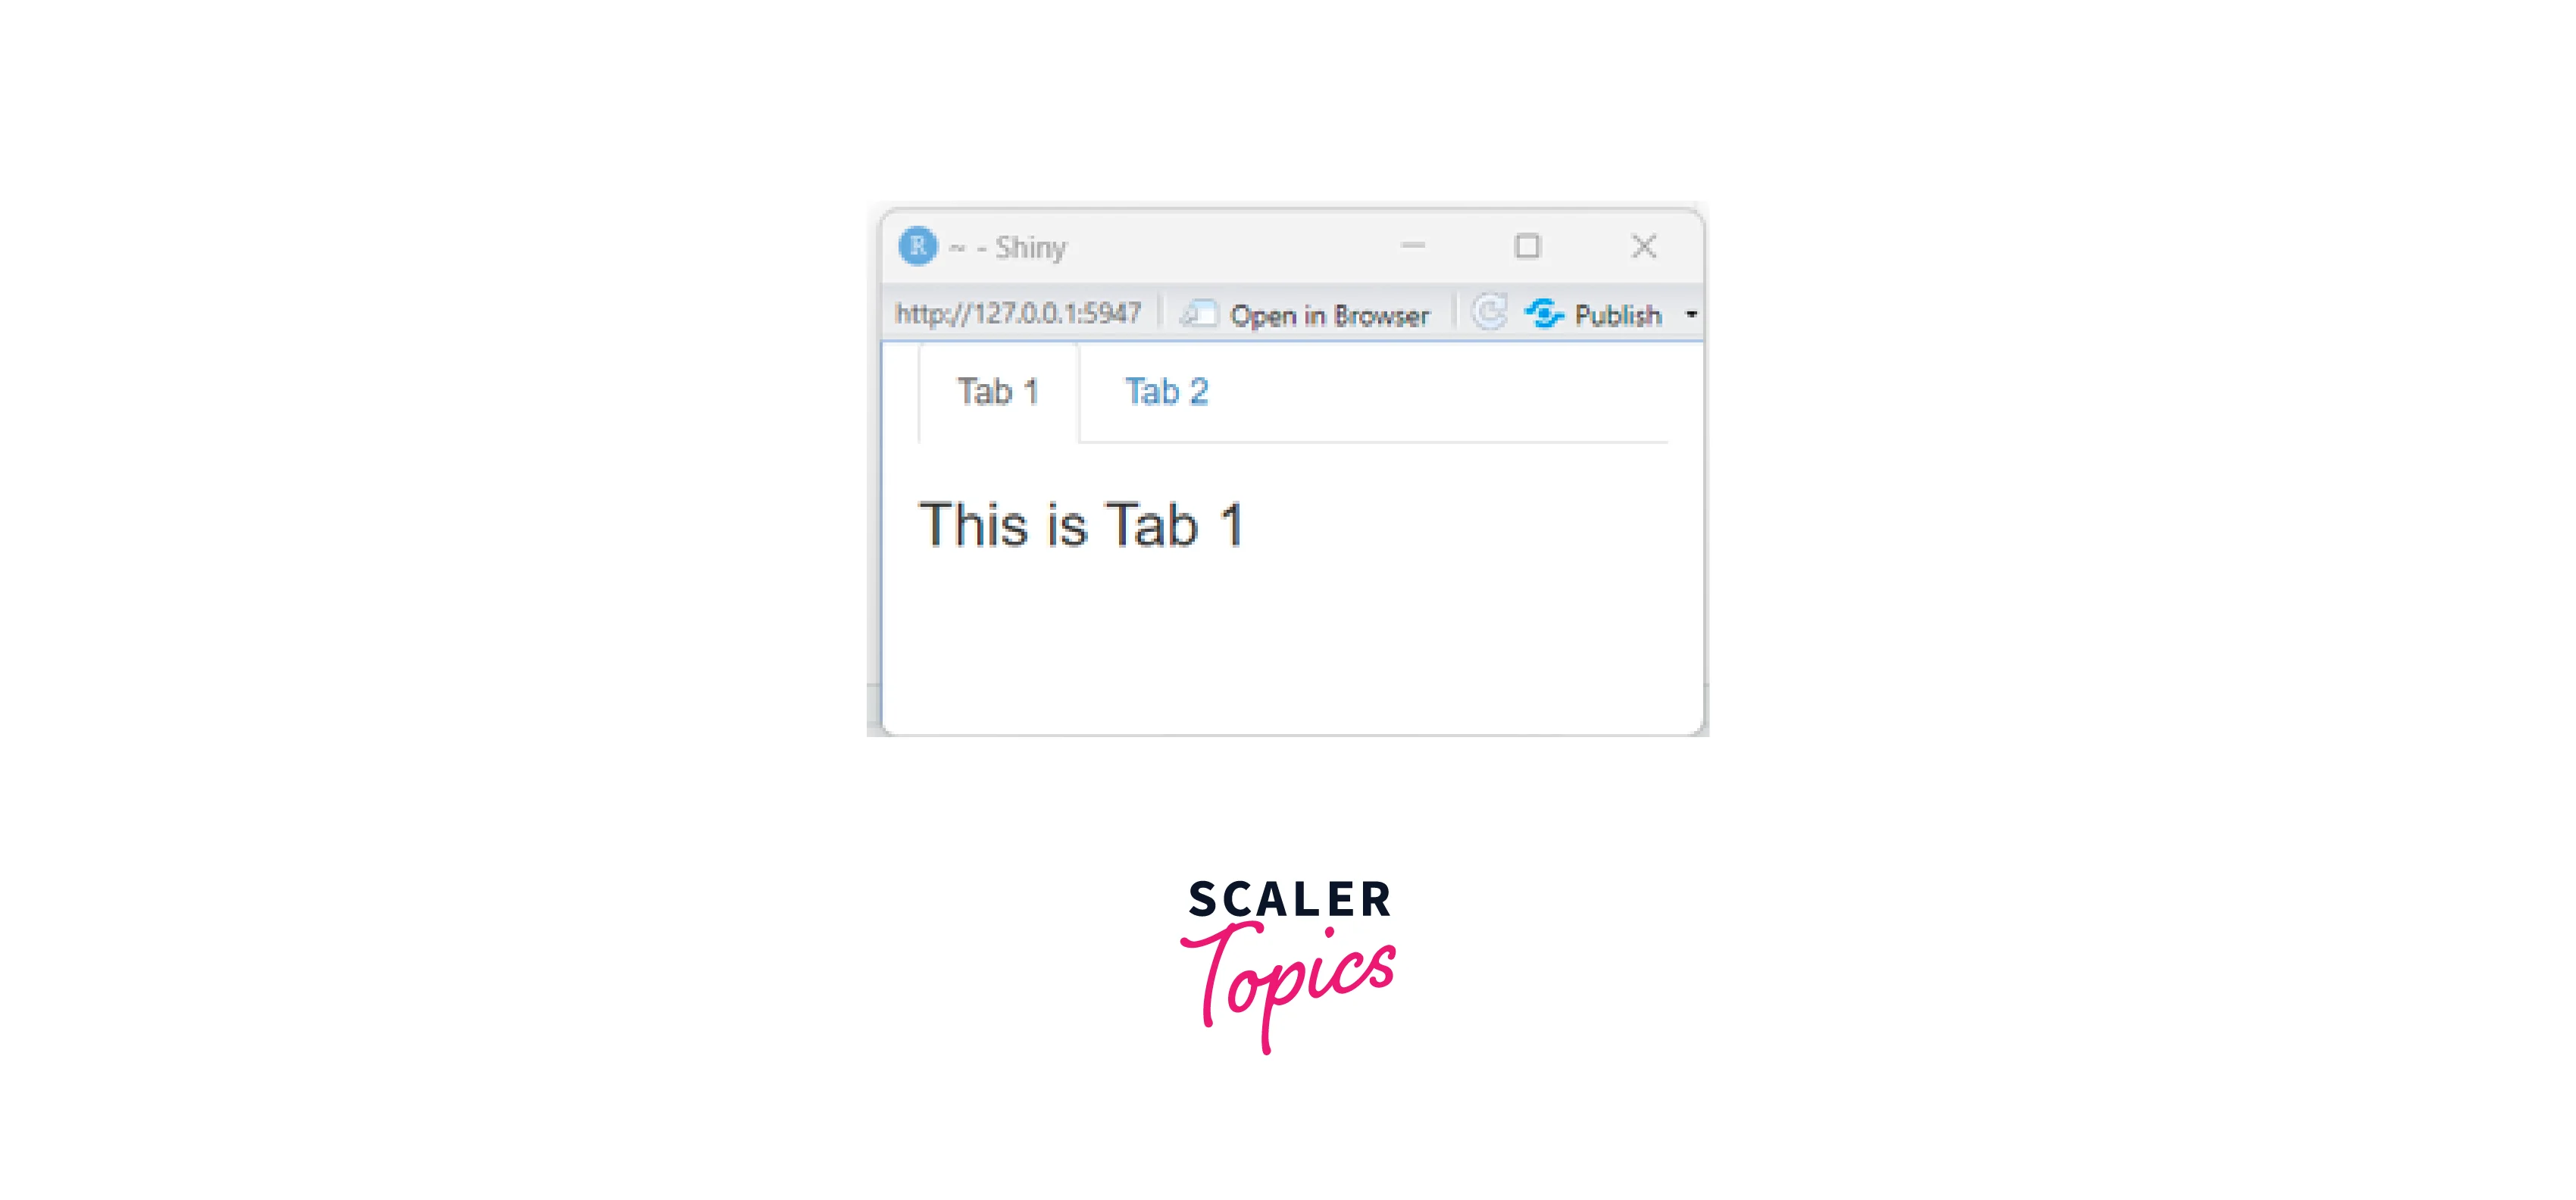
Here we used the tabsetPanel() function to create a set of tabs within our app. Each tab is established using the tabPanel() function. The tabbed interface allows us to easily switch between these sections and access relevant content.
- navbarPage(): This function creates a layout with a navigation bar at the top. It's useful for applications with multiple sections or tabs.
For Example:
Output:
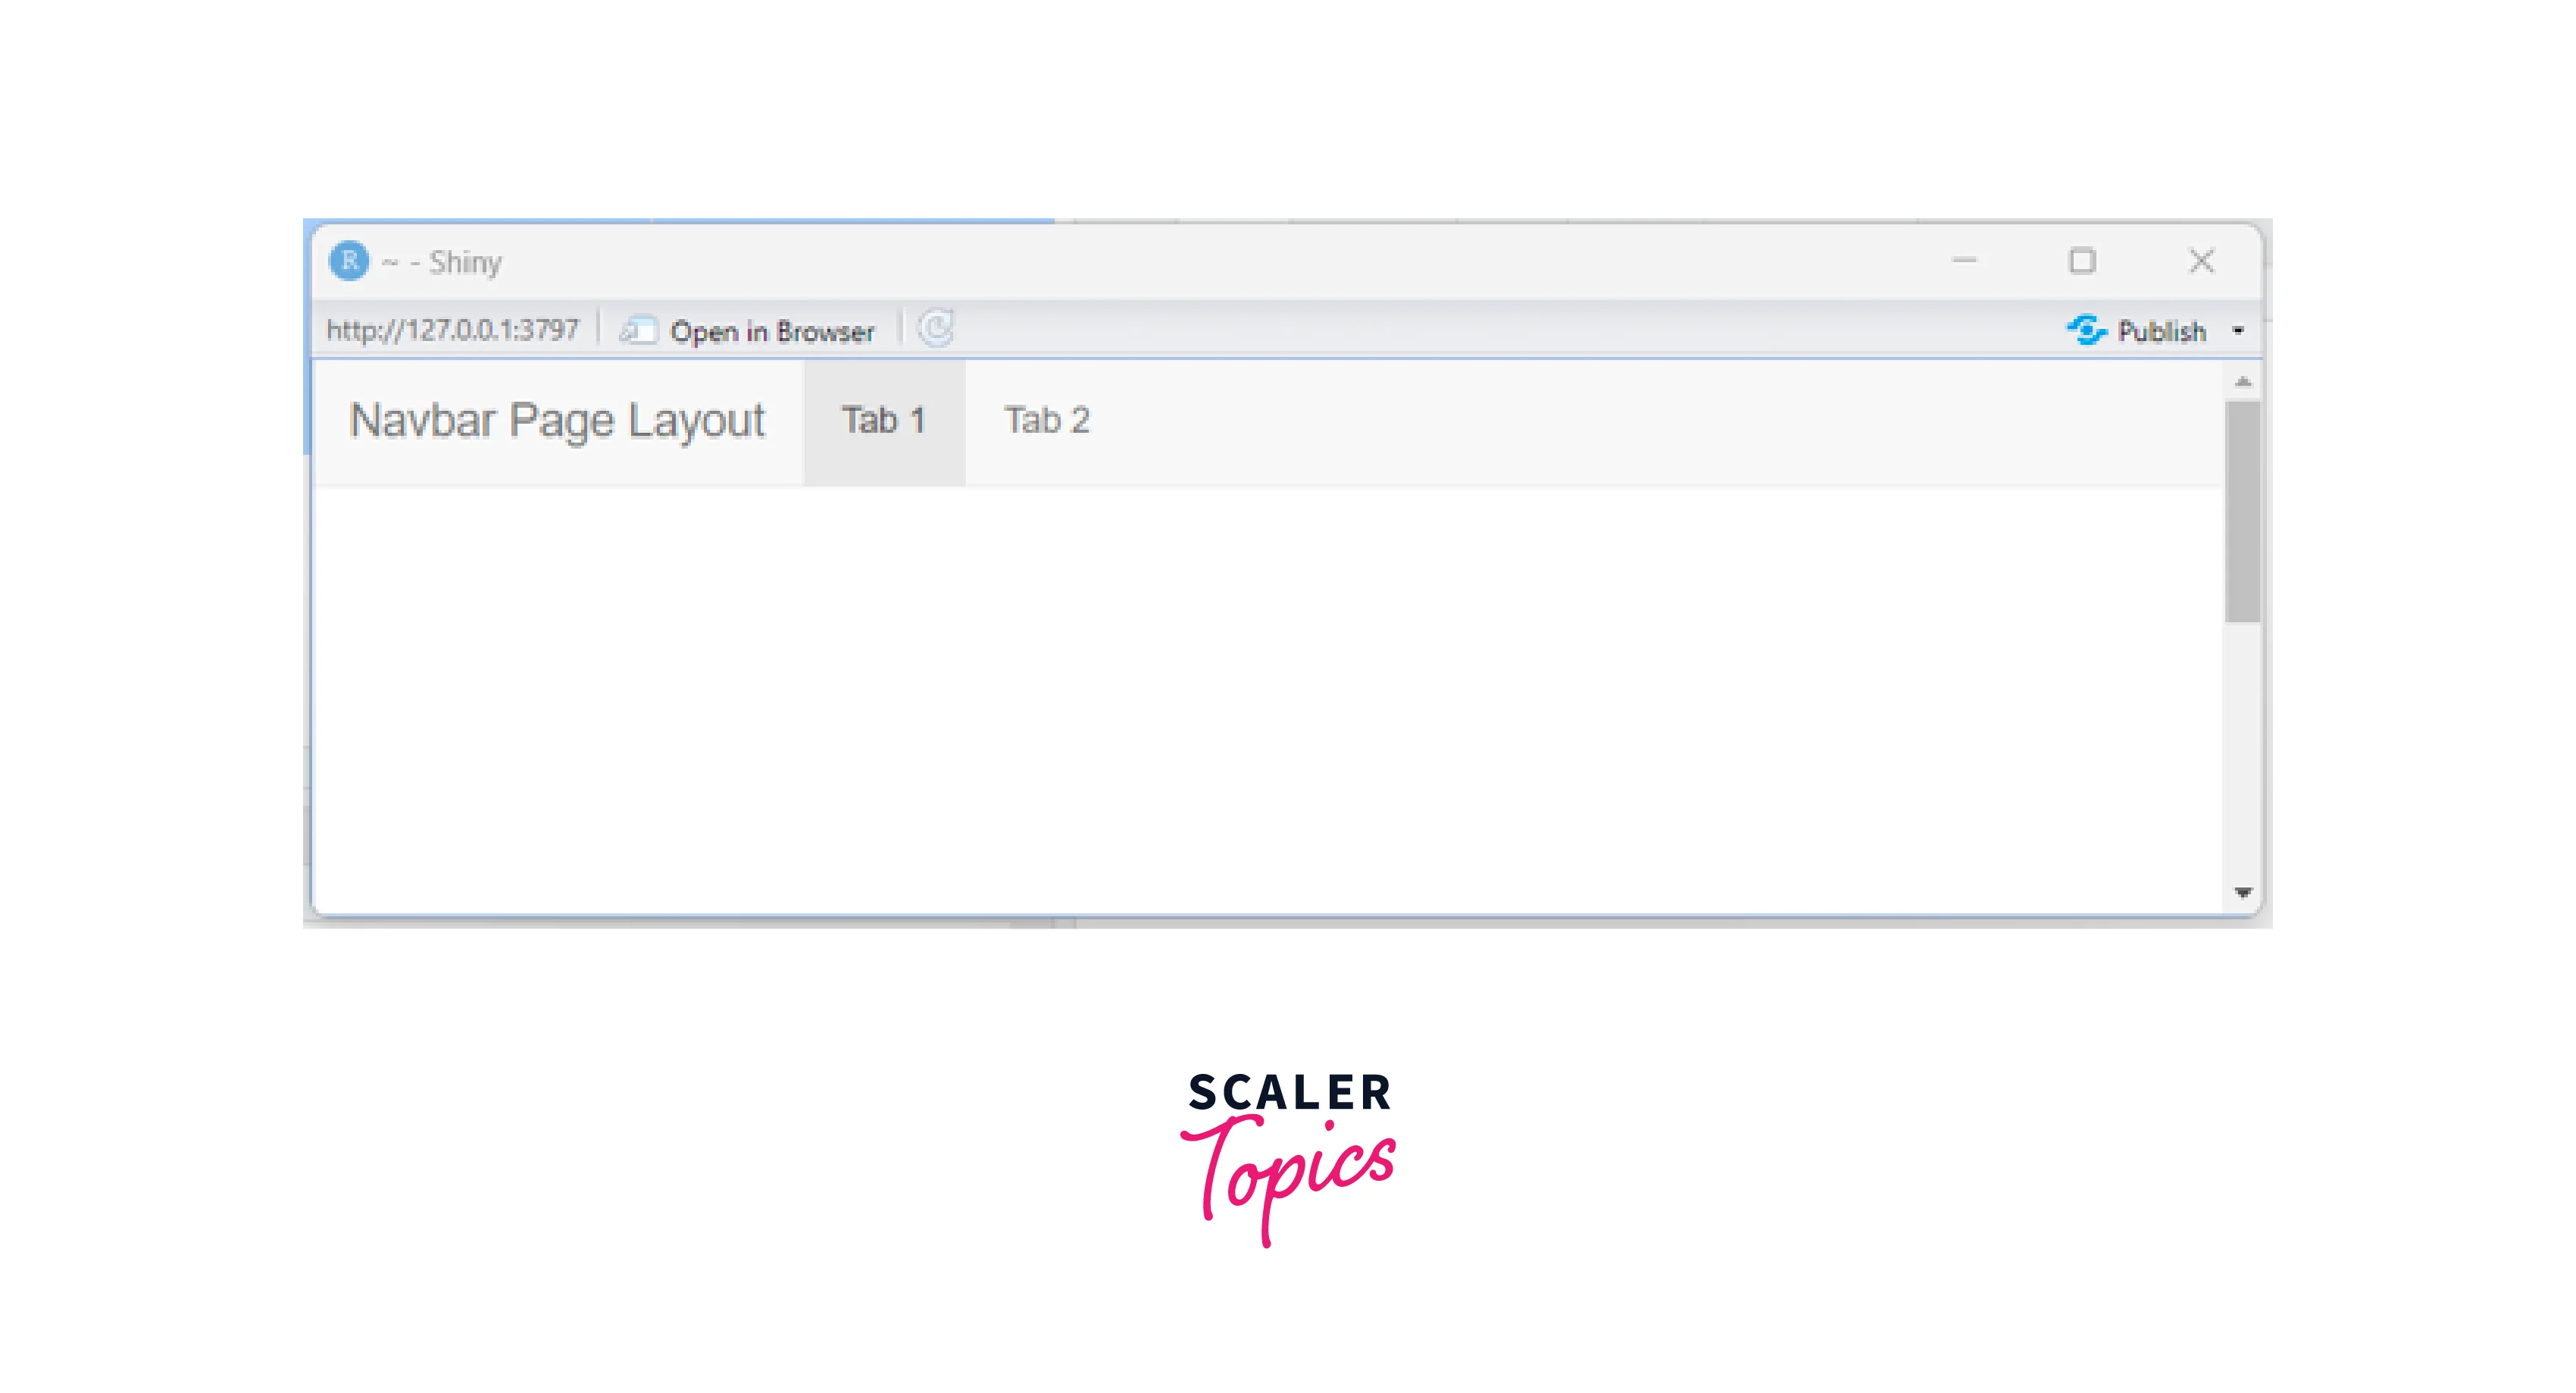
Here, we used the navbarPage() function to set up a UI layout with two tabs: "Tab 1" and "Tab 2." Each tab is associated with a specific output element (plots in this case) defined in the server function. We can switch between tabs to interact with different content.
- sidebarLayout(): This function creates a layout with main and sidebar panels. It is commonly used for including controls or additional information in the sidebar.
For Example:
Output:
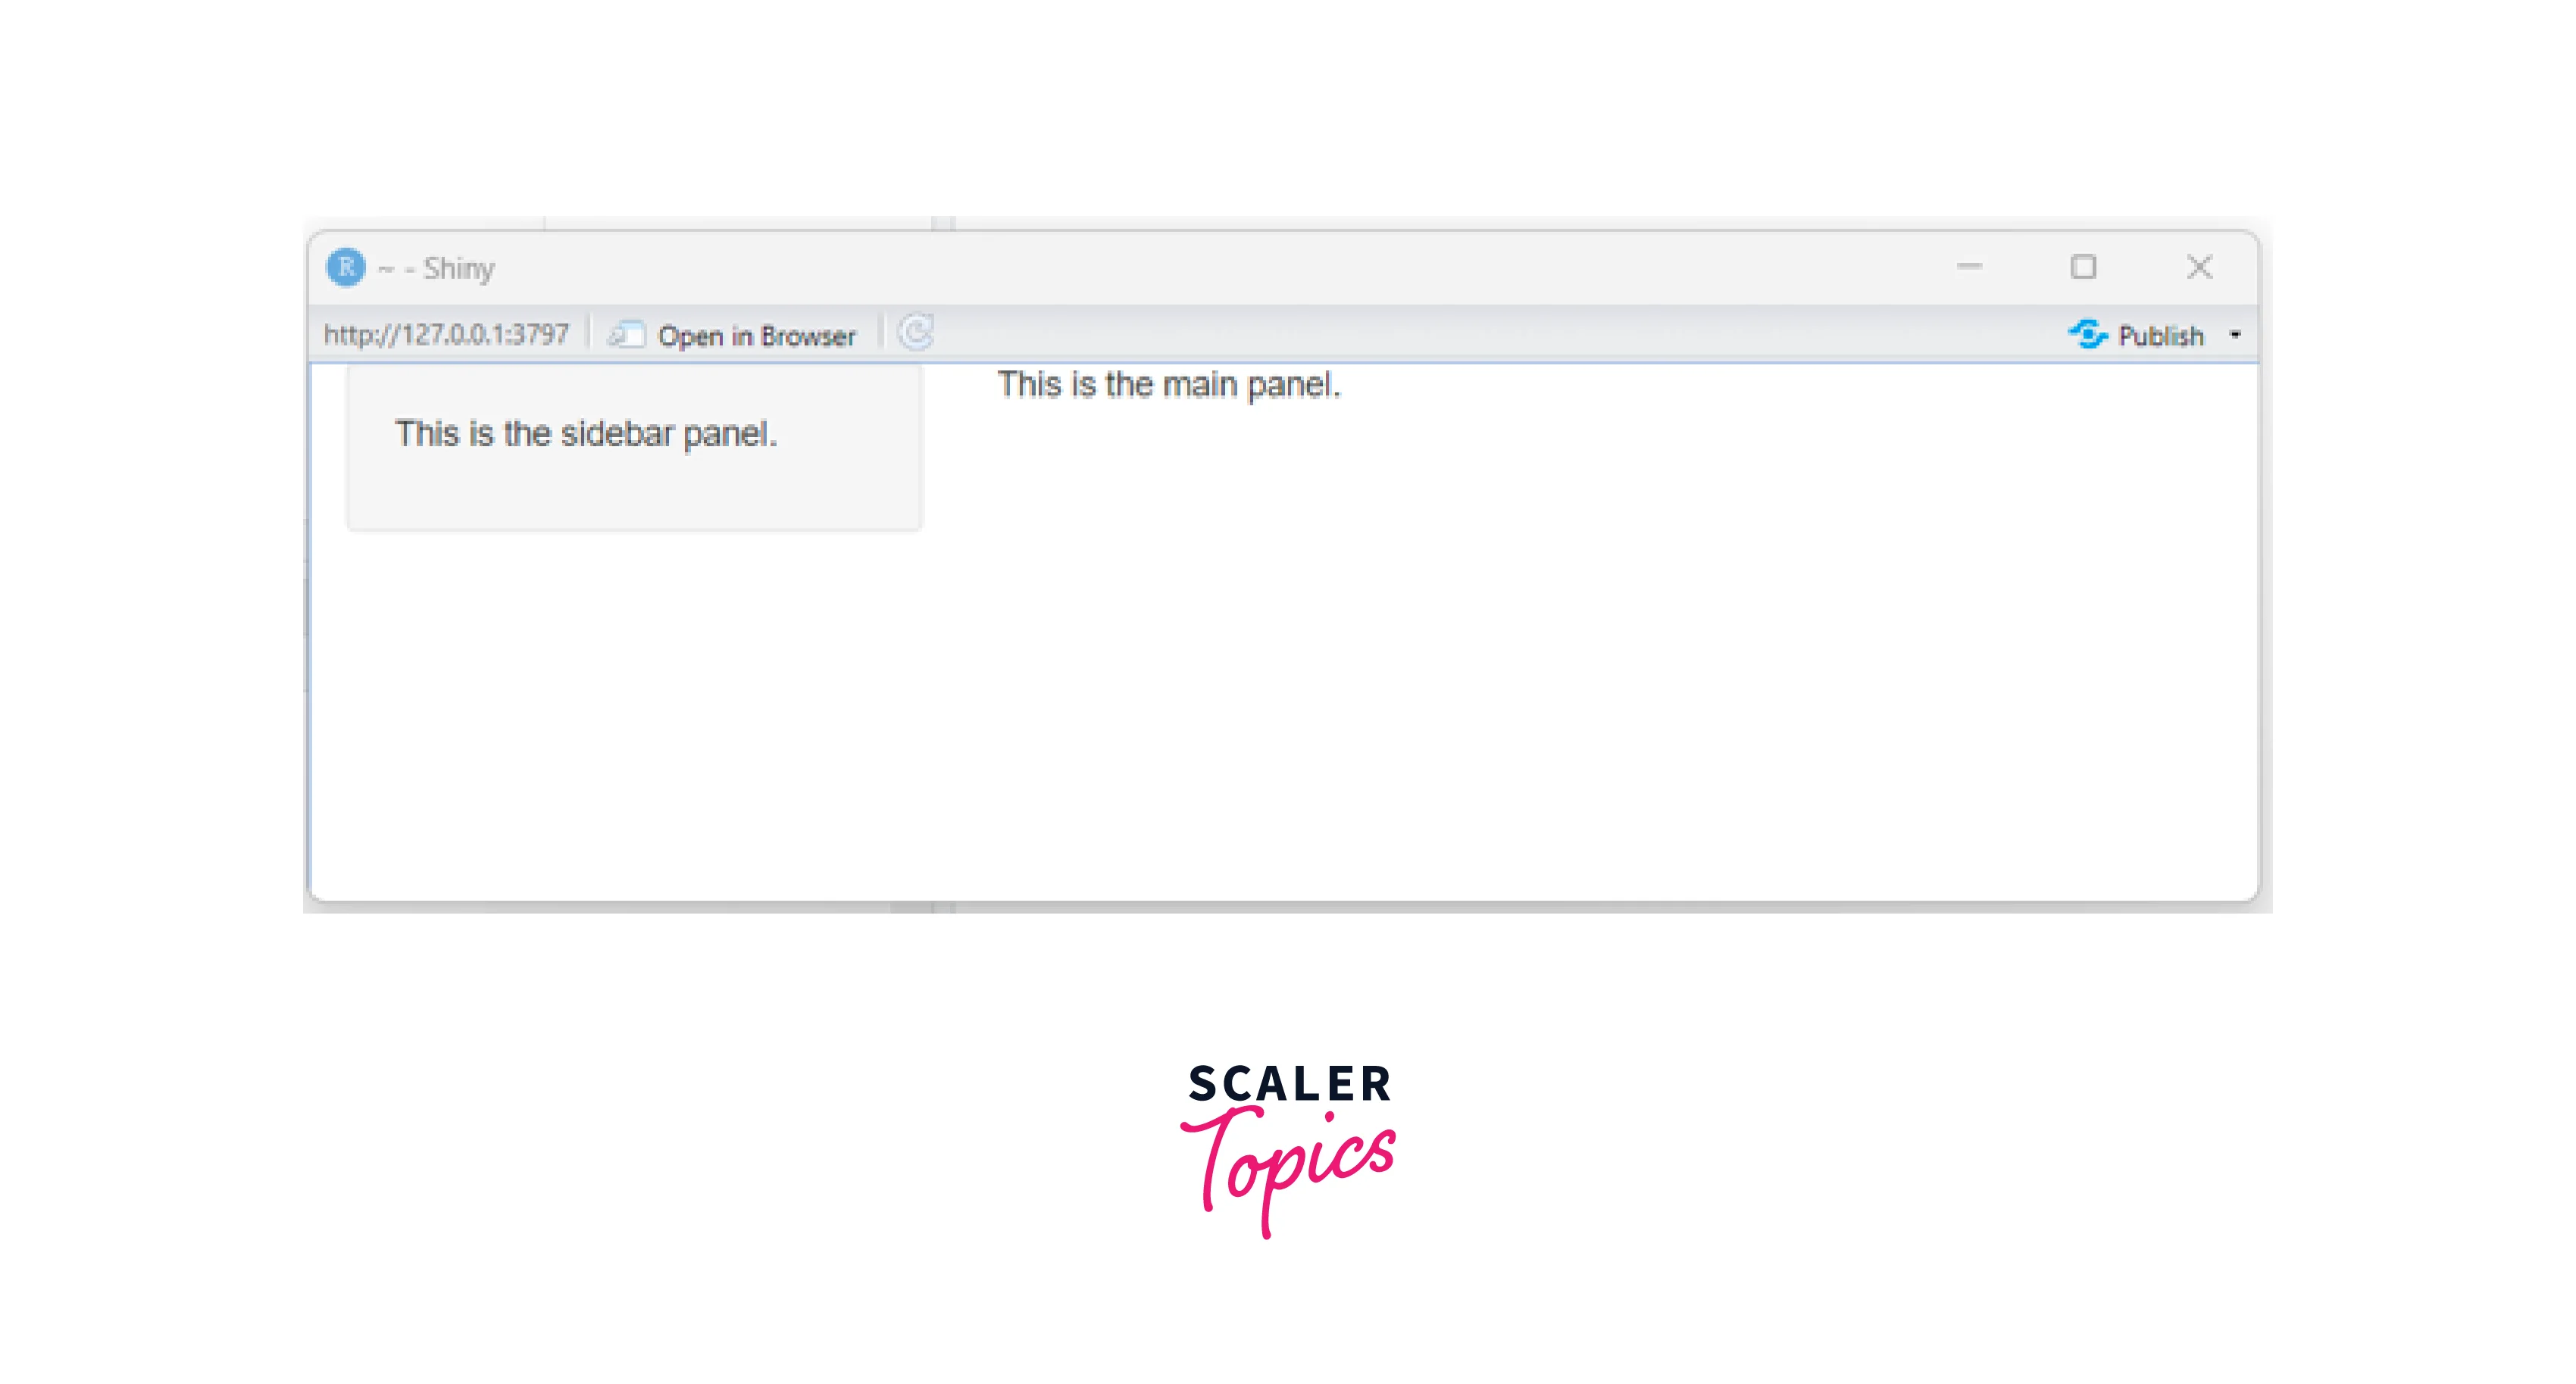
Here, we created a simple layout consisting of a sidebar panel containing text and a main panel containing another text. This layout structure is flexible and can accommodate various UI elements.
Input Functions
Input functions in Shiny are essential for collecting user input and interaction, enabling users to interact with our web application and triggering changes in the application's behaviour. Let us look at some important input functions in Shiny:
- textInput(): This function creates a single-line text input field that allows users to enter text.
For Example:
Output:
Here, we used the textInput() function within a sidebarLayout() function to create a UI layout with a sidebar panel containing a text input field and a main panel displaying the entered text. The server function captures the input from the text input field and renders it as output in the main panel, showing the text we entered.
- numericInput(): This function creates a numeric input field where users can enter numeric values.
For Example:
Output:
Here we used the numericInput() function in a sidebarLayout() function to create a UI layout with a numeric input field in the sidebar panel. The server function captures the numeric input and displays it as output in the main panel, showing the entered numeric value.
- selectInput(): This function creates a dropdown menu allowing users to choose from a pre-defined set of options.
For Example:
Output:
Here we used the selectInput() function within a sidebarLayout() function to construct a UI layout with a dropdown menu in the sidebar panel. We set the choices in the dropdown menu as "Option 1," "Option 2," and "Option 3". The selected option gets displayed as output in the main panel through the server function.
- sliderInput(): This function creates a slider control for users to select a value within a specified range.
For Example:
Output:
Here, we used the sliderInput() function in a sidebarLayout() function to establish a UI layout featuring a slider control in the sidebar panel. We can adjust the slider to select a value between the specified minimum and maximum values. The selected value is displayed in the main panel using the server function.
- radioButtons(): This function creates a set of radio buttons that allow users to choose a single option from a list.
For Example:
Output:
Here, we used the radioButtons() function within a sidebarLayout() function to create a UI layout with radio buttons in the sidebar panel. We can select one of the provided choices, and the selected choice is displayed as output in the main panel through the server function.
Output Functions
Output functions in Shiny are used to generate and display various types of output in the UI section of our web application. They allow us to dynamically render different types of content based on reactive inputs or other conditions. Here are some commonly used output functions:
- renderText(): It is used to generate dynamic text output.
For Example:
Output:
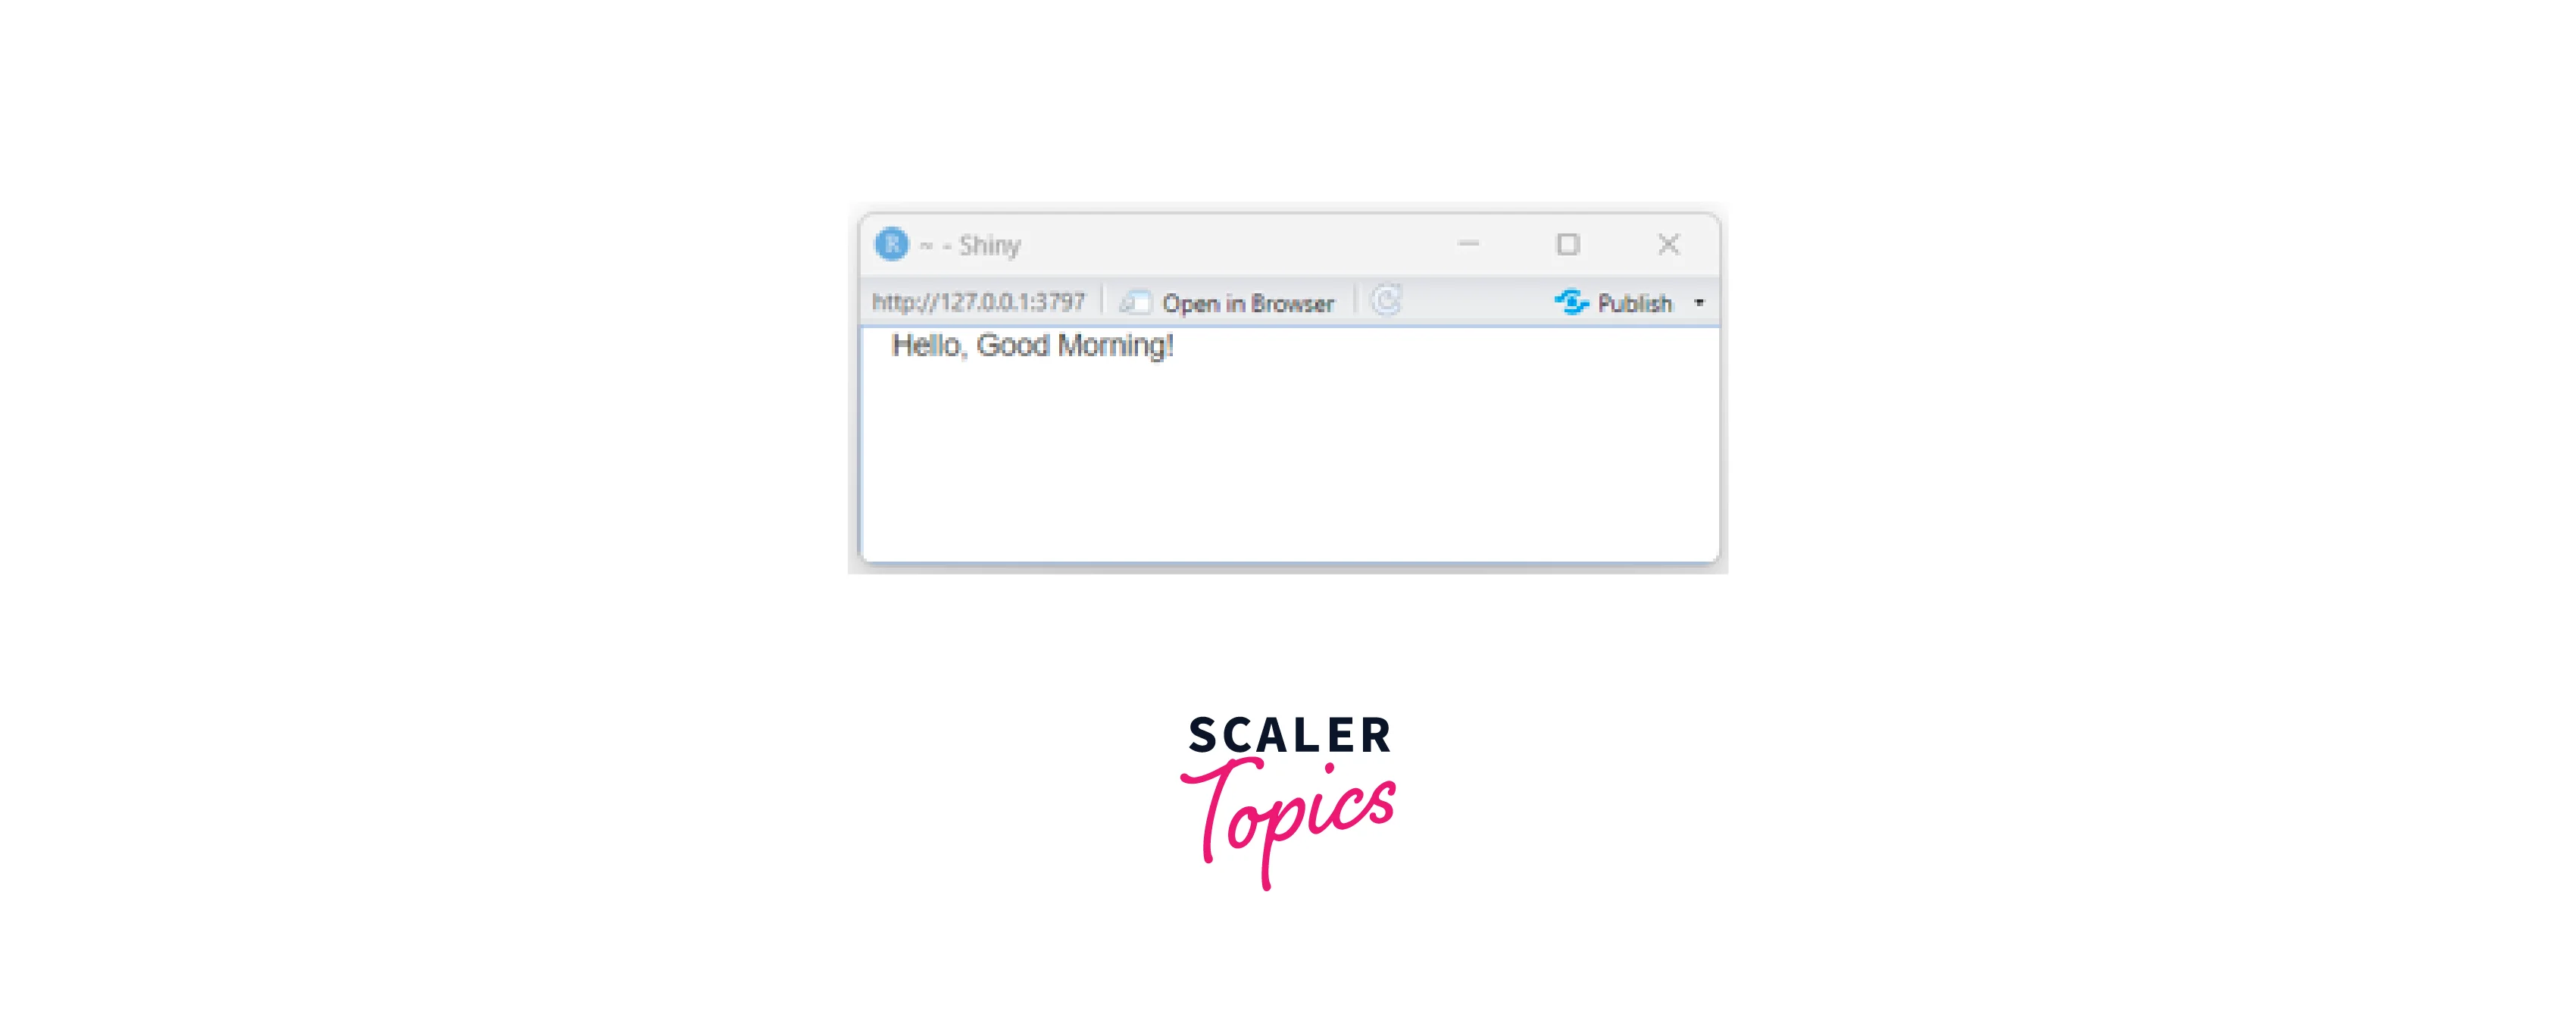
Here, we used the renderText() function to display the static text Hello, Good Morning! in the UI layout's output area.
- renderDataTable(): It is used to generate dynamic data tables using the DT package.
For Example:
Output:
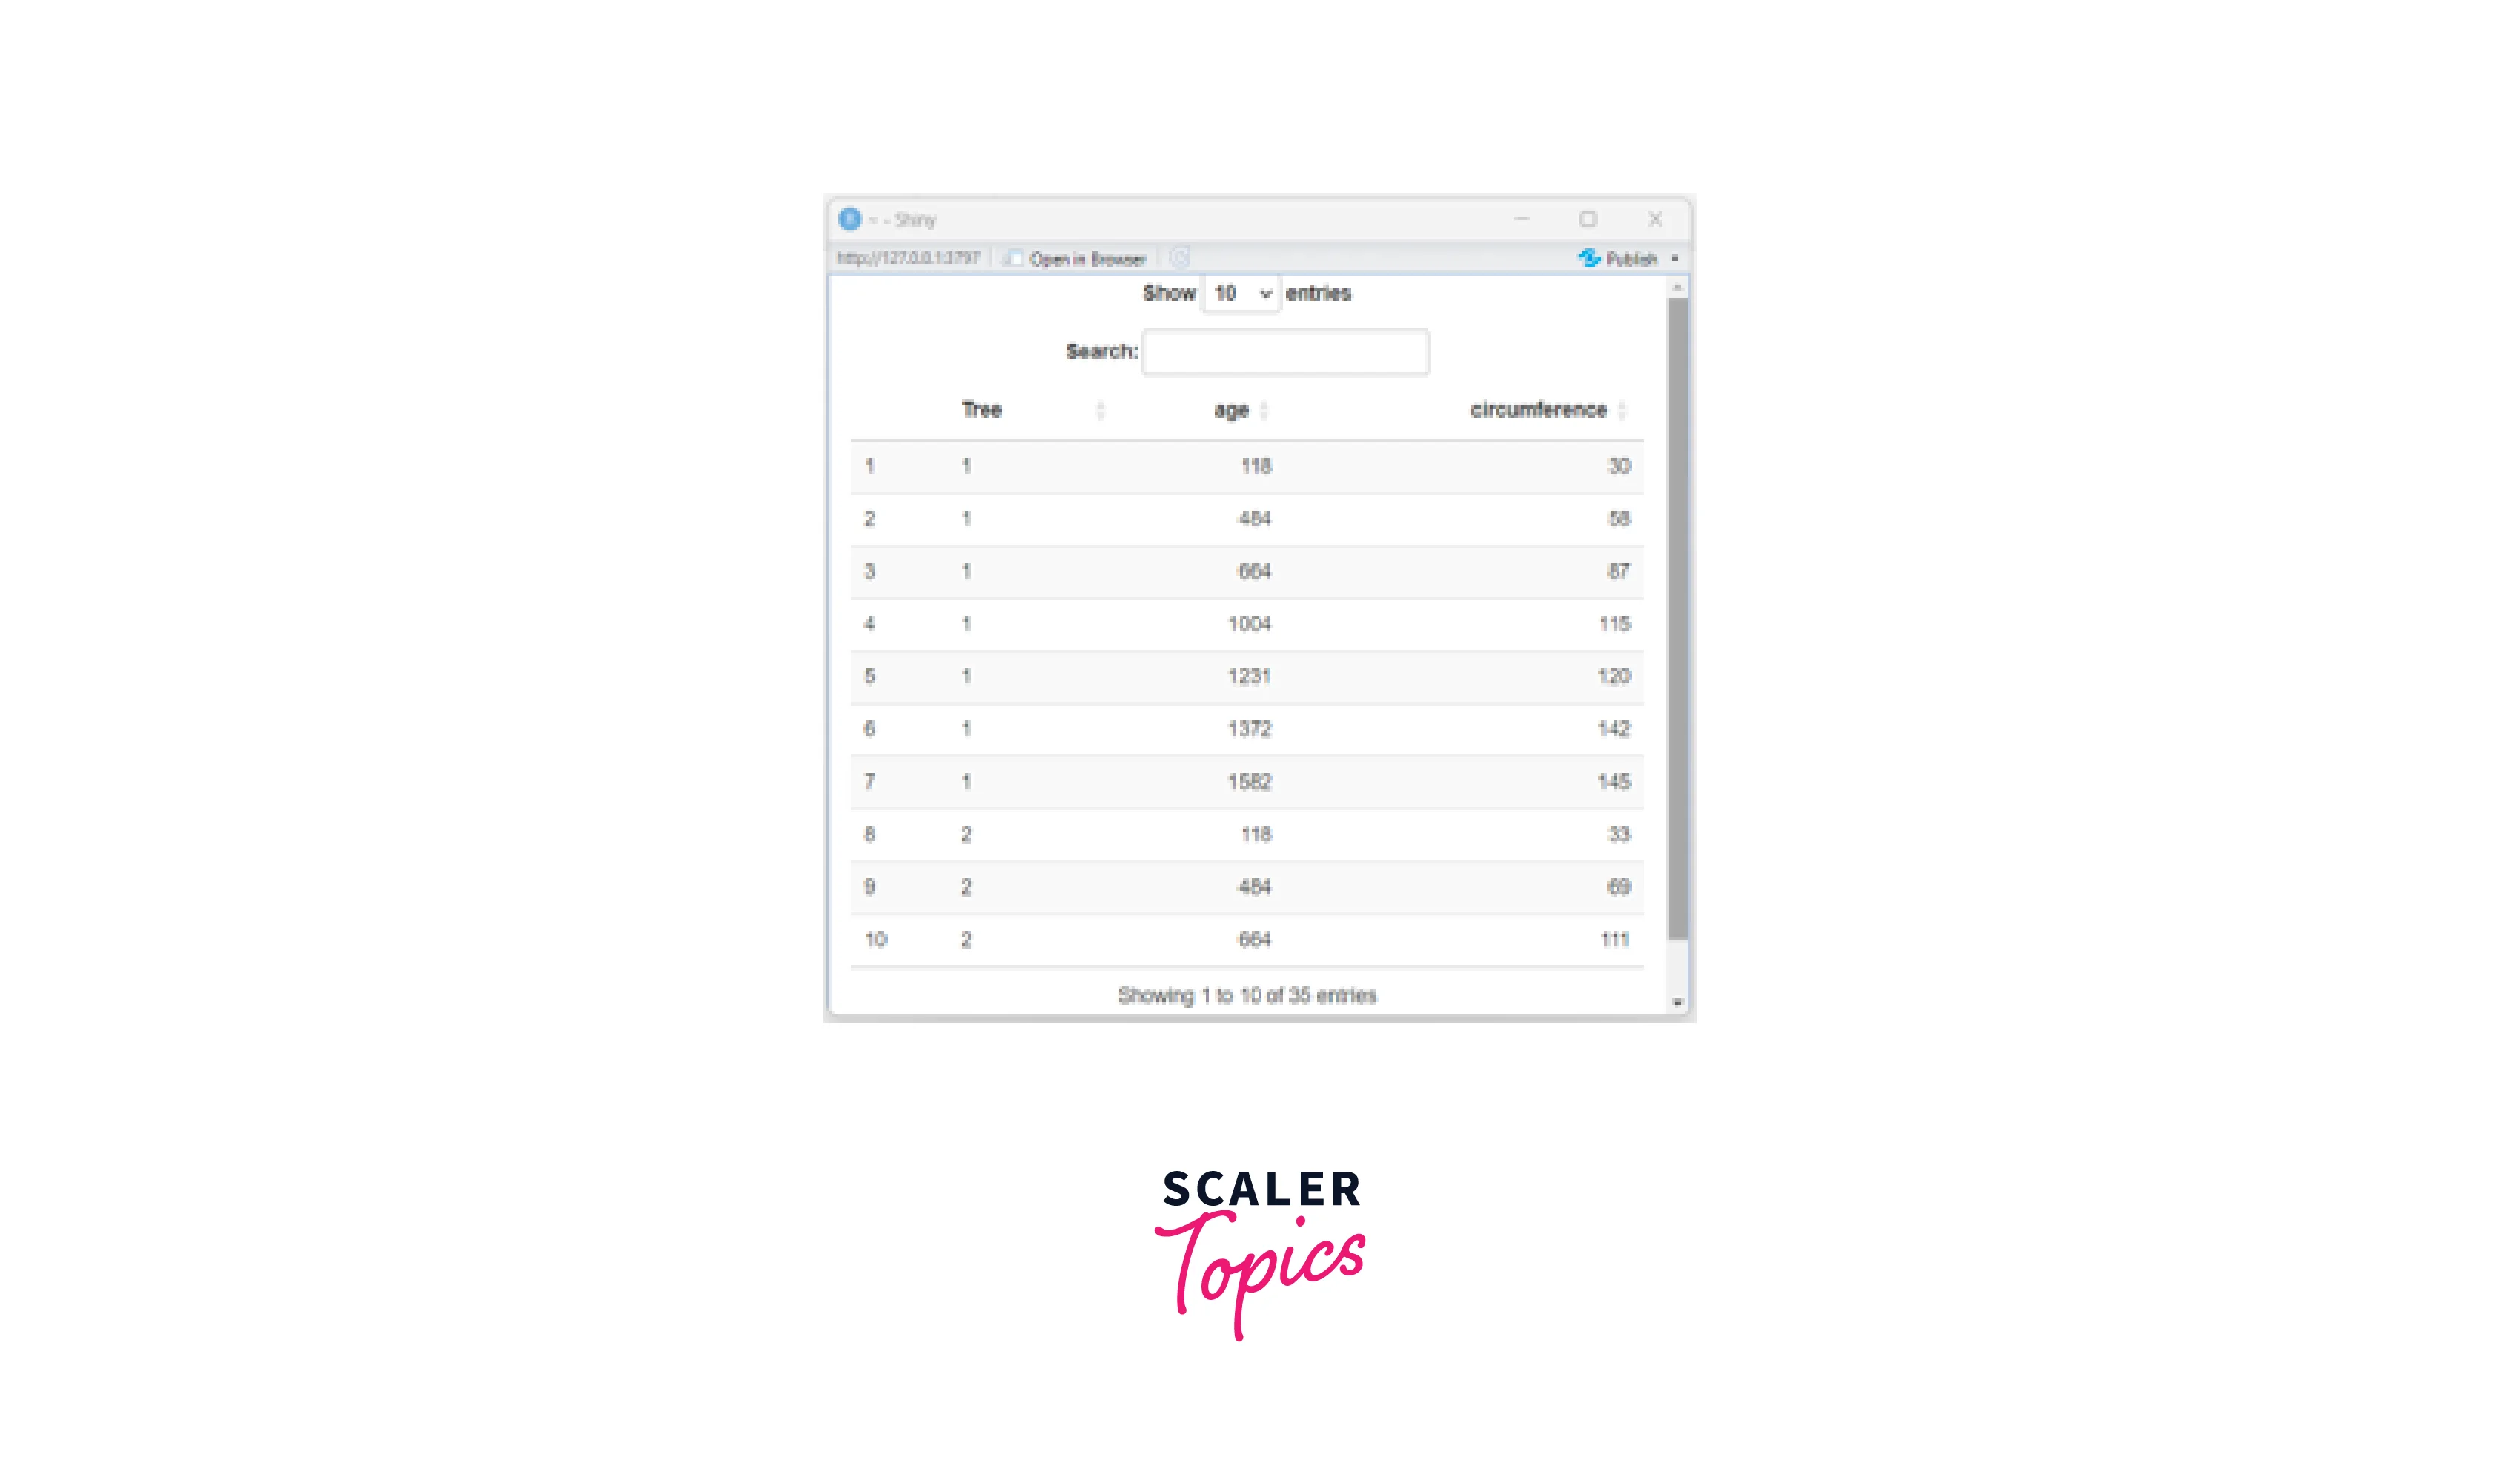
Here, we used the dataTableOutput() in the UI to create a placeholder for the DataTable. Then, we used the renderDataTable() function in the server section to generate a DataTable using the DT package, displaying the Orange dataset. We also limited the page length to 10 rows.
- renderUI(): This function generates dynamic UI elements based on reactive data.
For Example:
Output:
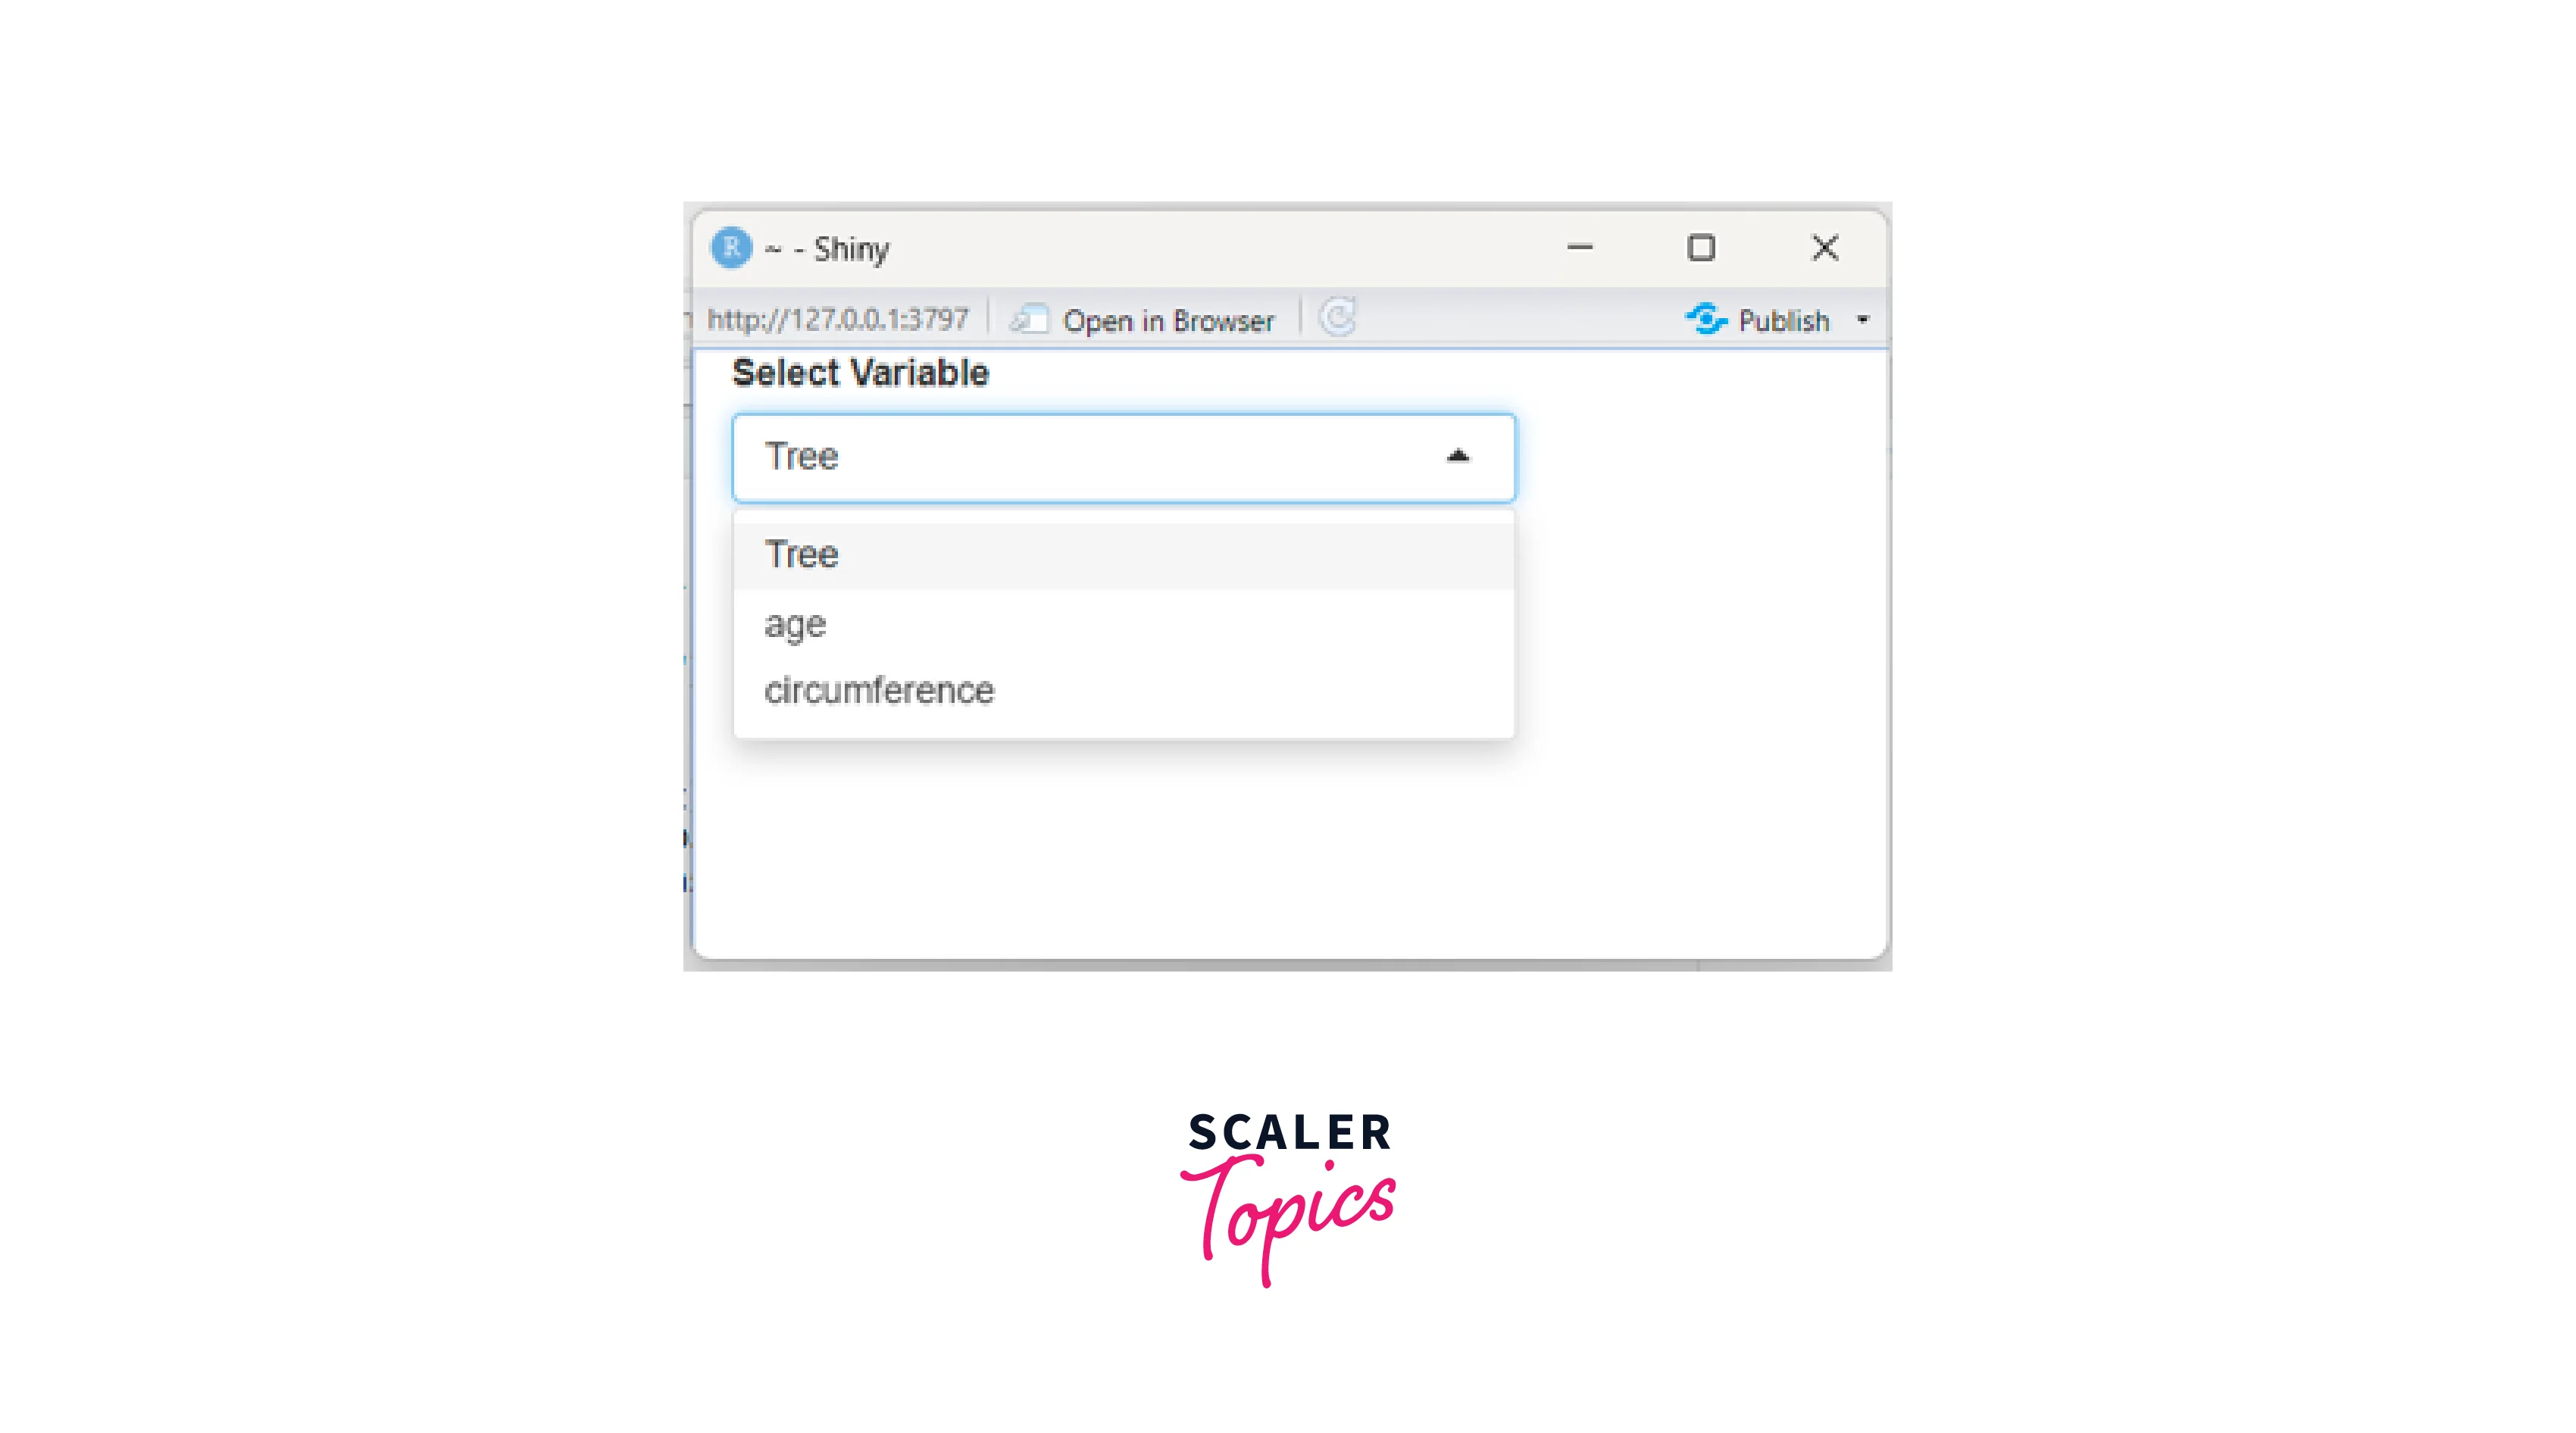
Here we used the renderUI() function for constructing a dropdown based on the column names of the Orange dataset.
- renderPlot(): This function is used within the server component to dynamically generate and update plots based on reactive inputs and expressions.
For Example:
Output:

Here we used the renderPlot() function to generate a plot in our app. We used the base R plot() function to generate a plot using the Orange dataset.
Reactivity Functions
Reactivity functions are an essential component of R's Shiny framework. They allow our Shiny apps to respond dynamically to user input, data changes, and other events. Here are some commonly used reactivity functions:
- observe(): This function executes code in response to reactive changes.
For Example:
Output:
Here, we used the numeric input field in the UI to enter a number. The observe() function monitors changes to the input value within the server function. When the input changes, the renderPrint() function multiplies the entered number by 2. This reactive behaviour ensures that the displayed output is updated whenever the input value changes.
- observeEvent(): This function executes code in response to a specific event, such as button clicks or input changes.
For Example:
Output:
Here, we included a button in the UI using the actionButton() function. The observeEvent() function monitors for clicks on the button in the server function. When the button is clicked, the renderPrint() function displays the text The button is clicked! as output.
- reactive(): This function in Shiny automatically calculates and updates its value whenever its dependent inputs change.
For Example:
Output:
Here we used the reactive() function to create a dynamic reactive expression that responds to the given inputs. Here we created a reactive expression named power_result, which calculates the power of the given number.
- reactiveValues(): This function creates a storage box for changing values in a Shiny app that can be updated and accessed reactively.
For Example:
Output:
Here we used the reactiveValues() function to define a reactive value named values with an initial count of zero. When the Increment button is clicked, we increment this count through the observeEvent() function. The value of the count is then displayed using the renderPrint() function.
- eventReactive(): This function creates a reactive expression in response to a certain event, such as a button push or slider input. Using this function, we can regulate when and how reactive computations are performed in response to specified events.
For Example:
Output:
Here we used the eventReactive() function to create a reactive expression that specifically reacts to a particular event. When we change the value on the slider input, the calc_result expression is triggered. It doubles the selected number and generates an output string, which is then displayed using the renderPrint() function.
Output Control Functions
Output Control Functions in Shiny allow us to selectively show or hide UI elements based on certain conditions or user interactions.
- conditionalPanel(): This function dynamically shows or hides UI elements based on a JavaScript expression.
For Example:
Output:
Here we used the conditionalPanel() function to create a conditional display of content. The condition is linked to the show_plot checkbox input. When the checkbox is selected, the renderPlot() function generates the plot.
- actionButton(): This function creates a button that users can click to trigger specific actions or updates within the app.
For Example:
Output:
We used the actionButton() function to create a button that performs a certain action when clicked. In the server function, we used the renderPrint() function to determine the text to display based on the value of update_button. When the button is clicked, the text Text has been updated! appears. If not, the message Click the button to update text. appears.
Next Steps
We have familiarized ourselves with the fundamentals of the Shiny package in R; now let's explore some additional features to learn next to improve our interactive data visualization skills further.
- Adding Custom Styling : We can learn how to apply customized CSS styles to Shiny applications for a unique and visually appealing design.
- Adding Interactive Widgets: We can try different input and output widgets, such as interactive maps and plots, to improve the impact of our web applications.
- Performance Optimization: We can explore strategies for optimizing Shiny app performance through smart reactive programming.
- Database Integration: We can extend the functionality by integrating Shiny apps with databases, to allow the use of real-time data.
- Reactive Expressions: We can learn the use of reactive expressions to improve computing power and manage complex data within our Shiny apps.
Conclusion
- Shiny is a powerful package in R programming used to create interactive web applications easily.
- Shiny provides a wide range of UI control and layout functions to help us design the interface for our application. These functions include fluidPage(), fluidRow(), sidebarLayout(), and more.
- To make our application interactive, Shiny provides various input functions that allow us to enter data or make selections. These functions include textInput(), numericInput(), selectInput(), sliderInput(), etc.
- Also, we can use Shiny's output functions to display the results of our calculations by using different functions like renderText(), renderDataTable(), renderUI(), etc.
- Moreover, we can use Shiny's reactivity functions to automatically update our output whenever the input is changed. These functions include observe(), observeEvent(), reactive(), reactiveValues() etc.
- Additionally, Shiny provides output control functions that allow us to control when and how our output elements are displayed. These functions include conditionalPanel(), actionButton(), and more.