Gantt Charts and Burndown Charts in JIRA
Overview
Project management is an essential term when it comes to delivering world-class projects. Effective management is required to deliver quality and highly functional projects. Gantt Charts in JIRA are highly useful and effective when it comes to effective project tracking and management of tasks and issues against a timeline by providing a graph with horizontal bars, each giving an idea of the time for each task.
Introduction
A Gantt Chart in JIRA is an easy-to-understand, powerful, visual tool developed by Henry Gantt which proved to be a very effective project management tool to track and manage projects. It is popular because it helps increase teamwork efficiency by providing a birds-eye view of the project.
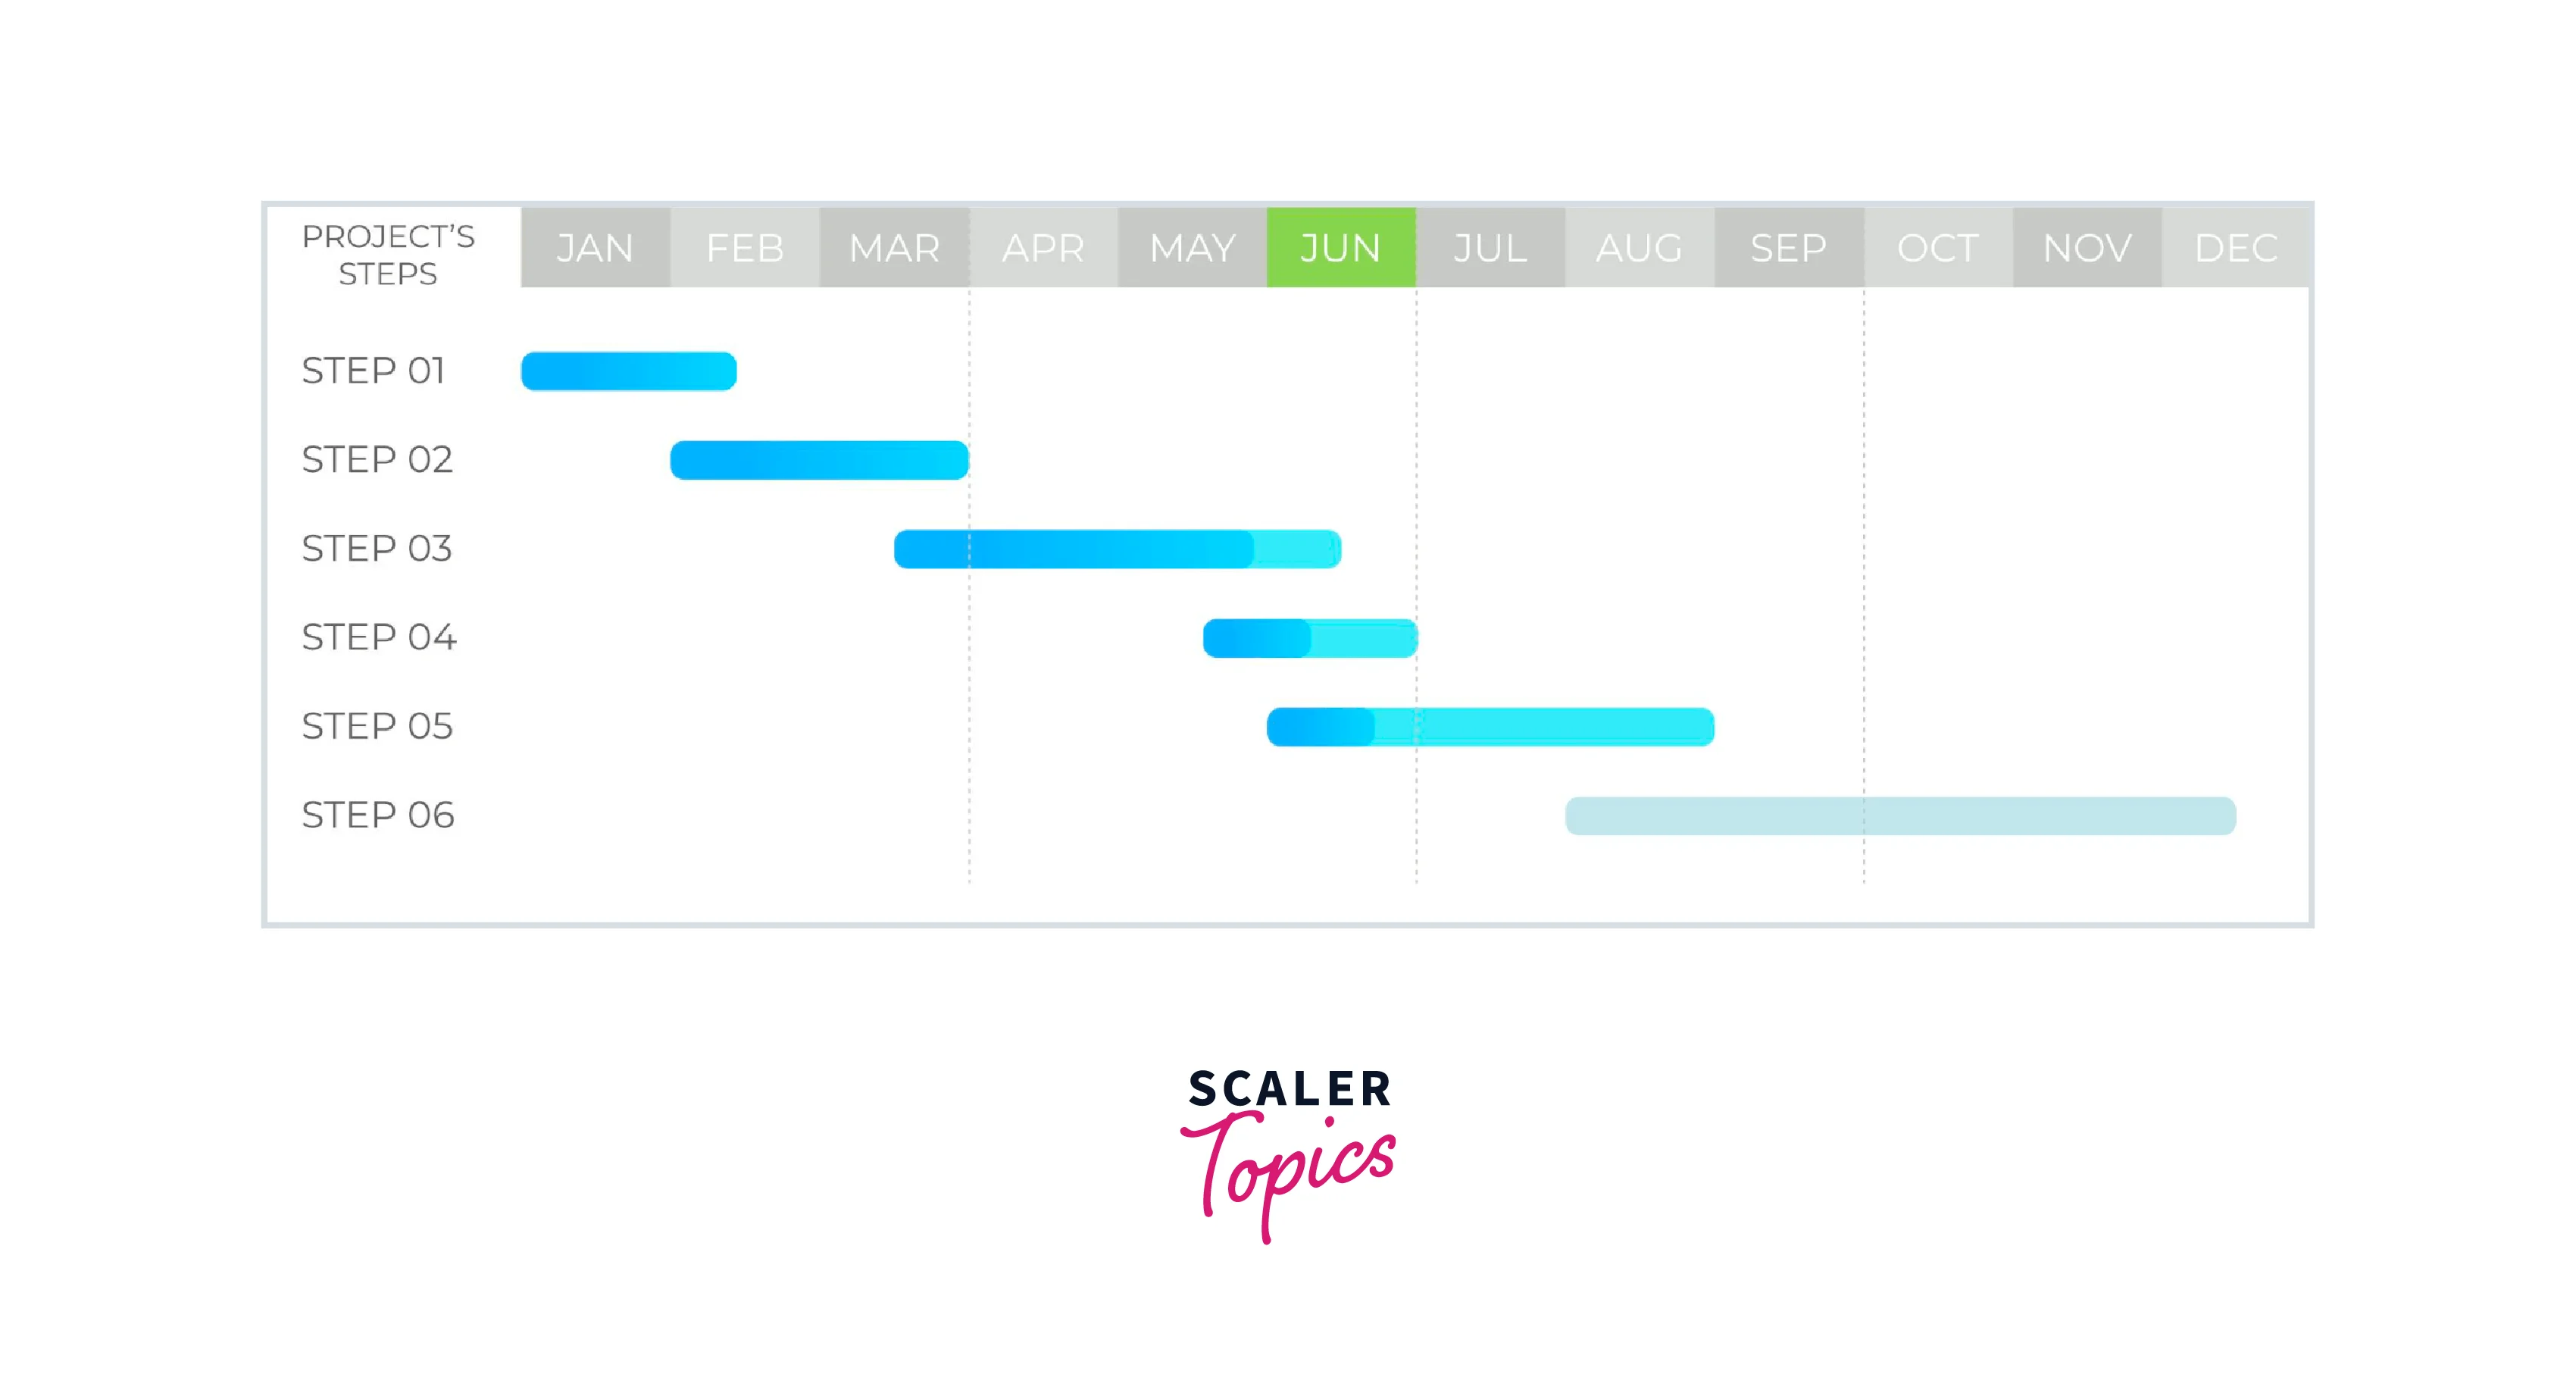
It contains all the activities in the form of a bar where each bar represents each activity. The position and length of a bar in the chart refer to the start time, duration, and expected finish time.
Why Use Gantt Charts in Jira?
Using a Gantt Chart can have many advantages for our project. Some of them are listed below:
- It helps decide clear responsibilities for every individual working on the project by preparing an initial schedule for the project and also gives an idea about the completion time.
- It helps in getting a correct flow of tasks keeping in mind the interdependencies and relationships involved in various tasks.
- We can decide easily which tasks can be taken in parallel and which ones are in sequential order.
- We can keep track of resource allocation by using the Resource Gantt chart.
- Easy to adjust the timeline when there are some changes in the project.
- Reporting and monitoring mechanism to make sure no one is going off-track in a project.
- Effective in communication and management of the project with stakeholders and participants
- Easy to track accomplishments and milestones in a project
- Easy to track the backlogs.
The Basics of a Gantt Chart
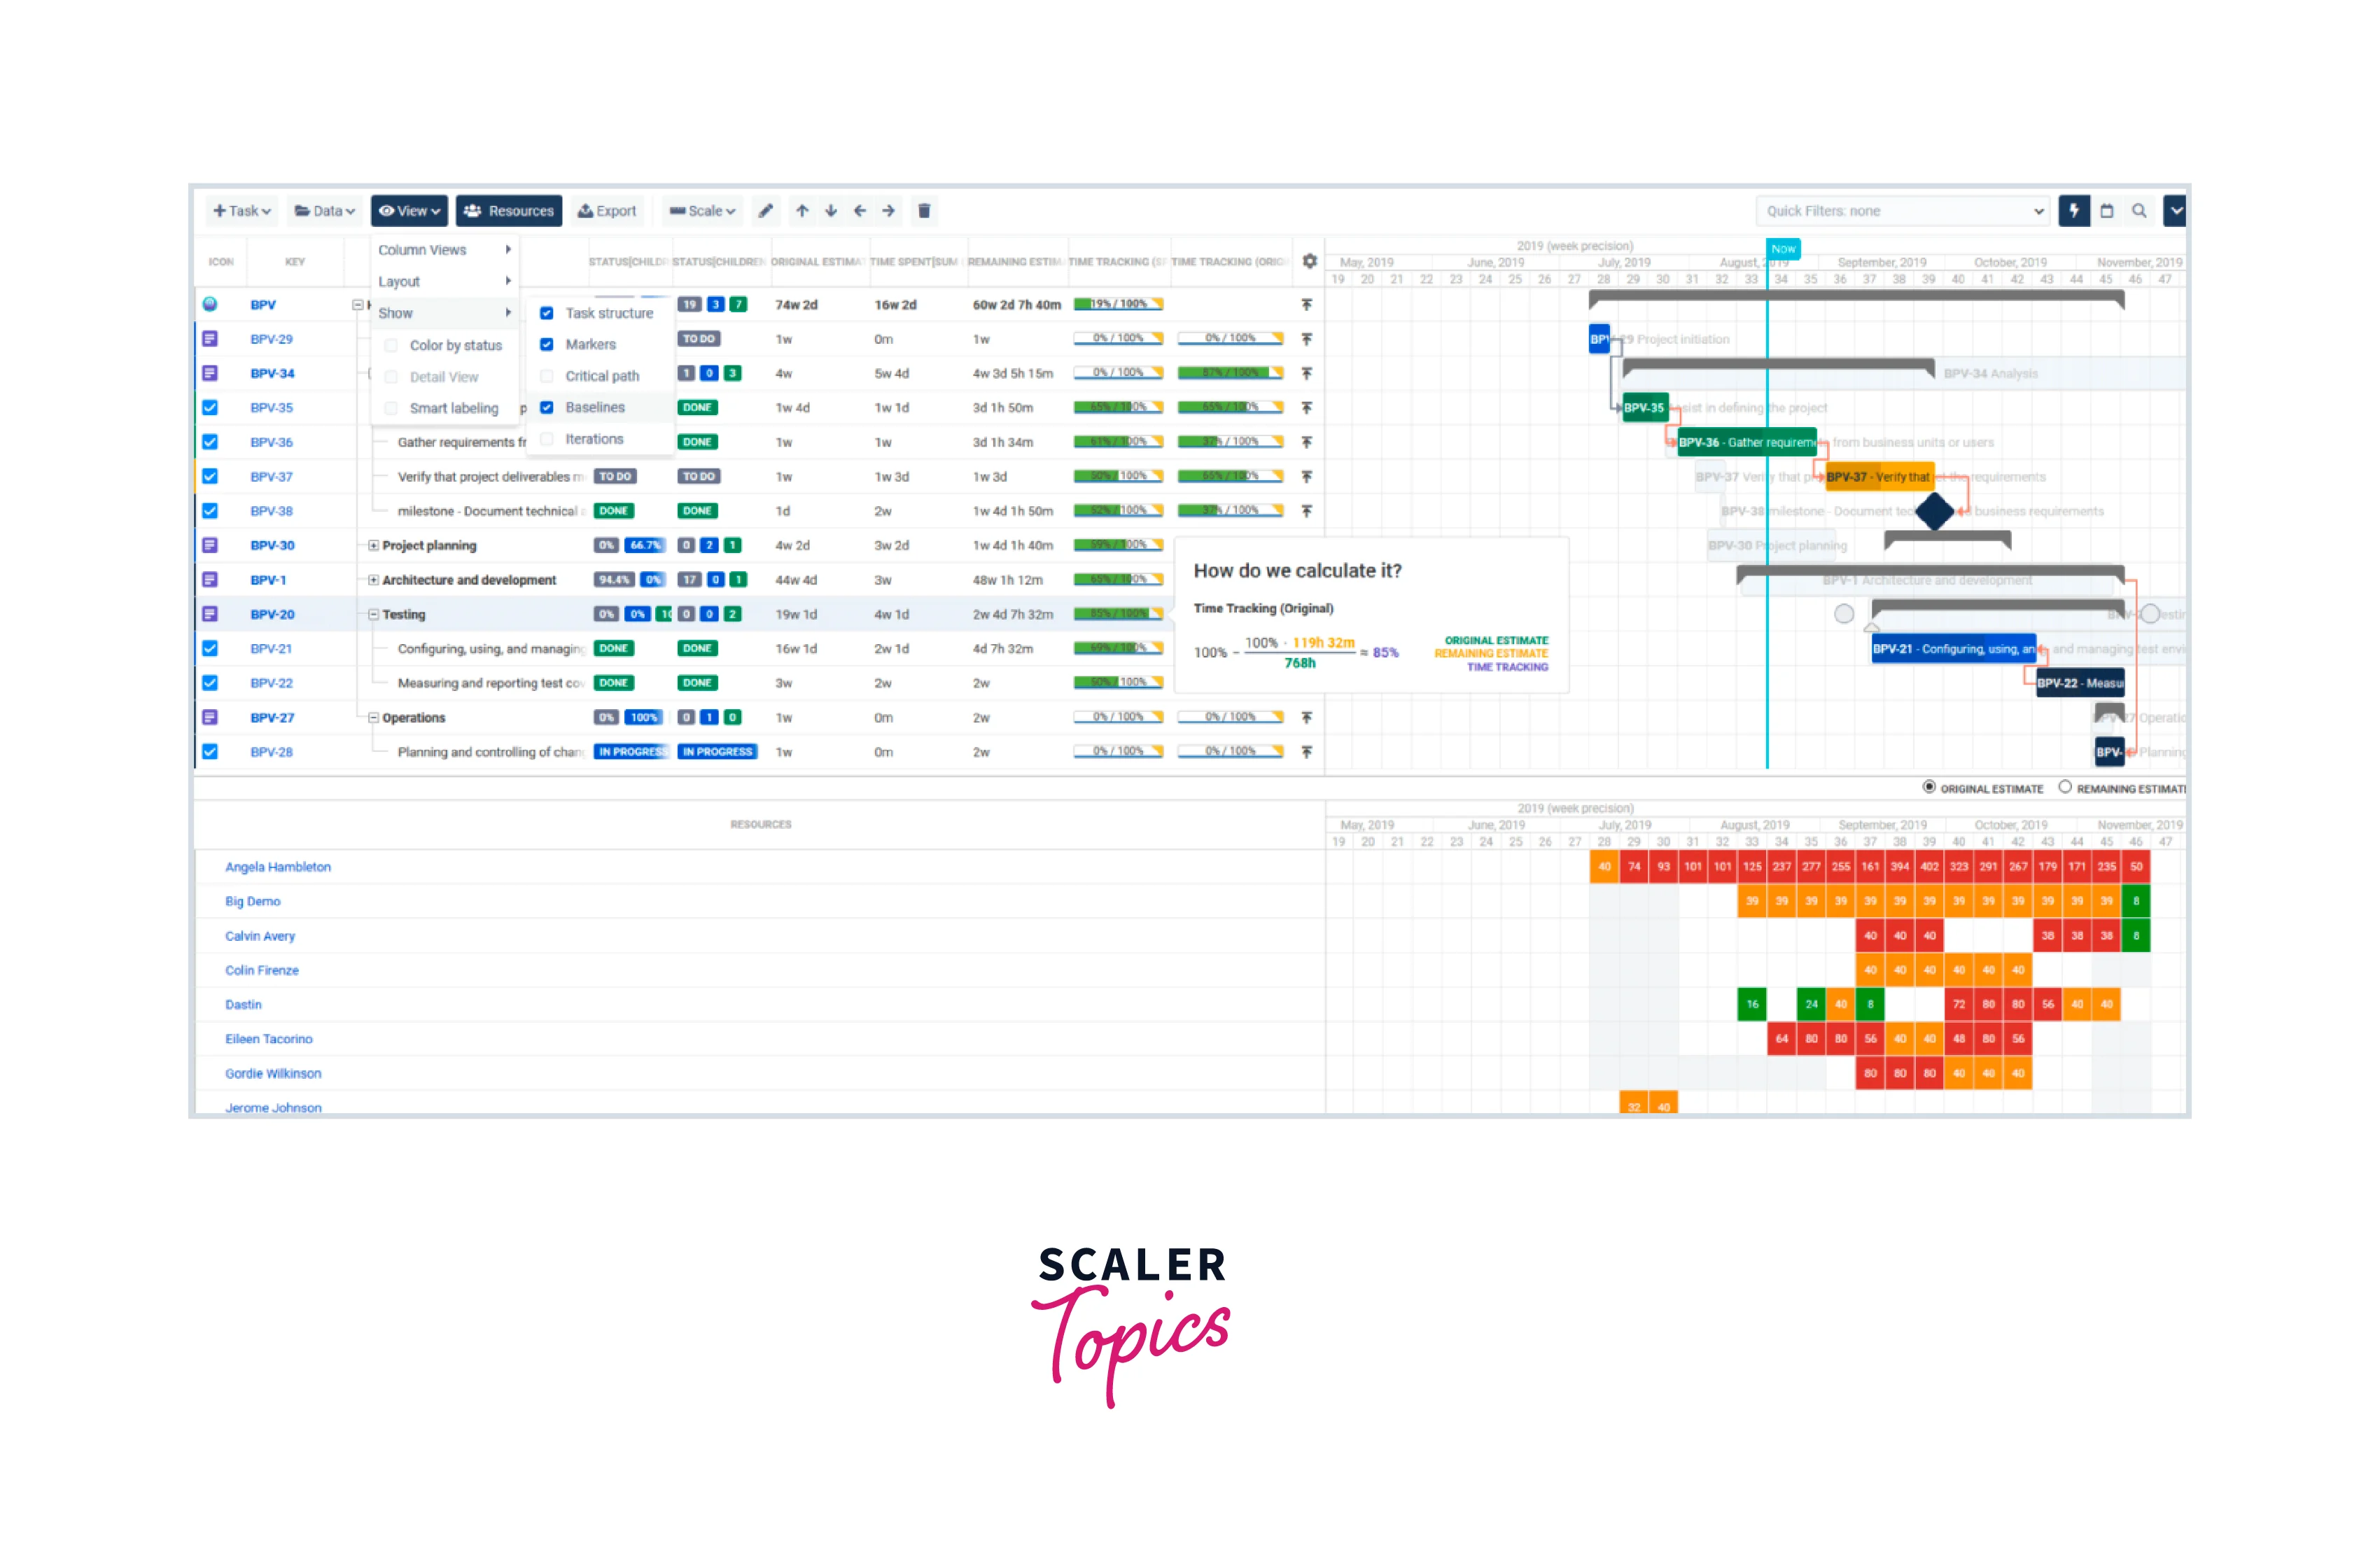
Gantt Charts in JIRA contain all the activities in the form of a bar where each bar represents each activity. The position and length of a bar in the chart refer to the detailed schedule such as the start time, duration, and expected finish time.
Important characteristics of Gantt Charts in JIRA are:
- header: This represents unit-wise time in a linear order.
- left column: This column contains a list of tasks with dependent subtasks.
- line: It corresponds to a task represented by a rectangle or a diamond.
Gantt charts in JIRA can help each individual understand the work that needs to be completed by them along with the sequence so they can proceed with the next milestones in the project.
Options for Using and Deploying Gantt Charts in Jira
Gantt charts in JIRA are used at both micro and macro scales for specific or whole organization projects.
Micro-scale
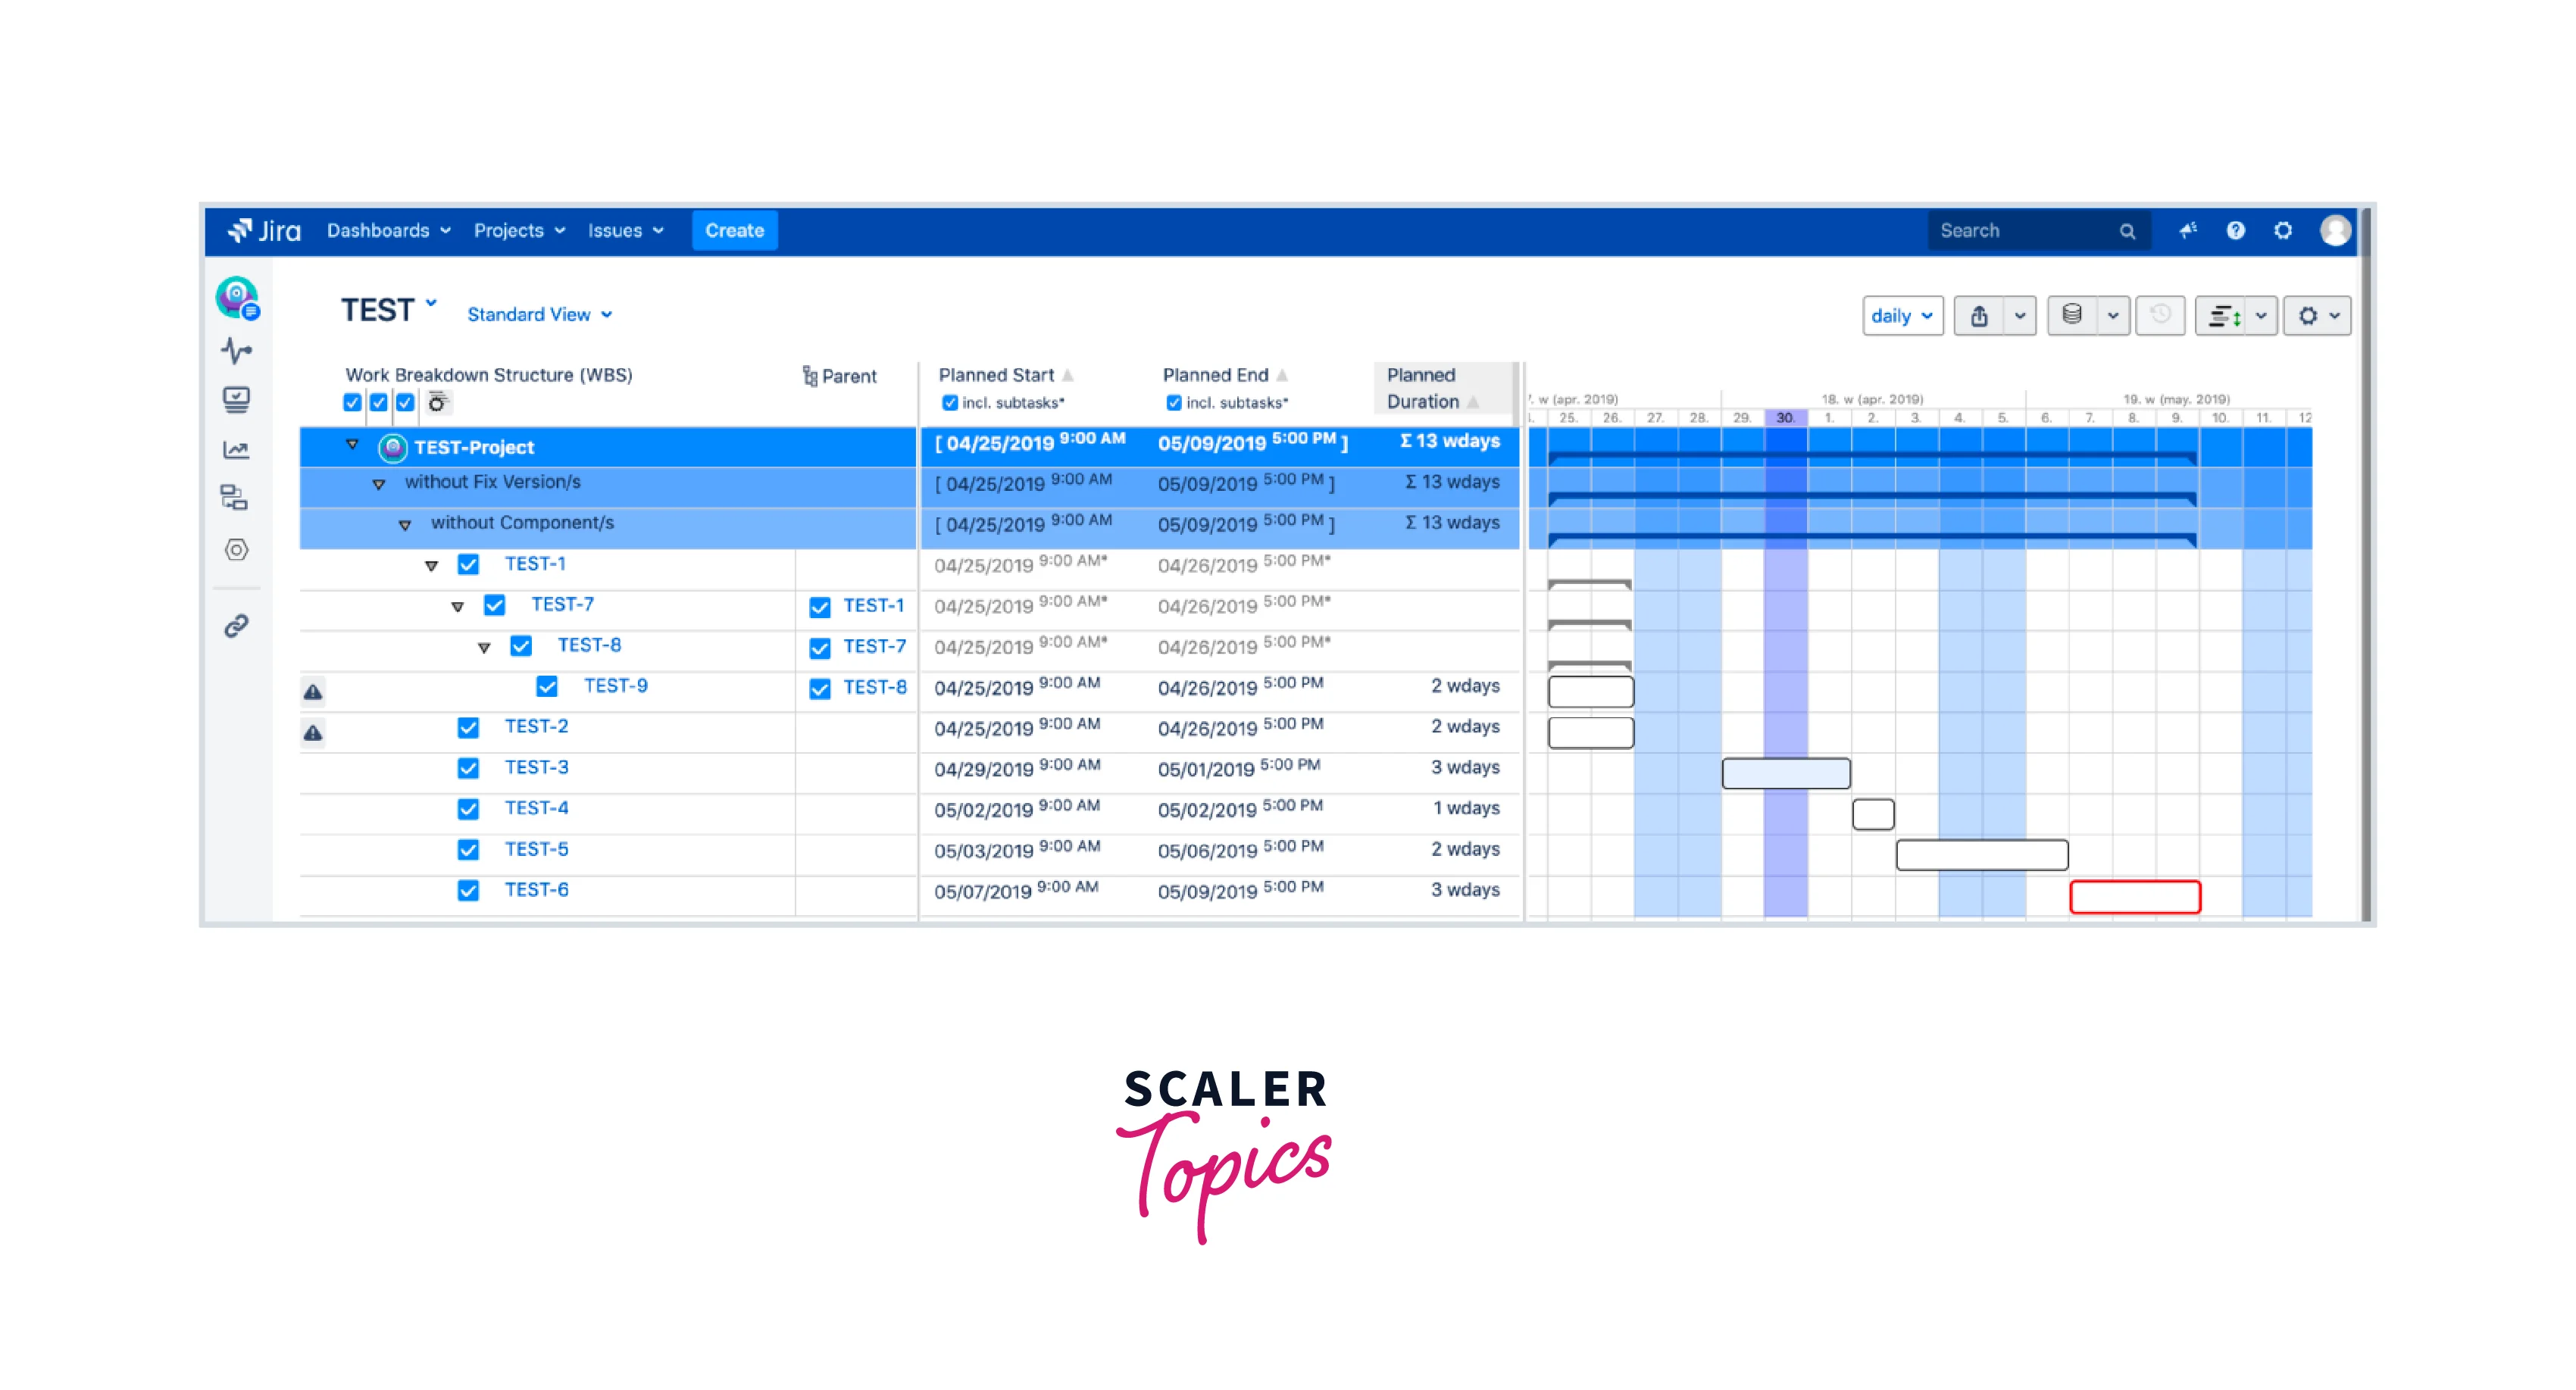
At the micro-scale, a detailed plan can be laid out in the form of a bar where each bar represents each activity such as the start time, duration, and expected finish time. We can also set milestones to further set the direction and course of the project.
Some of the things that are considered in micro-scale are:
- Defining task hierarchies, determining timeframes, establishing dependencies, and allocating resources are all necessary components to configuring the Gantt chart to fit the project's unique requirements.
- Effortless task and project management within JIRA relies heavily on seamless integration with Gantt chart tools. That's why it's crucial to ensure that the integration is capable of effectively creating and tracking tasks.
- Adequate training and support for stakeholders and your team is crucial to achieving this.
Macro-scale
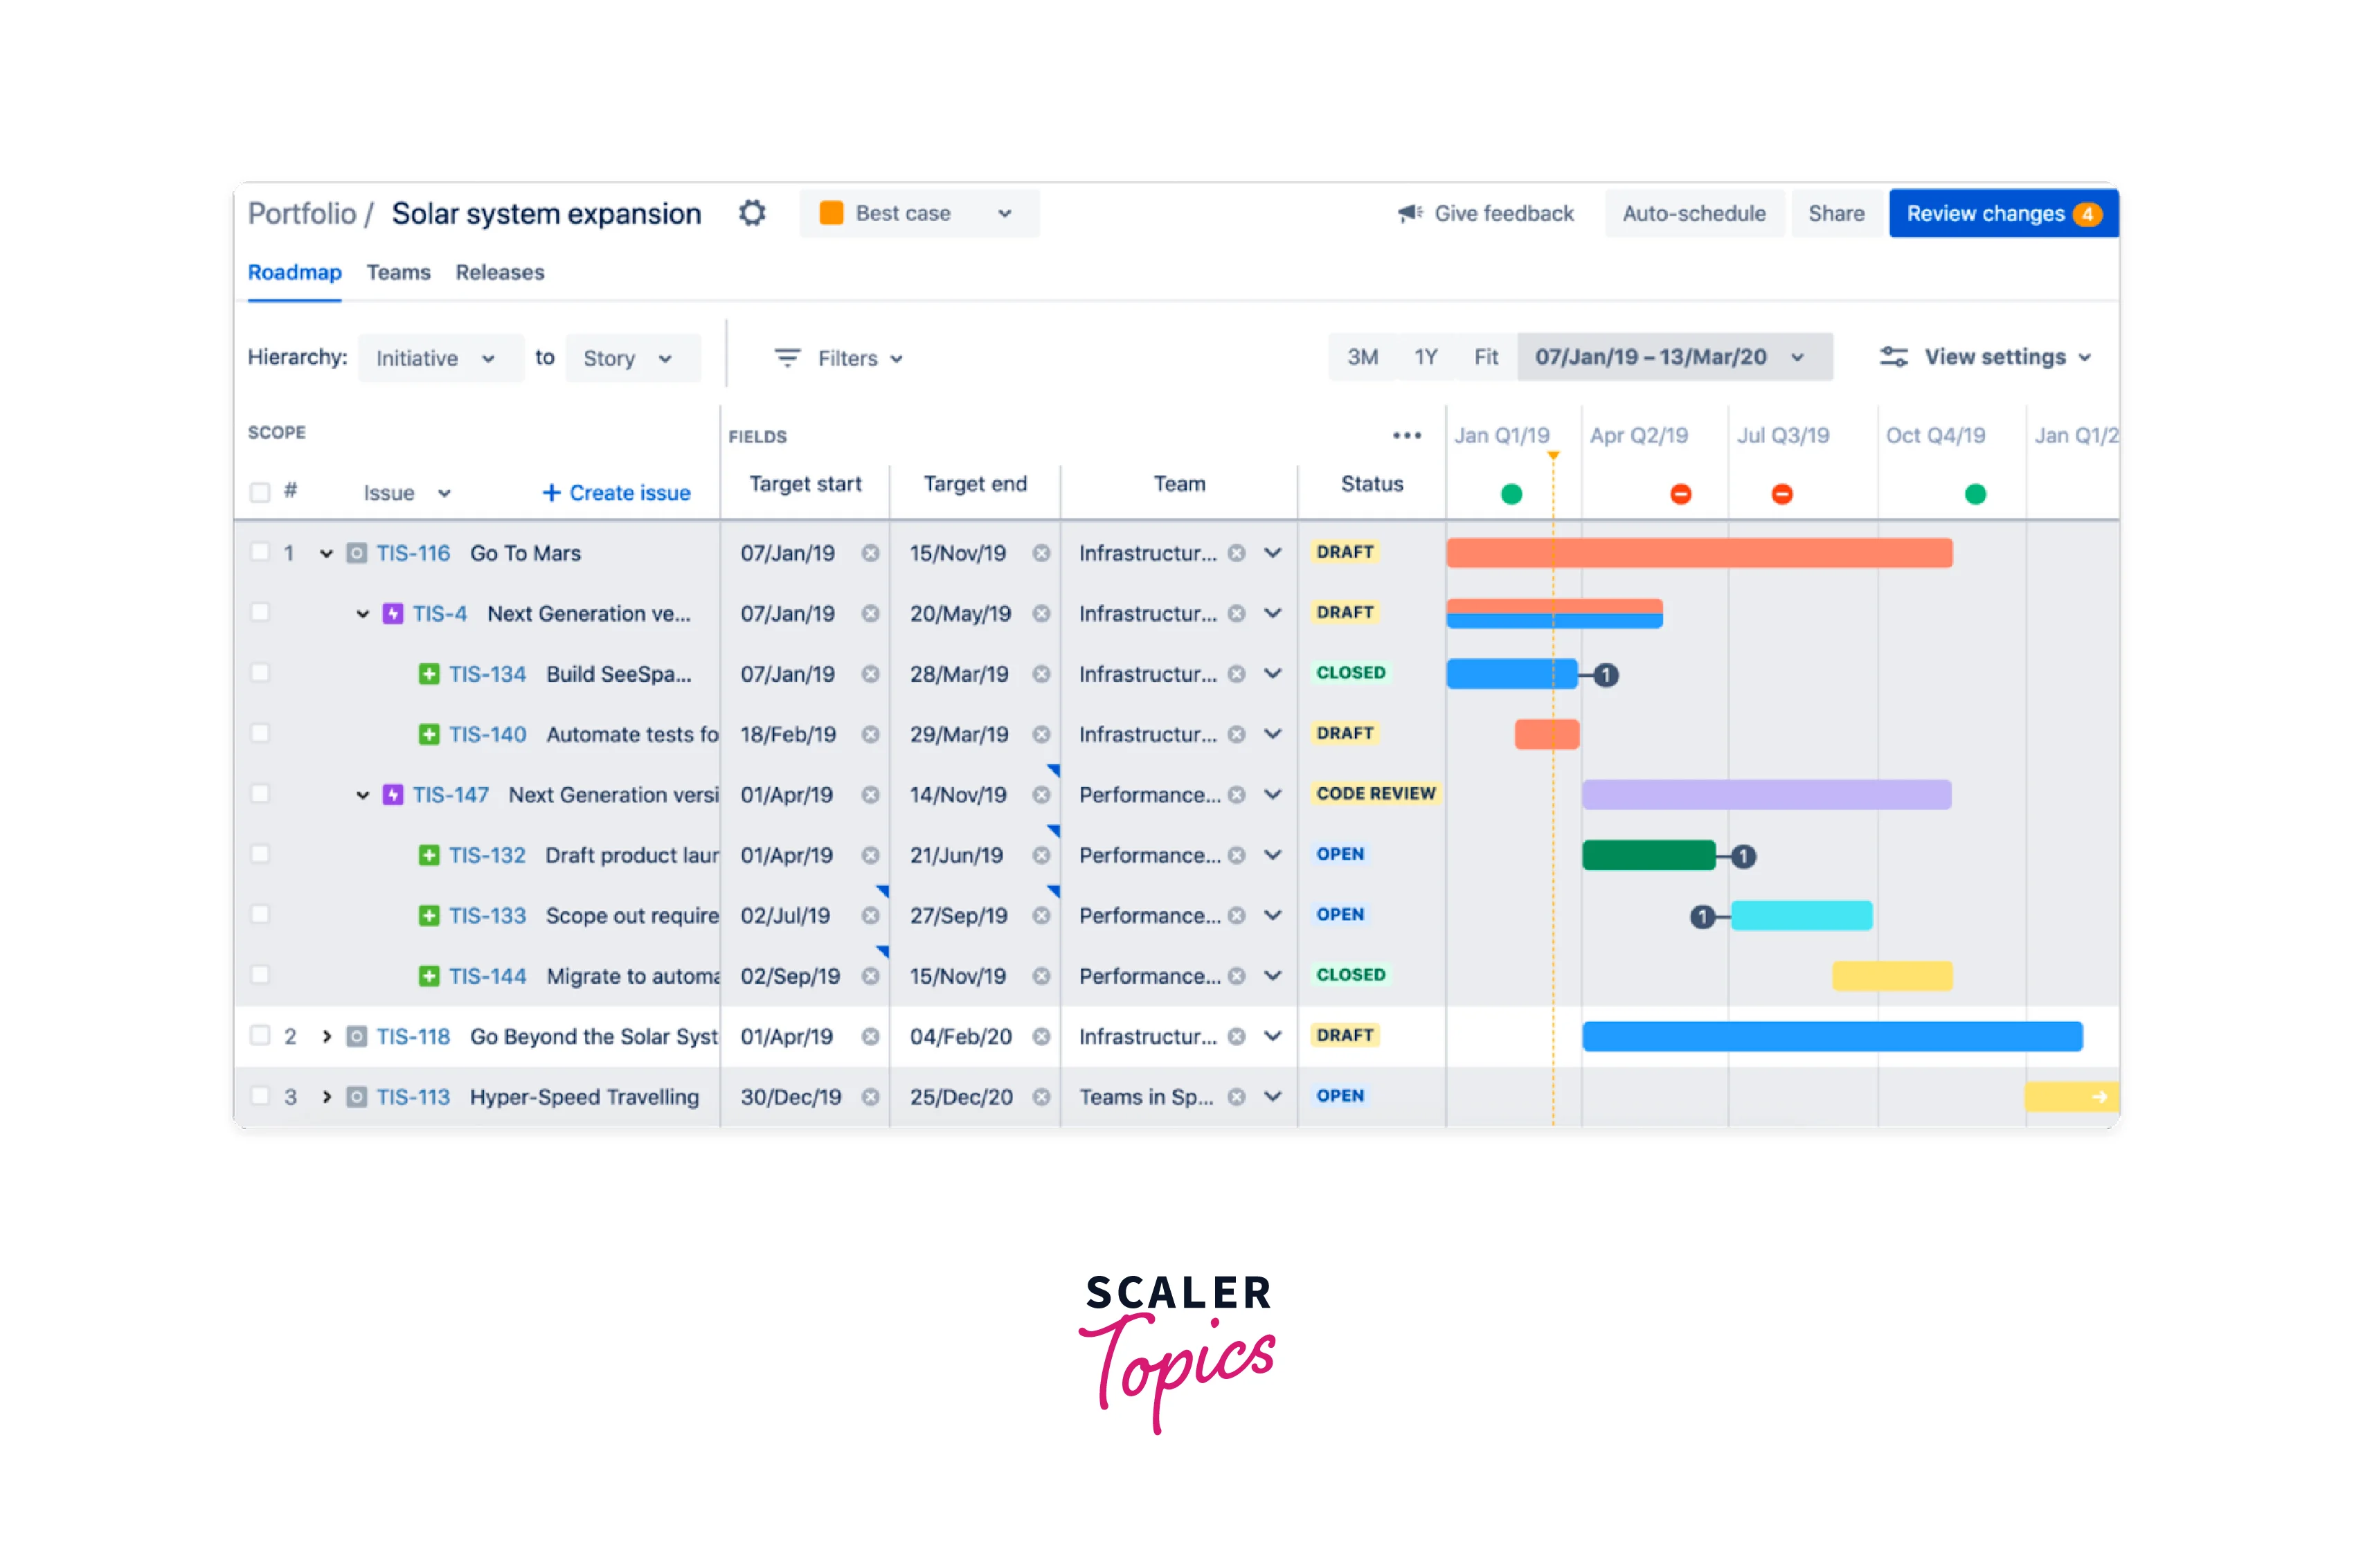
At the macro scale, Gantt charts in JIRA can also be used at a broad scale for projects across the organization to illustrate the dependencies and relationships among them. We can visualize the direction of the business with the help of such a powerful reporting tool.
Some of the things that are considered in the macro-scale are:
- Project planning requires a clear goal and objective settings, including scope definition and stakeholder recognition.
- To see project goals reach completion, it's essential to track and allocate resources effectively monitoring progress.
- Project updates and status should be communicated to team members as a means of informing stakeholders.
- For project metrics, it's important to keep track of resource utilization, task completion rates, and project timelines.
Jira Apps for Gantt Charts
No doubt Gantt charts offer a powerful way to manage, visualize and track tasks in a project but the problem associated with JIRA is that they are not supported in JIRA by default.
To overcome this, We need to have the add-ons installed to get Gantt Charts in JIRA. Some of the best are:
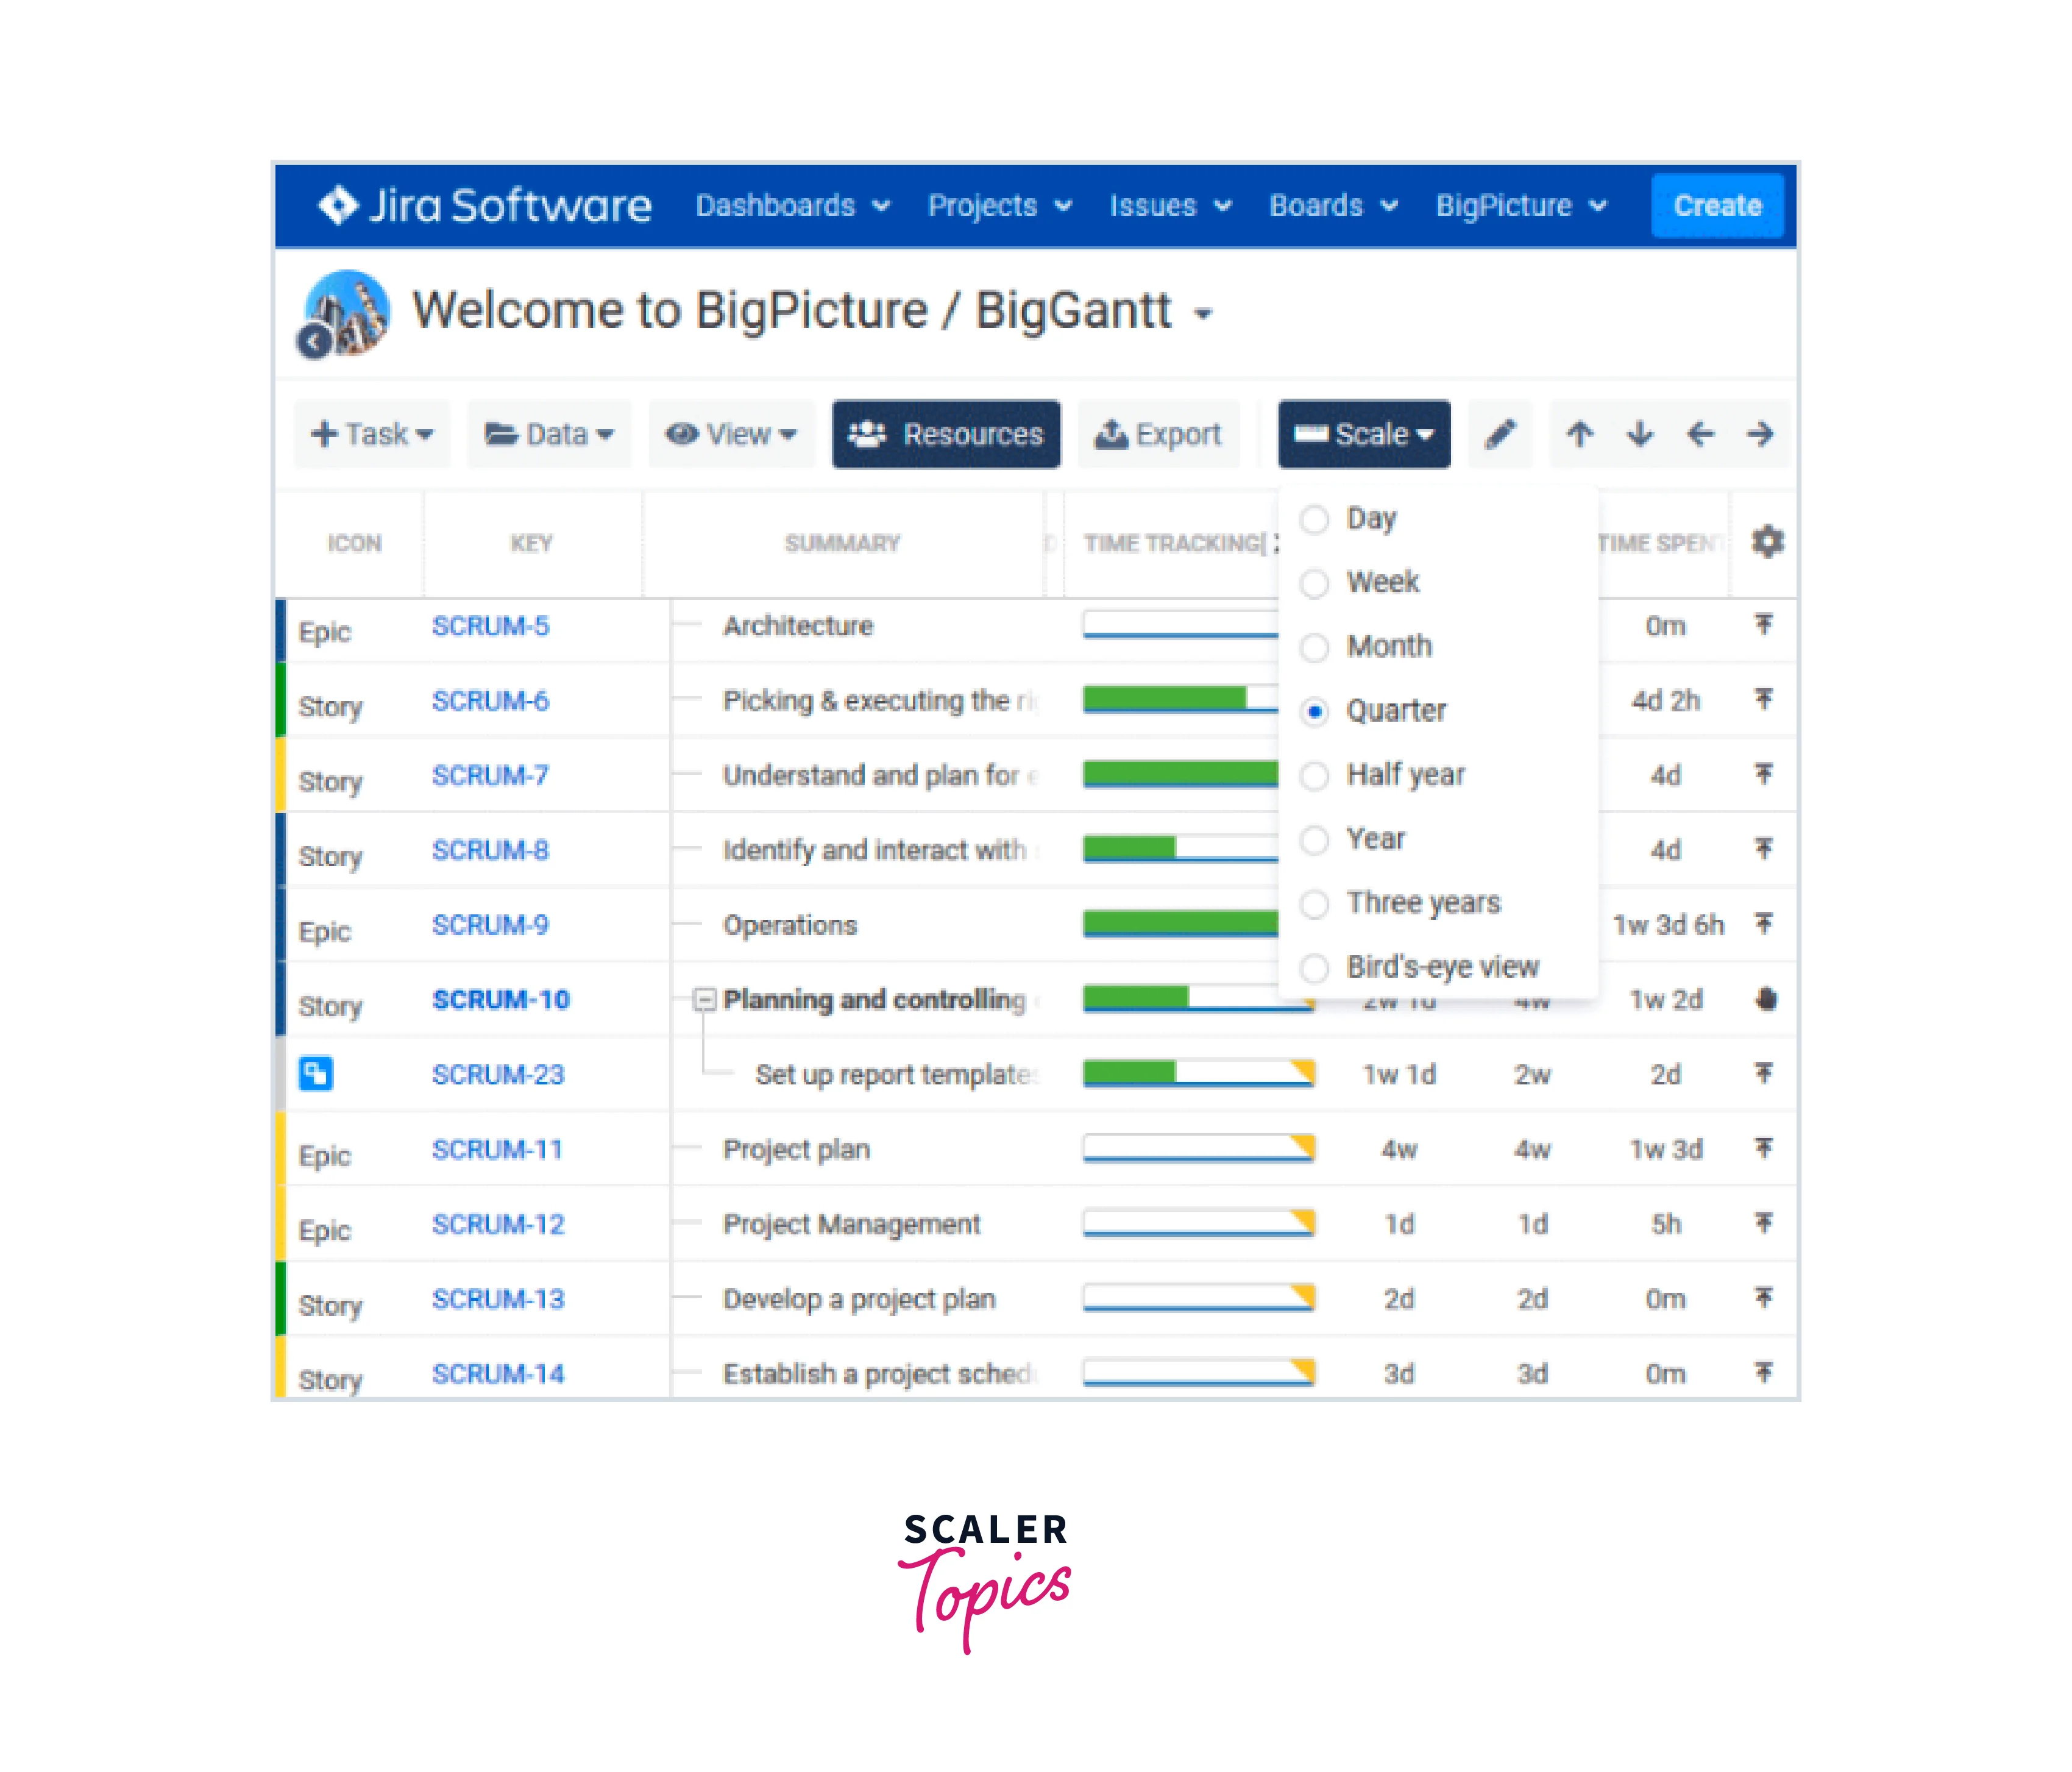
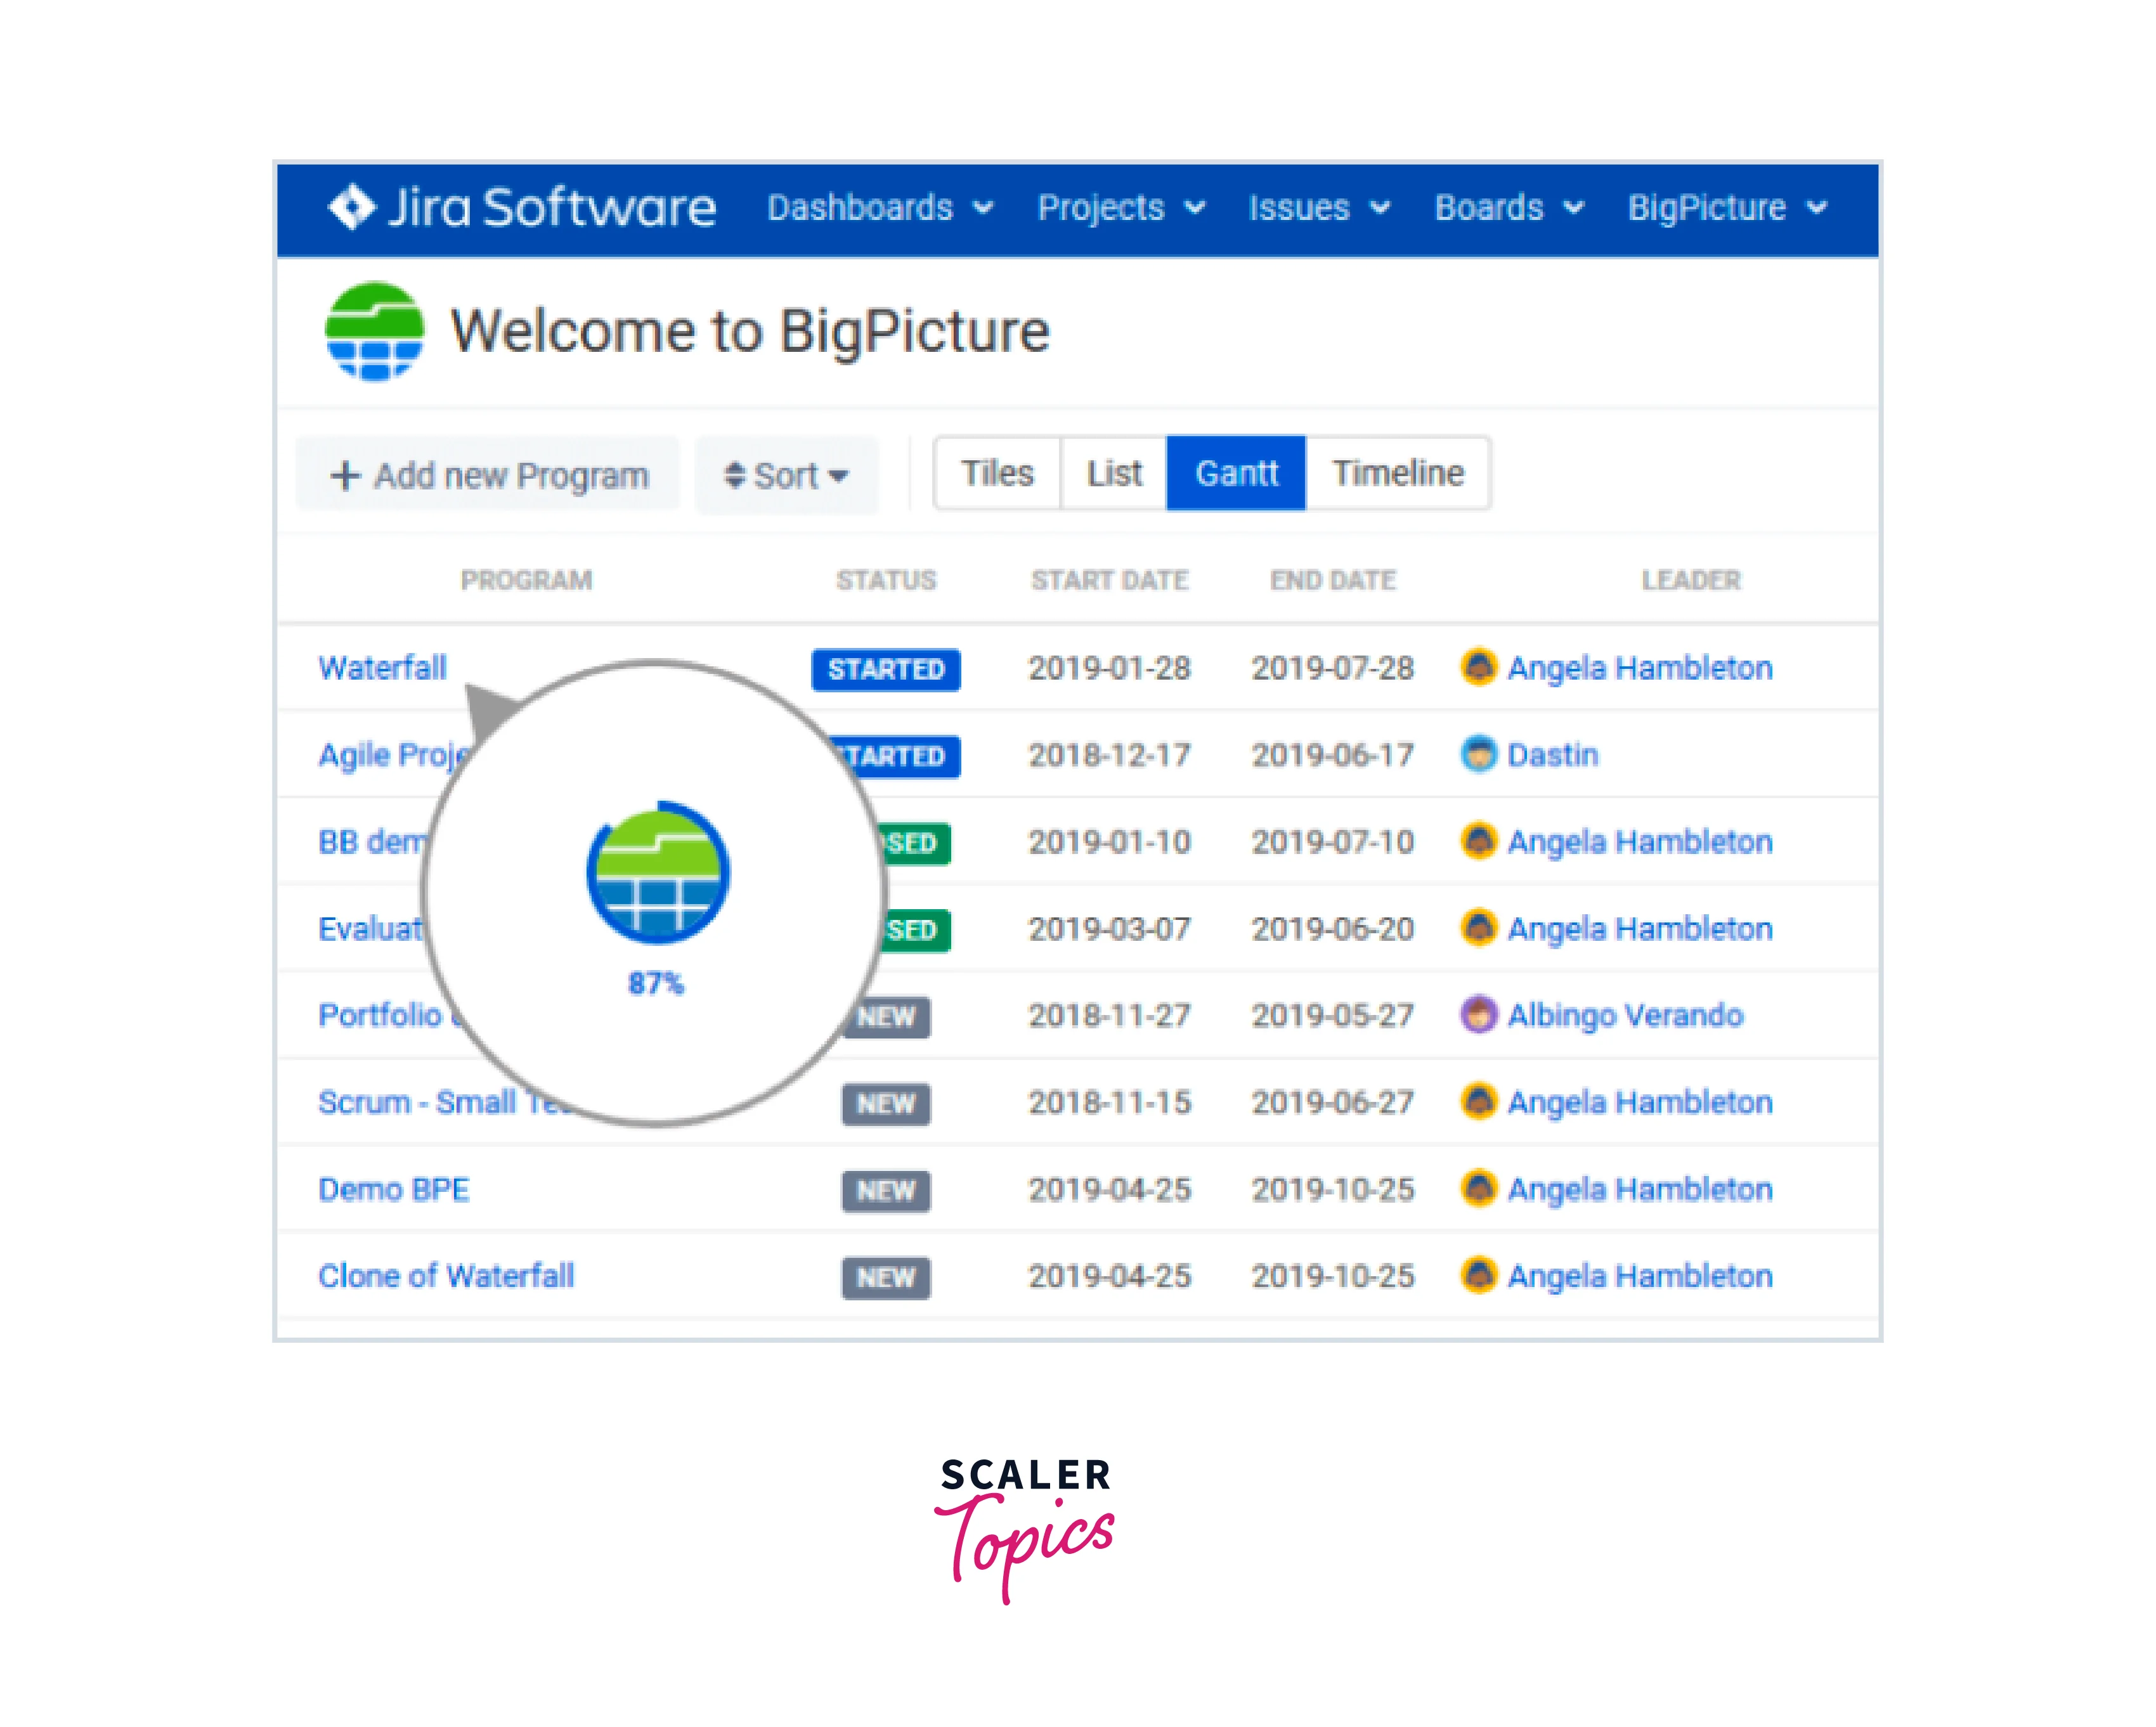
BigGantt
This add-on focuses on drag-drop functionality and flexibility interface along with powerful filters, for creating and organizing tasks on the Gantt chart. Some of its unique features include Task auto-scheduling and smart issue linking for reporting and tracking of projects. You can easily find this add-on in Atlassian Marketplace.
Gantt Chart for Jira
This add-on gives a brief overview of issues. Features such as those selected by the filter are there in this add-on. This also provides the functionality of displaying sprint-grouped charts for agile teams or epic-based for product owners. A unique feature of this add-on is the possibility of linking issues across projects. You can easily find this add-on in Atlassian Marketplace.
Structure.Gantt
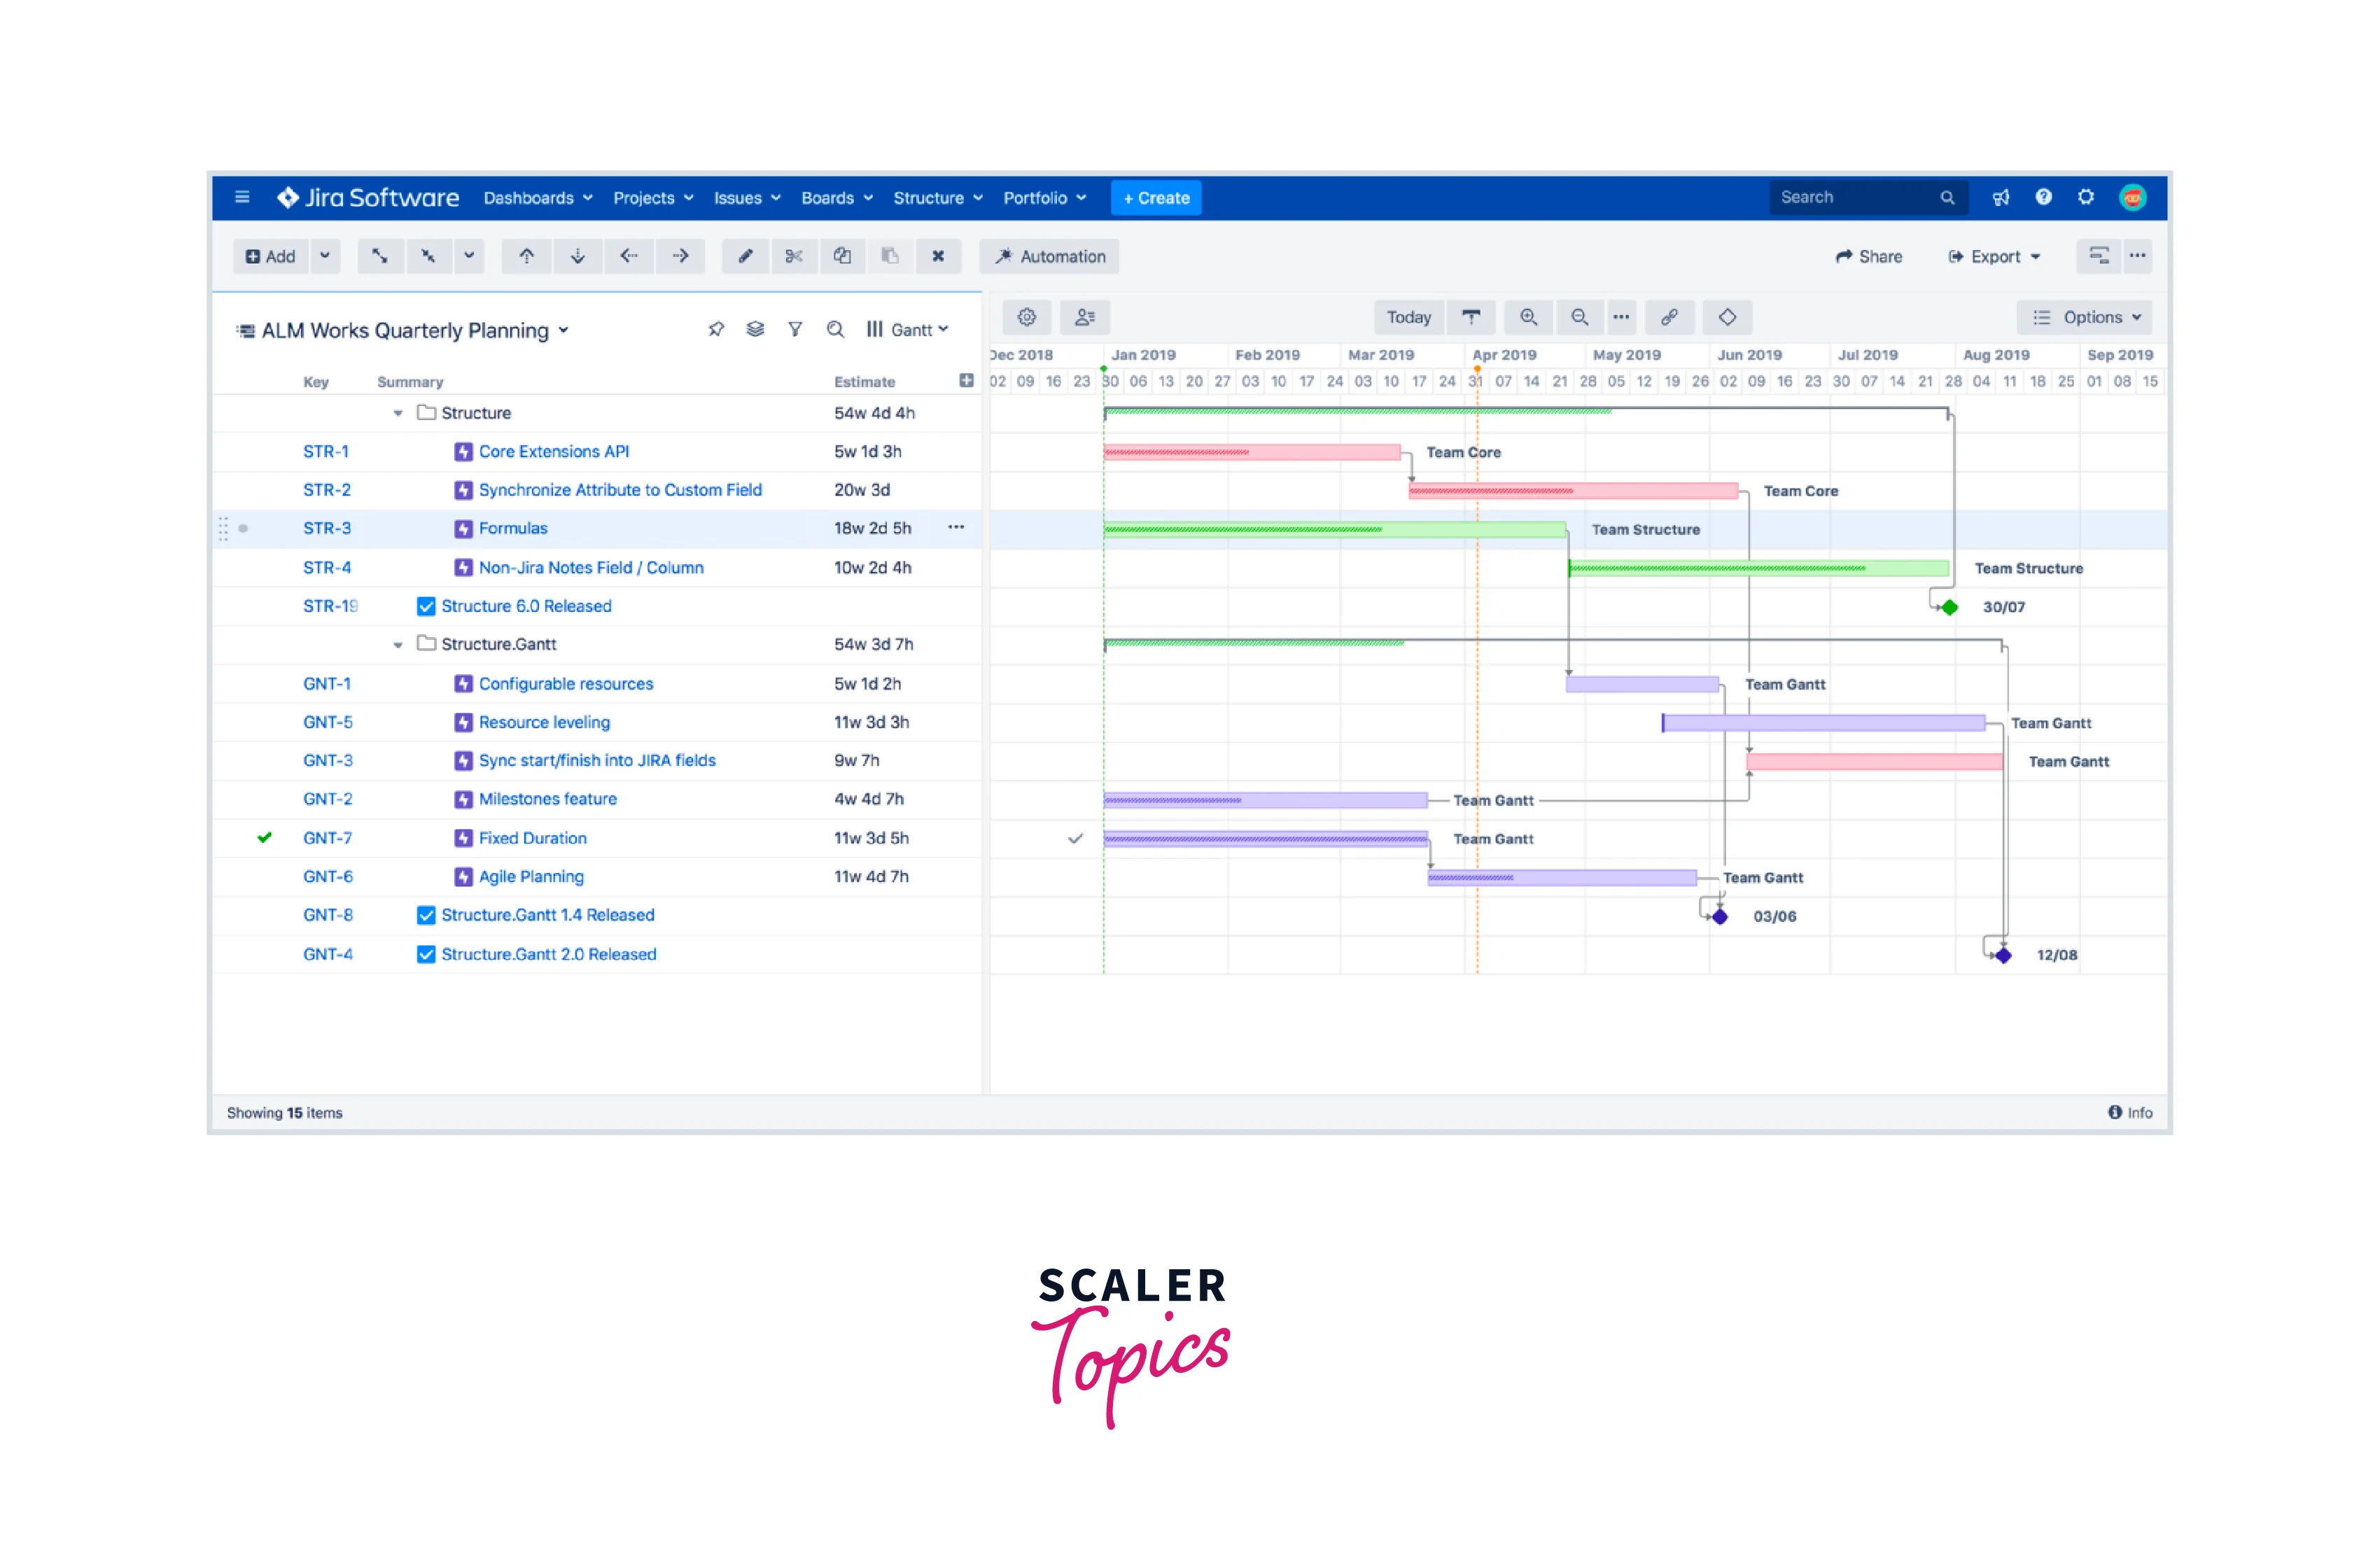
This particular add-on aims of Agile Gantt Charts and enables us to plan, track and report with Gantt Charts combining sprint data at the team and portfolio level. This also makes it easy to visualize and manage project timelines, dependencies, and resources. You can easily find this add-on in Atlassian Marketplace.
Gantt Chart vs. Roadmap - What’s the Difference?
Both Gantt Charts and Roadmaps were major inventions in project management history.
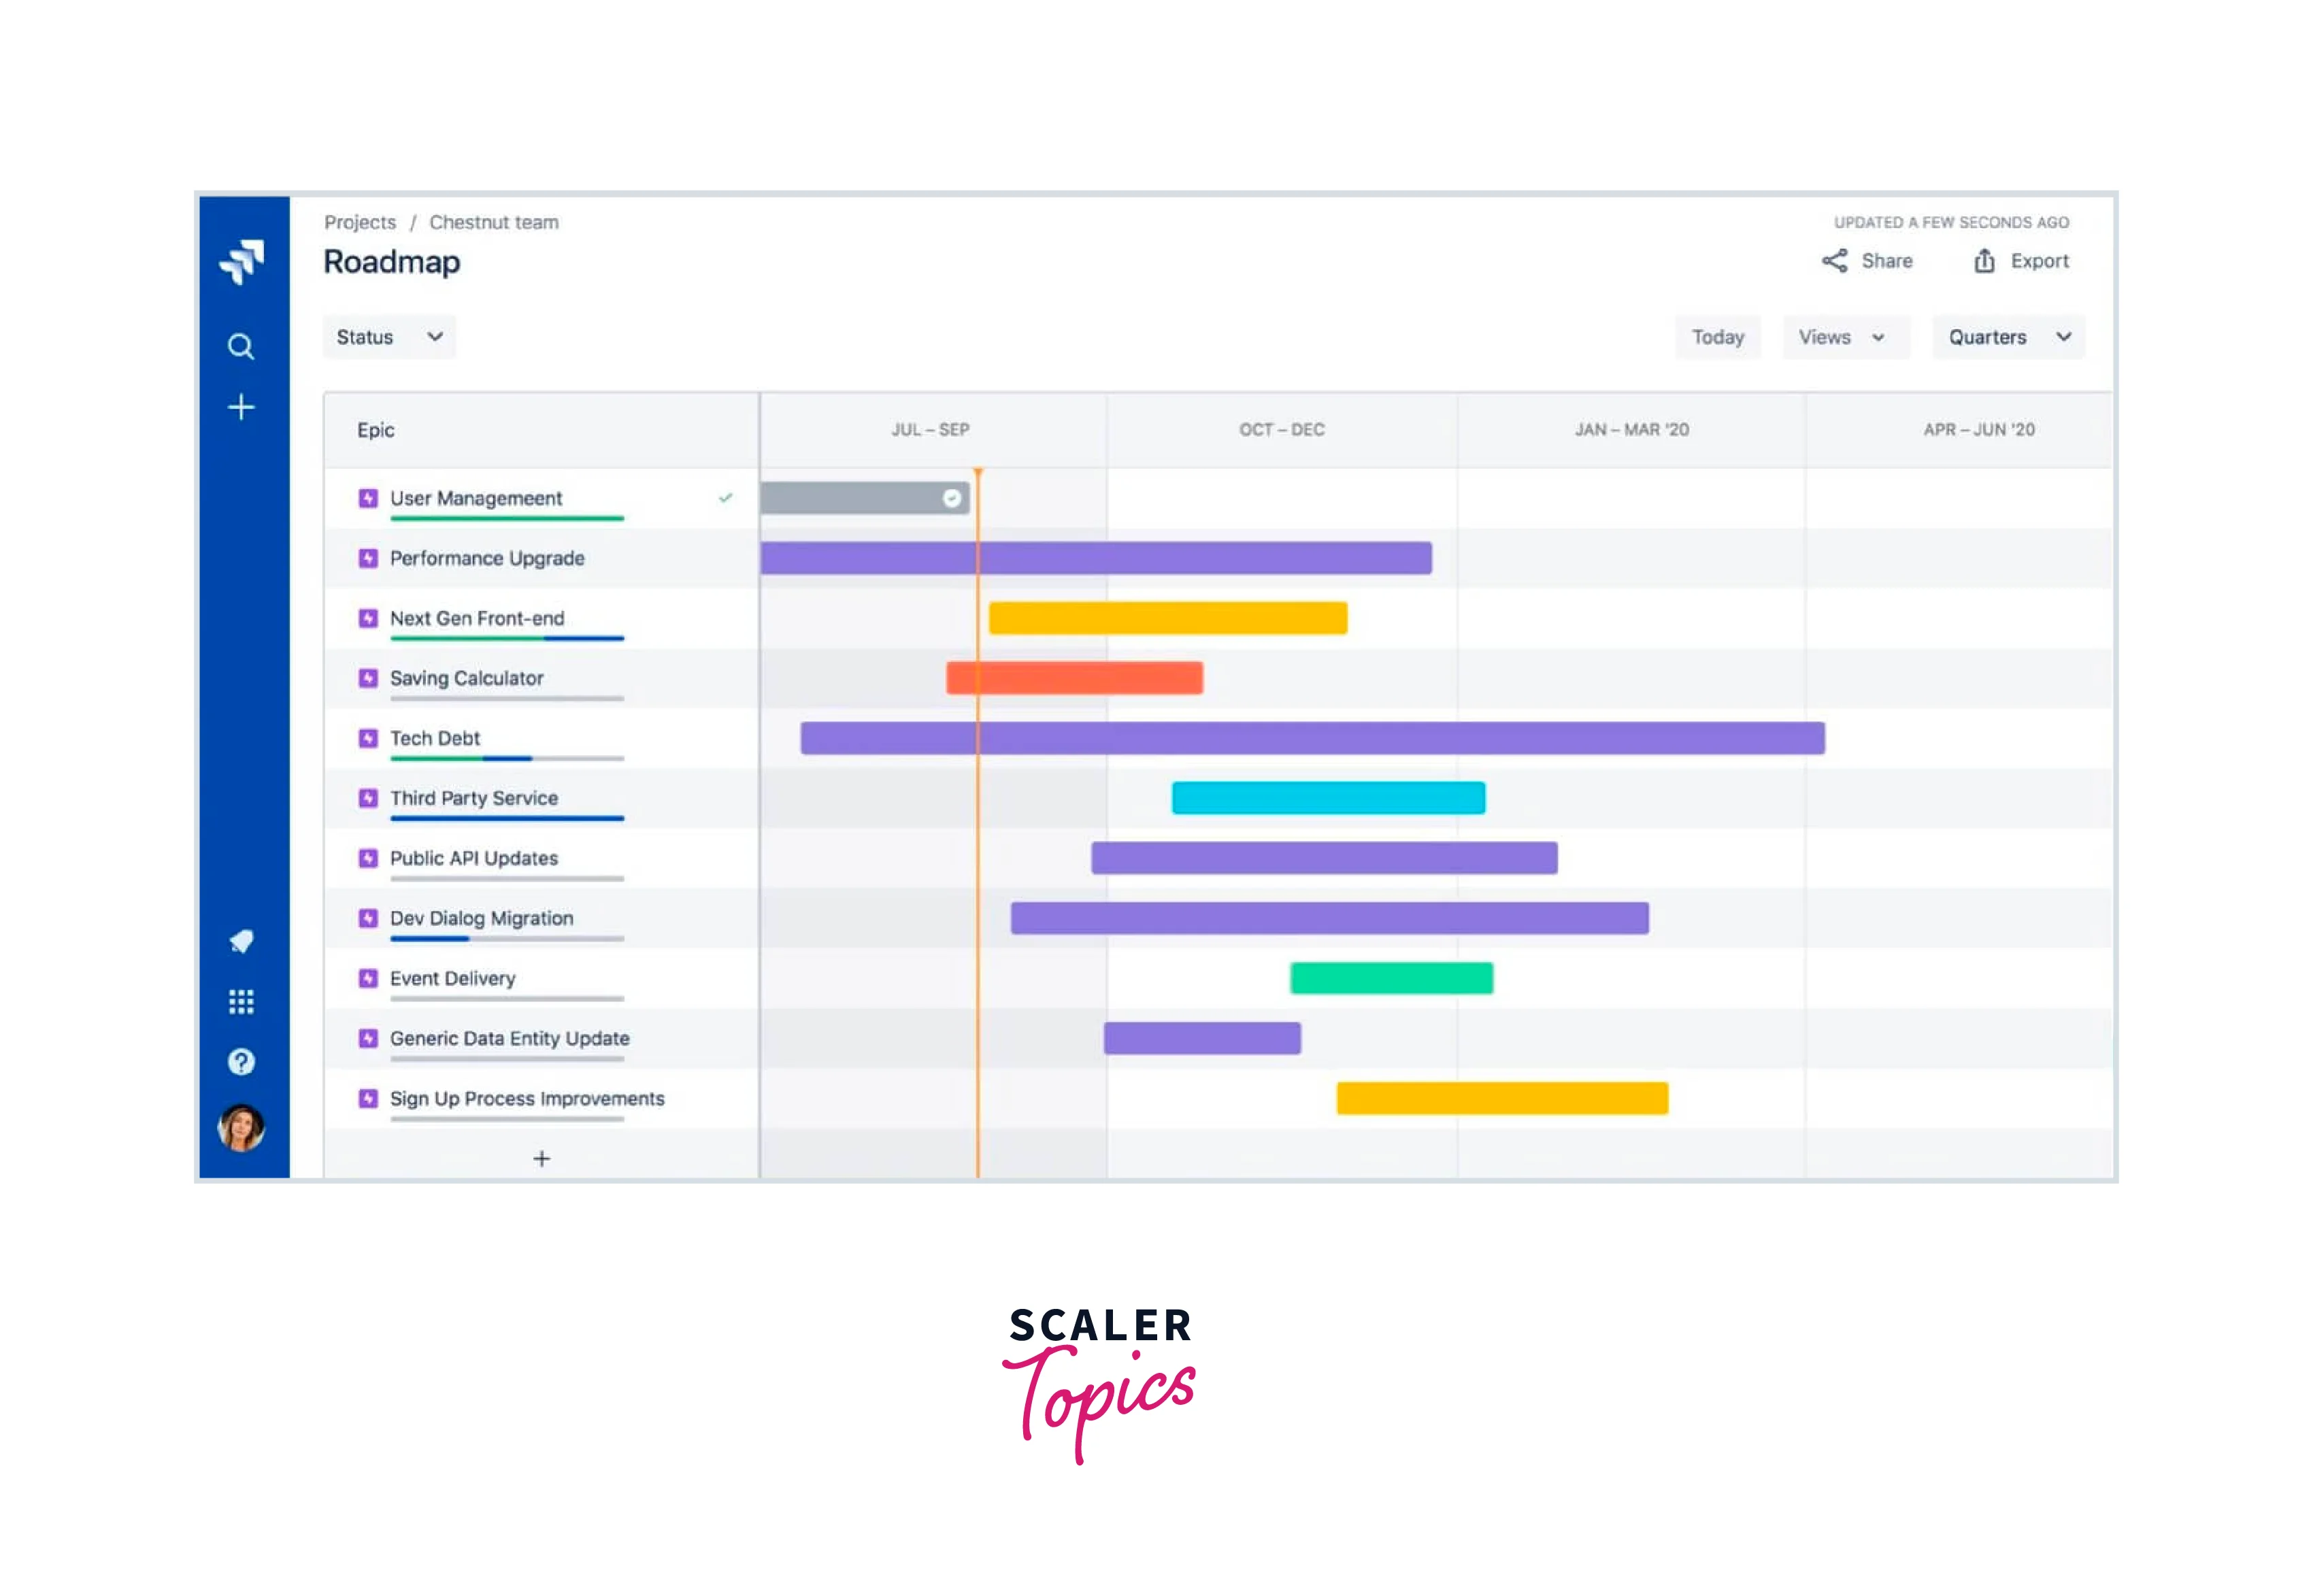
Both tools are vital and display information related to project tracking and management but what exactly is the difference between the two? At first look, both appear to be the same but after understanding we can say that the difference lies in the purpose and scope.
Some of the differences are mentioned below:
| Gantt Chart | Roadmap | |
|---|---|---|
| 1 | It helps visualize a timeline for work with the help of time units | It helps visualize objectives needed to achieve them |
| 2 | It has every minute detail to keep teams and projects on schedule | It offers a bird's eye view of direction and timings for daily actions |
| 3 | It is less flexible in terms of customizing the view or filtering the data displayed | It is more flexible as it can be customized with different views, filters, and themes |
| 4 | It is less agile because they typically require the project to be planned and do not easily allow for changes or iterations to the project plan | It is more agile as it allows for feedback and input from a wider group of people or stakeholders on fixed iterations |
| 5 | It defines "when" and "what" of the project providing a visual representation of the project schedule and the tasks that need to be completed, along with their dependencies and timelines | It defines "how" of the project by providing a strategic plan for achieving the project's goals and objectives |
| 6 | The Project Managers use it to track progress and ensure tasks' completion on time | Stakeholders use it to get the high-level goals of the project. |
Conclusion
In this article, we learned about:
- A Gantt chart is a project management tool that displays a timeline of tasks or activities, along with their durations and dependencies developed in the early 20th century by Henry Gantt as a way to visualize production schedules in factories.
- Gantt charts are useful for planning and scheduling complex projects, as they allow project managers to see the progress of each task and identify potential delays or roadblocks.
- Gantt charts can be customized to suit the needs of individual projects, with options to adjust the time scale, add or remove tasks, and assign resources.
- Gantt charts are a valuable project management tool but they do have some limitations, such as the inability to account for unexpected delays or changes in the project scope.
- Gantt charts are best used along with other project management techniques, such as risk analysis, stakeholder management, and agile methodologies.
- Overall, Gantt charts are a popular and effective way to manage projects, providing a clear and concise overview of the project timeline and tasks.