How to Create Graphical Reports in BugZilla?
Overview
The popular issue-tracking system Bugzilla offers the ability to generate graphical reports that provide valuable insight into software development processes. Bugzilla's graphical reports allow users to visualize data in different types of charts, such as line charts, bar charts, and pie charts. These reports can be generated based on parameters such as error attributes, time periods, and project-specific metrics. Using the power of graphical presentations, Bugzilla users can quickly analyze trends, track progress, and identify patterns in bug resolution, workload distribution, and other related metrics. This feature improves Bugzilla's overall reporting capabilities, allowing users to make informed decisions and improve their software development workflow.
Introduction
Creating graphical reports in Bugzilla is a valuable feature that allows users to visually analyze and present information related to bug tracking and software development. By creating charts and graphs, users can gain meaningful insights into their projects, identify trends and make informed decisions. Bugzilla's reporting feature allows users to choose between multiple letter types, customize parameters such as time periods and bug attributes, and generate reports that highlight the most important information. These graphical reports provide a clear and concise overview of project status, bug fixes progress, and workload distribution. This guide explores the steps involved in creating Bugzilla graphical reports that allow users to take advantage of this powerful reporting tool.
Creating a Bug-report in Bugzilla in Steps
Step - - 1:
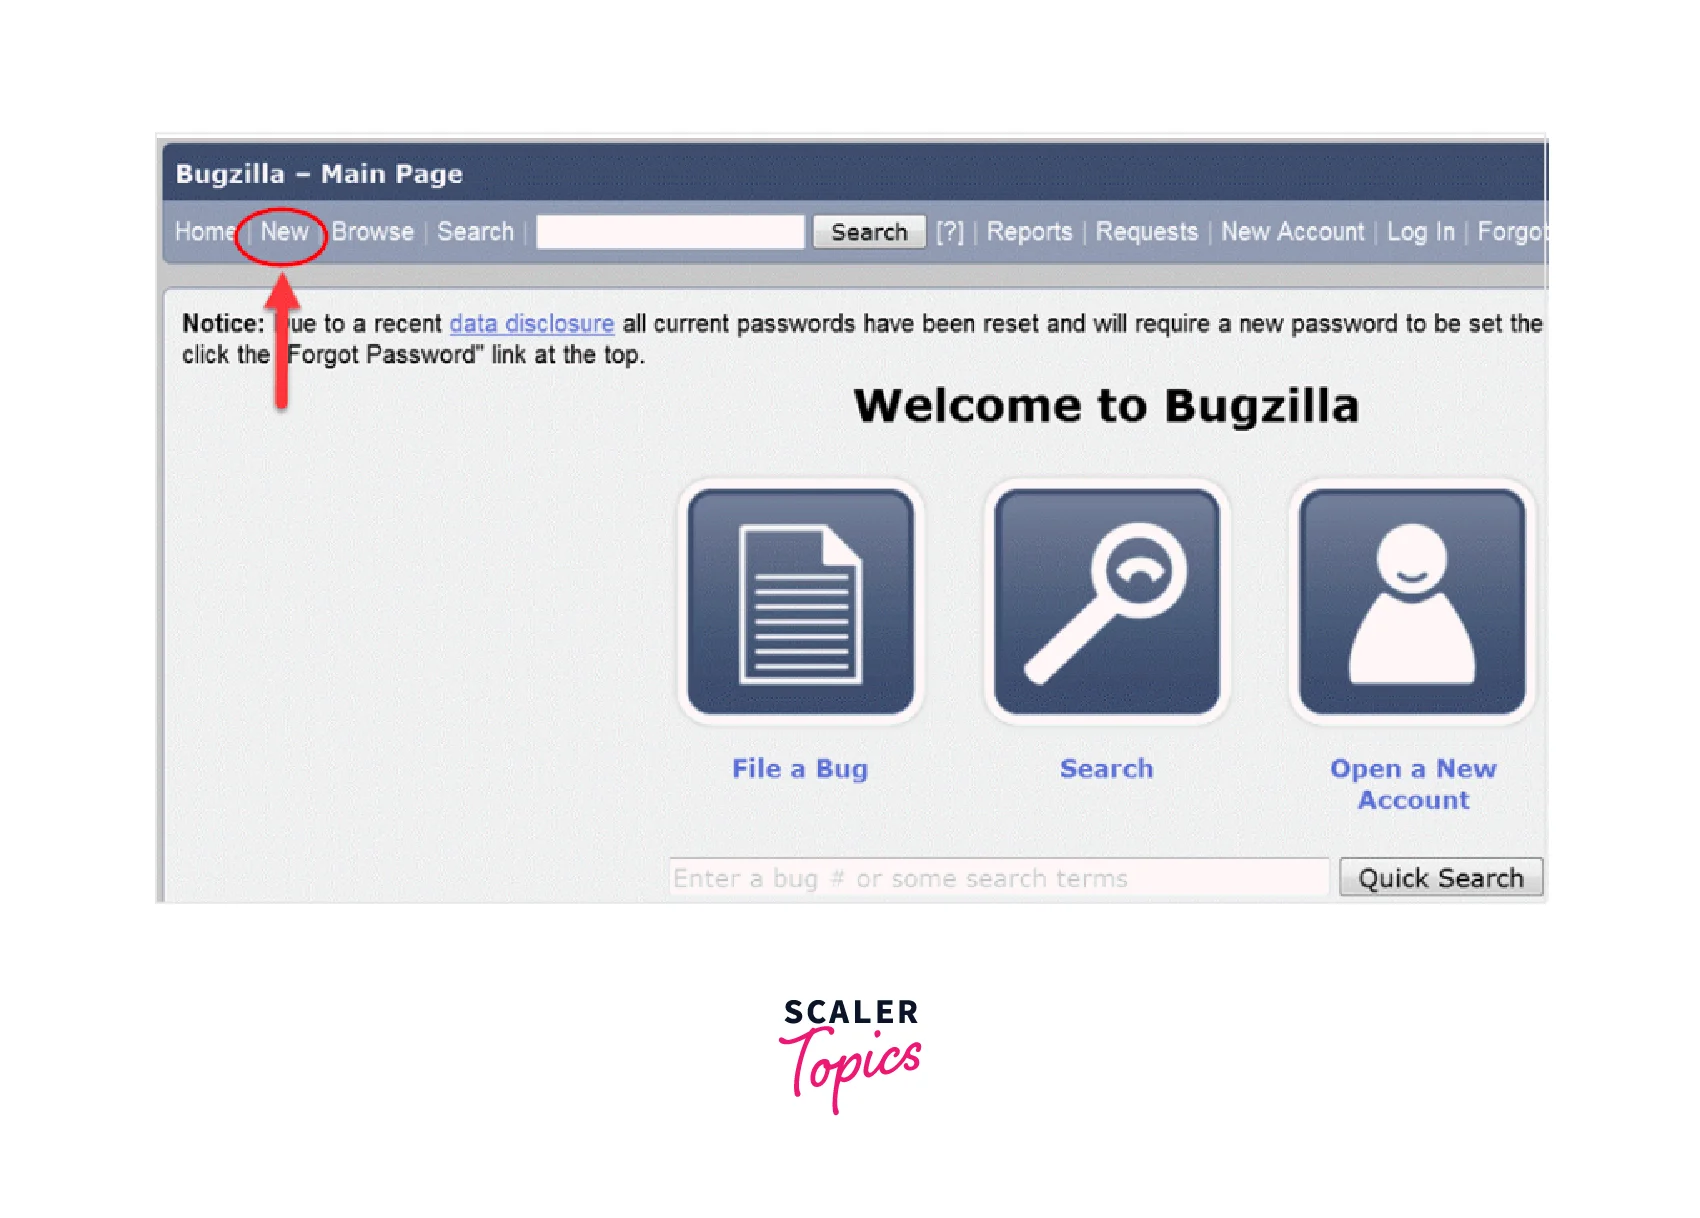
First, visit the Bugzilla home page and click on the "NEW" tab in the main menu.
Step - 2:
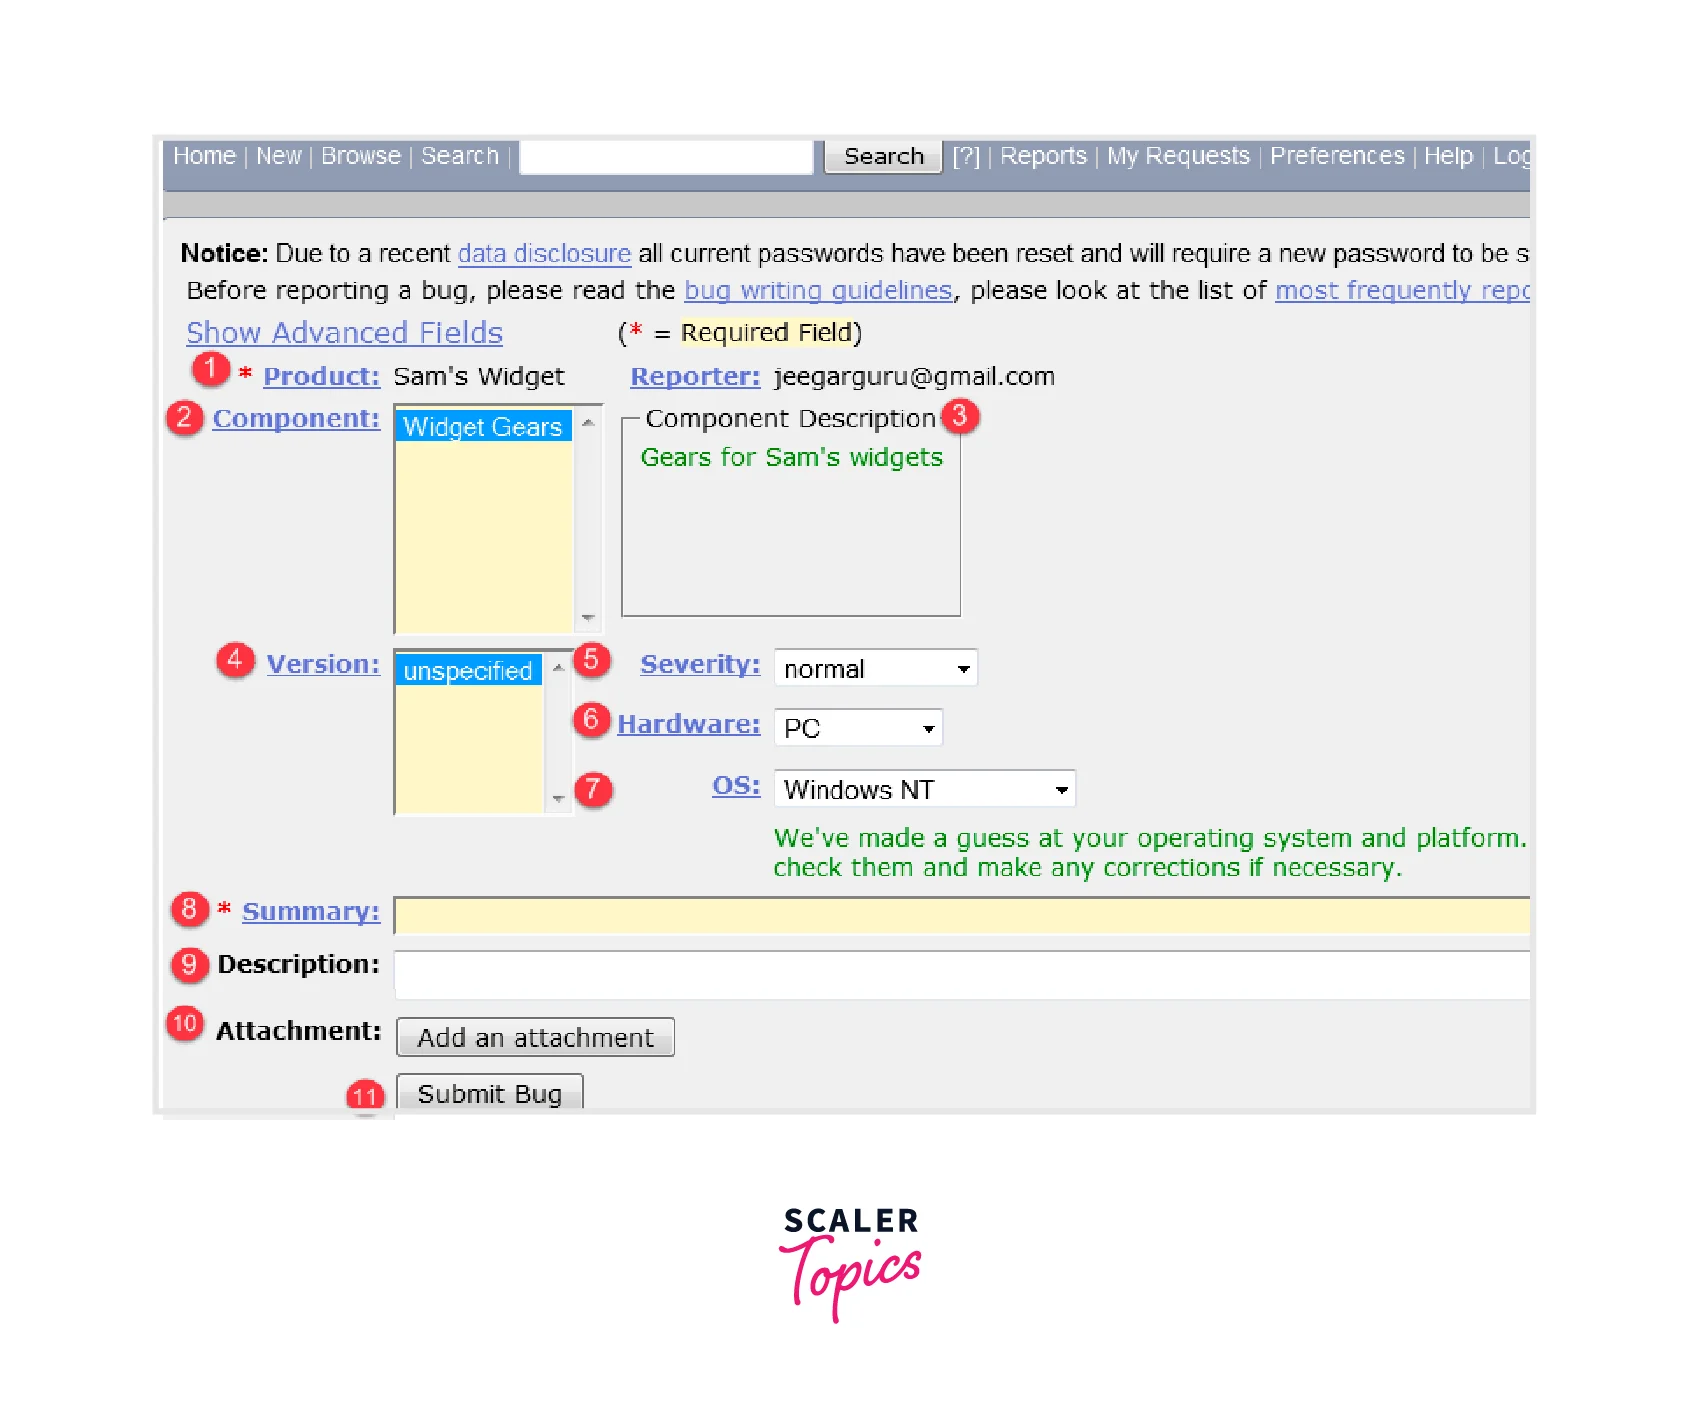
In the New tab, you can see the below-listed fields, Enter appropriate details and click on the "Submit" button.
- Product
- Component
- Component description
- version,
- Severity
- Hardware
- OS
- Summary
- Description
- Attachment
Step - 3:
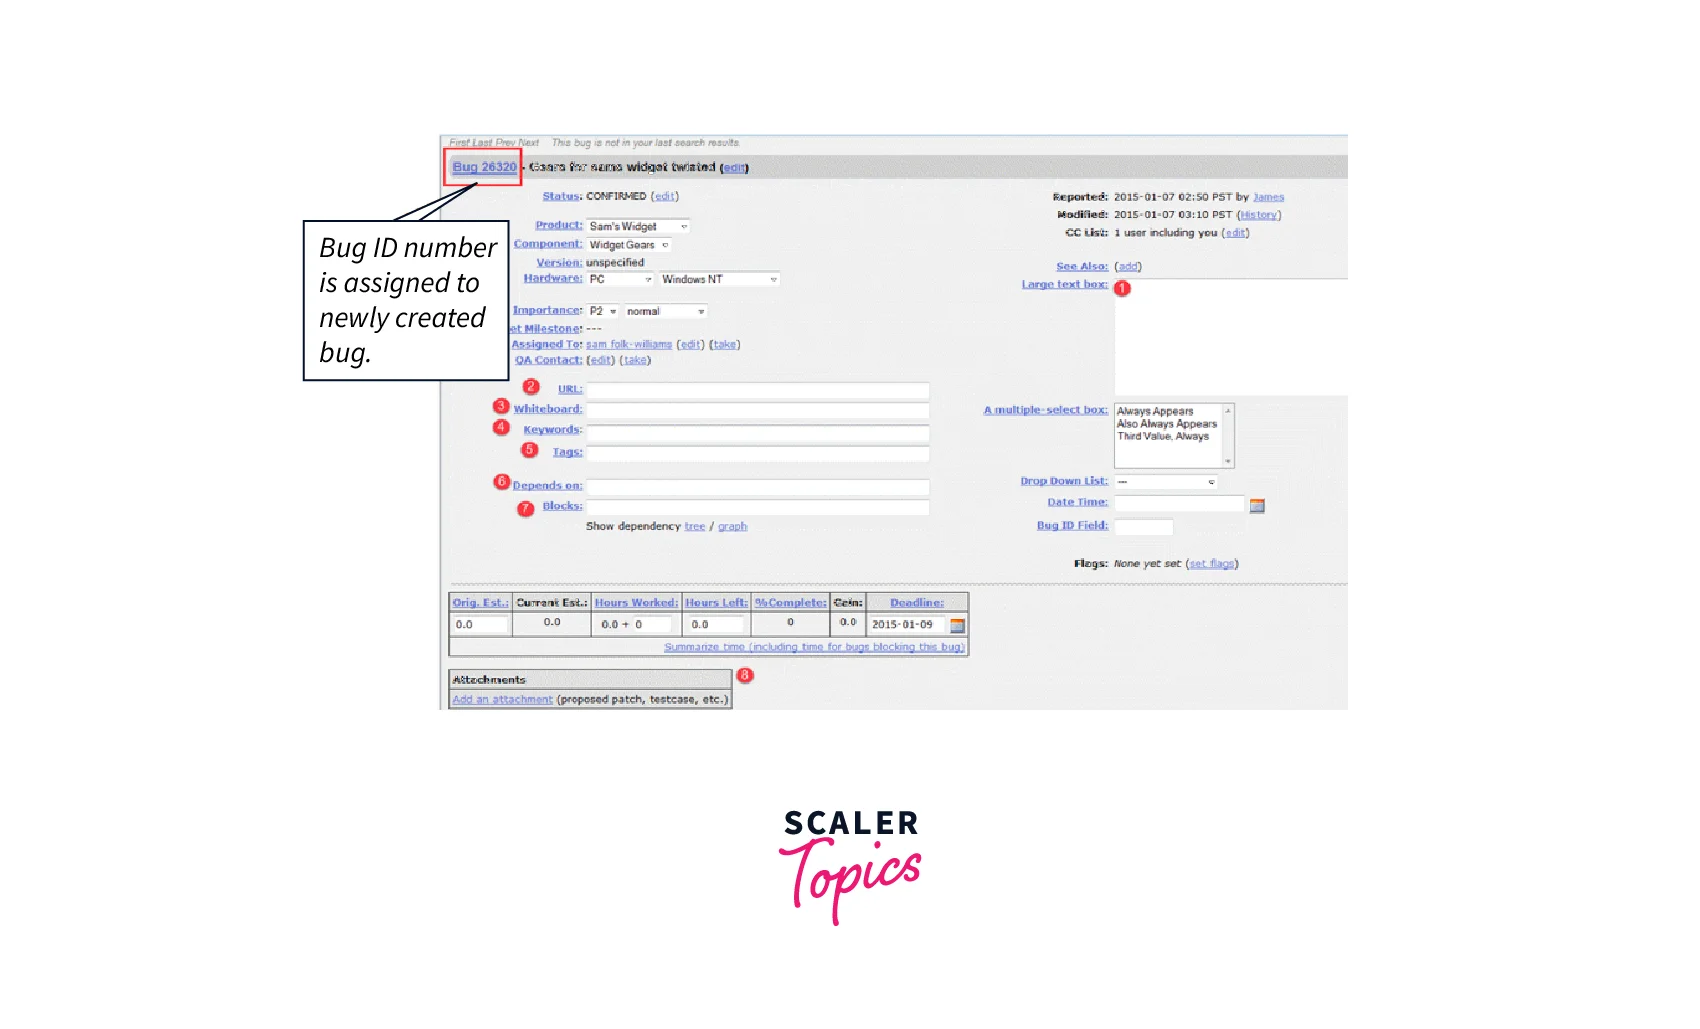
ID# XXXXX is assigned to the created bug. You can add additional information such as URL, keywords, table, tags, etc. to the specified error. These additional details add extra value to the generated bug.
- Large text box
- URL
- Whiteboard
- Keywords
- Tags
- Depends on
- Blocks
- Attachments
Create Graphical Report in Steps
Step - 1:
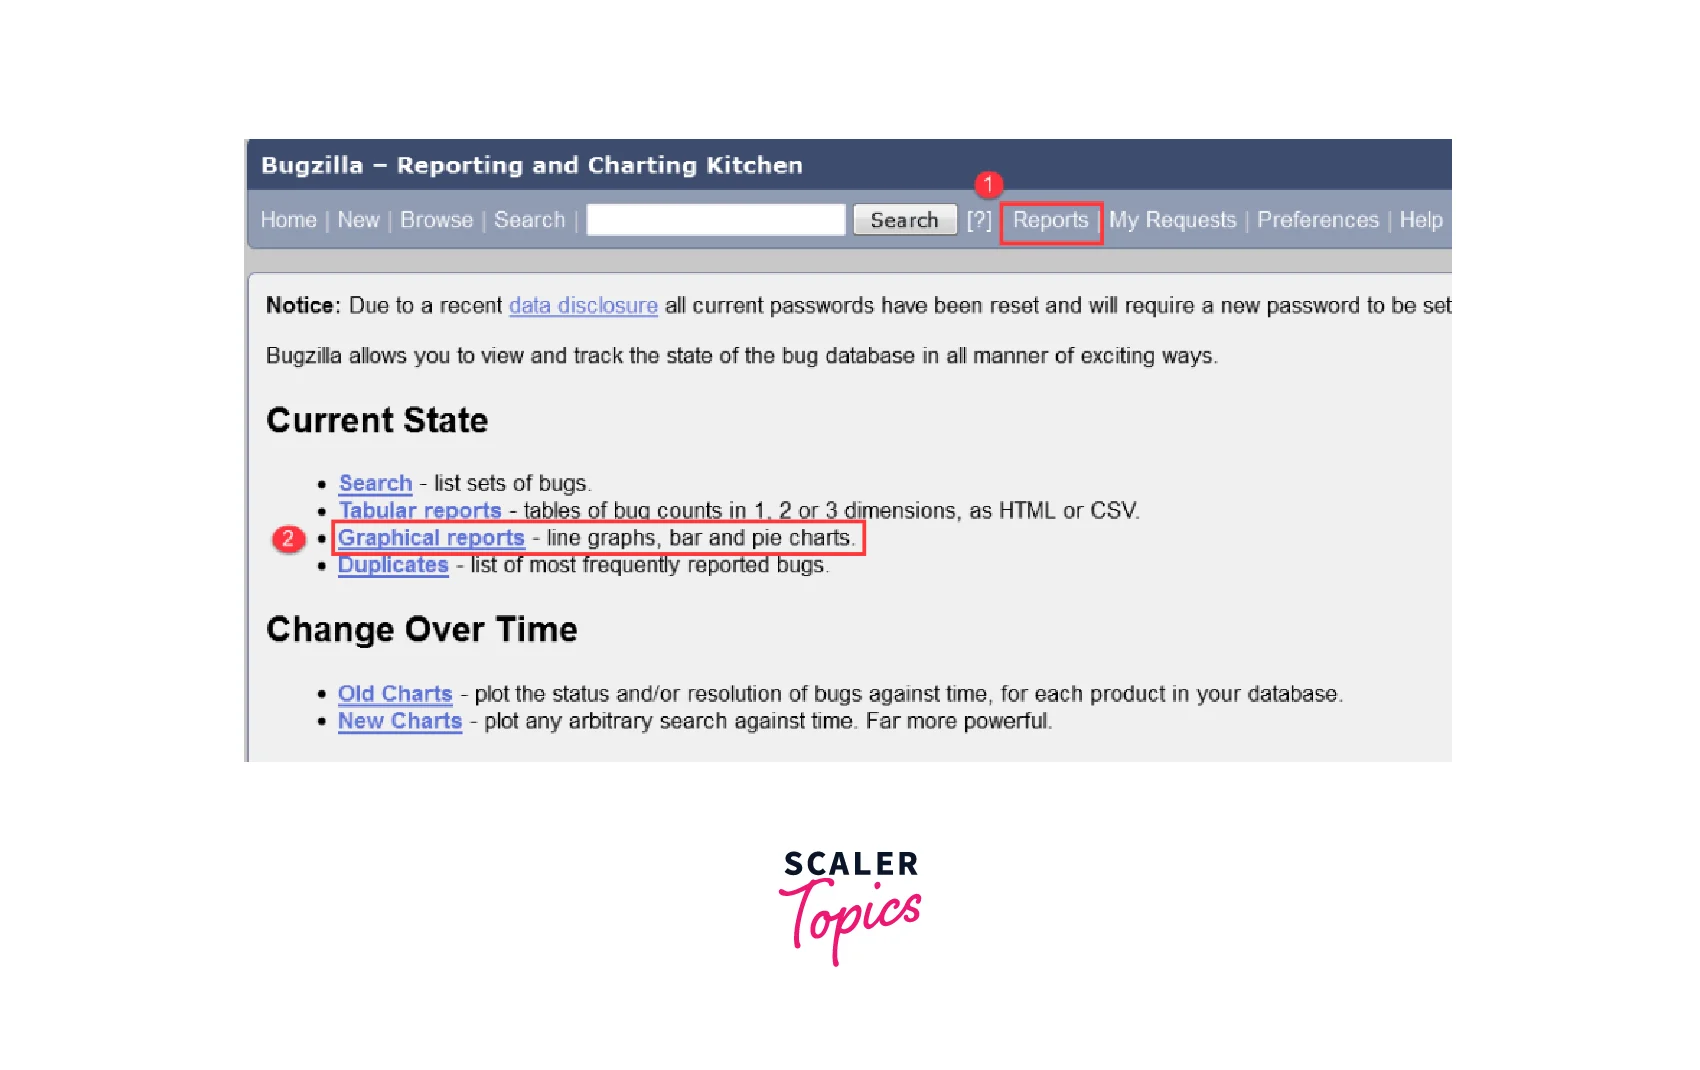
To Generate a report graphically, Click the "Report" button in the main menu
In the given option and click on "Graphical Reports".
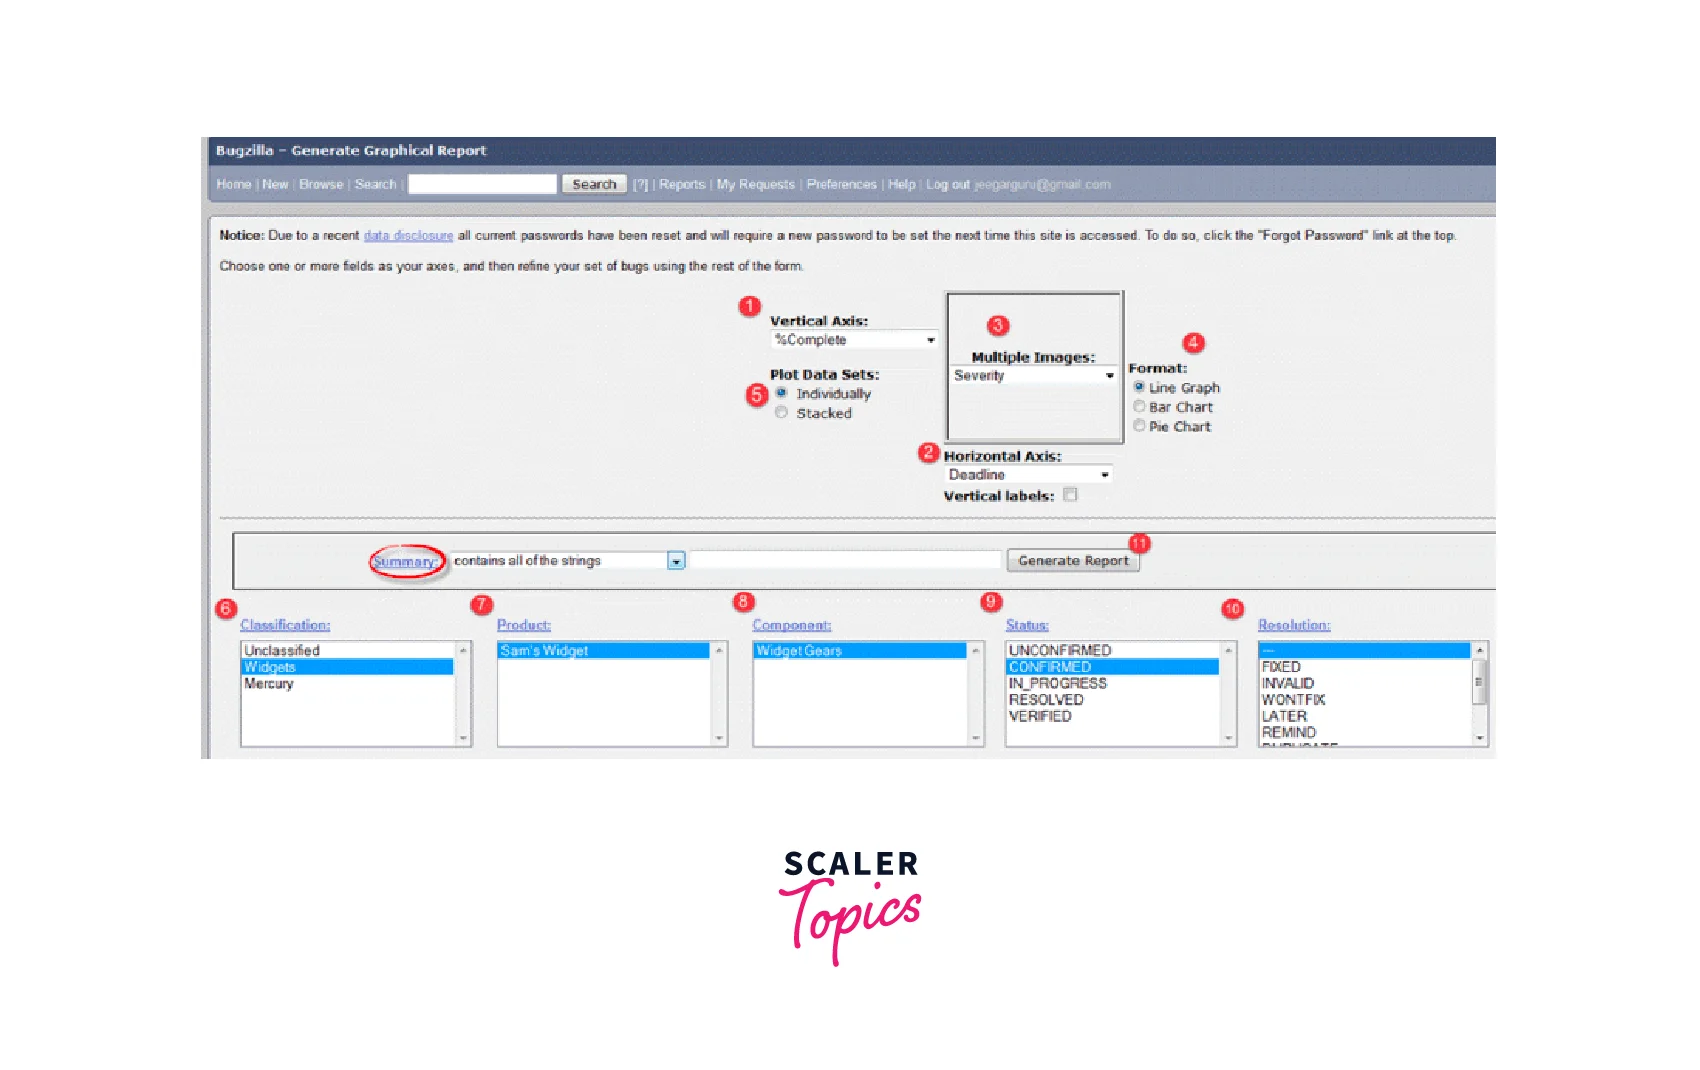
Step - 2:
Let's plot % Complete vs Deadline
Here we have selected % Complete on the vertical axis and Deadline on the horizontal axis. It gives a graph of the amount of work done in the percentage of the set deadline.
Now configure various options for the graphical display of reports and Click on the Generate Report button.
- Vertical Axis
- Horizontal Axis
- Multiple Images
- Format- Line, Bar, or Pie charts
- Plot data set
- Classification
- Product
- Component
- Status
- Resolution
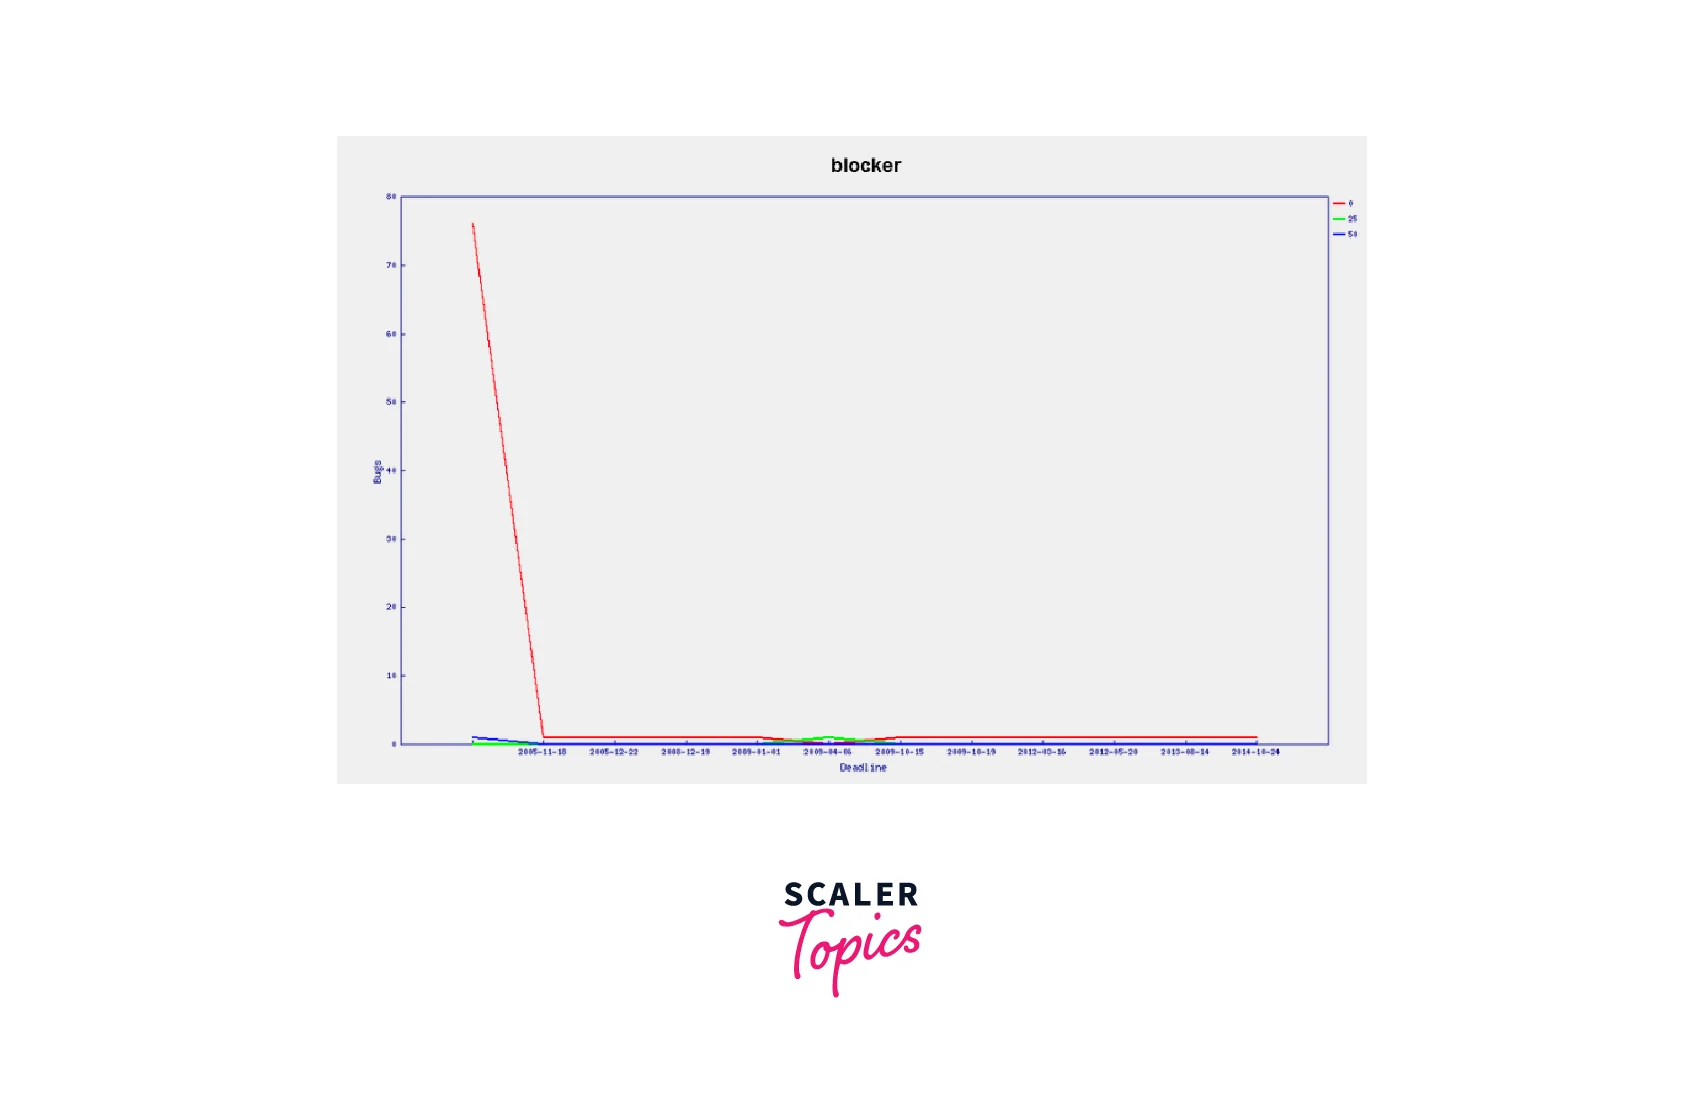
The generated graph will look like as below picture:
Conclusion
- Bugzilla's graphical reports provide visual representations for data analysis and decision-making.
- Bugzilla's integration with other tools/systems provides in-depth data analysis.
- Customized reports have deeper insights.
- Tailored reports for the needs of different stakeholders.
- Bugzilla's graphical reports provide insight, track progress, and improve bug-tracking processes.