Report & Analysis in HP ALM
Overview
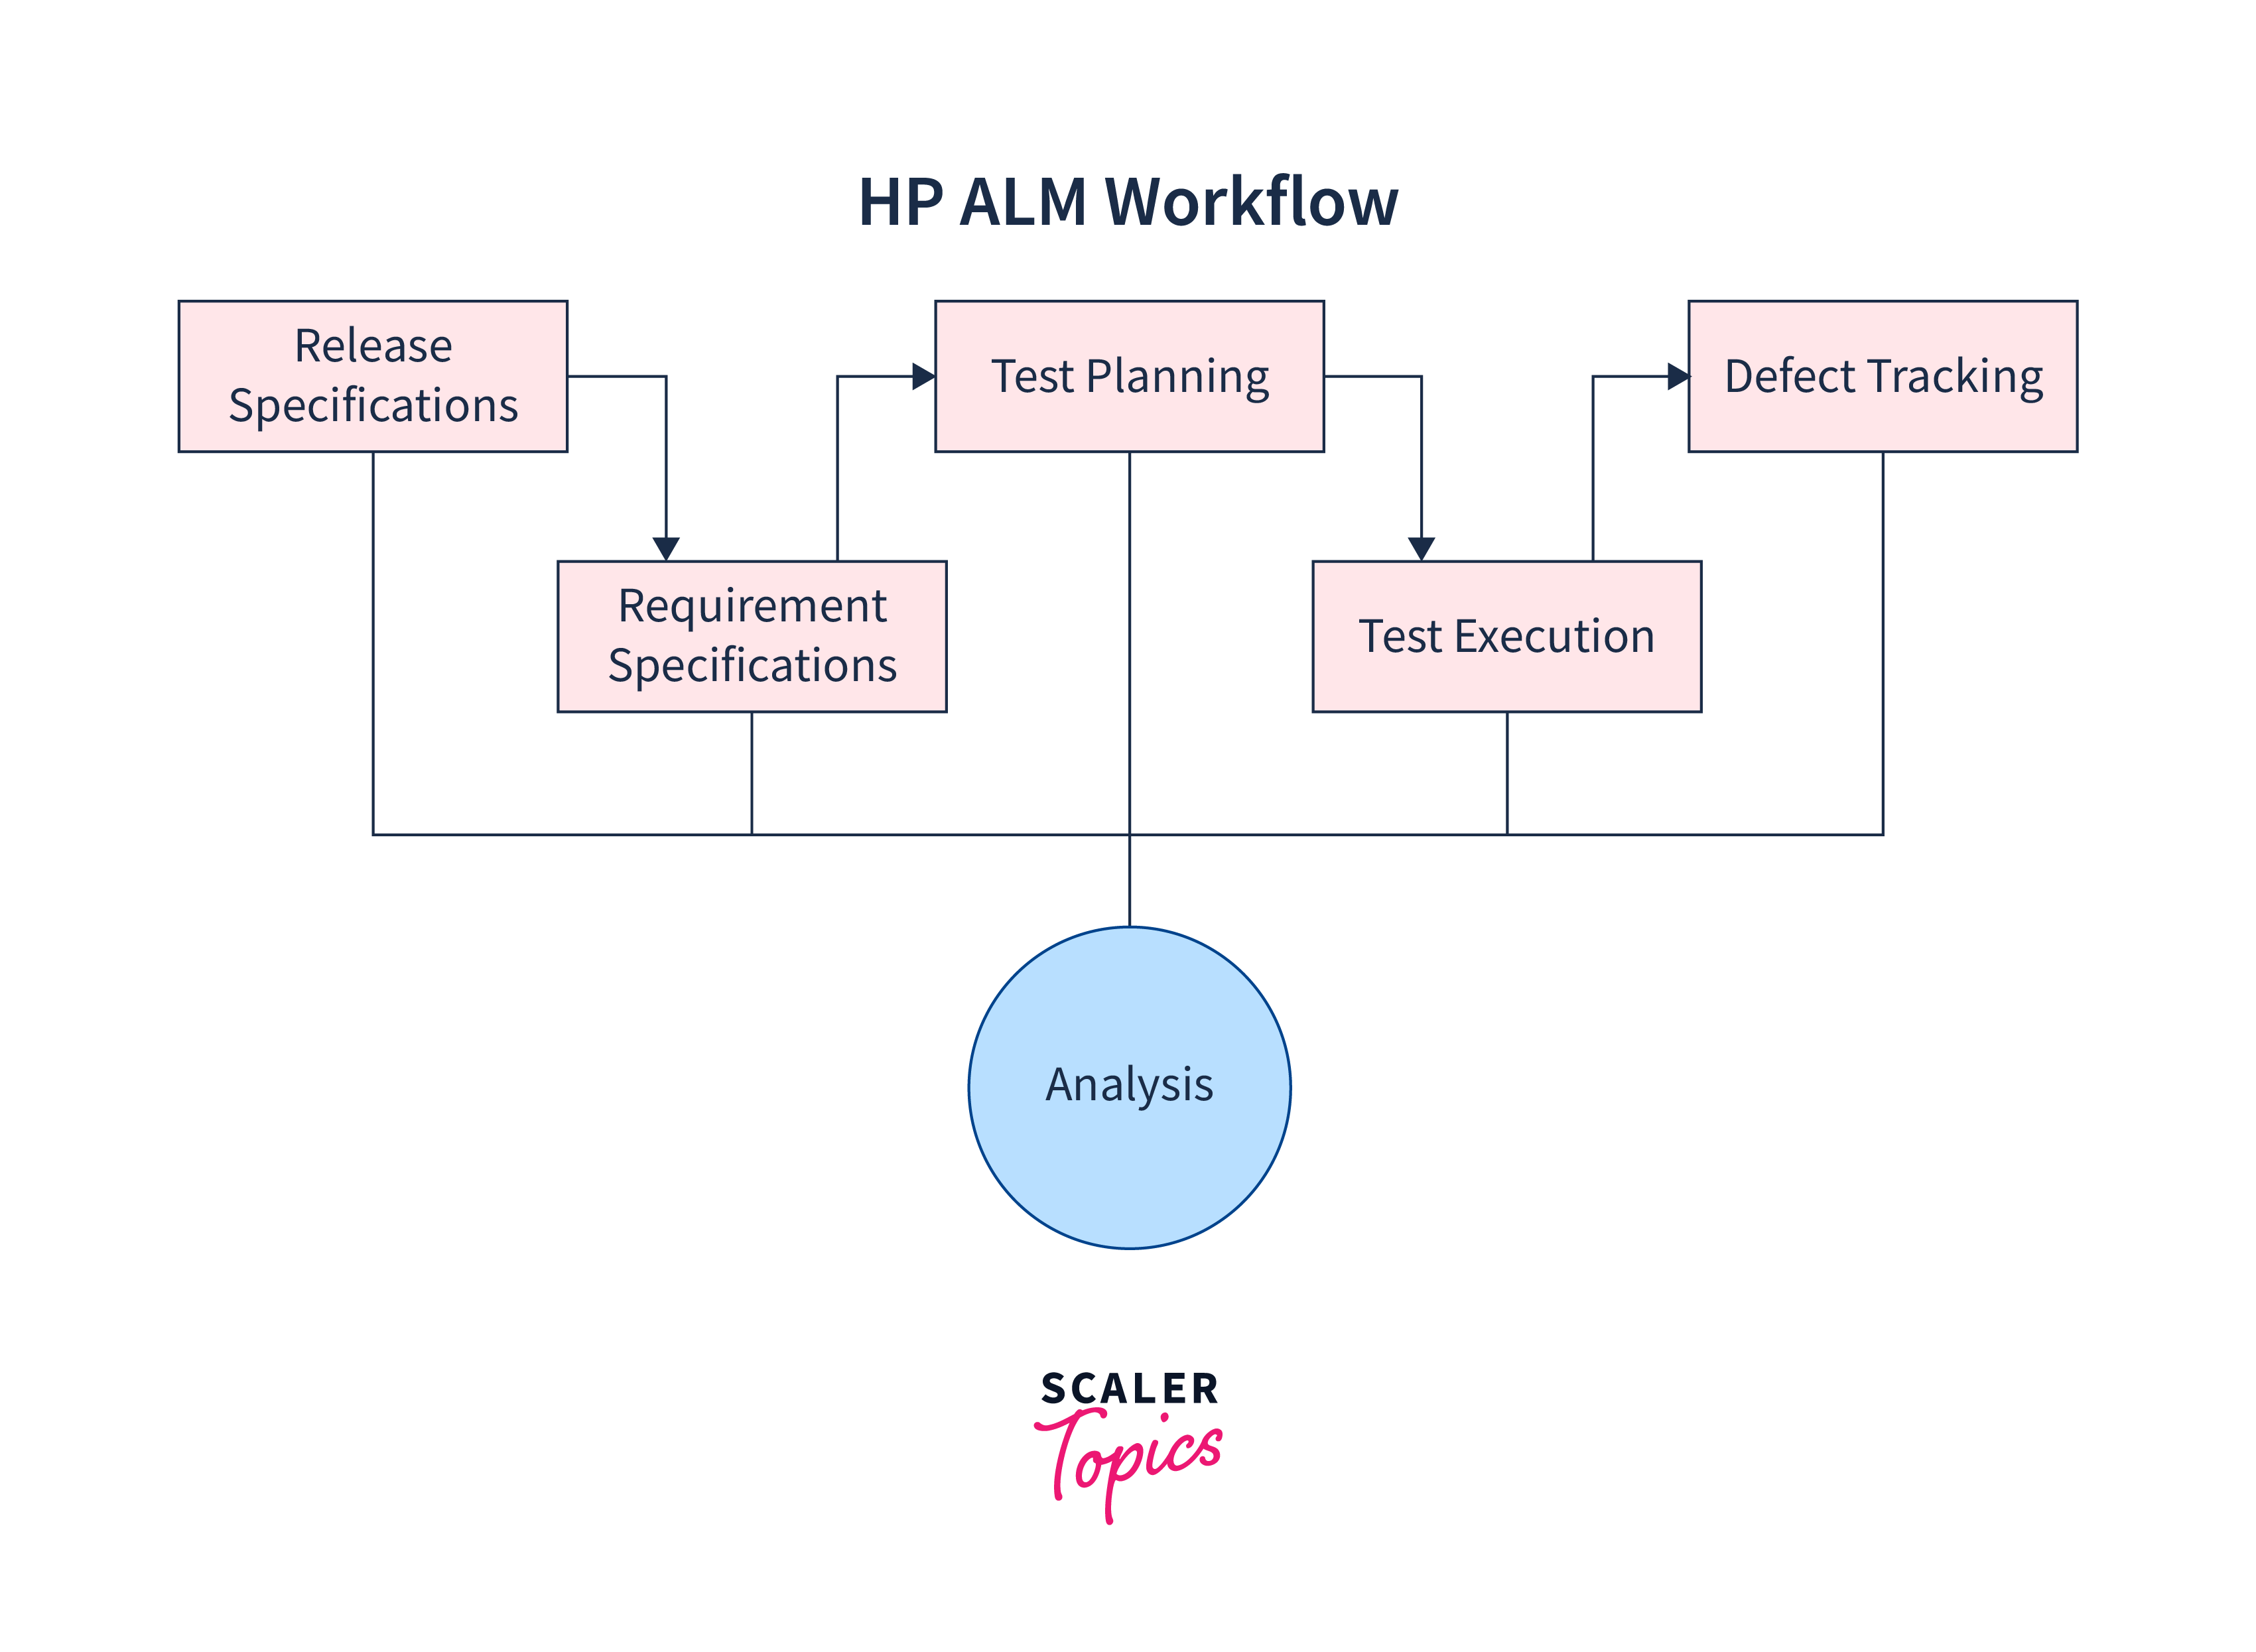
The reporting and analysis features within HP ALM provide valuable insights into the performance of the development process, including metrics such as defect rates, test coverage, and cycle time. These features allow businesses to gain a better understanding of the performance of their development teams, track progress toward goals, and identify areas of inefficiency or areas for improvement. By providing valuable insights and enabling data-driven decision-making, these features can help businesses optimize their development process, increase efficiency, and ultimately deliver better software products to their customers.
Analysis View
Analysis View is a powerful feature of HP ALM that allows users to create custom views of their data in a very flexible way. HP ALM's Analysis View feature allows users to define criteria, group data, and create calculations based on data to create custom views. Users can select the data to analyze (such as test runs, defects, requirements, and other relevant information) and set filters, sort, group, and aggregate options to create a customized view of the data that meets their needs.
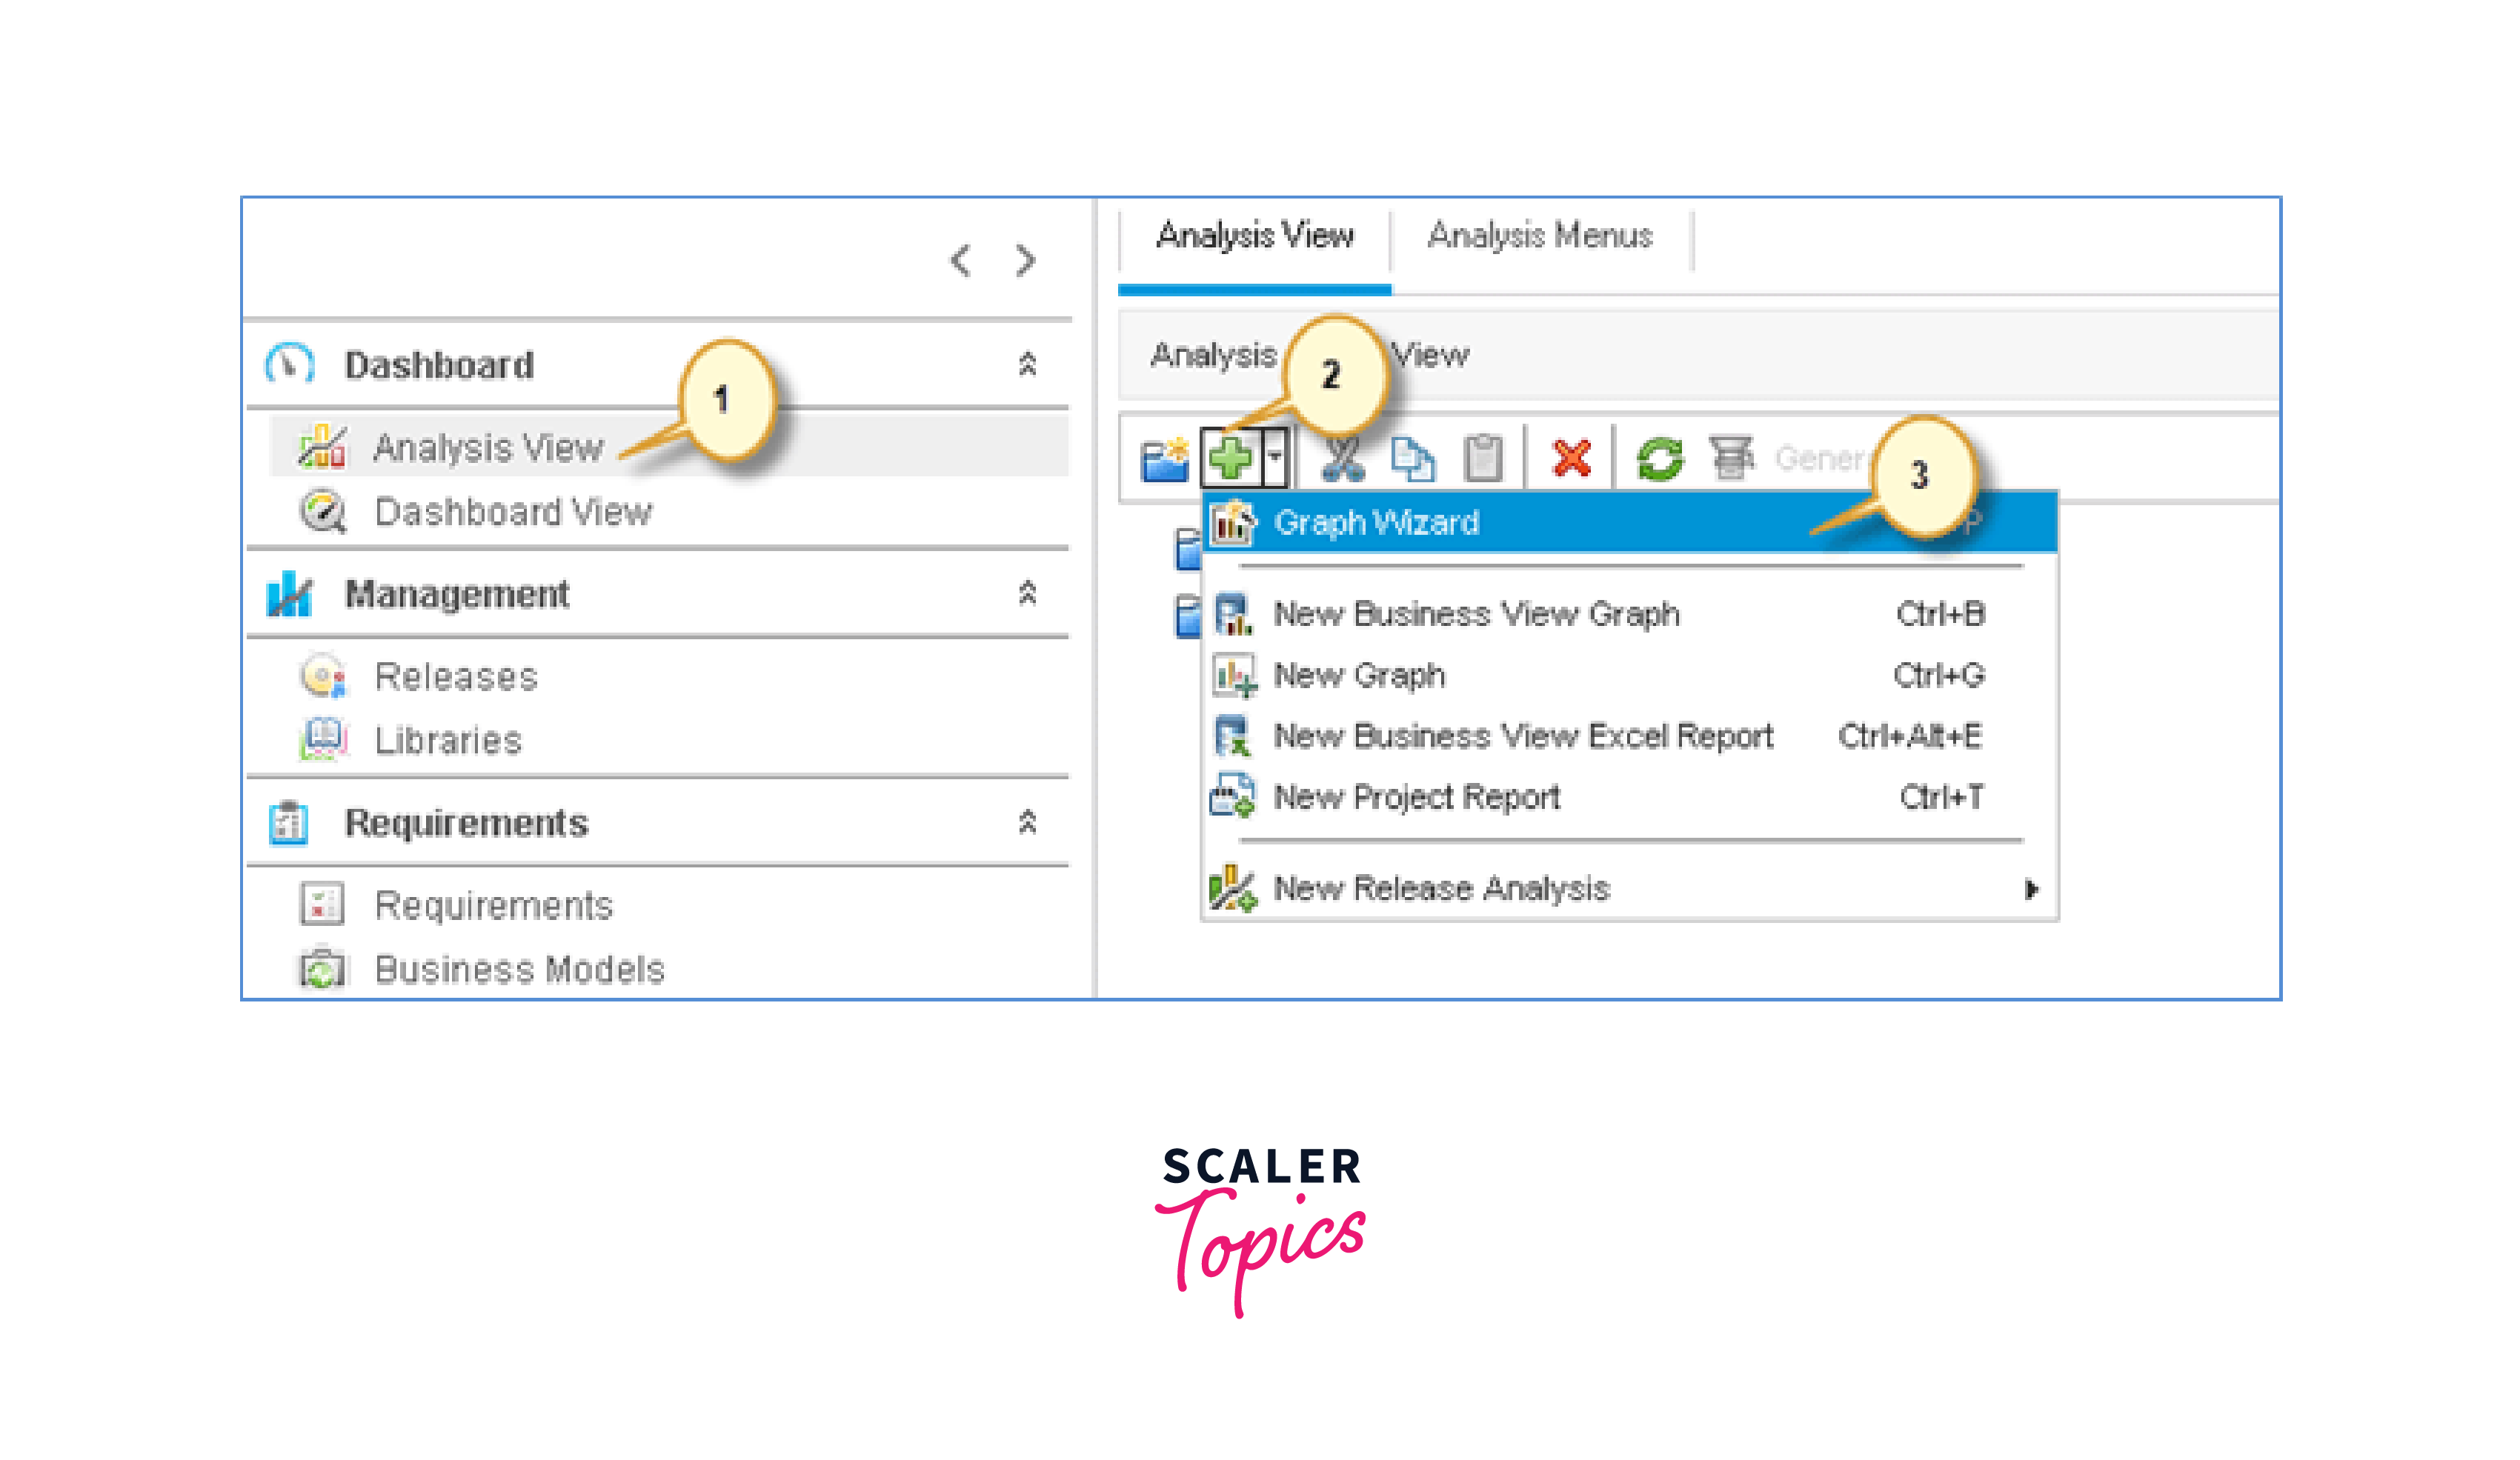
Step 1: Go to the Dashboard tab.
- Choose Analysis View
- Click "New".
- Select "Graphic Wizard"
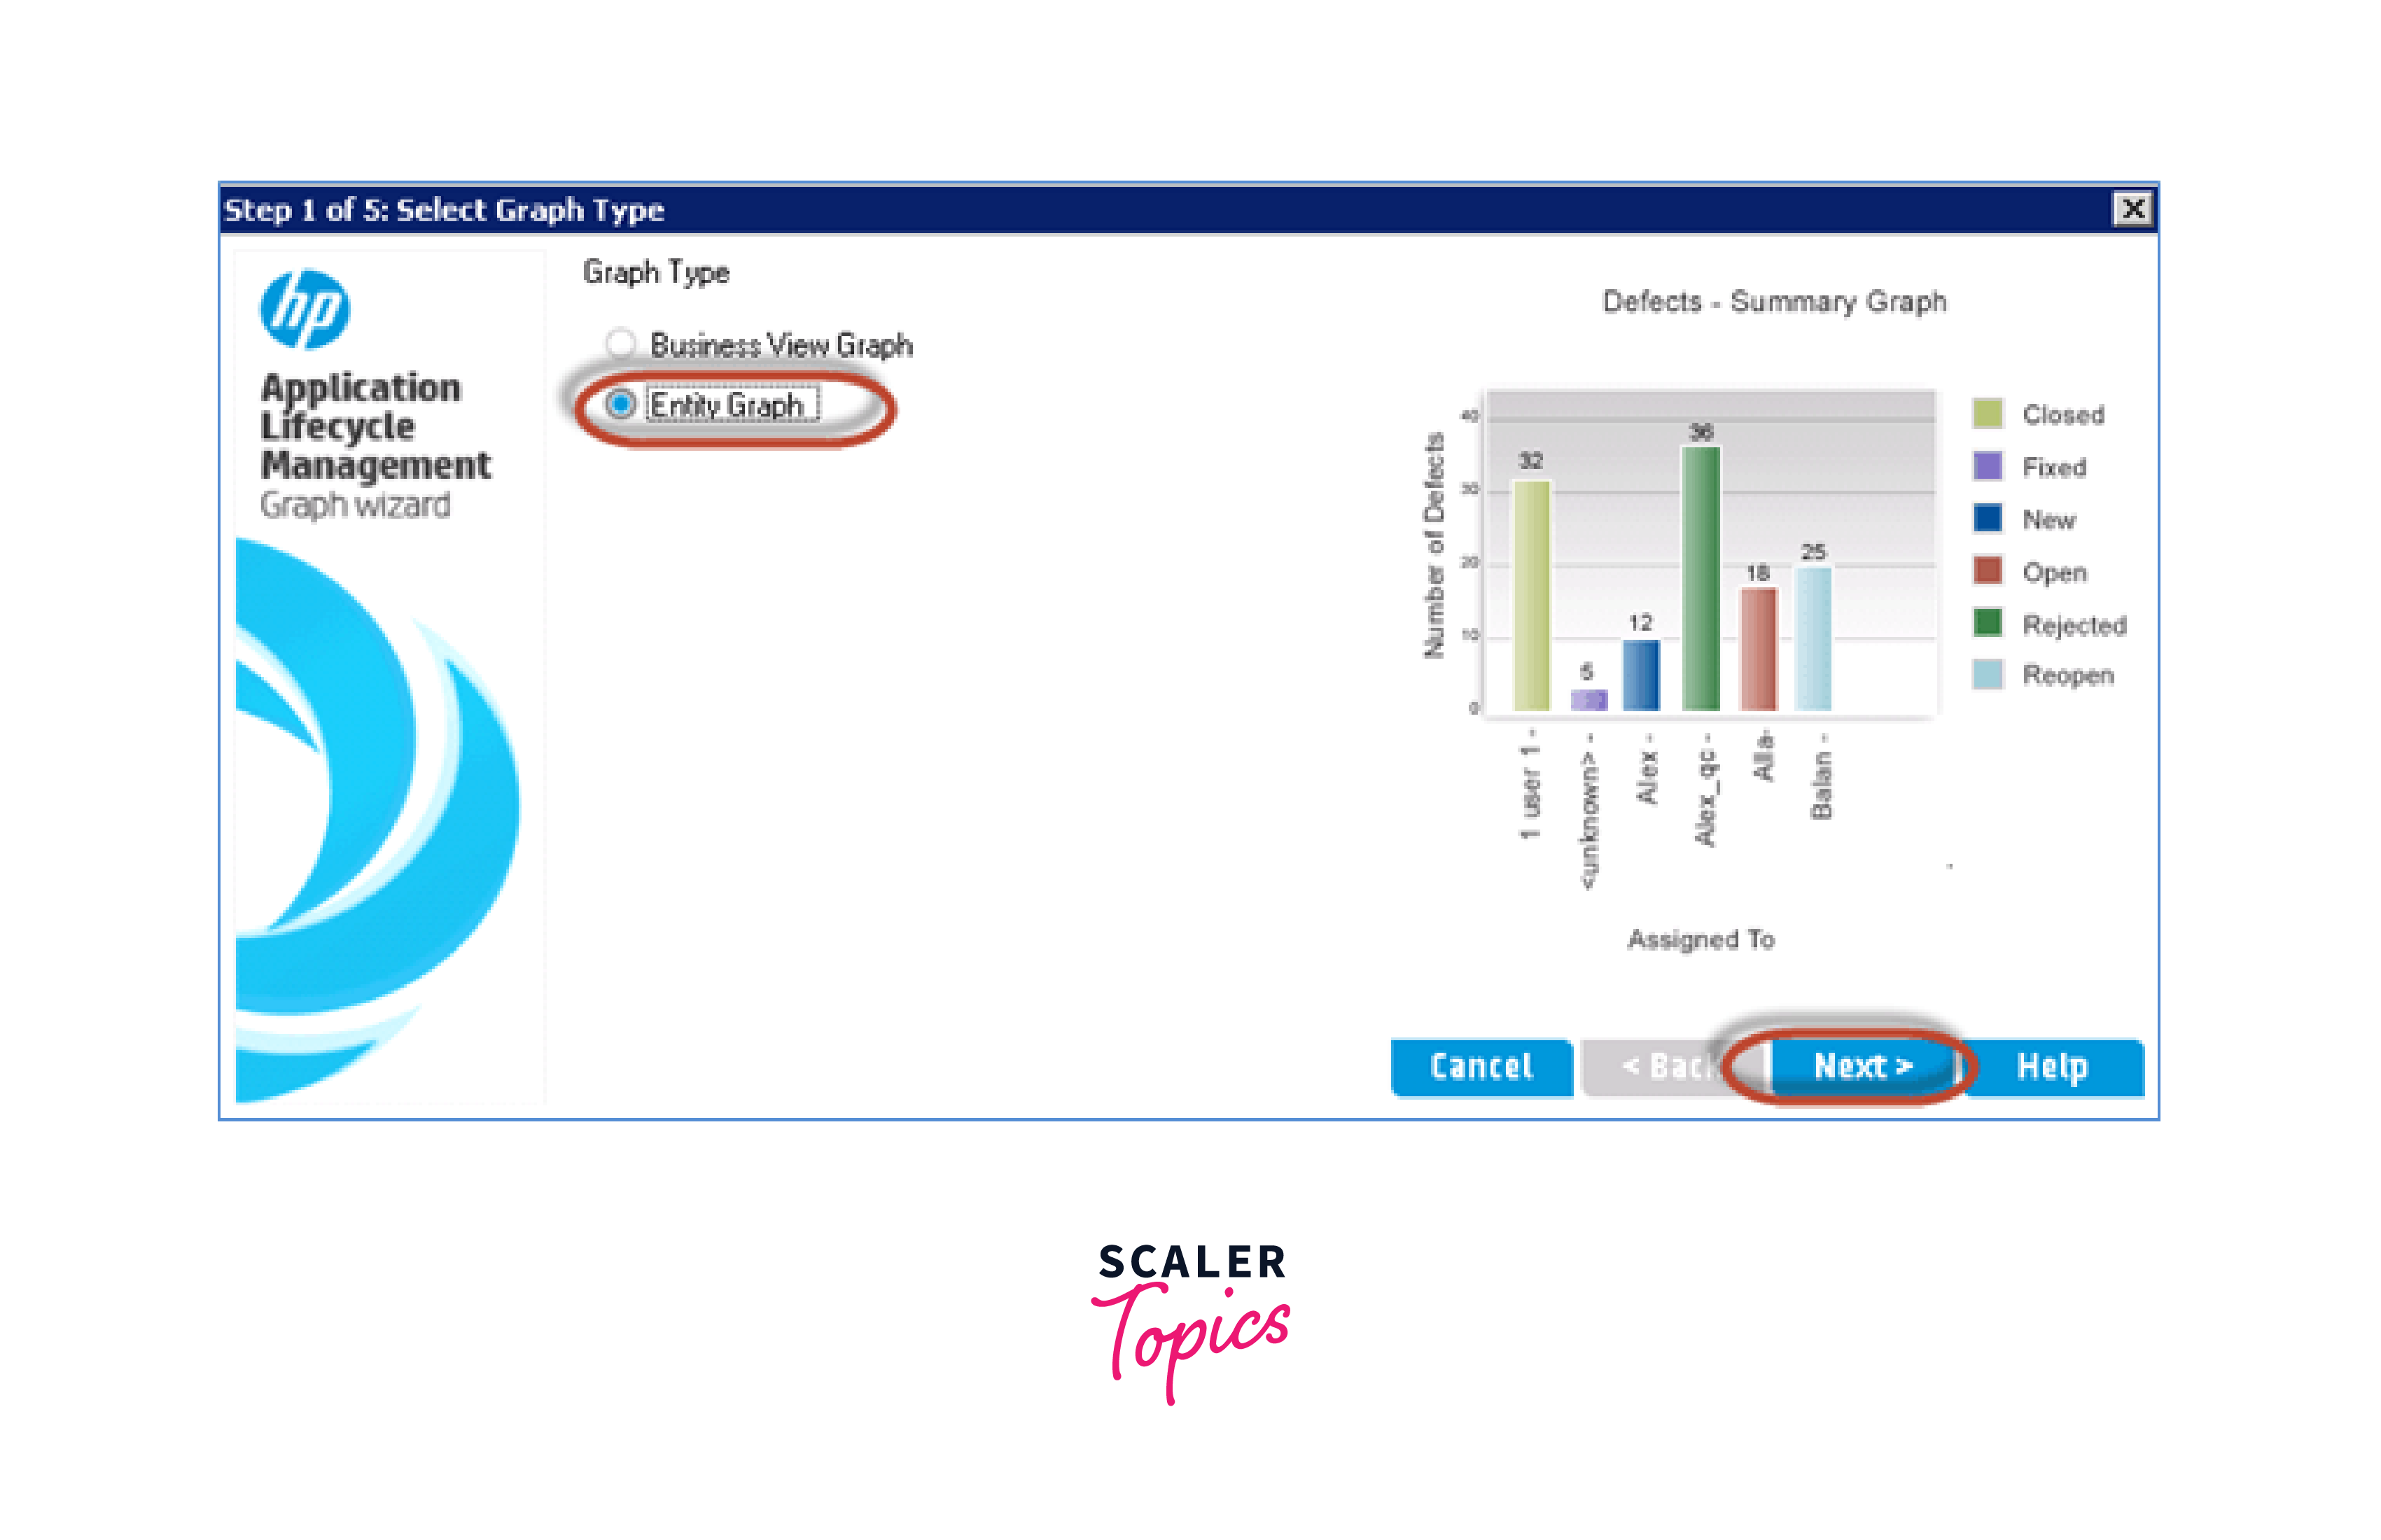
Step 2: To create an "entity graph". We can also create a business view graph and click the "Next" button.
Step 3: "Select entity type" dialog should appear to the screen.
- Choose the entity to display the graph
- Select the graphic type.
- Click the "Next" button.
The wizard enables project selection and allows the user to apply the identical graphic configuration to multiple projects.

Step 4: In addition, the wizard permits the input of filter criteria, and if none are specified, the fault module's complete dataset is used to generate the graph.
Note: A filter can be applied to a specific topic/episode. If no filter is specified, the chart wizard will consider all errors logged so far.
Step 5: The user is able to choose the X-axis and group the data by a particular field by using the wizard, then they can click "Finish".

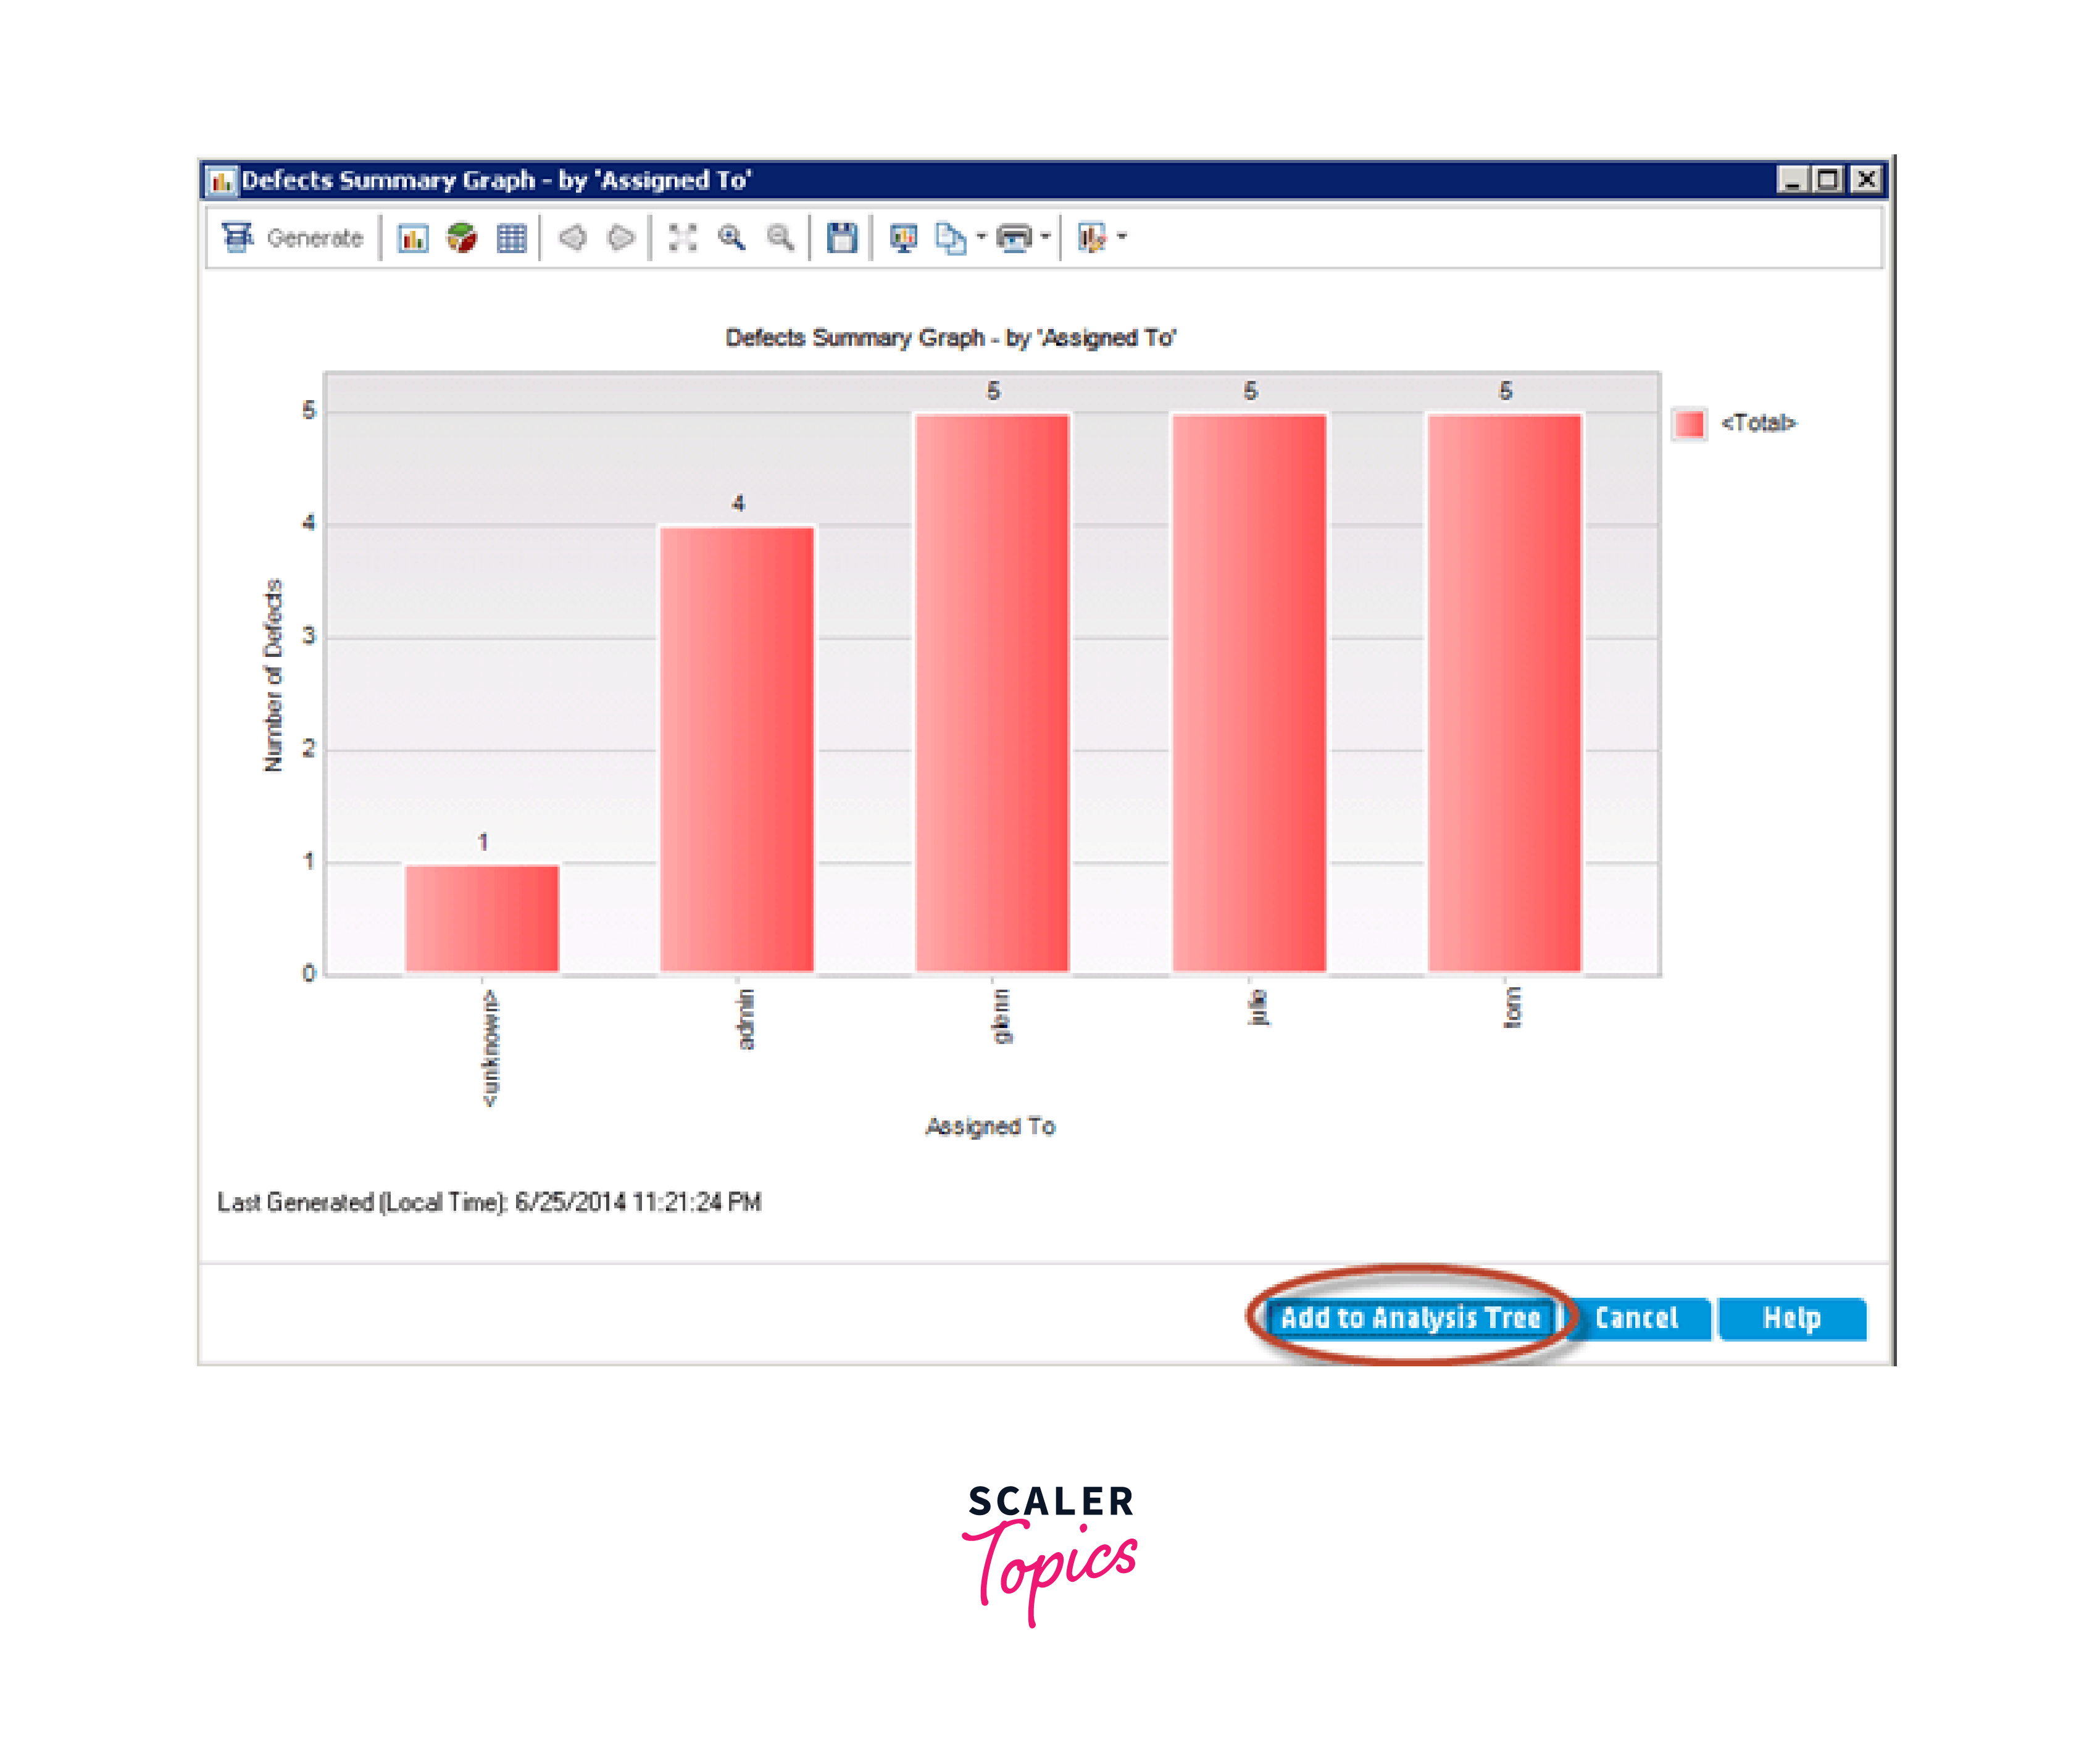
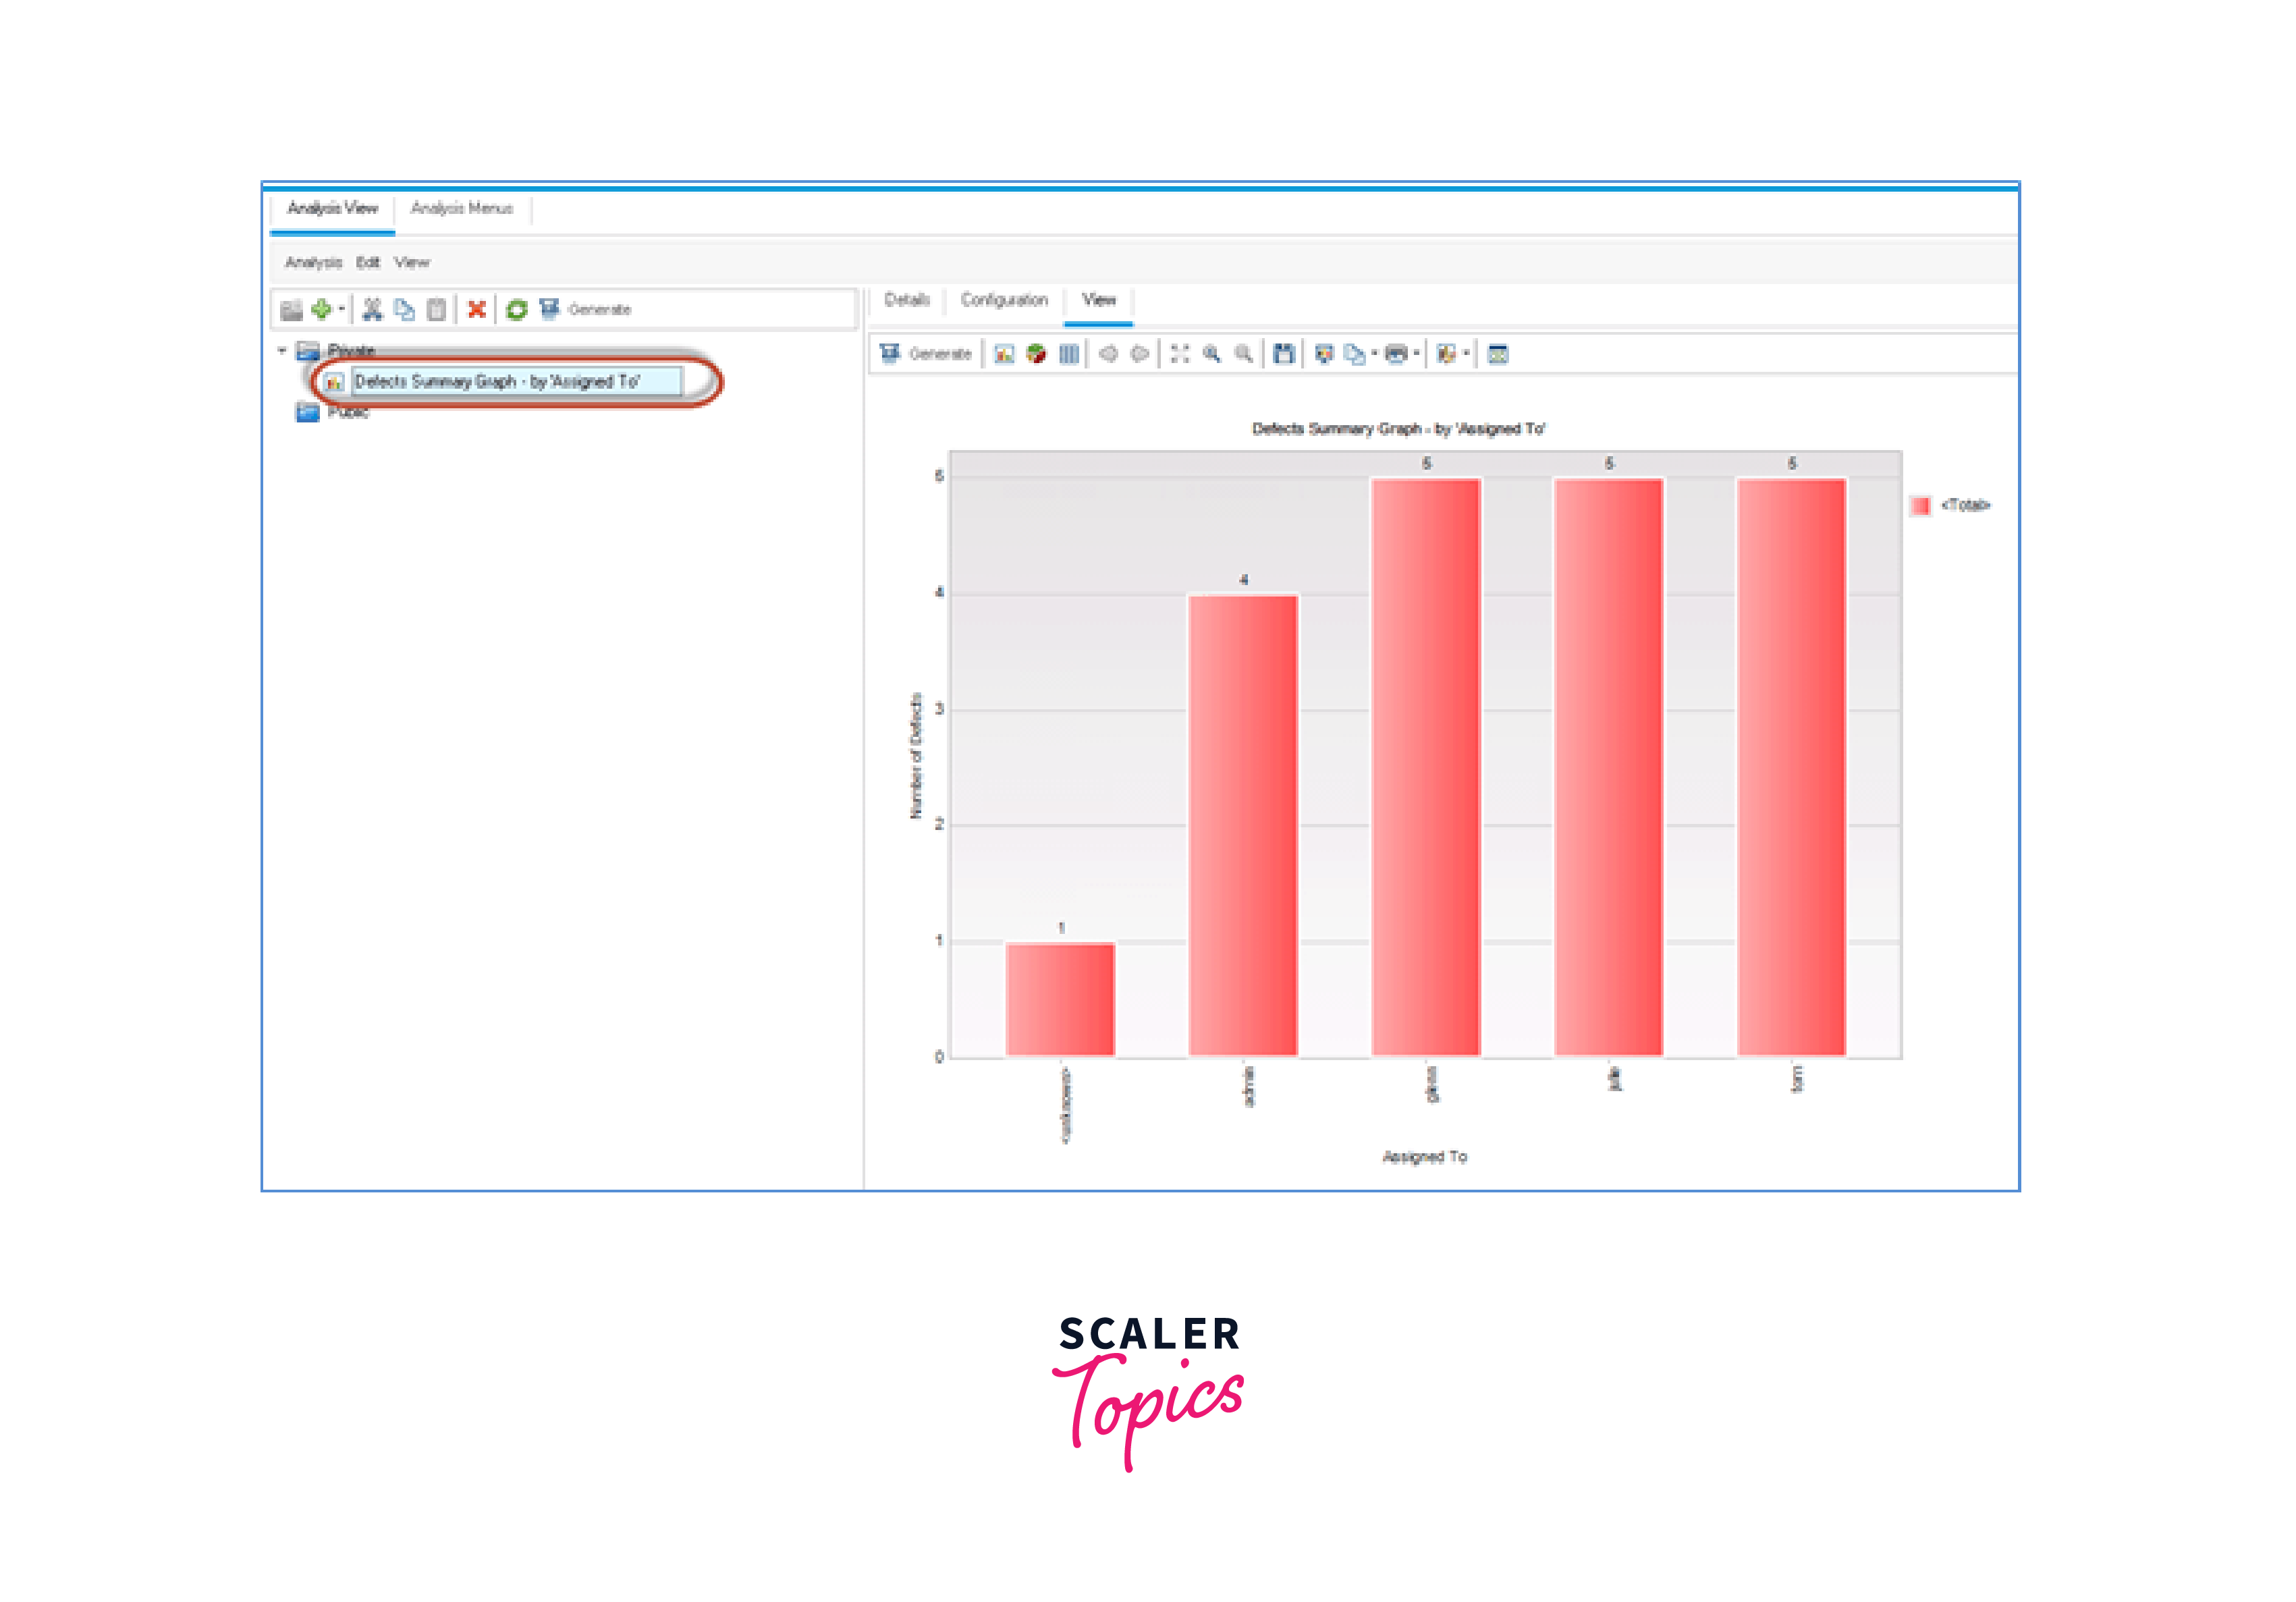
Step 6: Once the user sets the criteria in the Graph wizard, the graph is generated accordingly. The option to "Add it to the Analysis Tree" is available, allowing for effortless updates to reflect the current state of the data.
Step 7: Clicking on "Add to analysis tree", the save window will open.
- Enter a graph name
- Choose the folder where the user wants to save the chart Private - Graph is saved with the current user profile only No Others can access to the graph. Public - Graph visibility is public
- Click on "Save" button.
The graph should be added to the analysis tree as shown below.

Business View Graph
Business views are custom data views in HP ALM that allow users to define criteria, group data, and create calculations from data to create custom views. Business view charts allow users to visually represent data from their business views in a graphical format that can facilitate the identification of trends, patterns, and insights.
Step 1: Select the icon that looks like a plus "+" sign followed by the option called "Graph Wizard".

Step 2: Select the Business View Graph option and then proceed by clicking on the "Next" button.

Step 3: Select "defects" from the filter criteria and proceed by clicking the "Next" button.

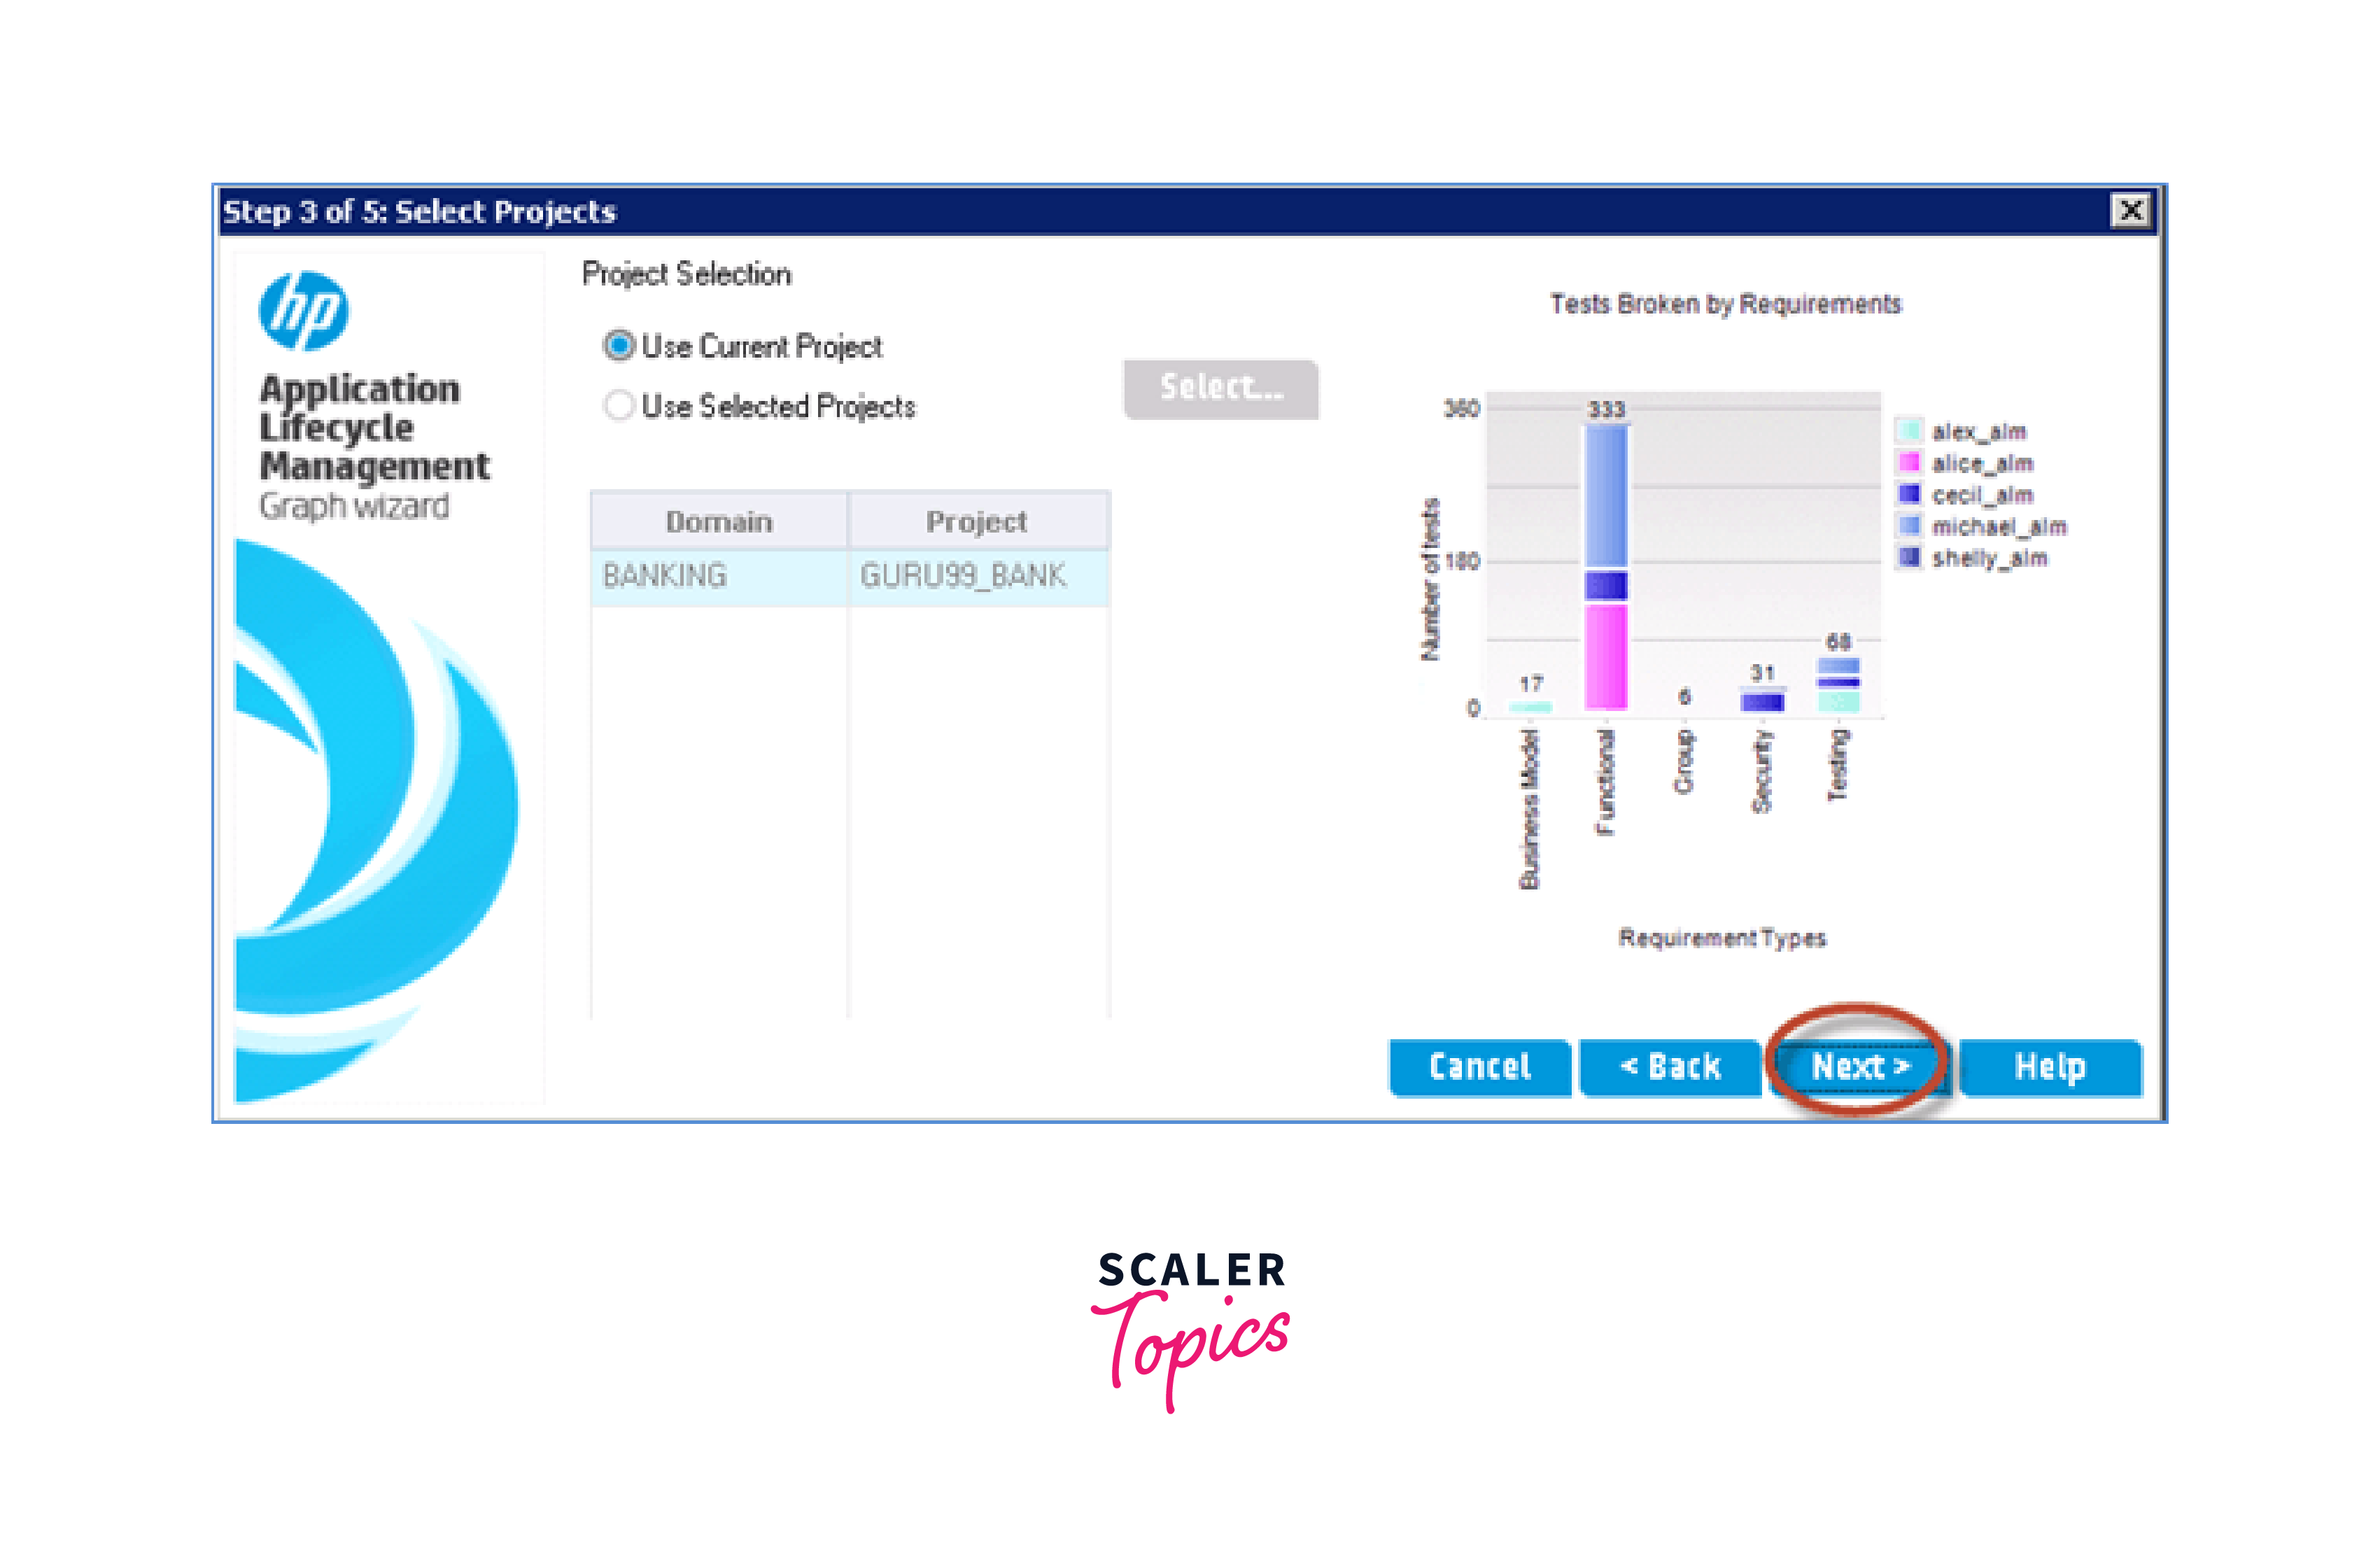
Step 4: Utilize the current project data to construct the graph and select "Next" to proceed.
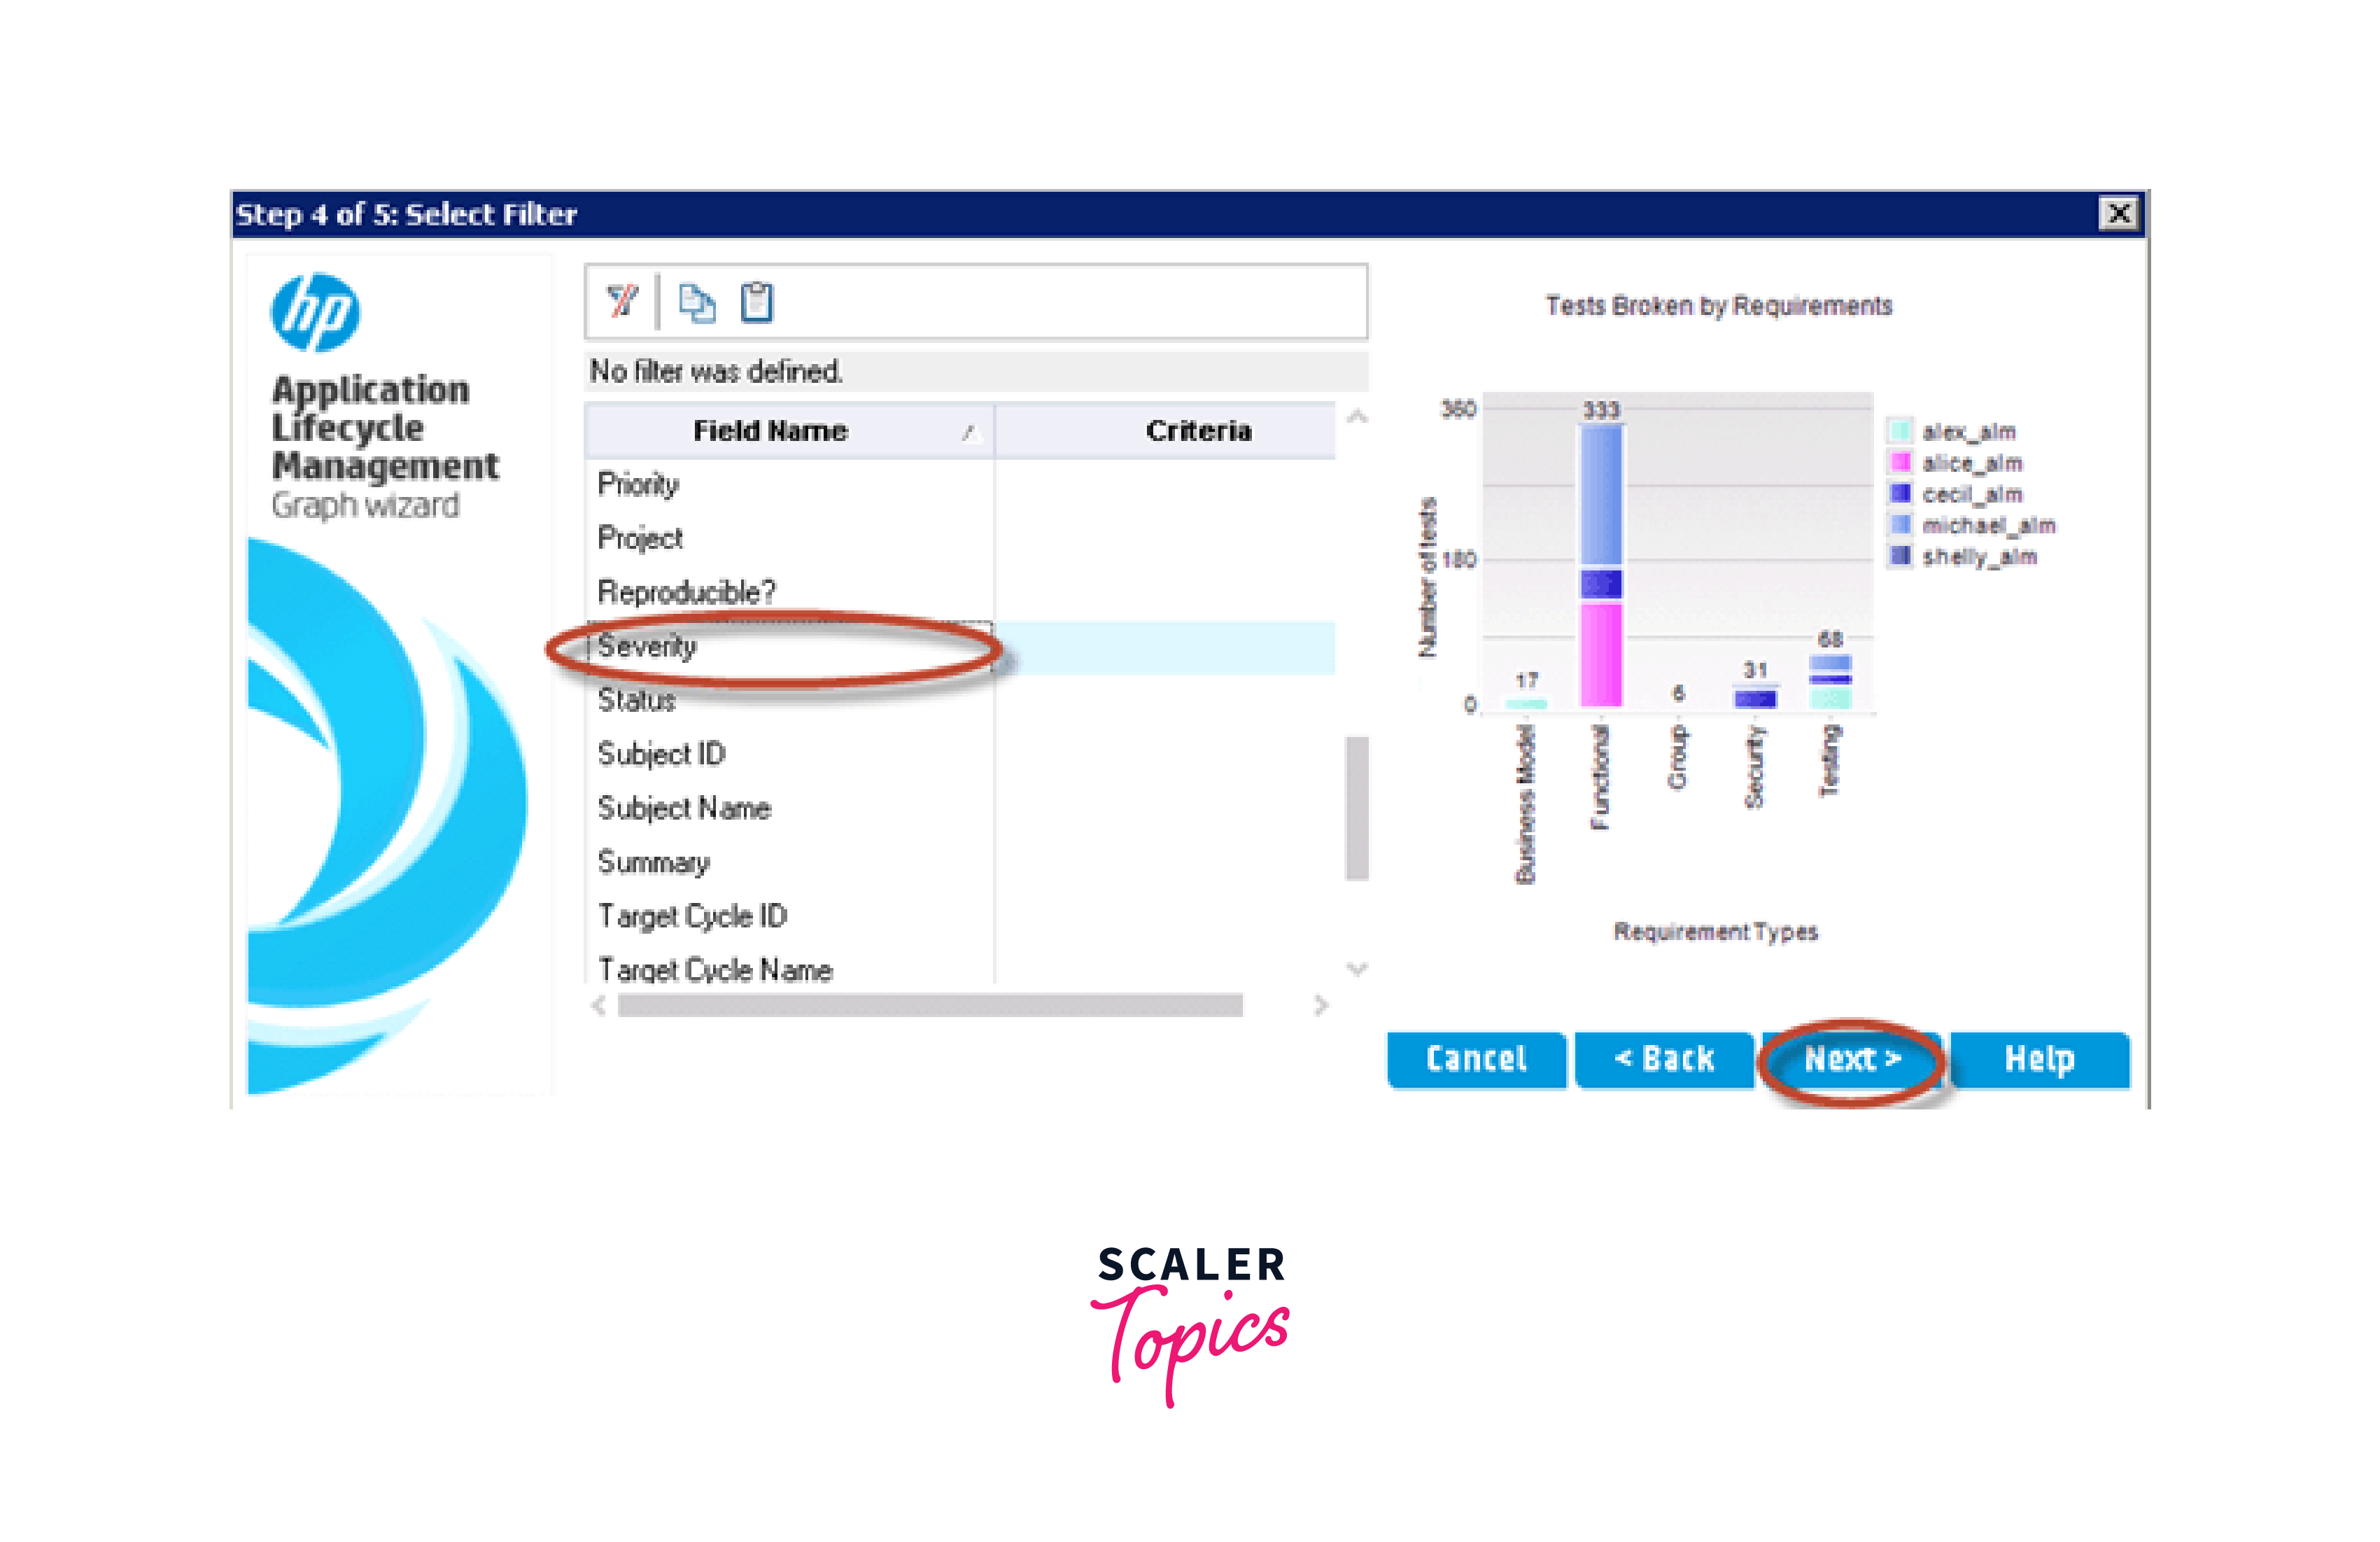
Step 5: Let's filter by severity and click "Next"
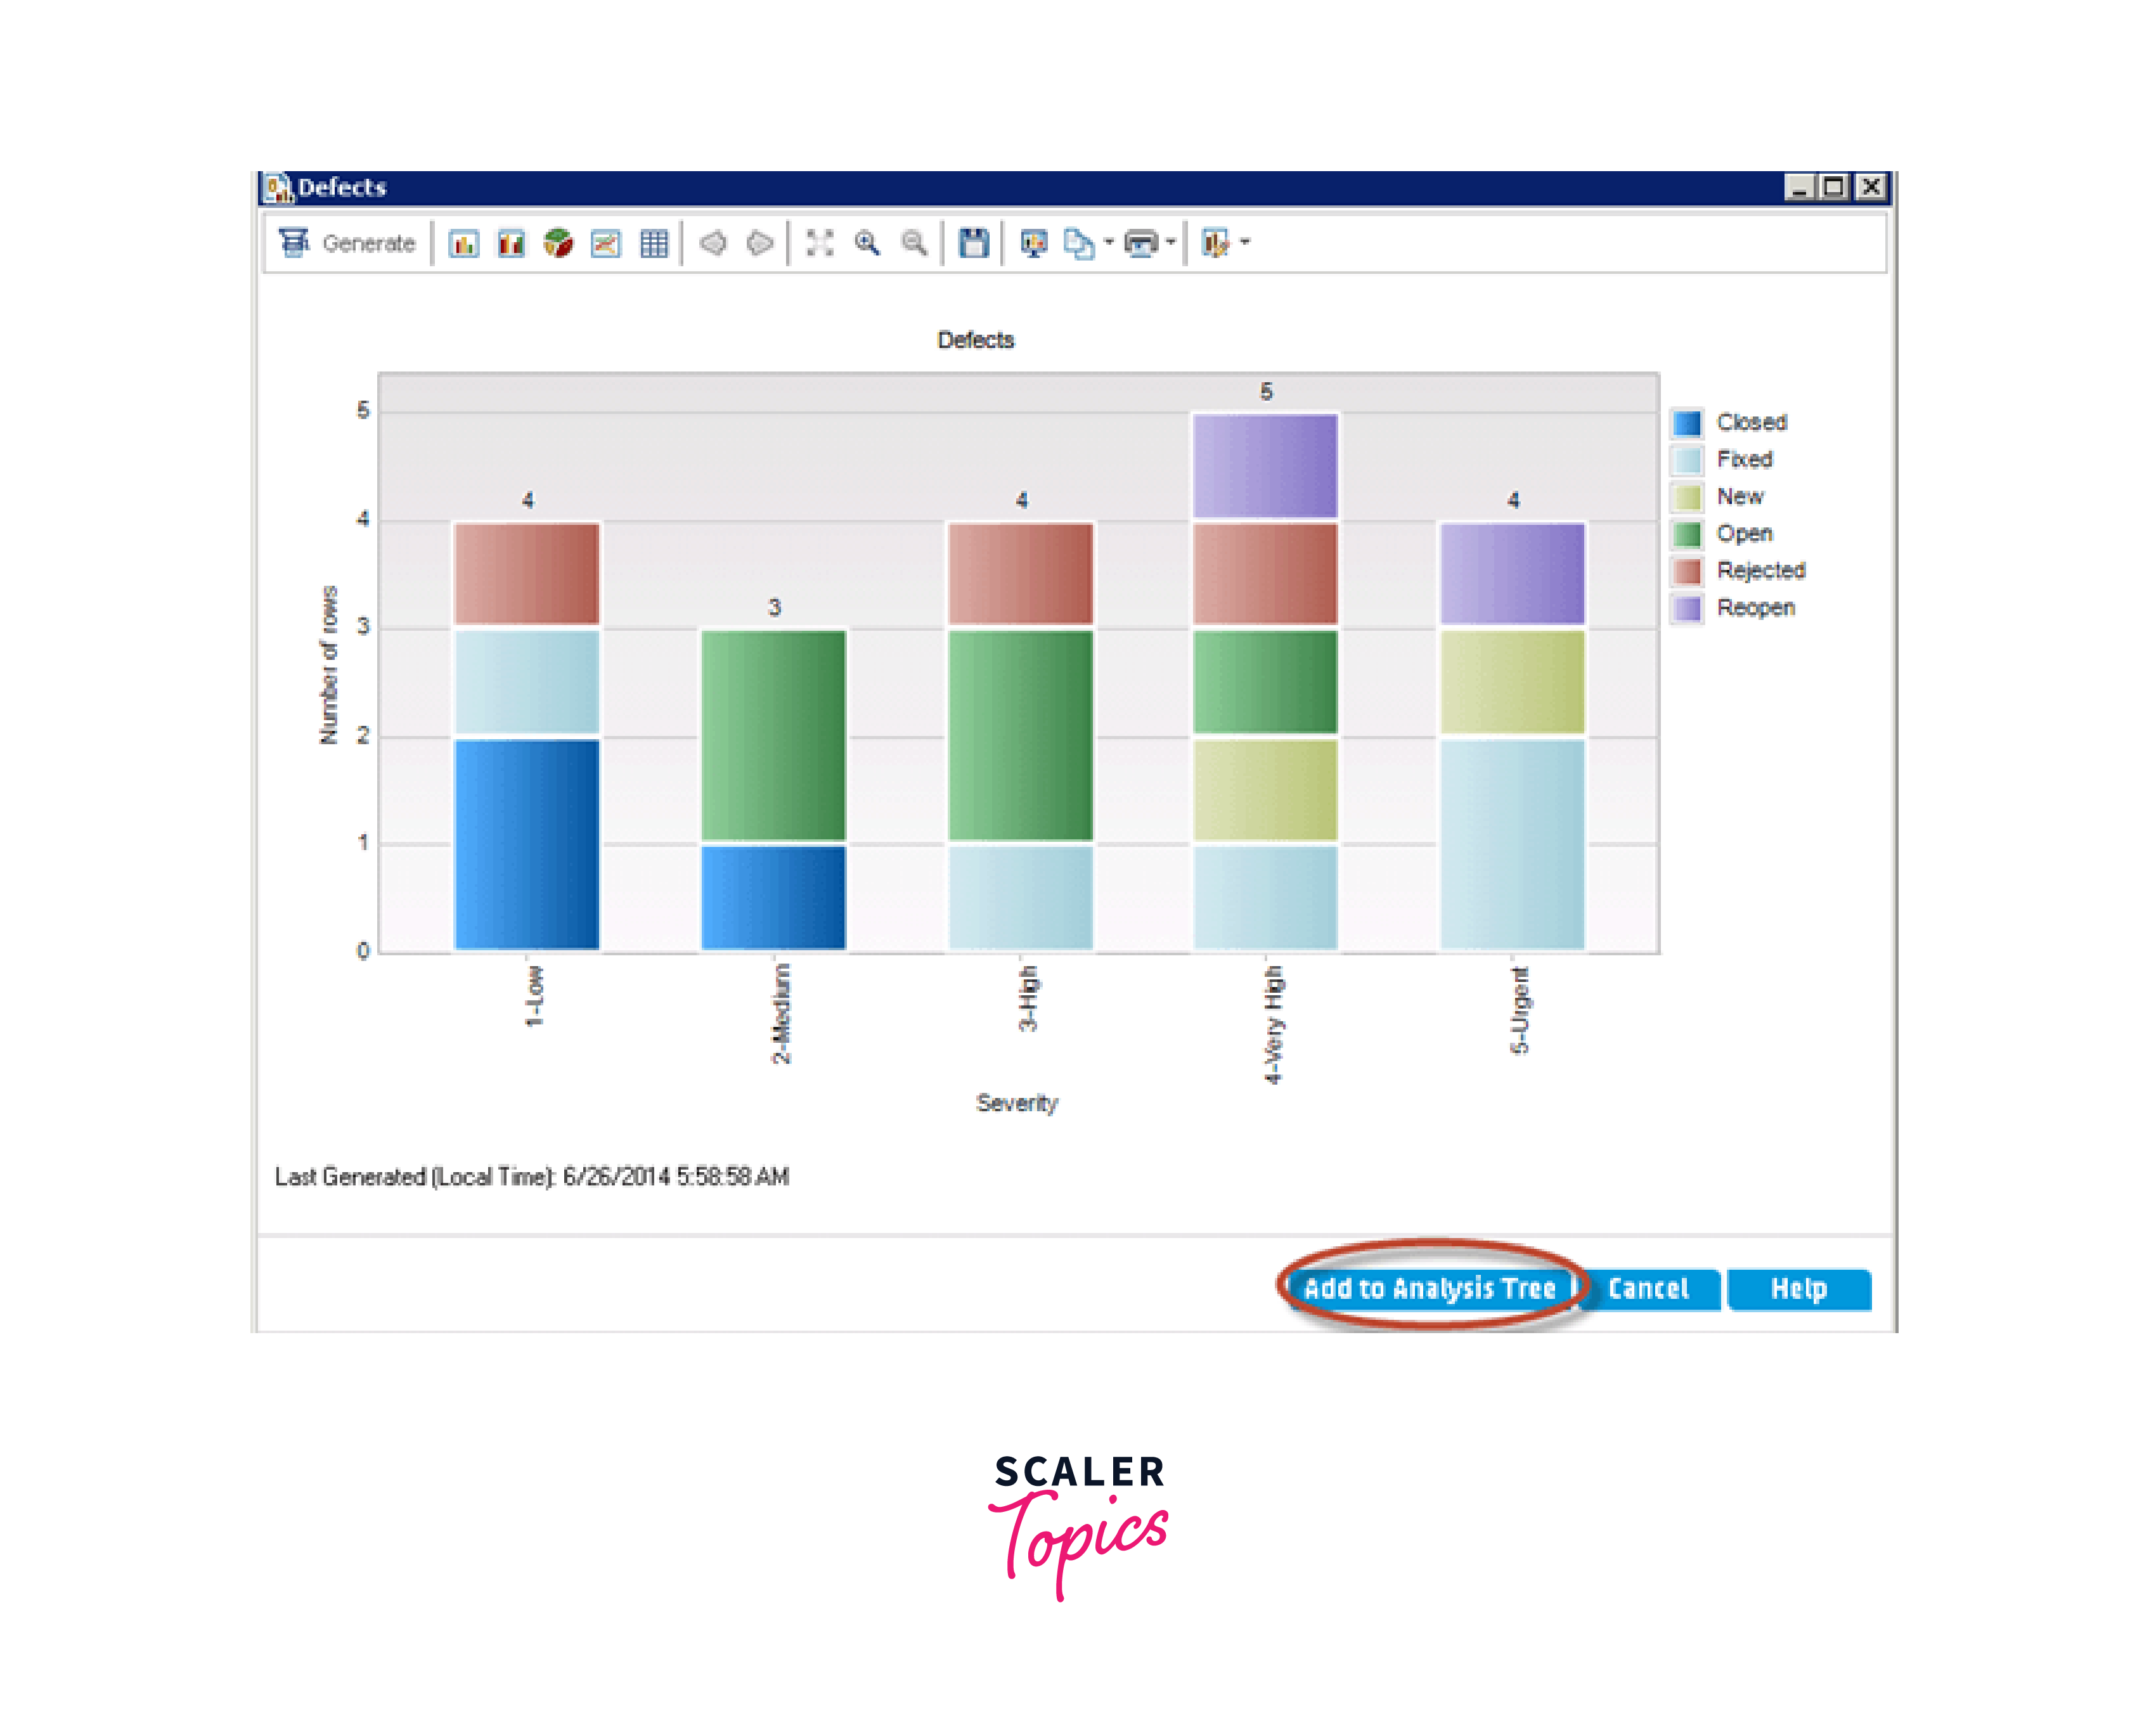
Step 6: Input the requirements for the "X-Axis" and Grouping categories, and then press "Finish" button.

Step 7: Once the criteria is selected, the graph is generated accordingly. Then, click on the option "Add to Analysis Tree".
Step 8: A save window will appear where users can save the created graph.
- Enter a graph name
- Select "Private" or "Public"
- Click "Save".

Step 9: The generated graph is stored in the Analysis tree as shown below.
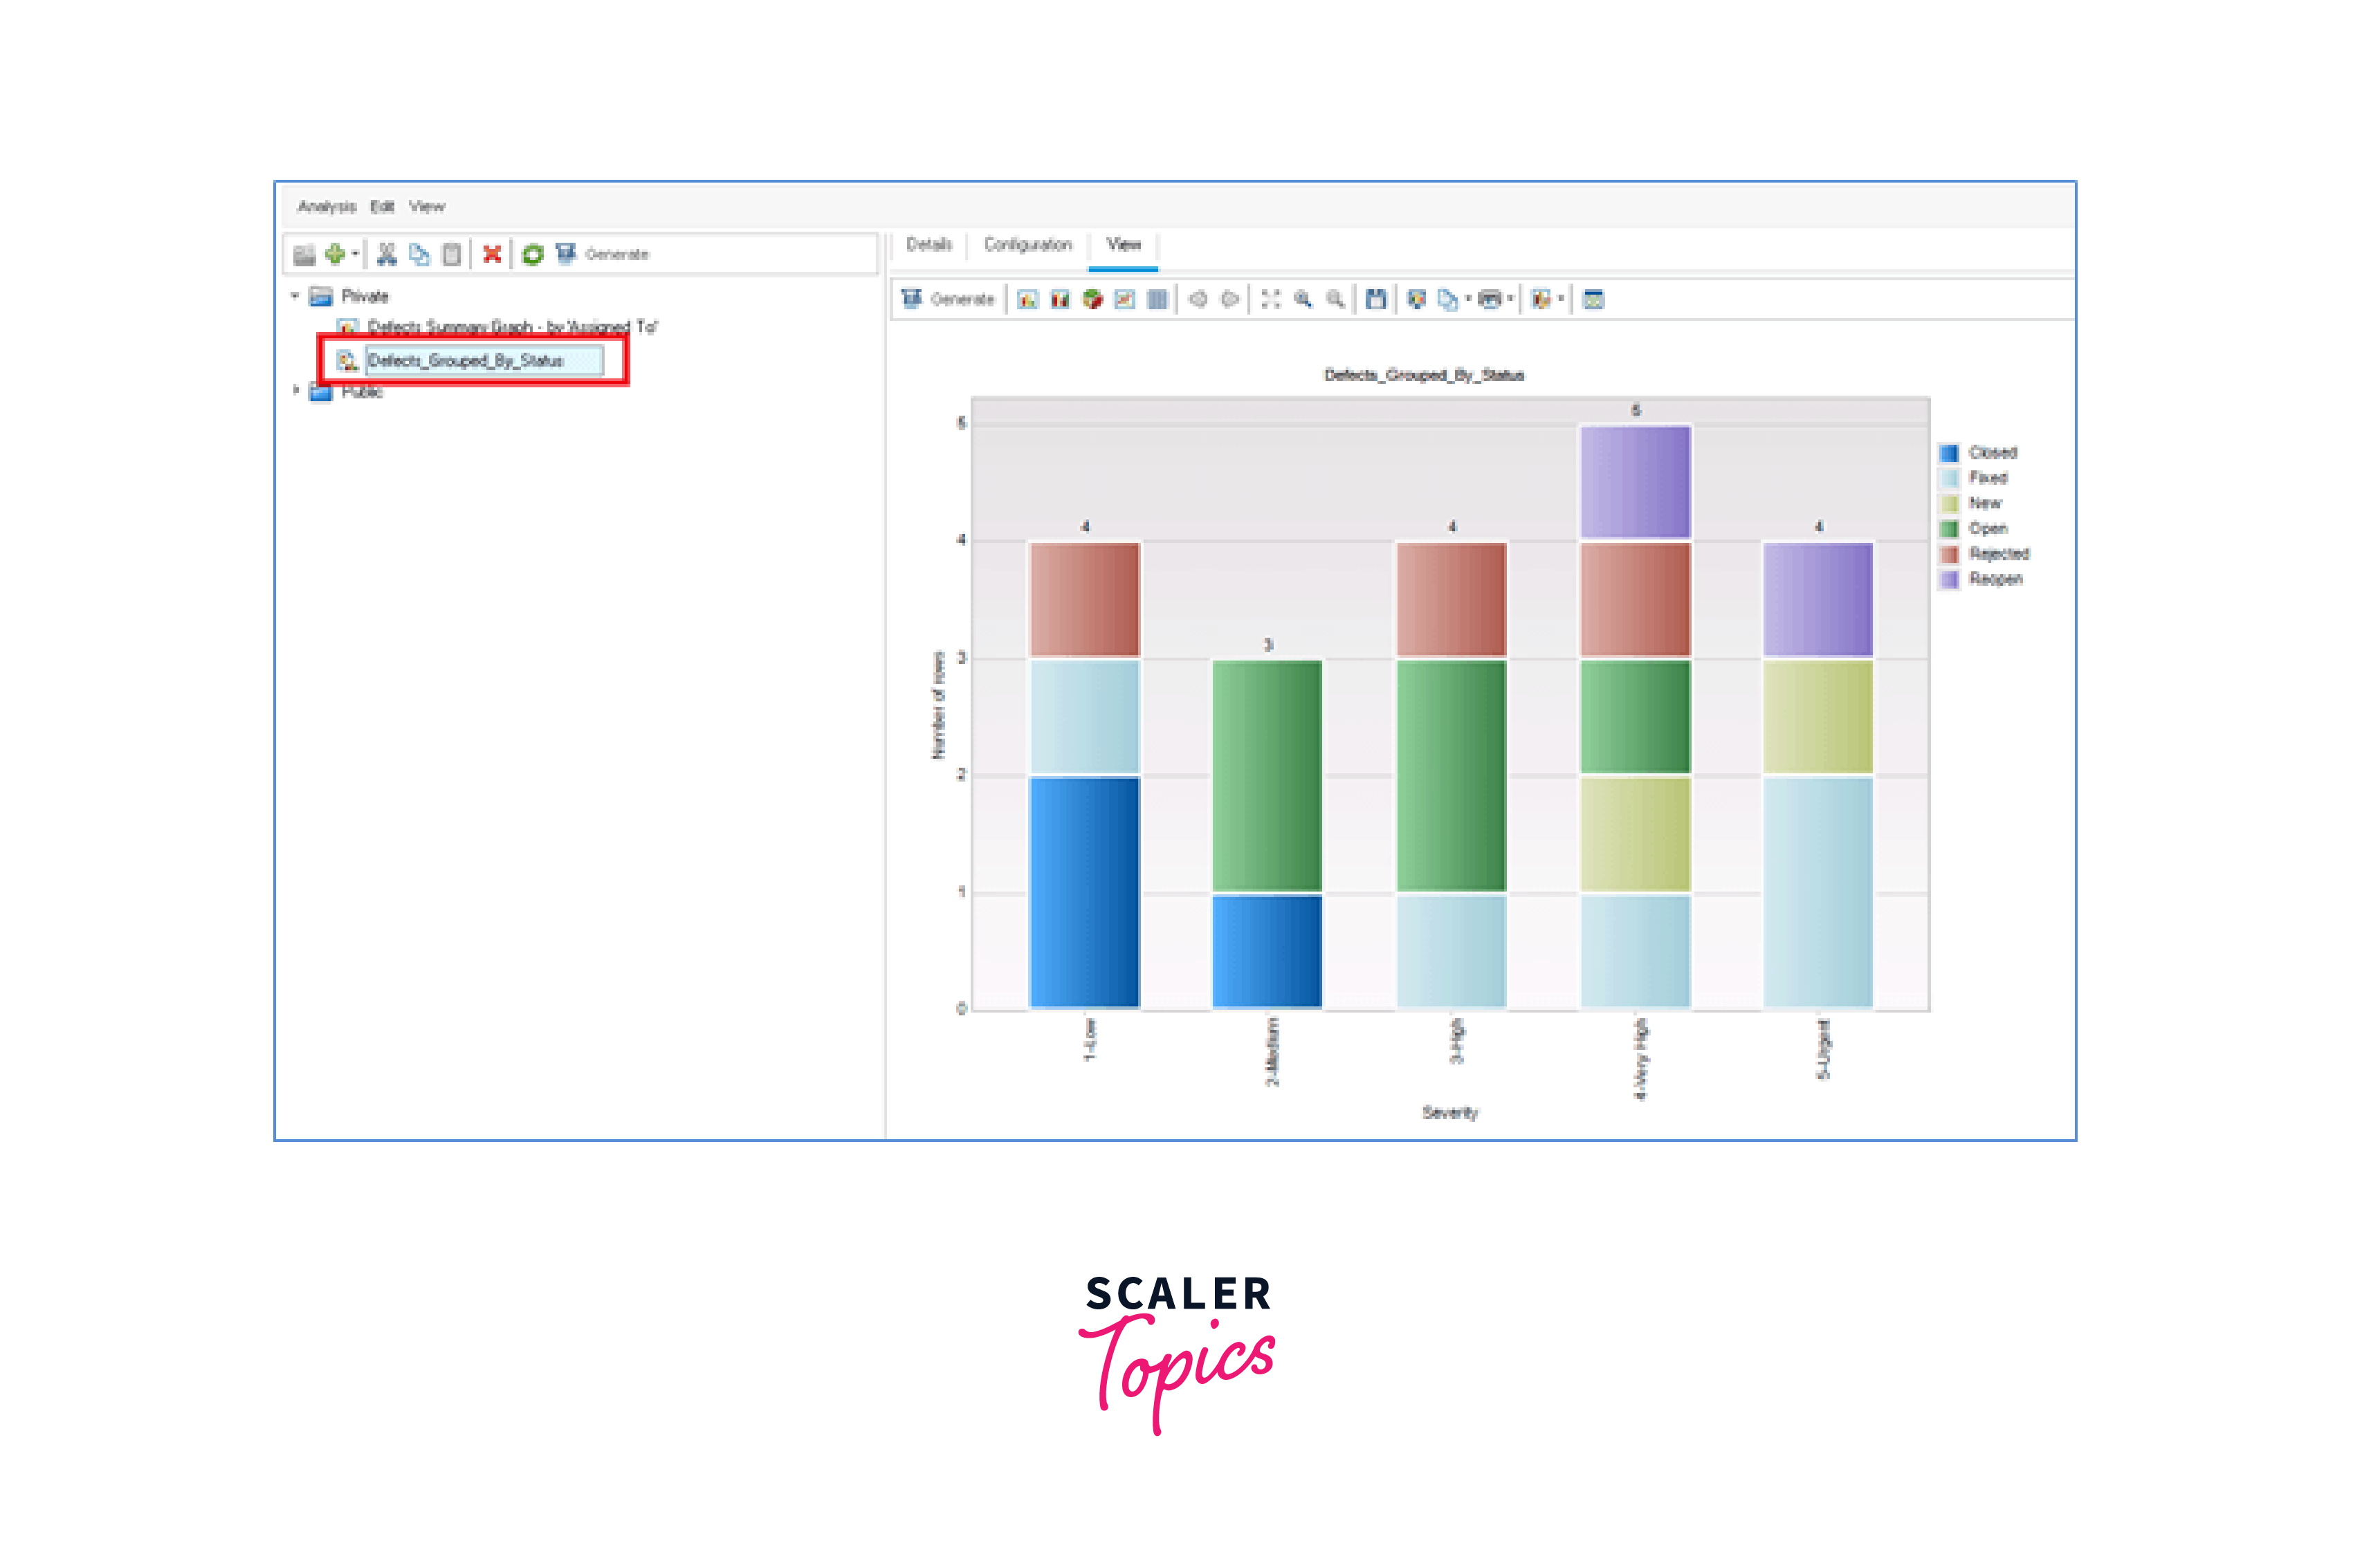
Quick Entity Graphs Generation
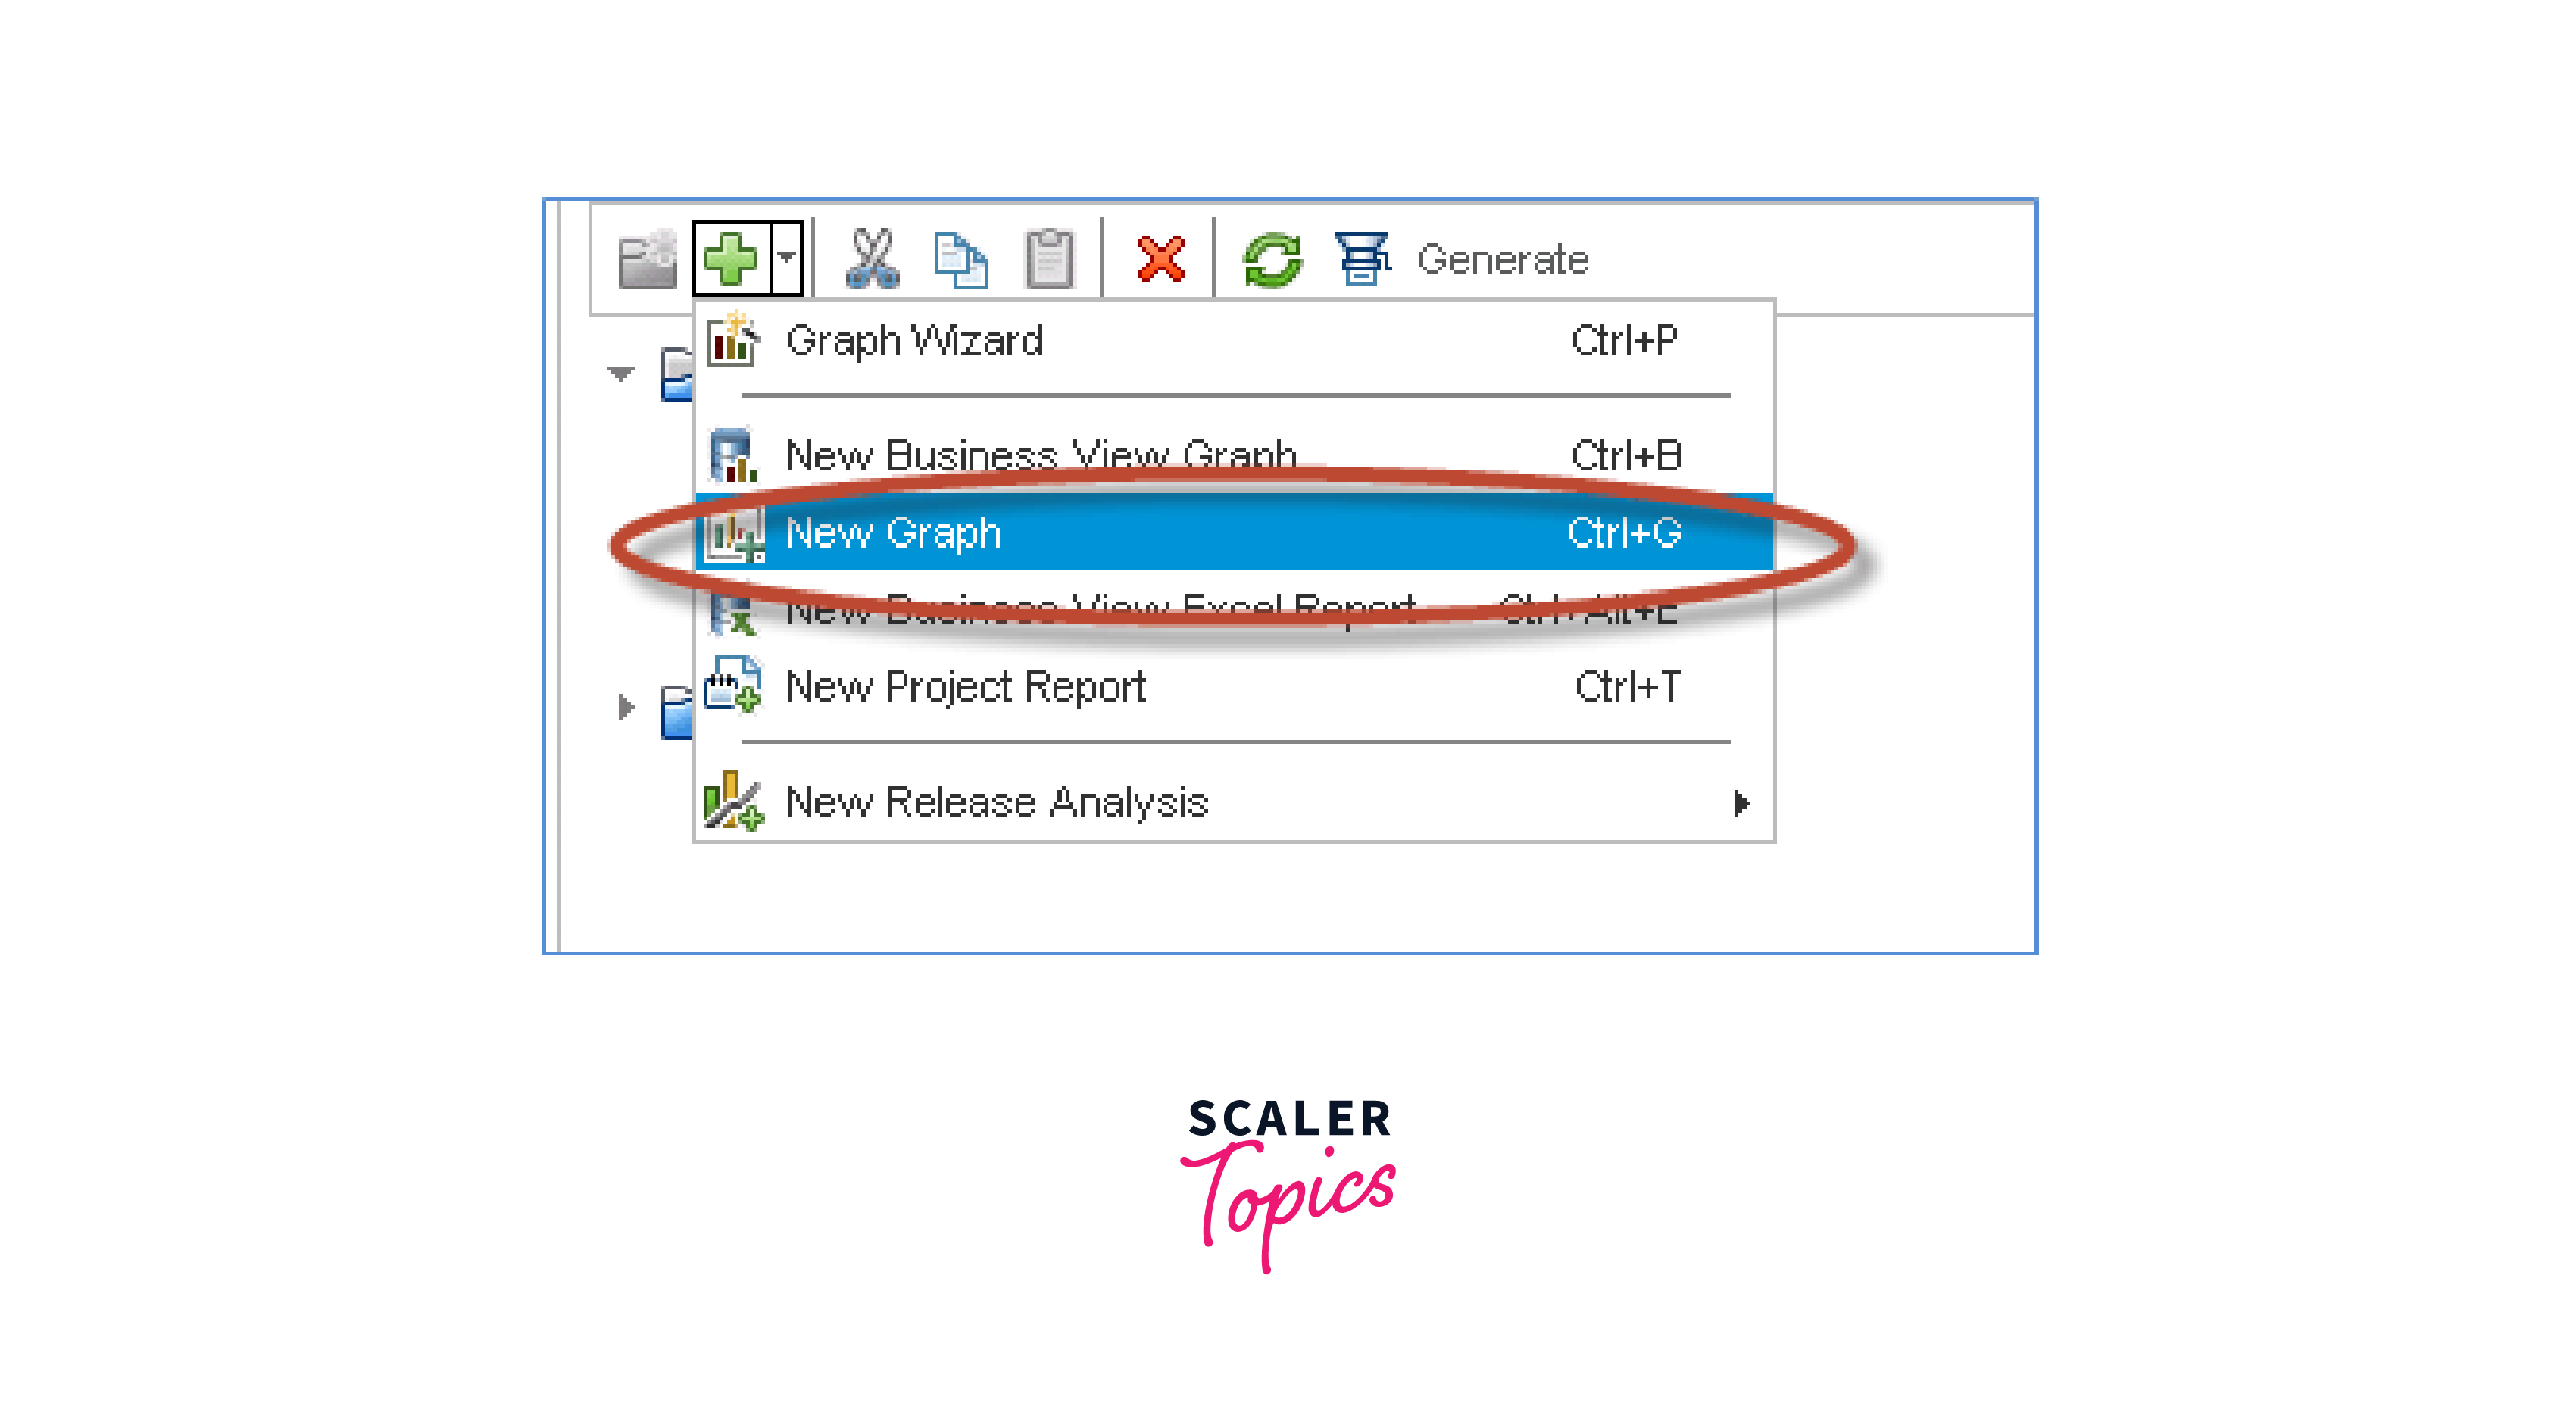
Step 1: It is also possible to generate an entity graph without utilizing the graph wizard. To generate a rapid chart, simply click on the "+" symbol and select "New Graph".
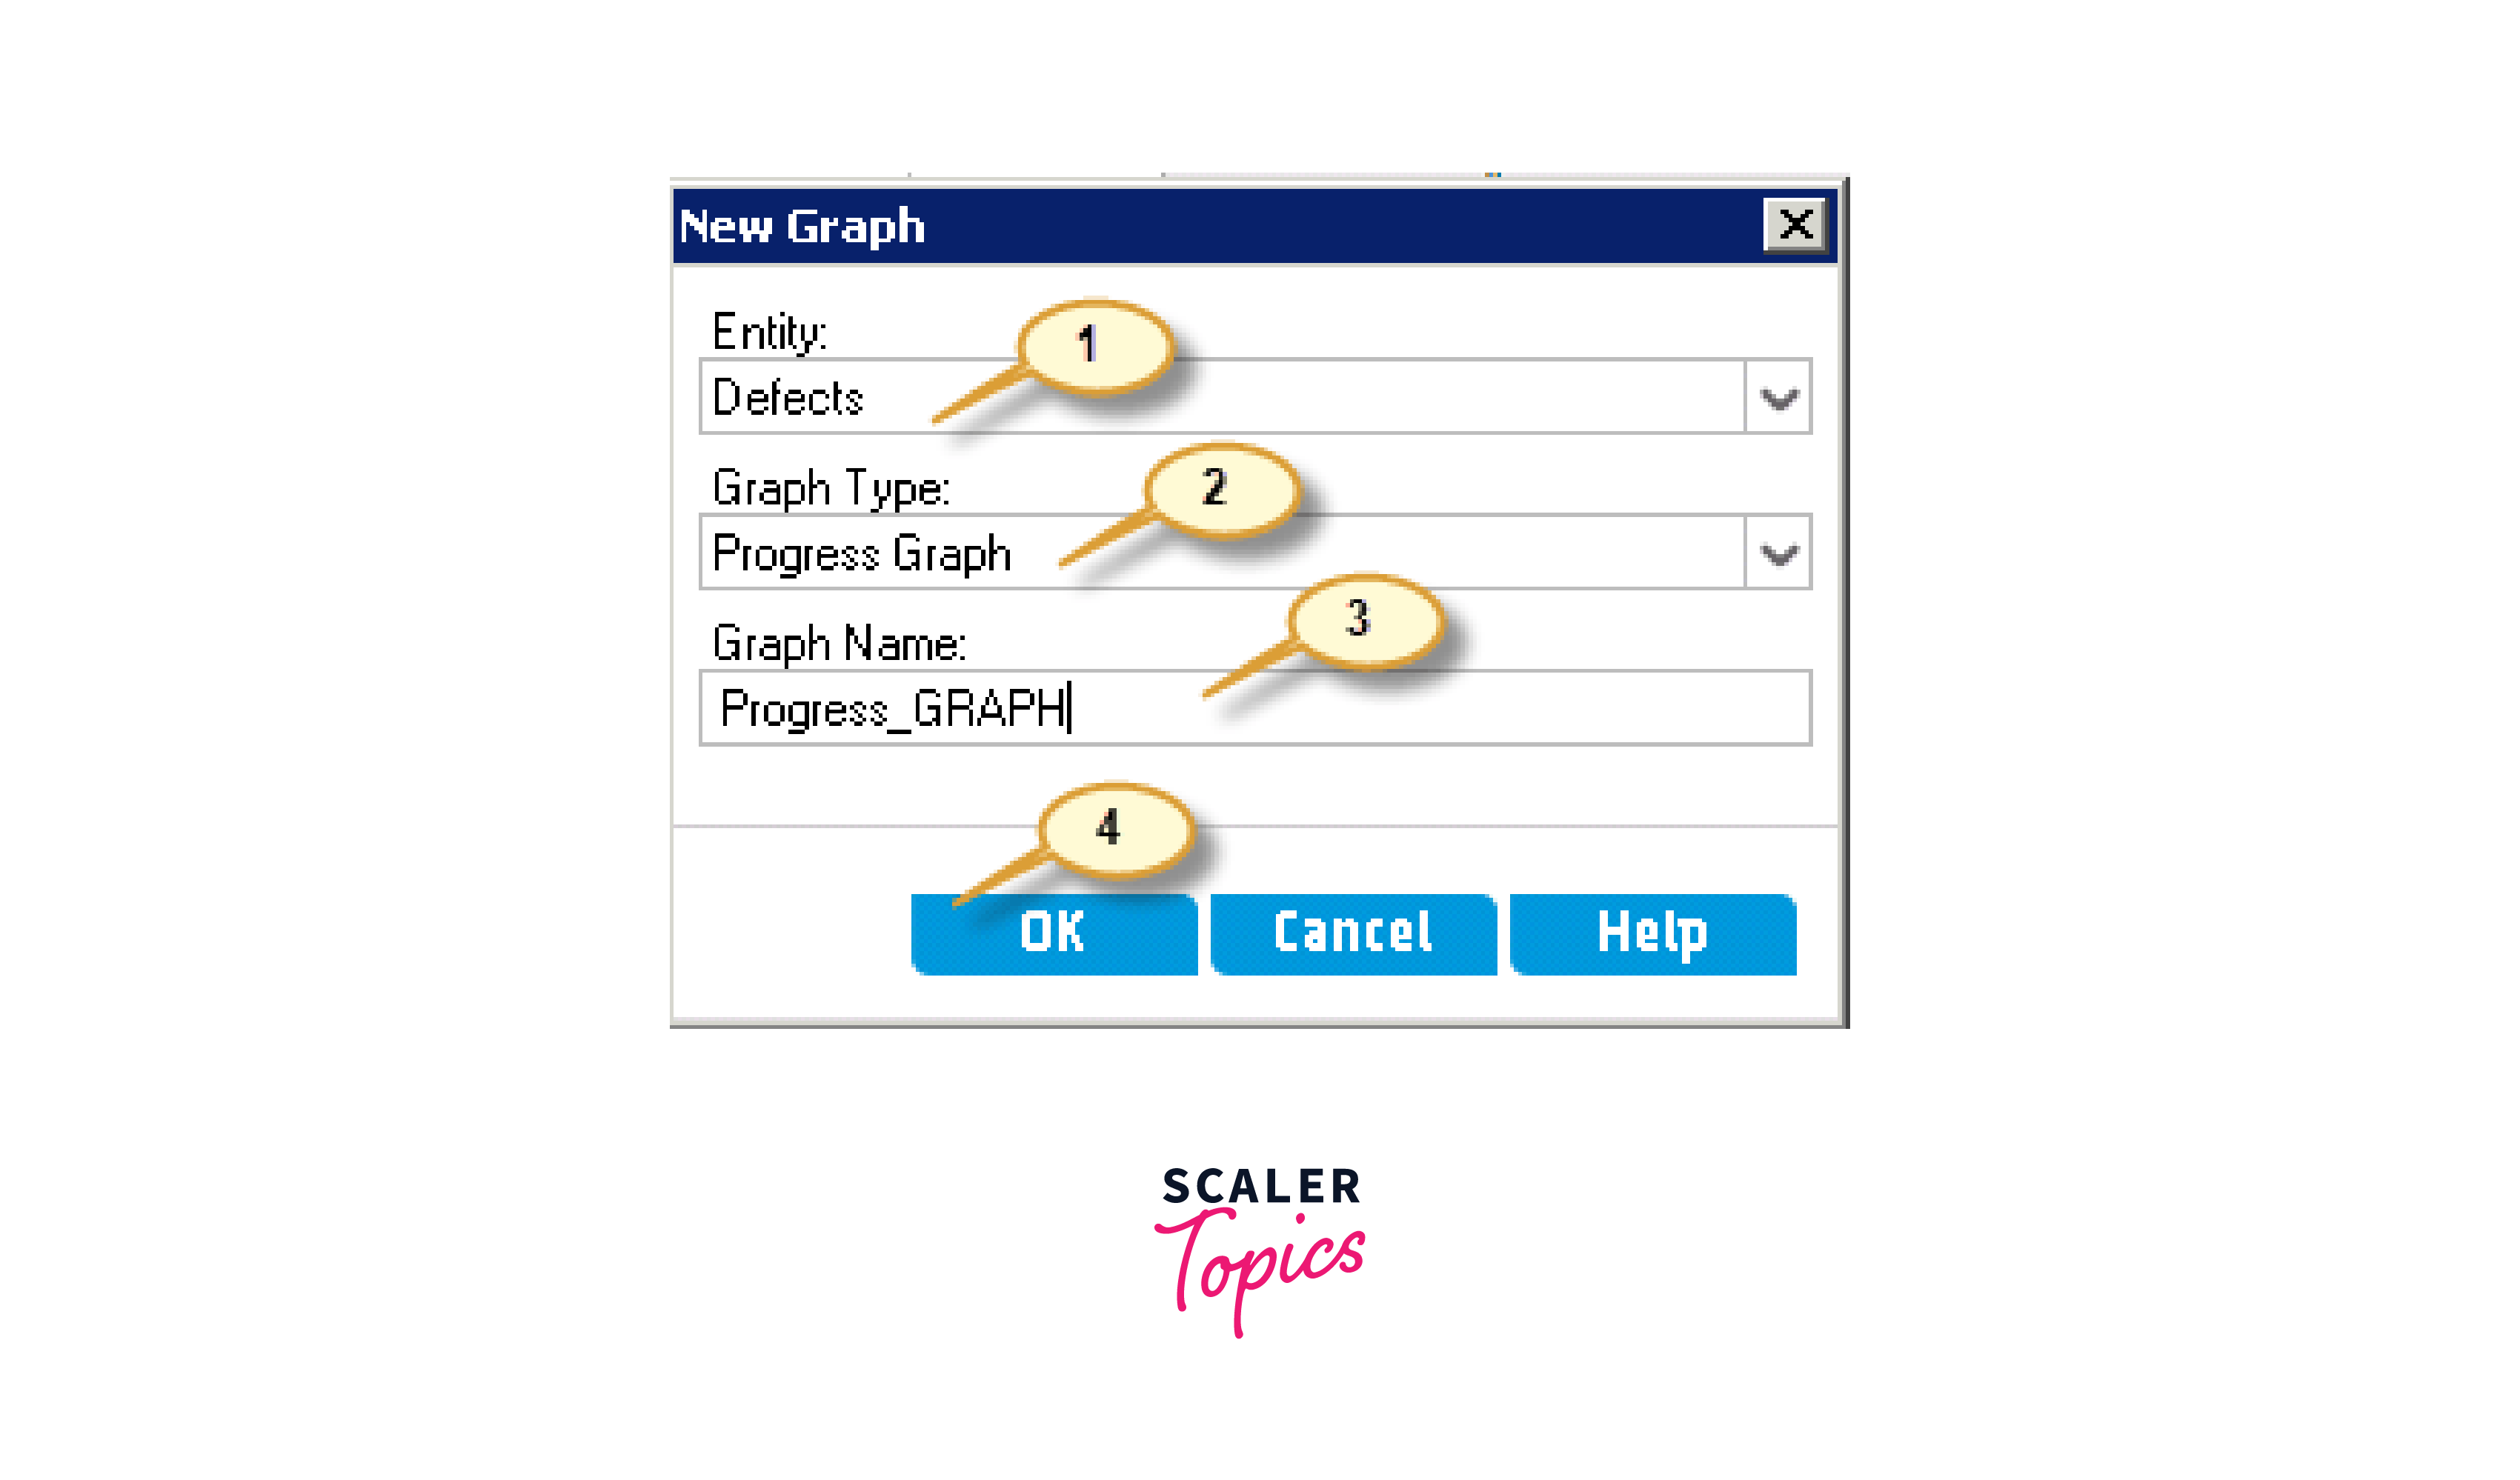
Step 2: The New Graph dialog will appear.
- Select an entity
- Type of graph
- Enter Graph name
- Click the OK button.
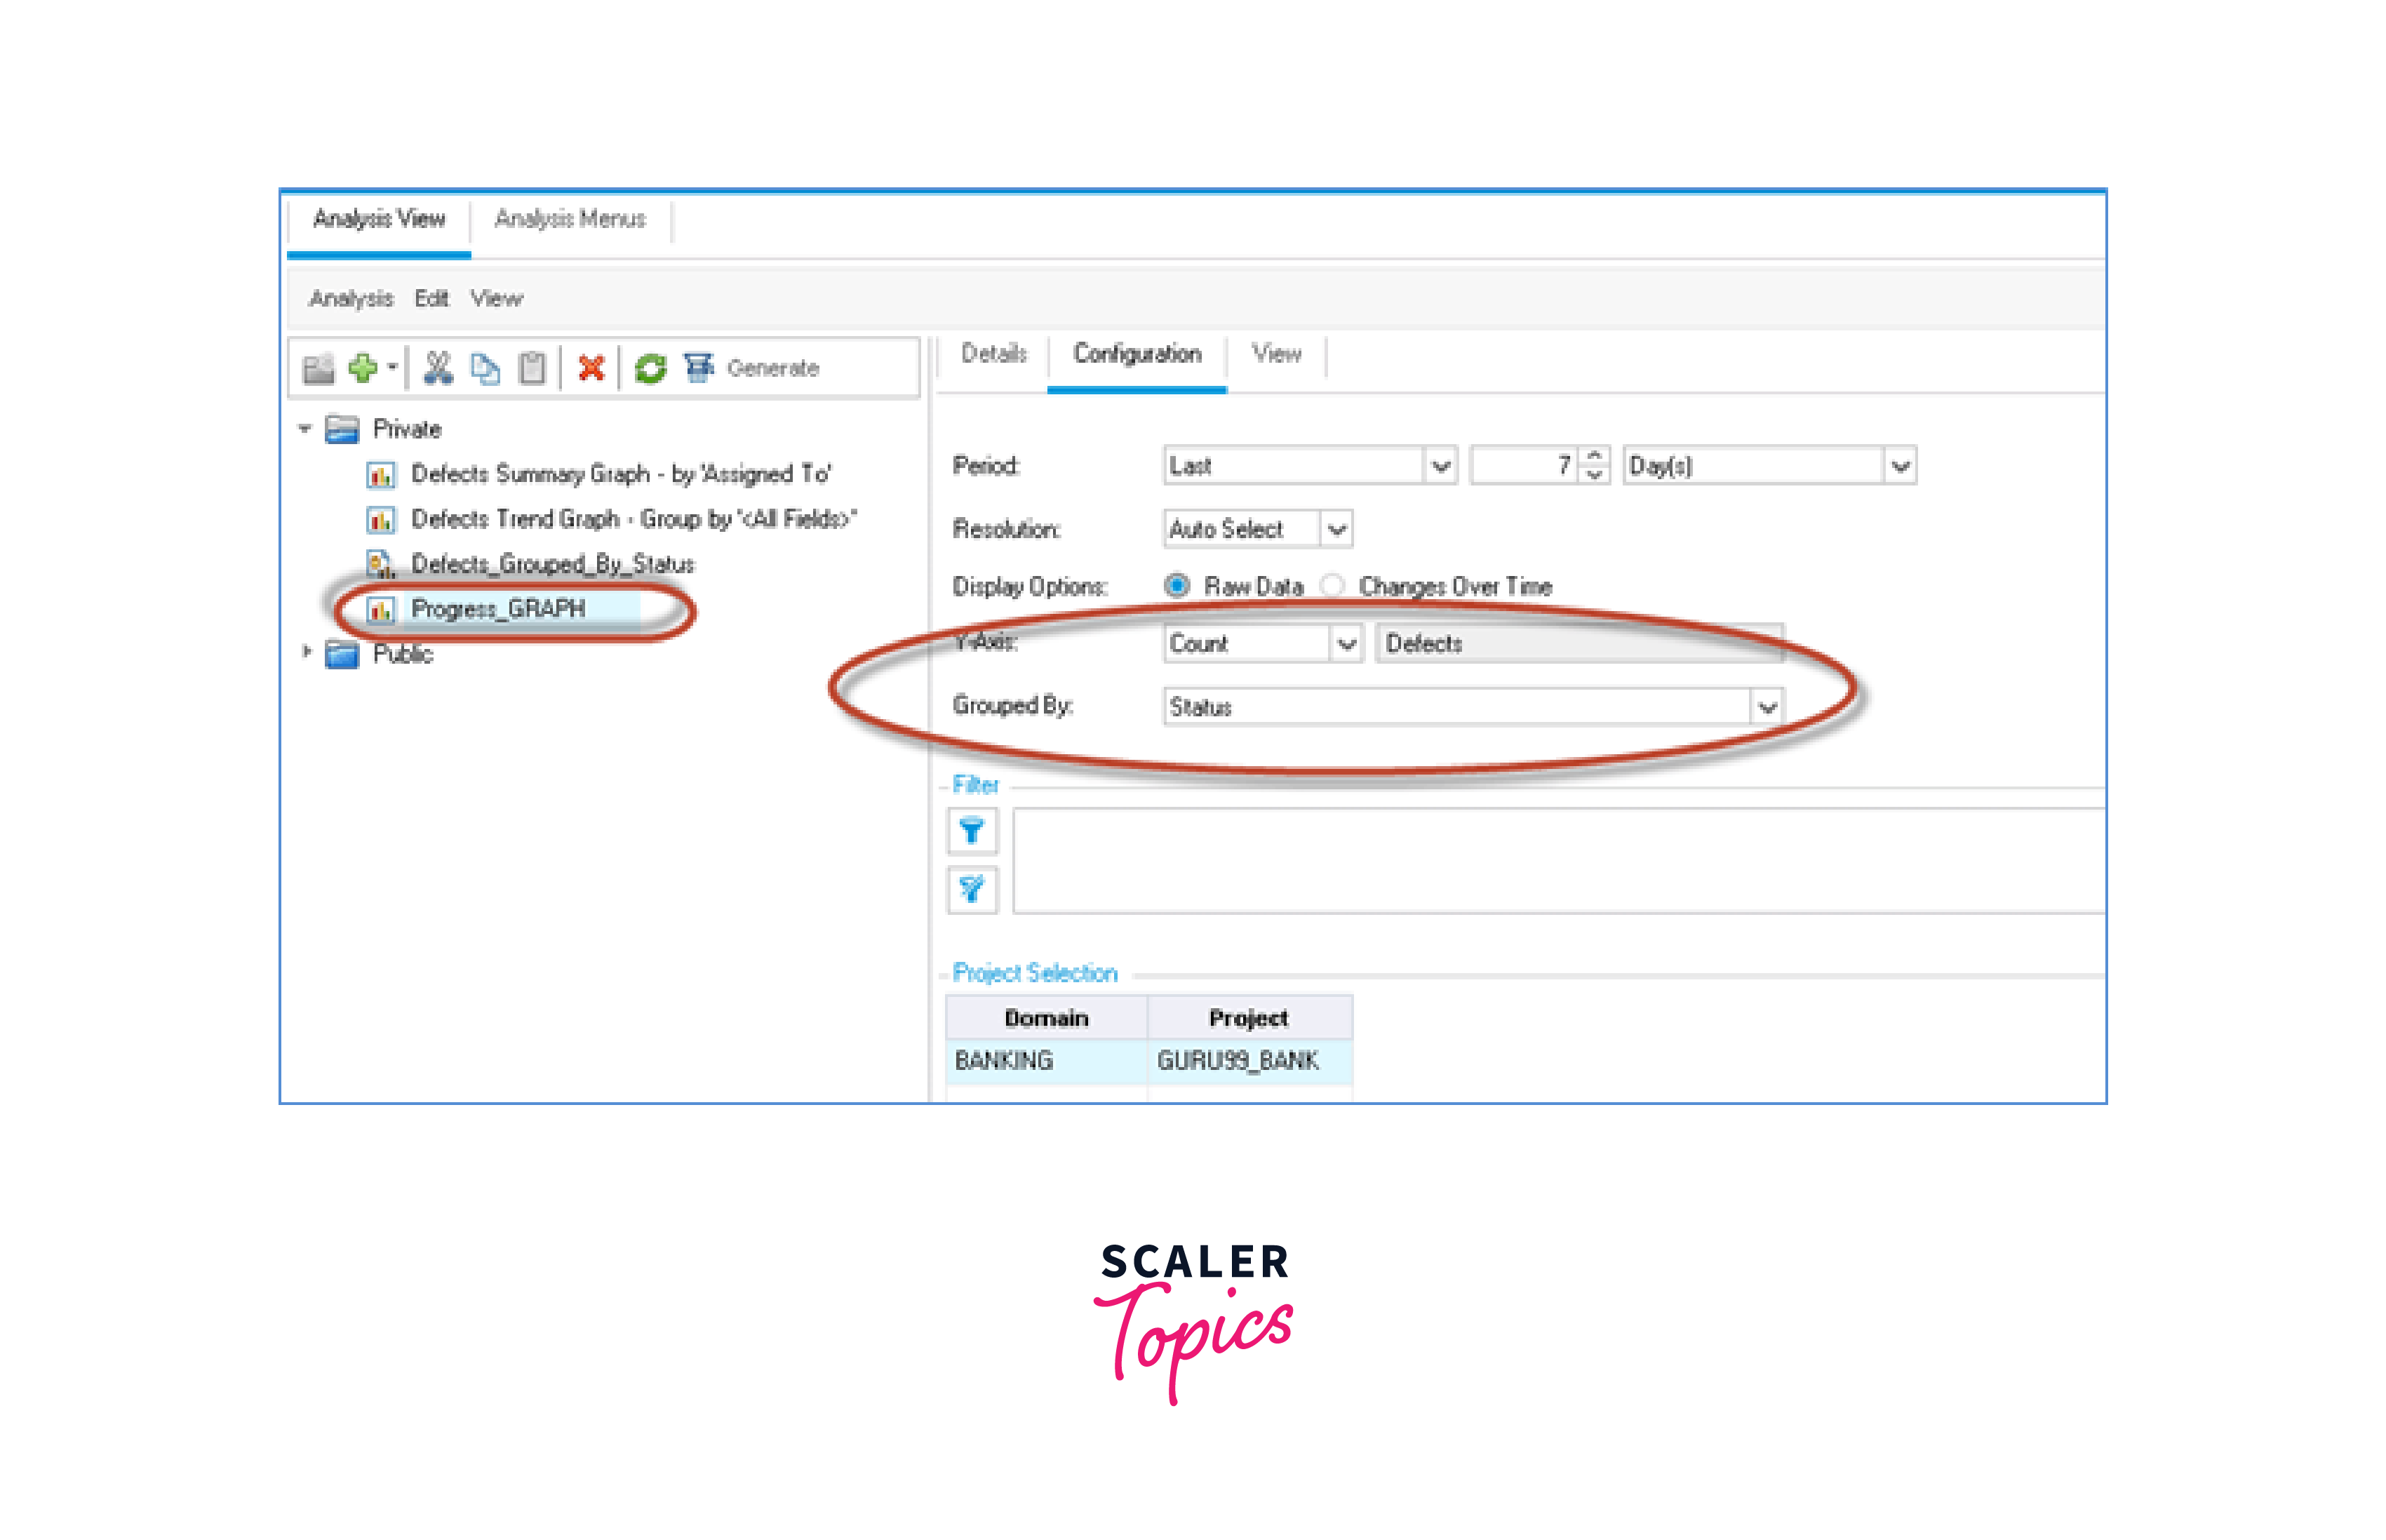
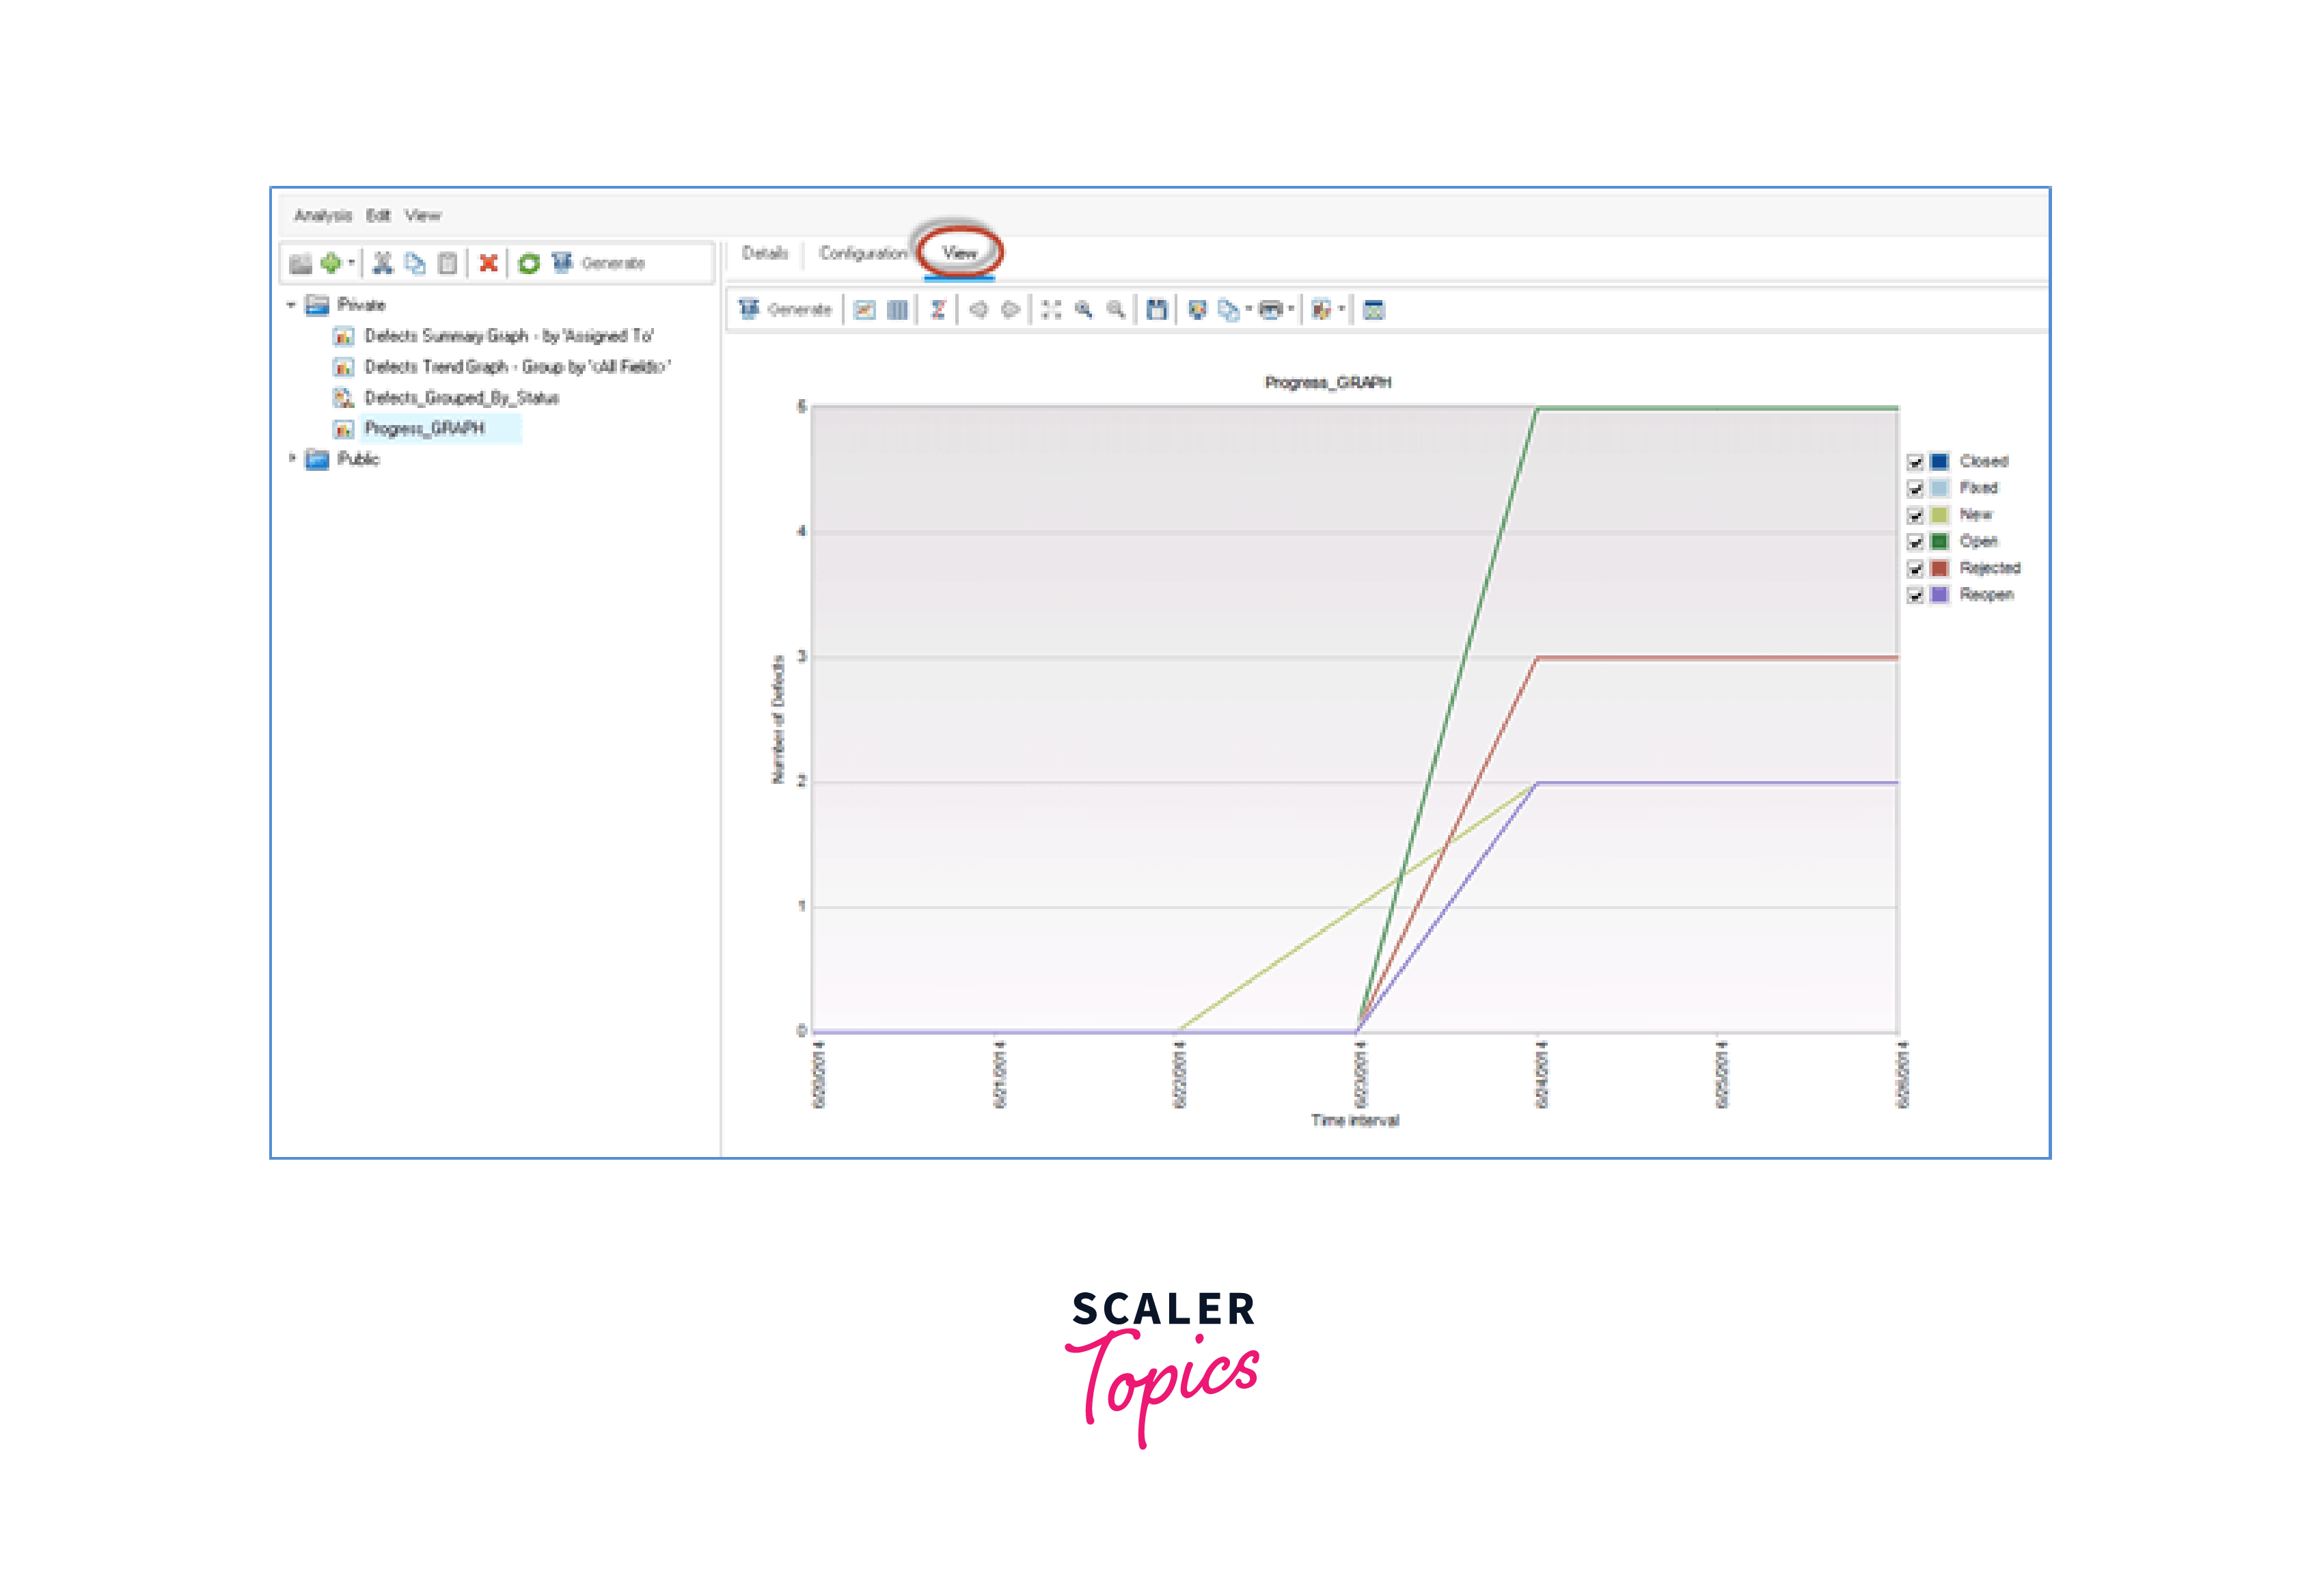
Step 3: Using the generated graph, users can make changes to the configuration according to their needs. We selected the number of defects on the Y-axis and grouped them by "State".
Step 4: Click the "View" tab to create a chart for the specified criteria.
Generating Excel Report
Generating Excel reports is a common requirement for software development projects, and HP ALM provides a range of powerful tools to help users generate Excel reports.
To generate an Excel report in HP ALM, users can follow these steps:
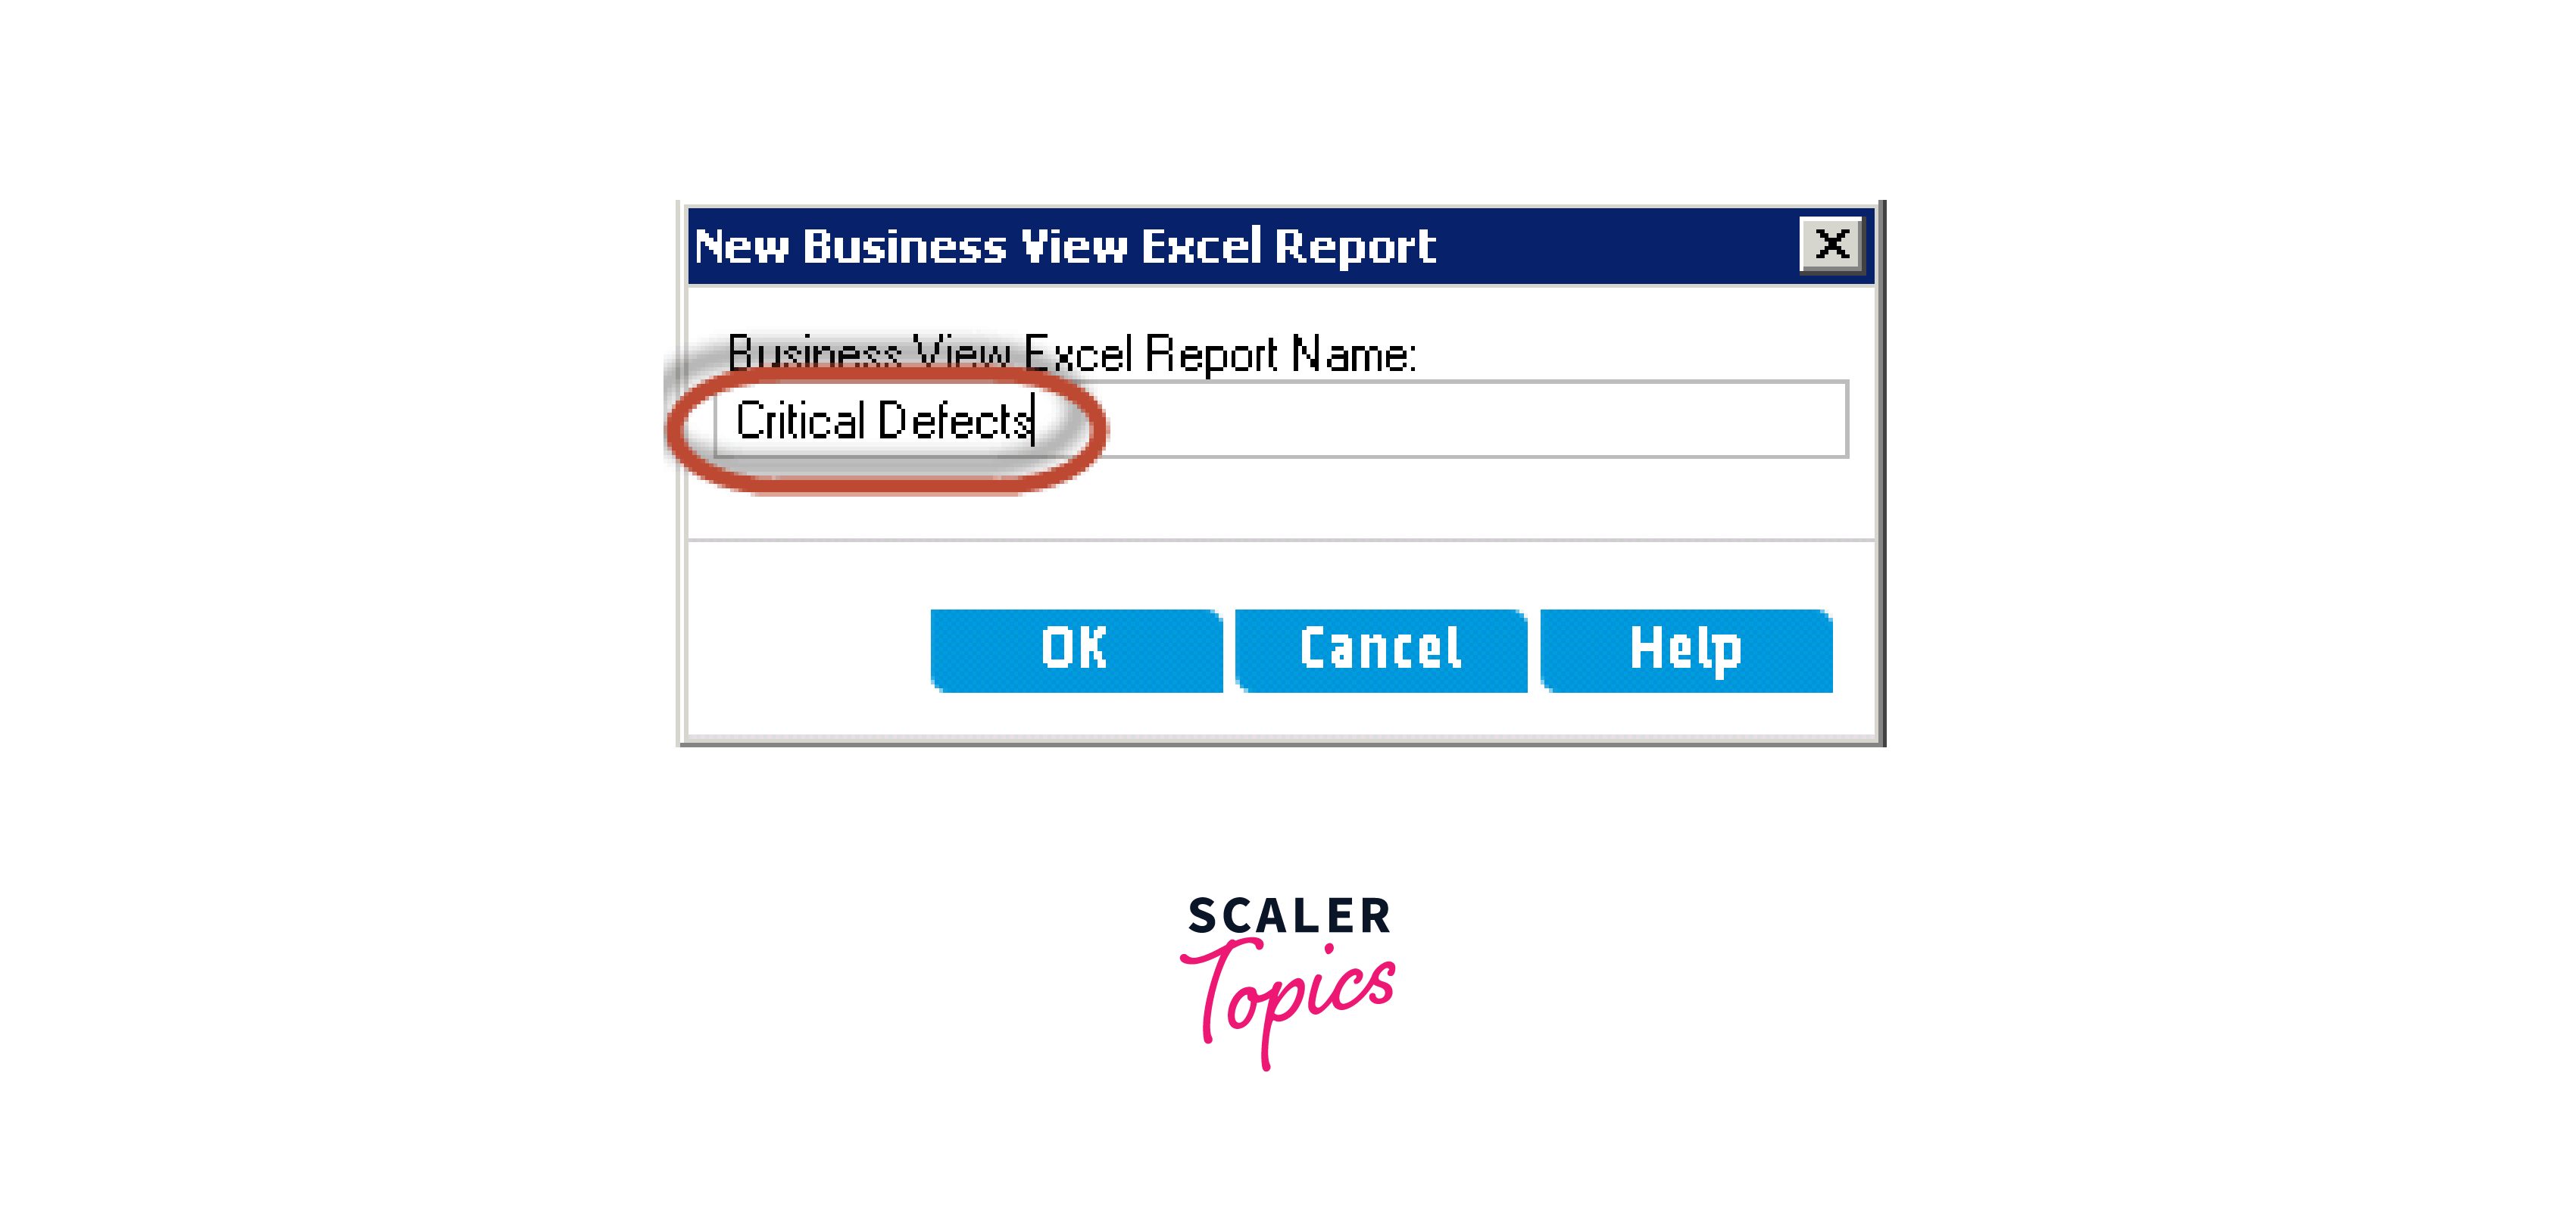
Step 1: Select the option "Add New" and then choose "New Business View Excel Report".

Step 2: Provide a name for the report and proceed by clicking the "OK" button.
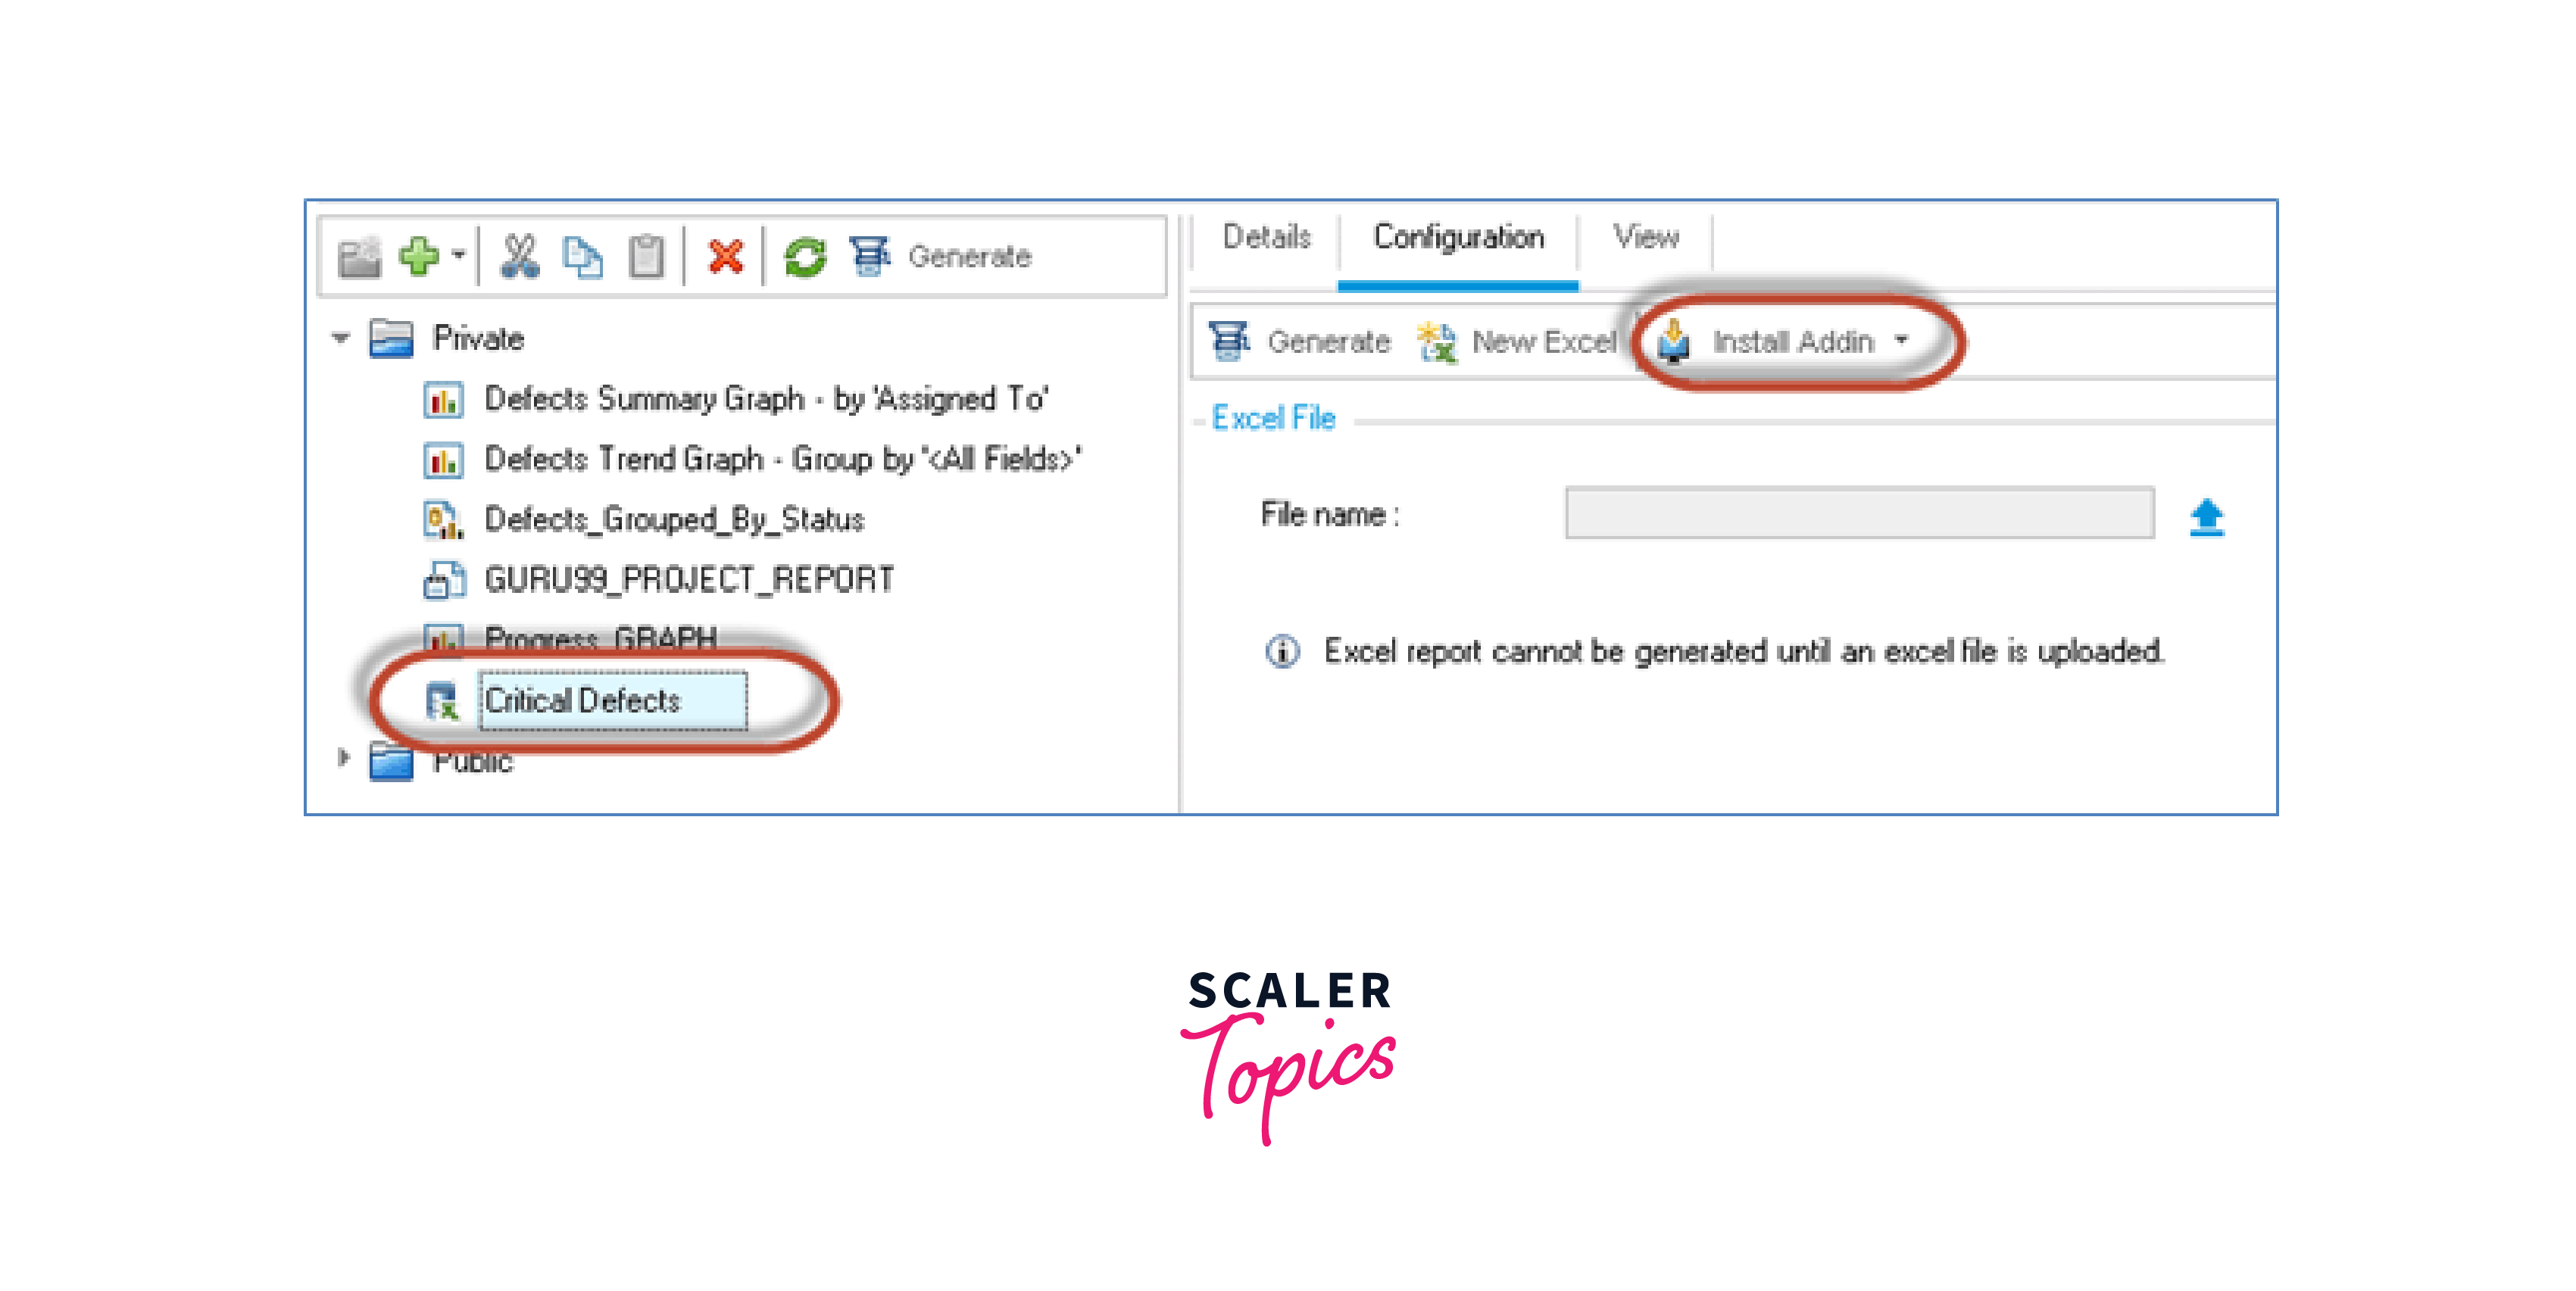
Step 3: Select the option labeled "Install Addin".
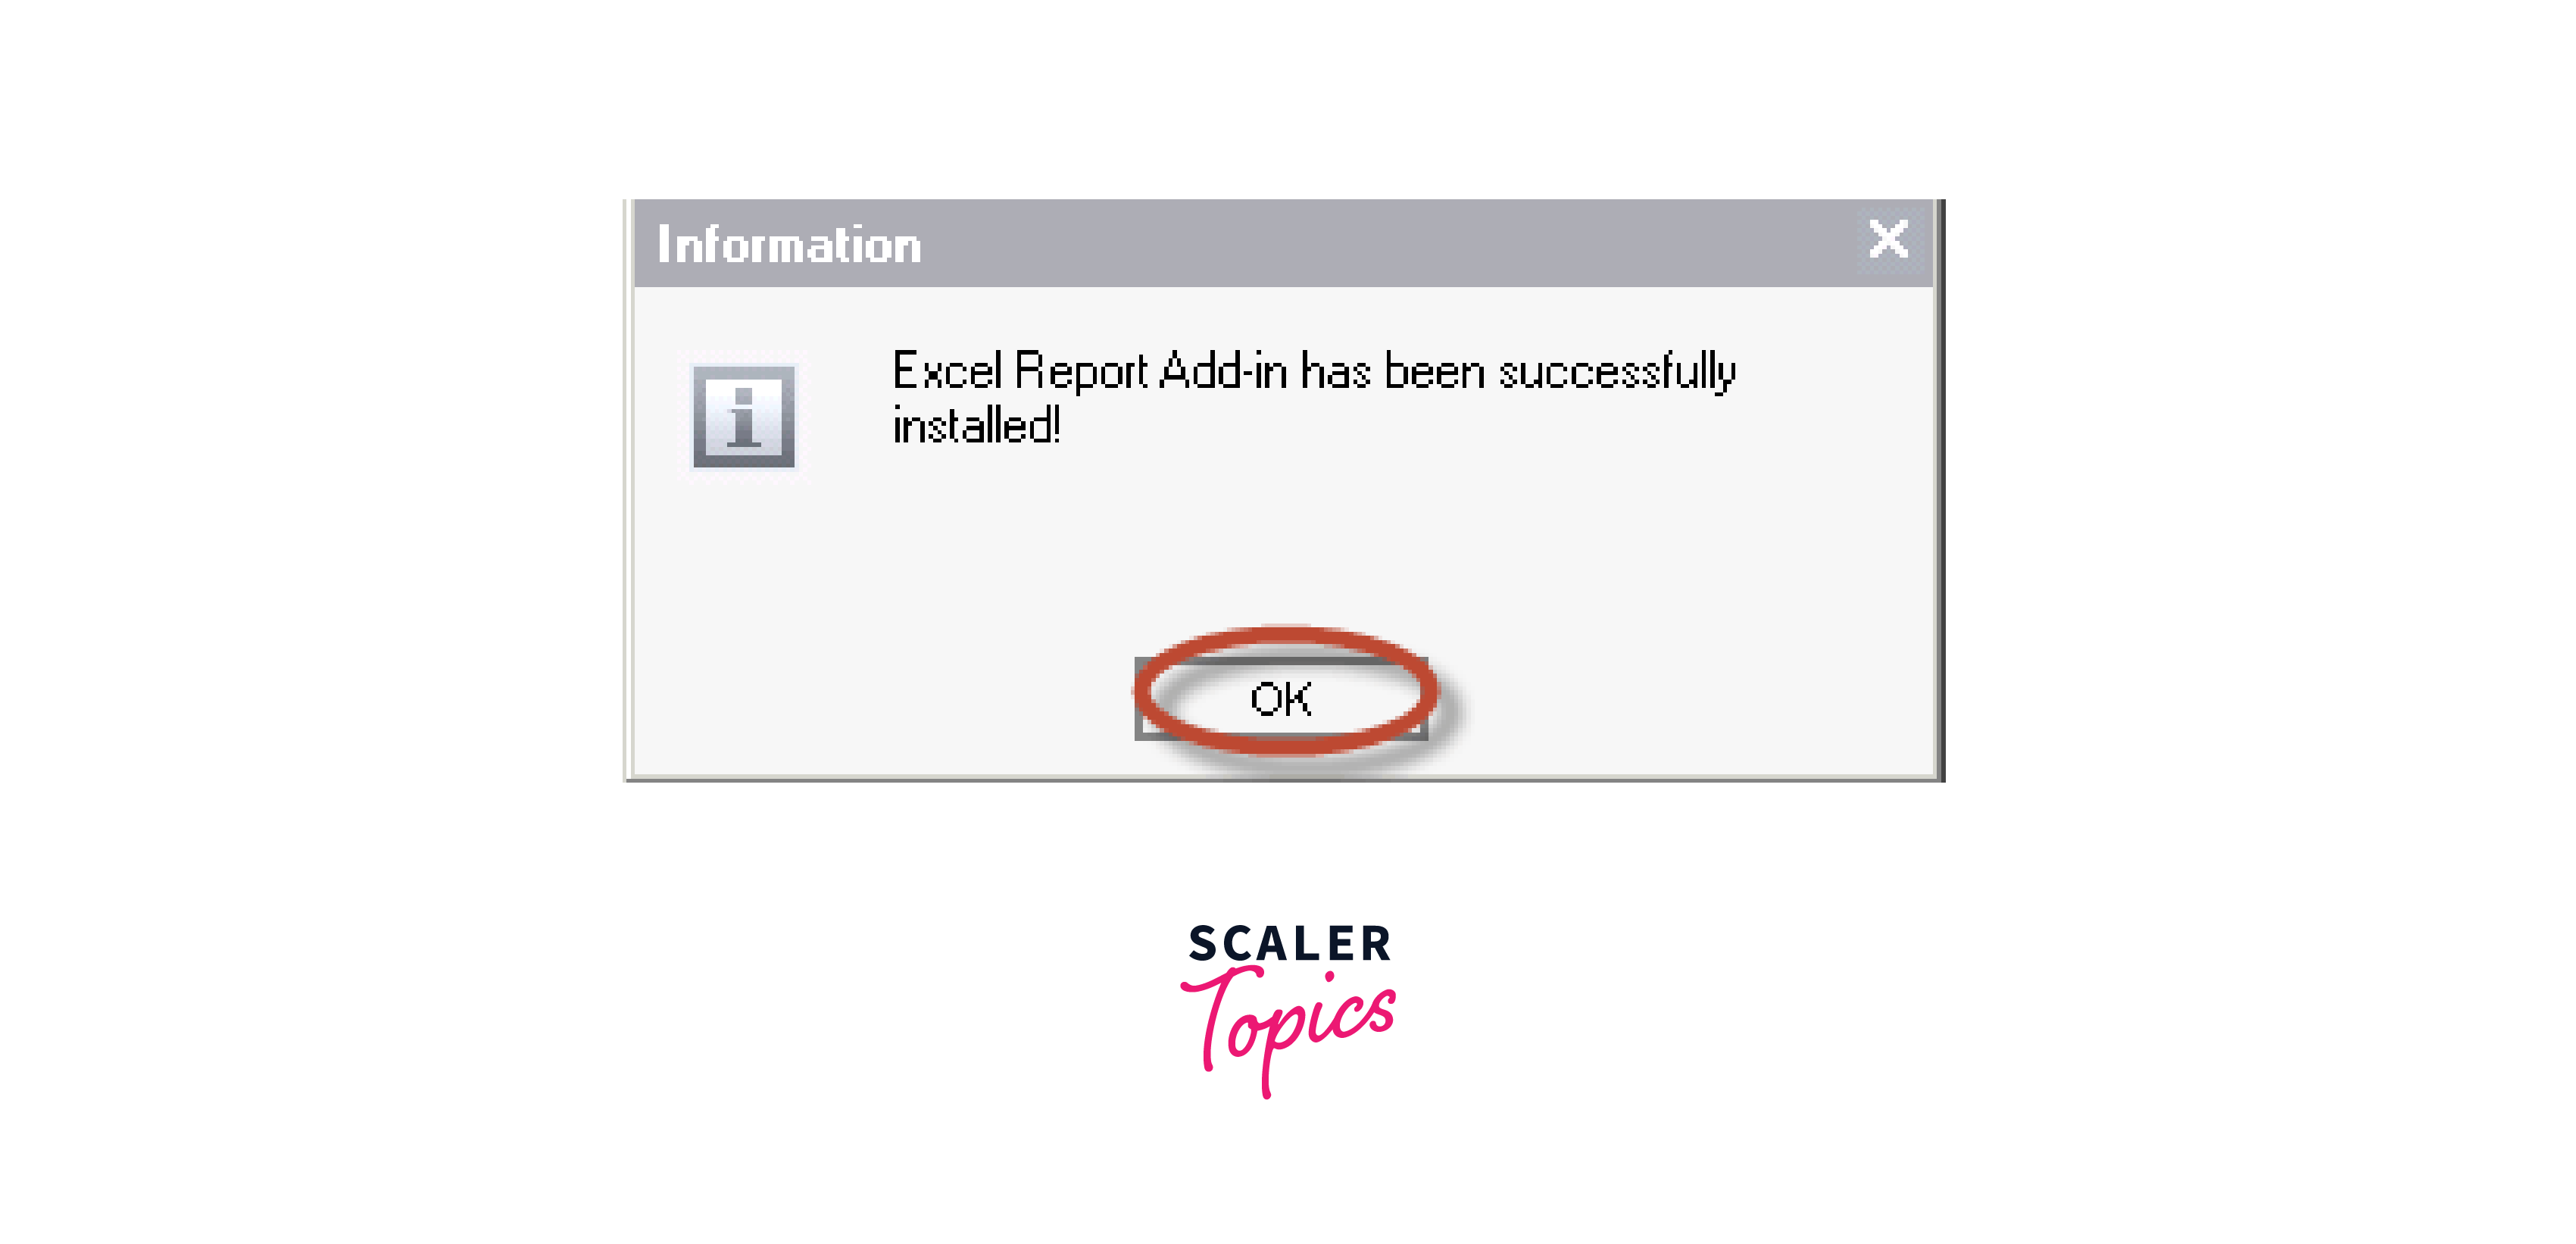
Step 4: The user will be able to view the installation status, as depicted in the image provided below.
Step 5: Launch MS Excel and locate a fresh tab labeled "HP ALM". Choose "HP-ALM" and then hit the "Login" button.
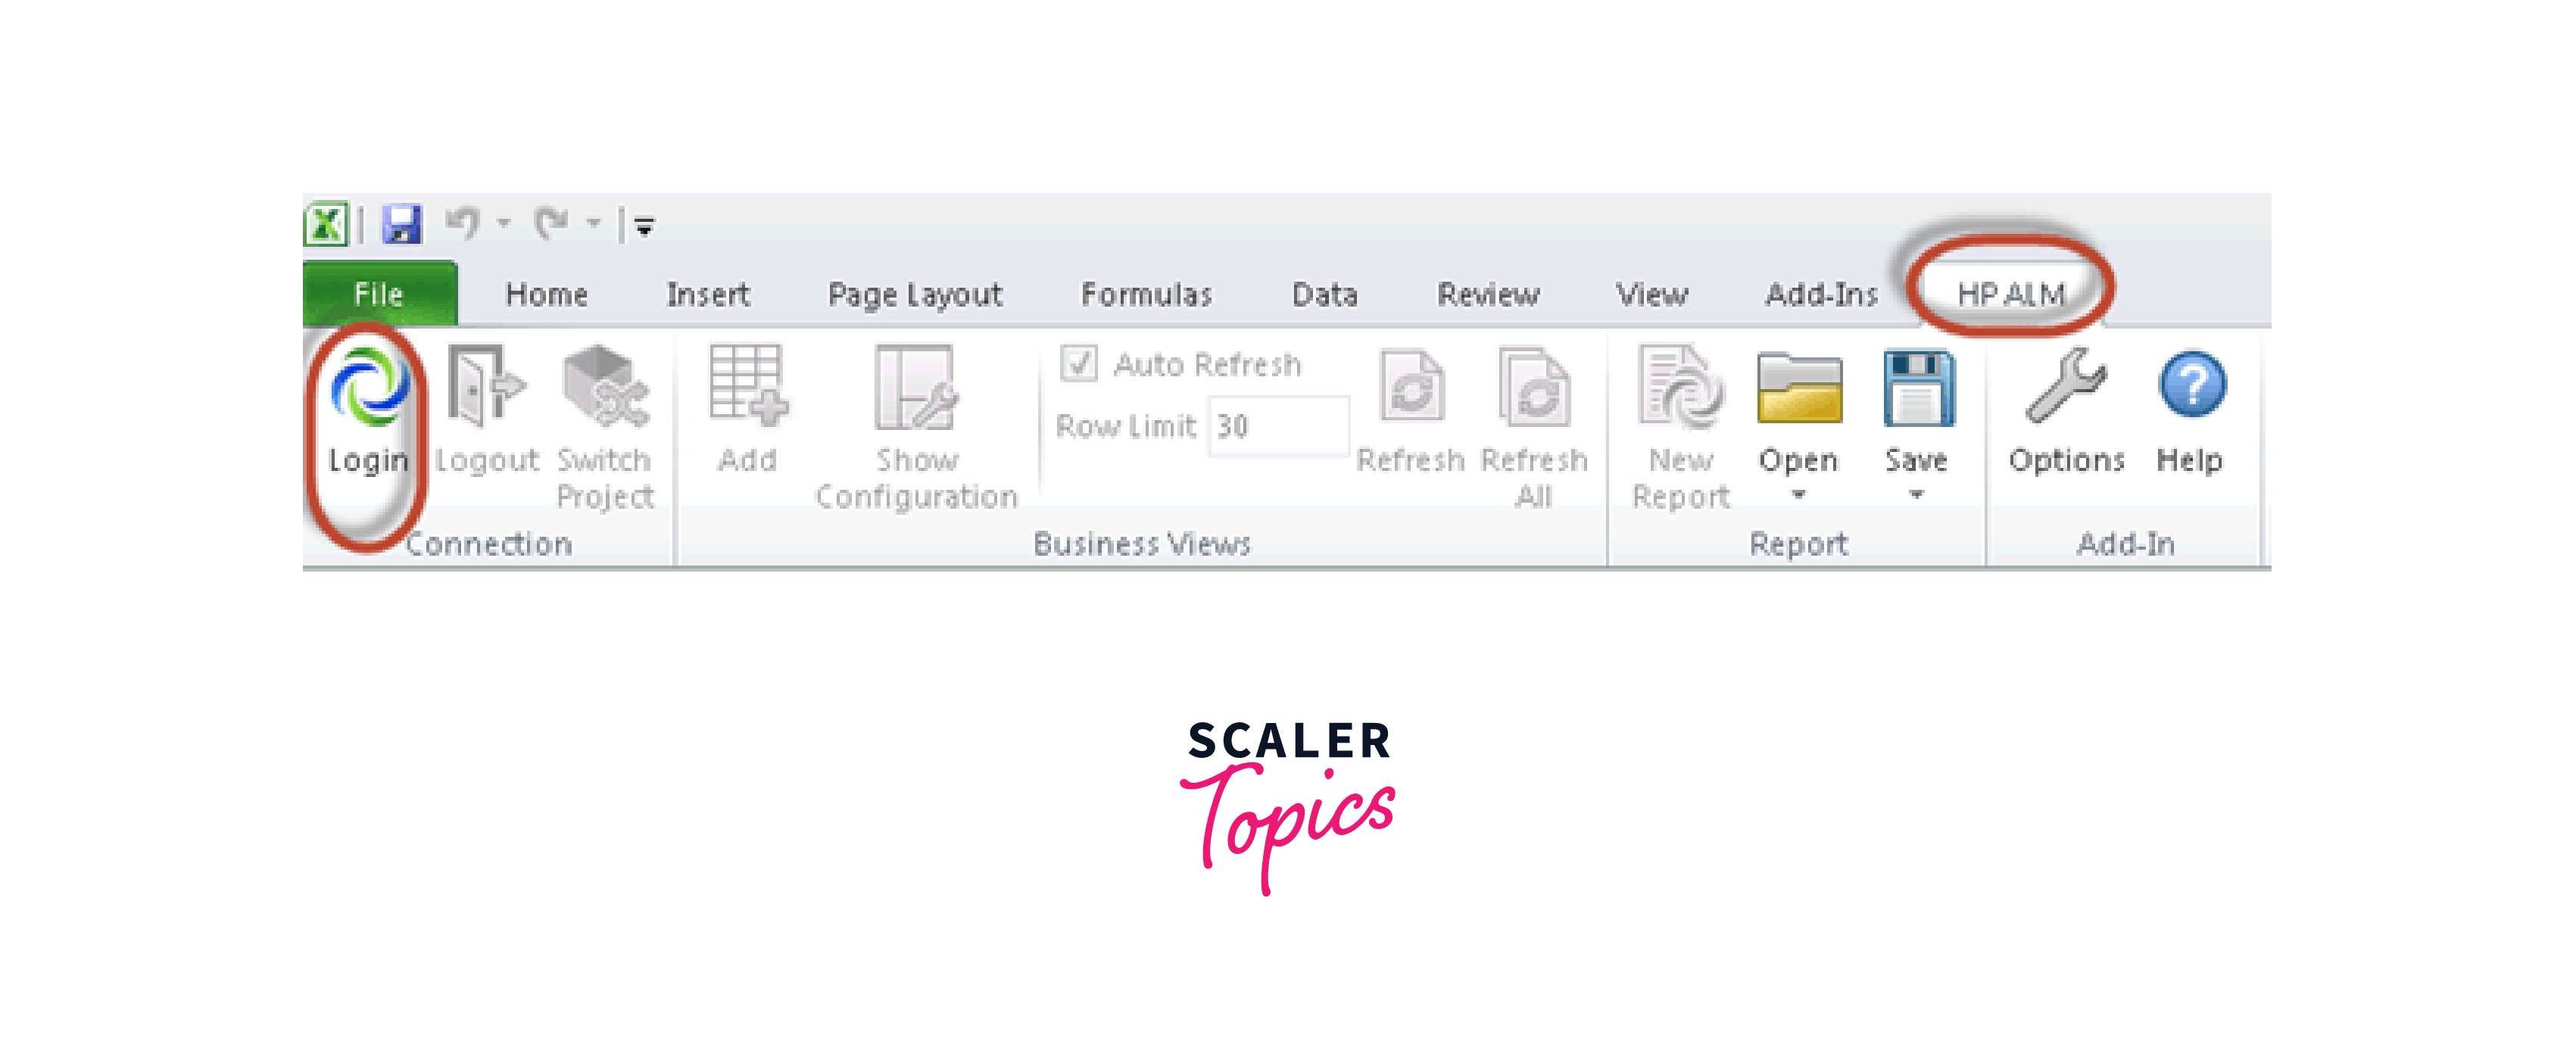
Step 6: ALM login window will open.
- Fill username.
- Fill password.
- Click on "Authenticate".
- Select Domain.
- Select a project.
- Click "Login".

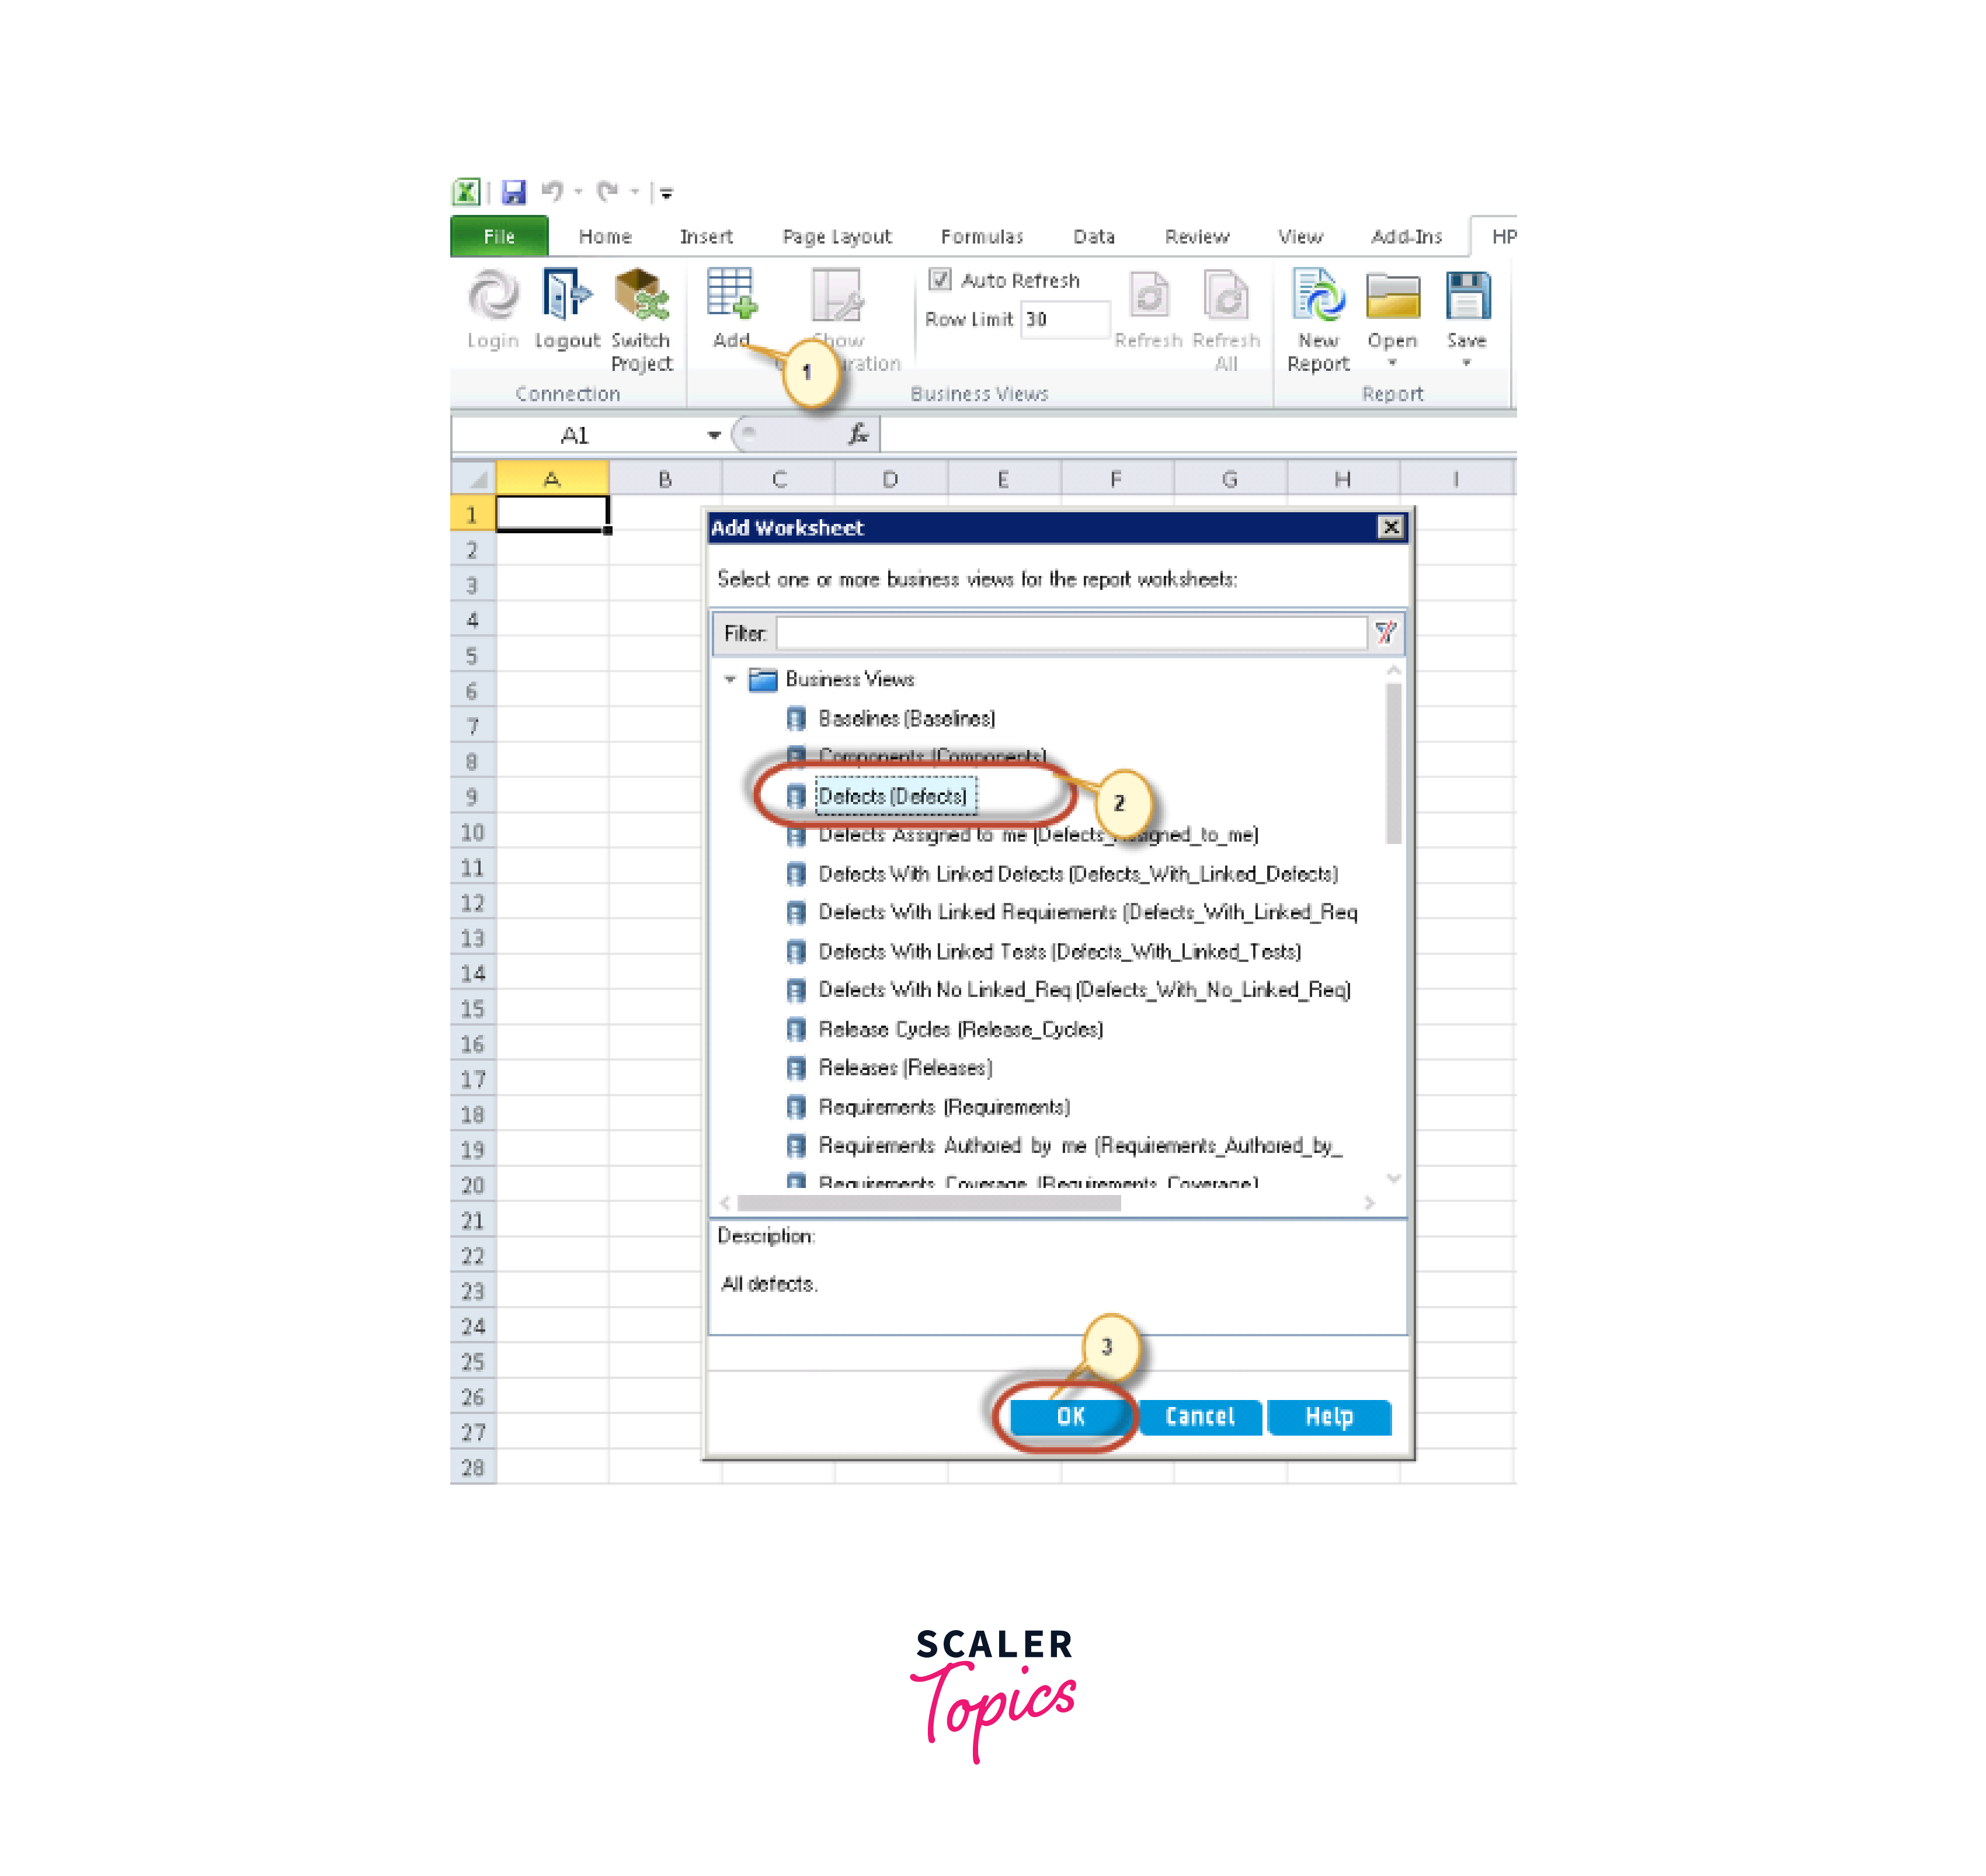
Step 7: Follow the steps to generate excel
- Click the "Add" button.
- The Add Worksheet dialog box opens. Select "Defects" because we want to generate a "high" / "very high" and "critical" defect report.
- click "OK"
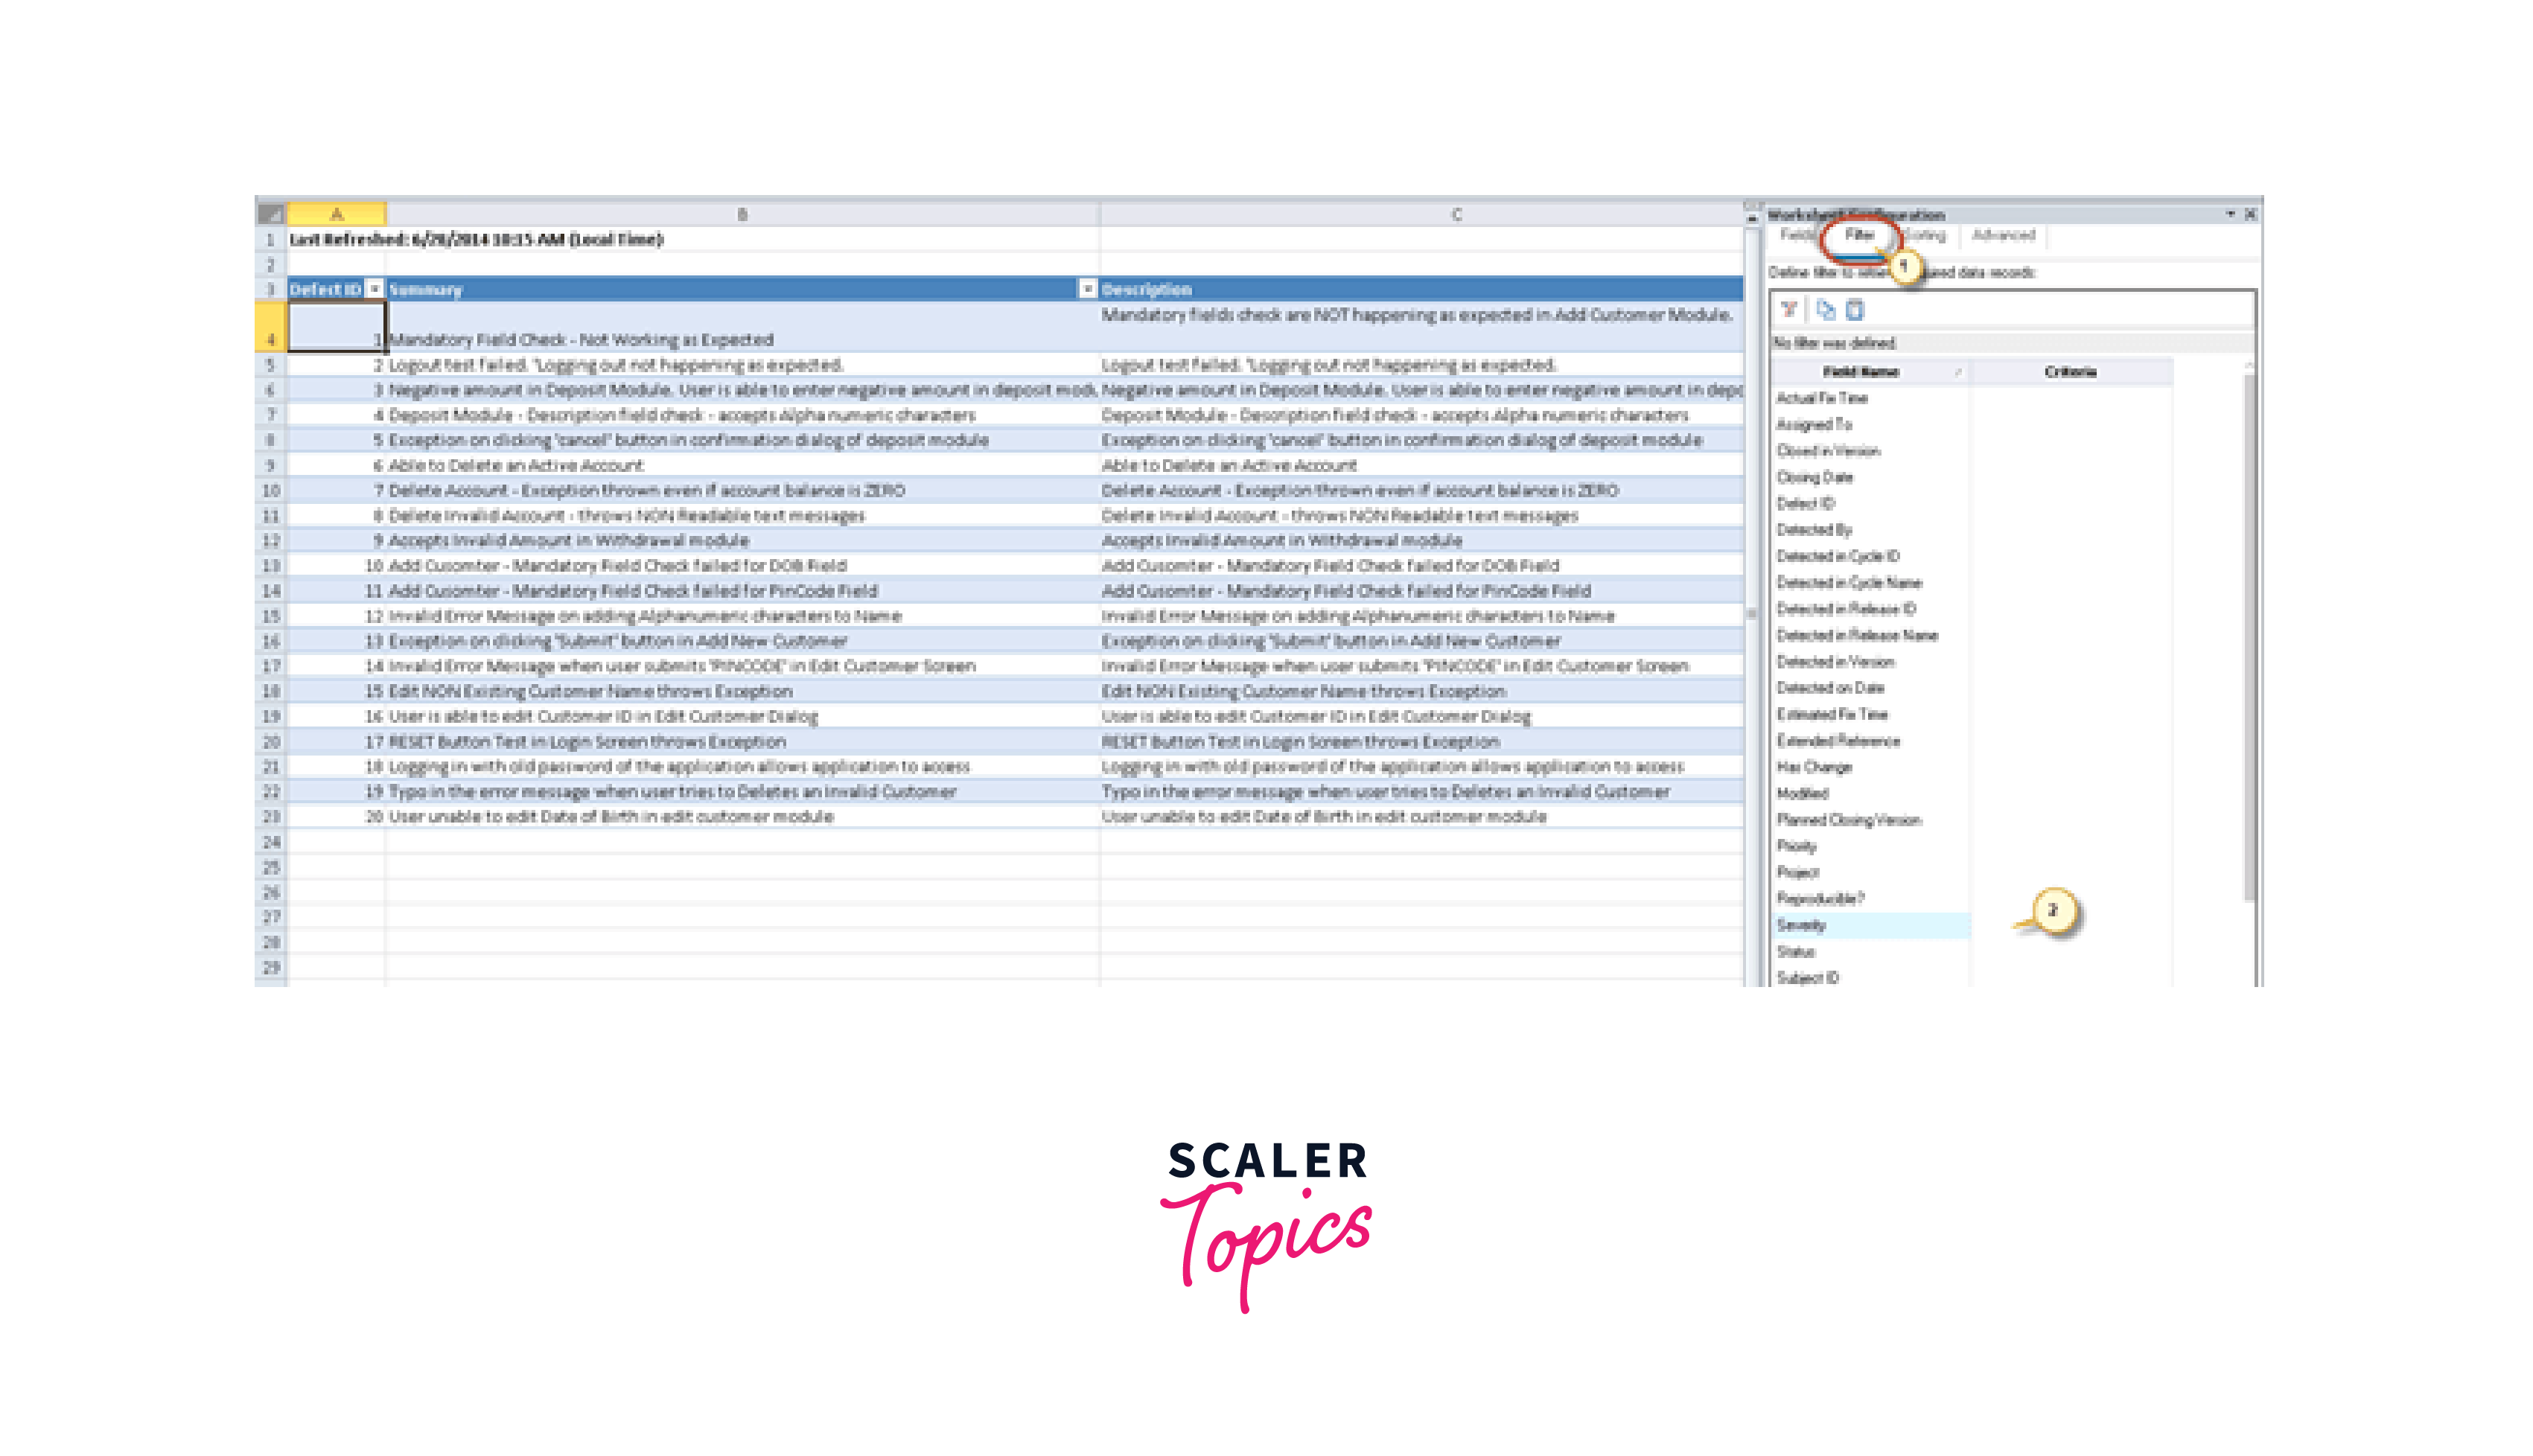
Step 8: Excel report will be generated for all defect lists and the user can specify the same.
- Click on the "Filter" tab in the spreadsheet settings.
- Click on the "Severity" field.
Step 9: The "Select Filter Condition" dialog will open.
- Select a filter condition
- click "OK"

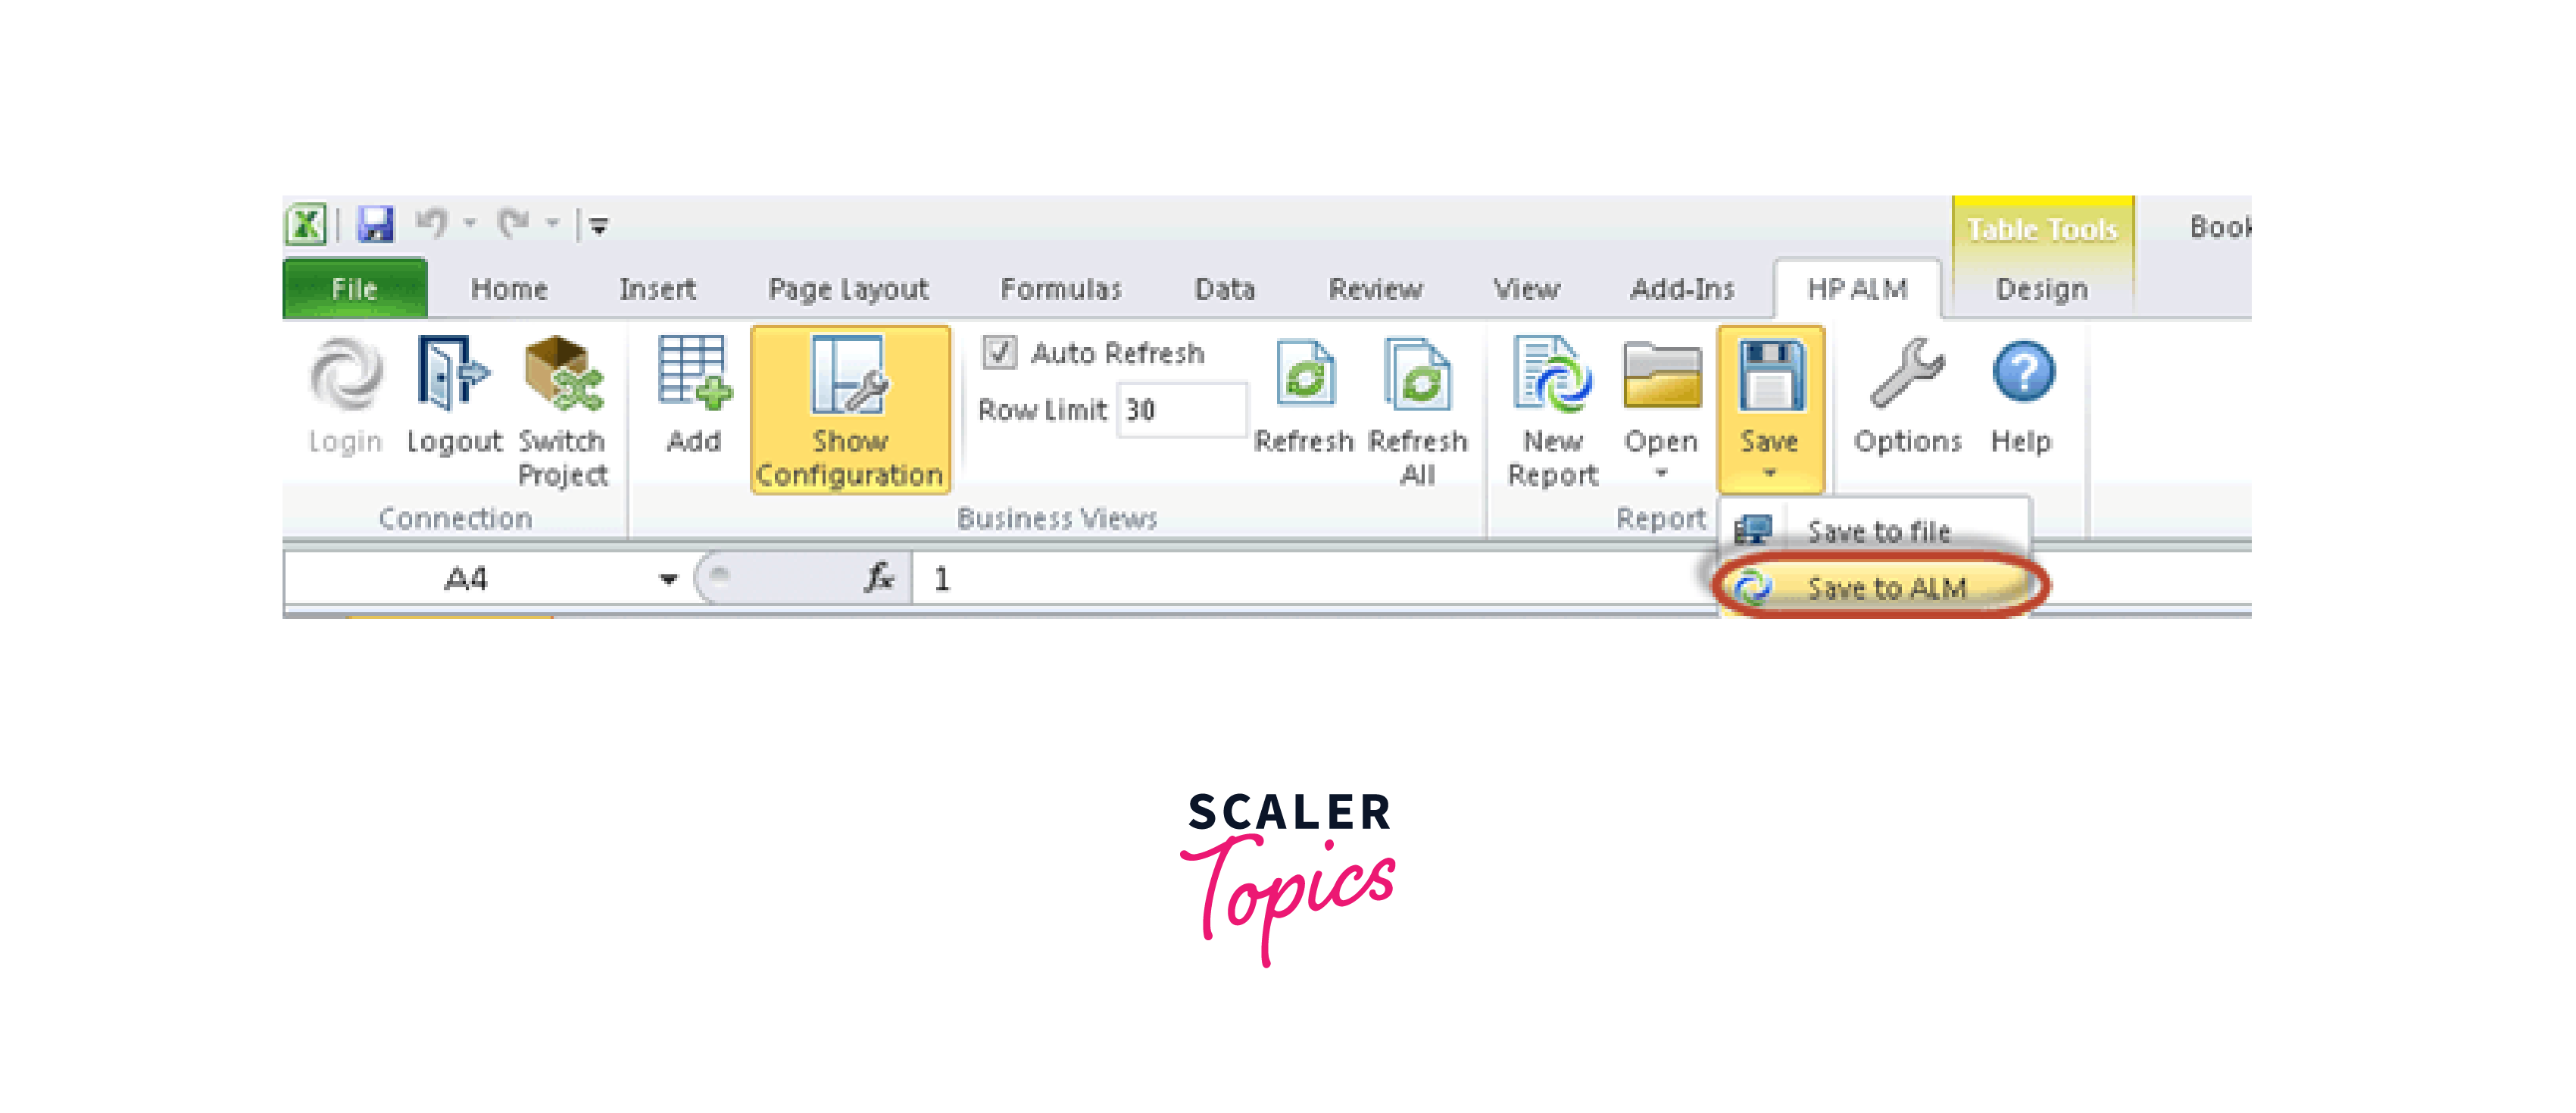
Step 10: To save the report, first, navigate to the "HP ALM" tab, and then click on the "Save to ALM" button.
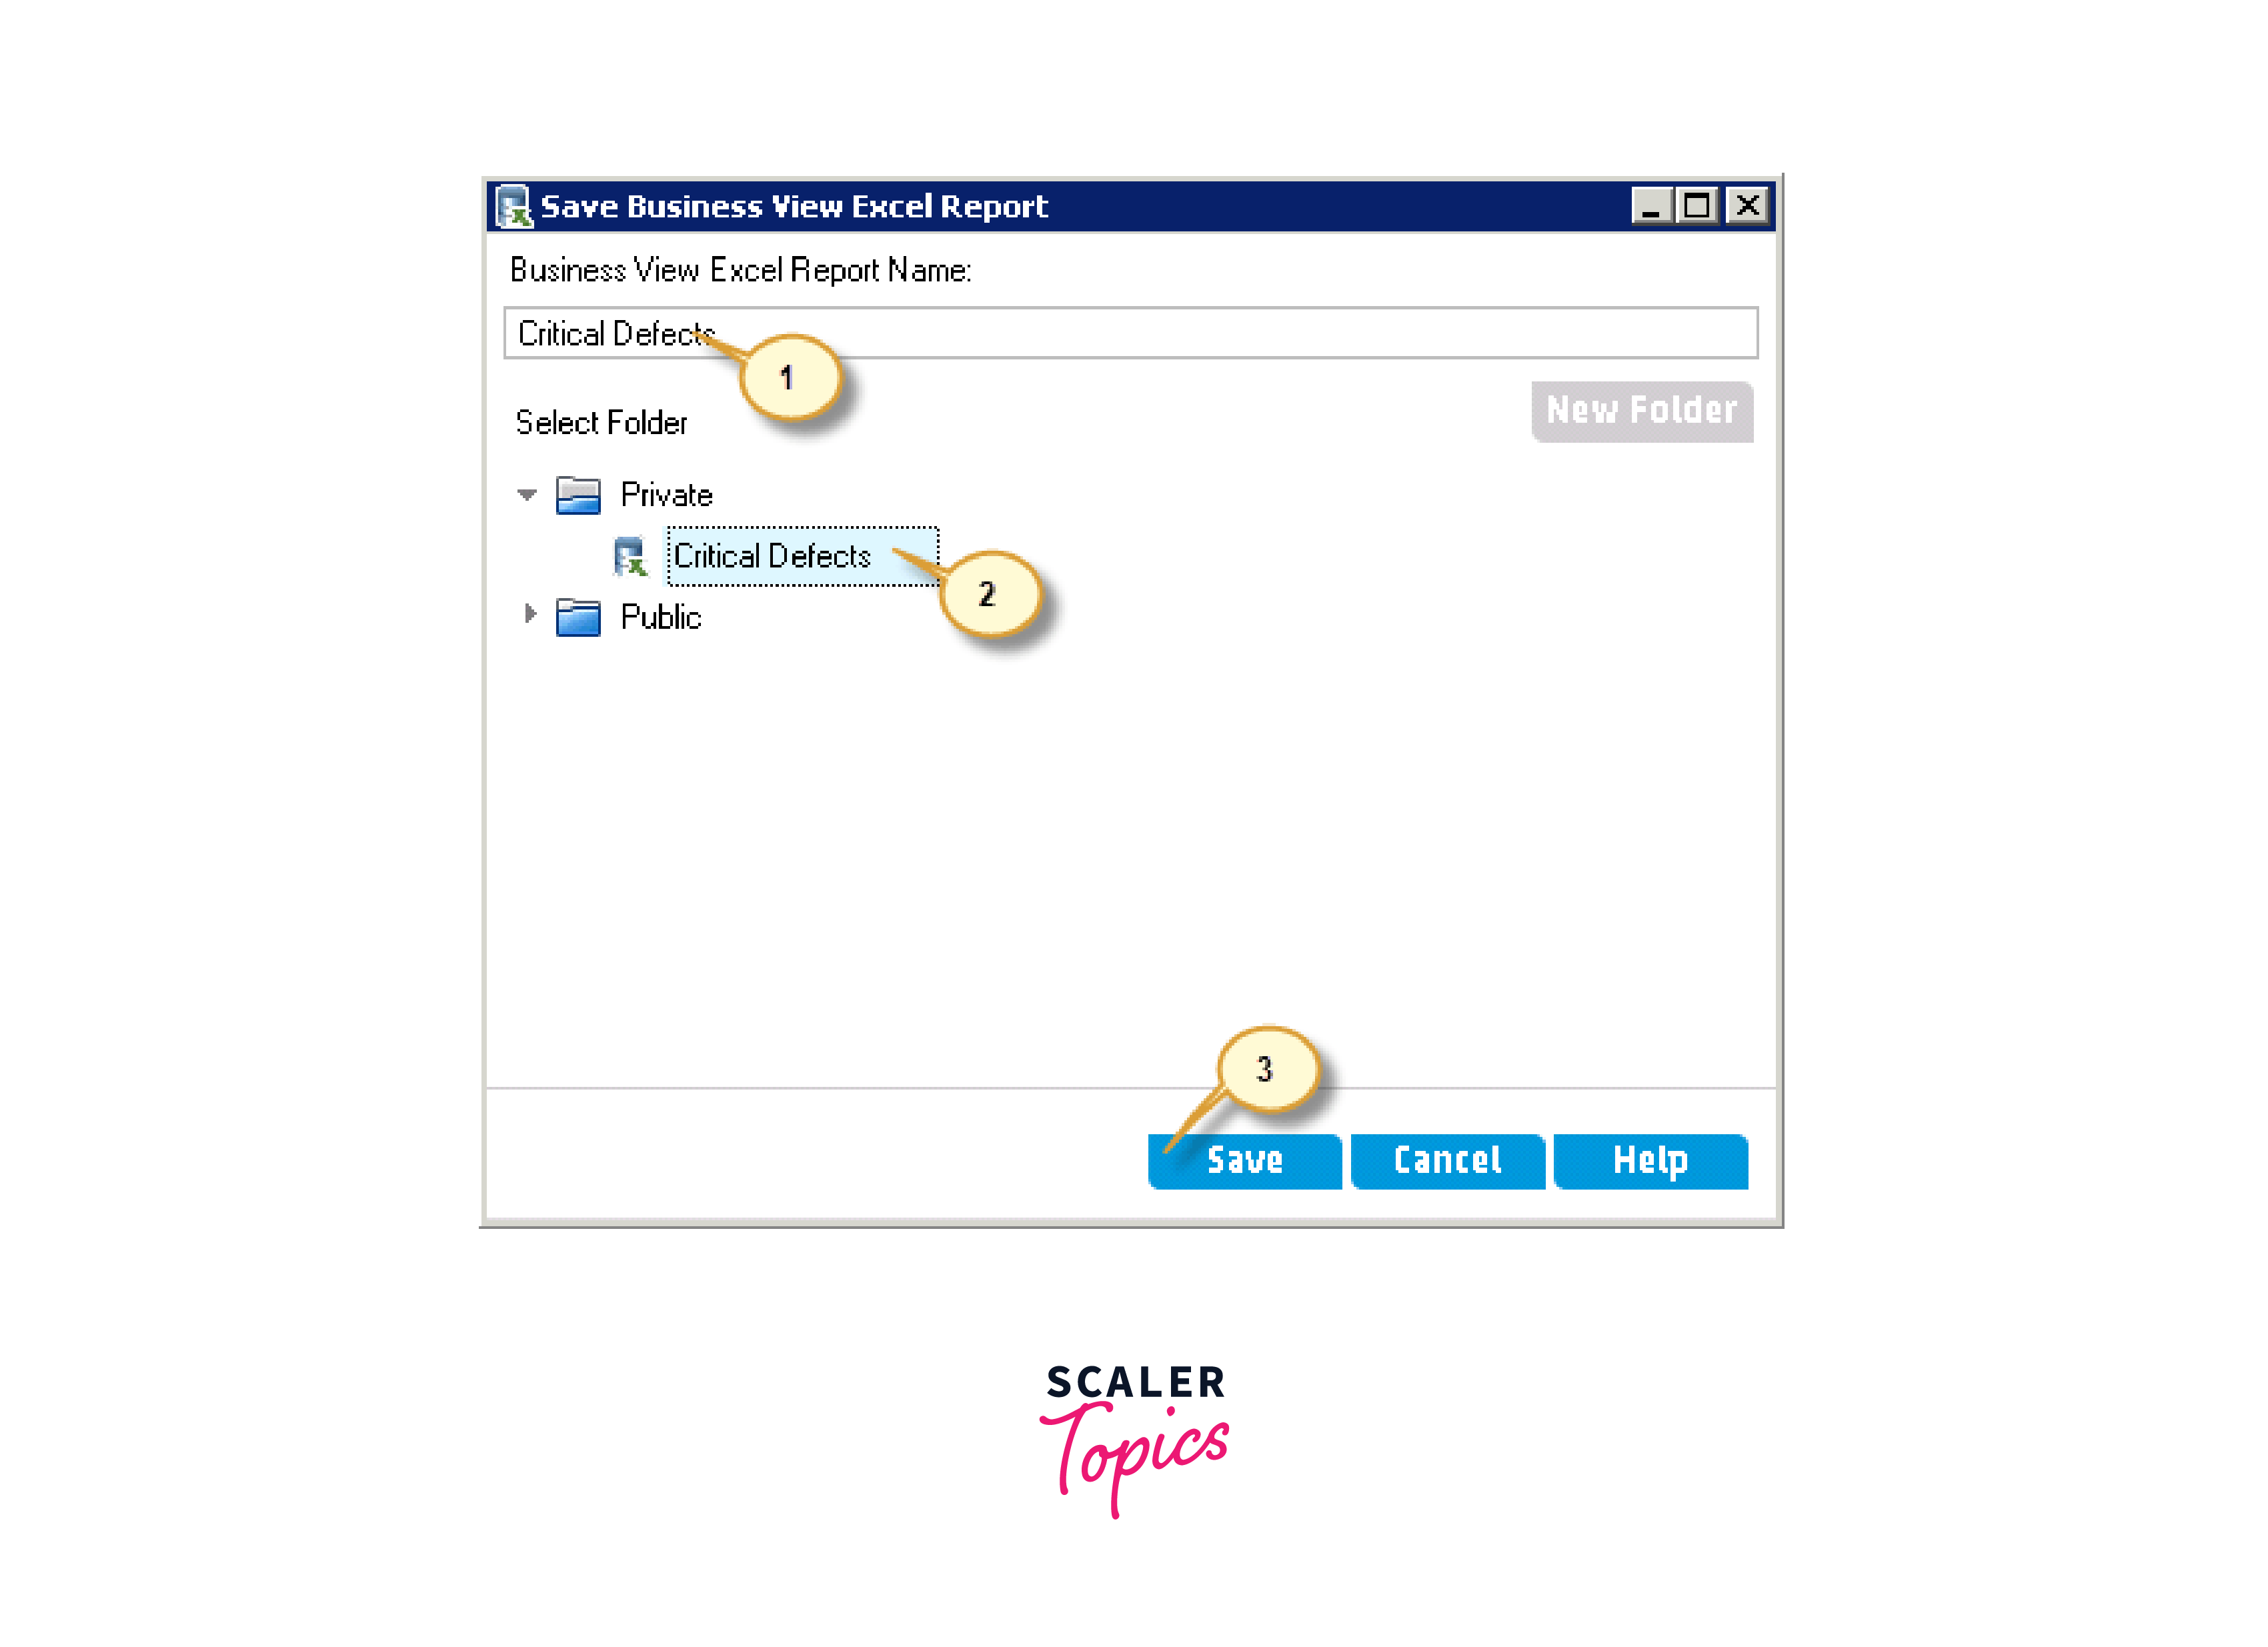
Step 11: The "Save Business View Excel Report" dialog will open.
- Enter a report name
- Select the same report we created in step 2.
- Click Save.
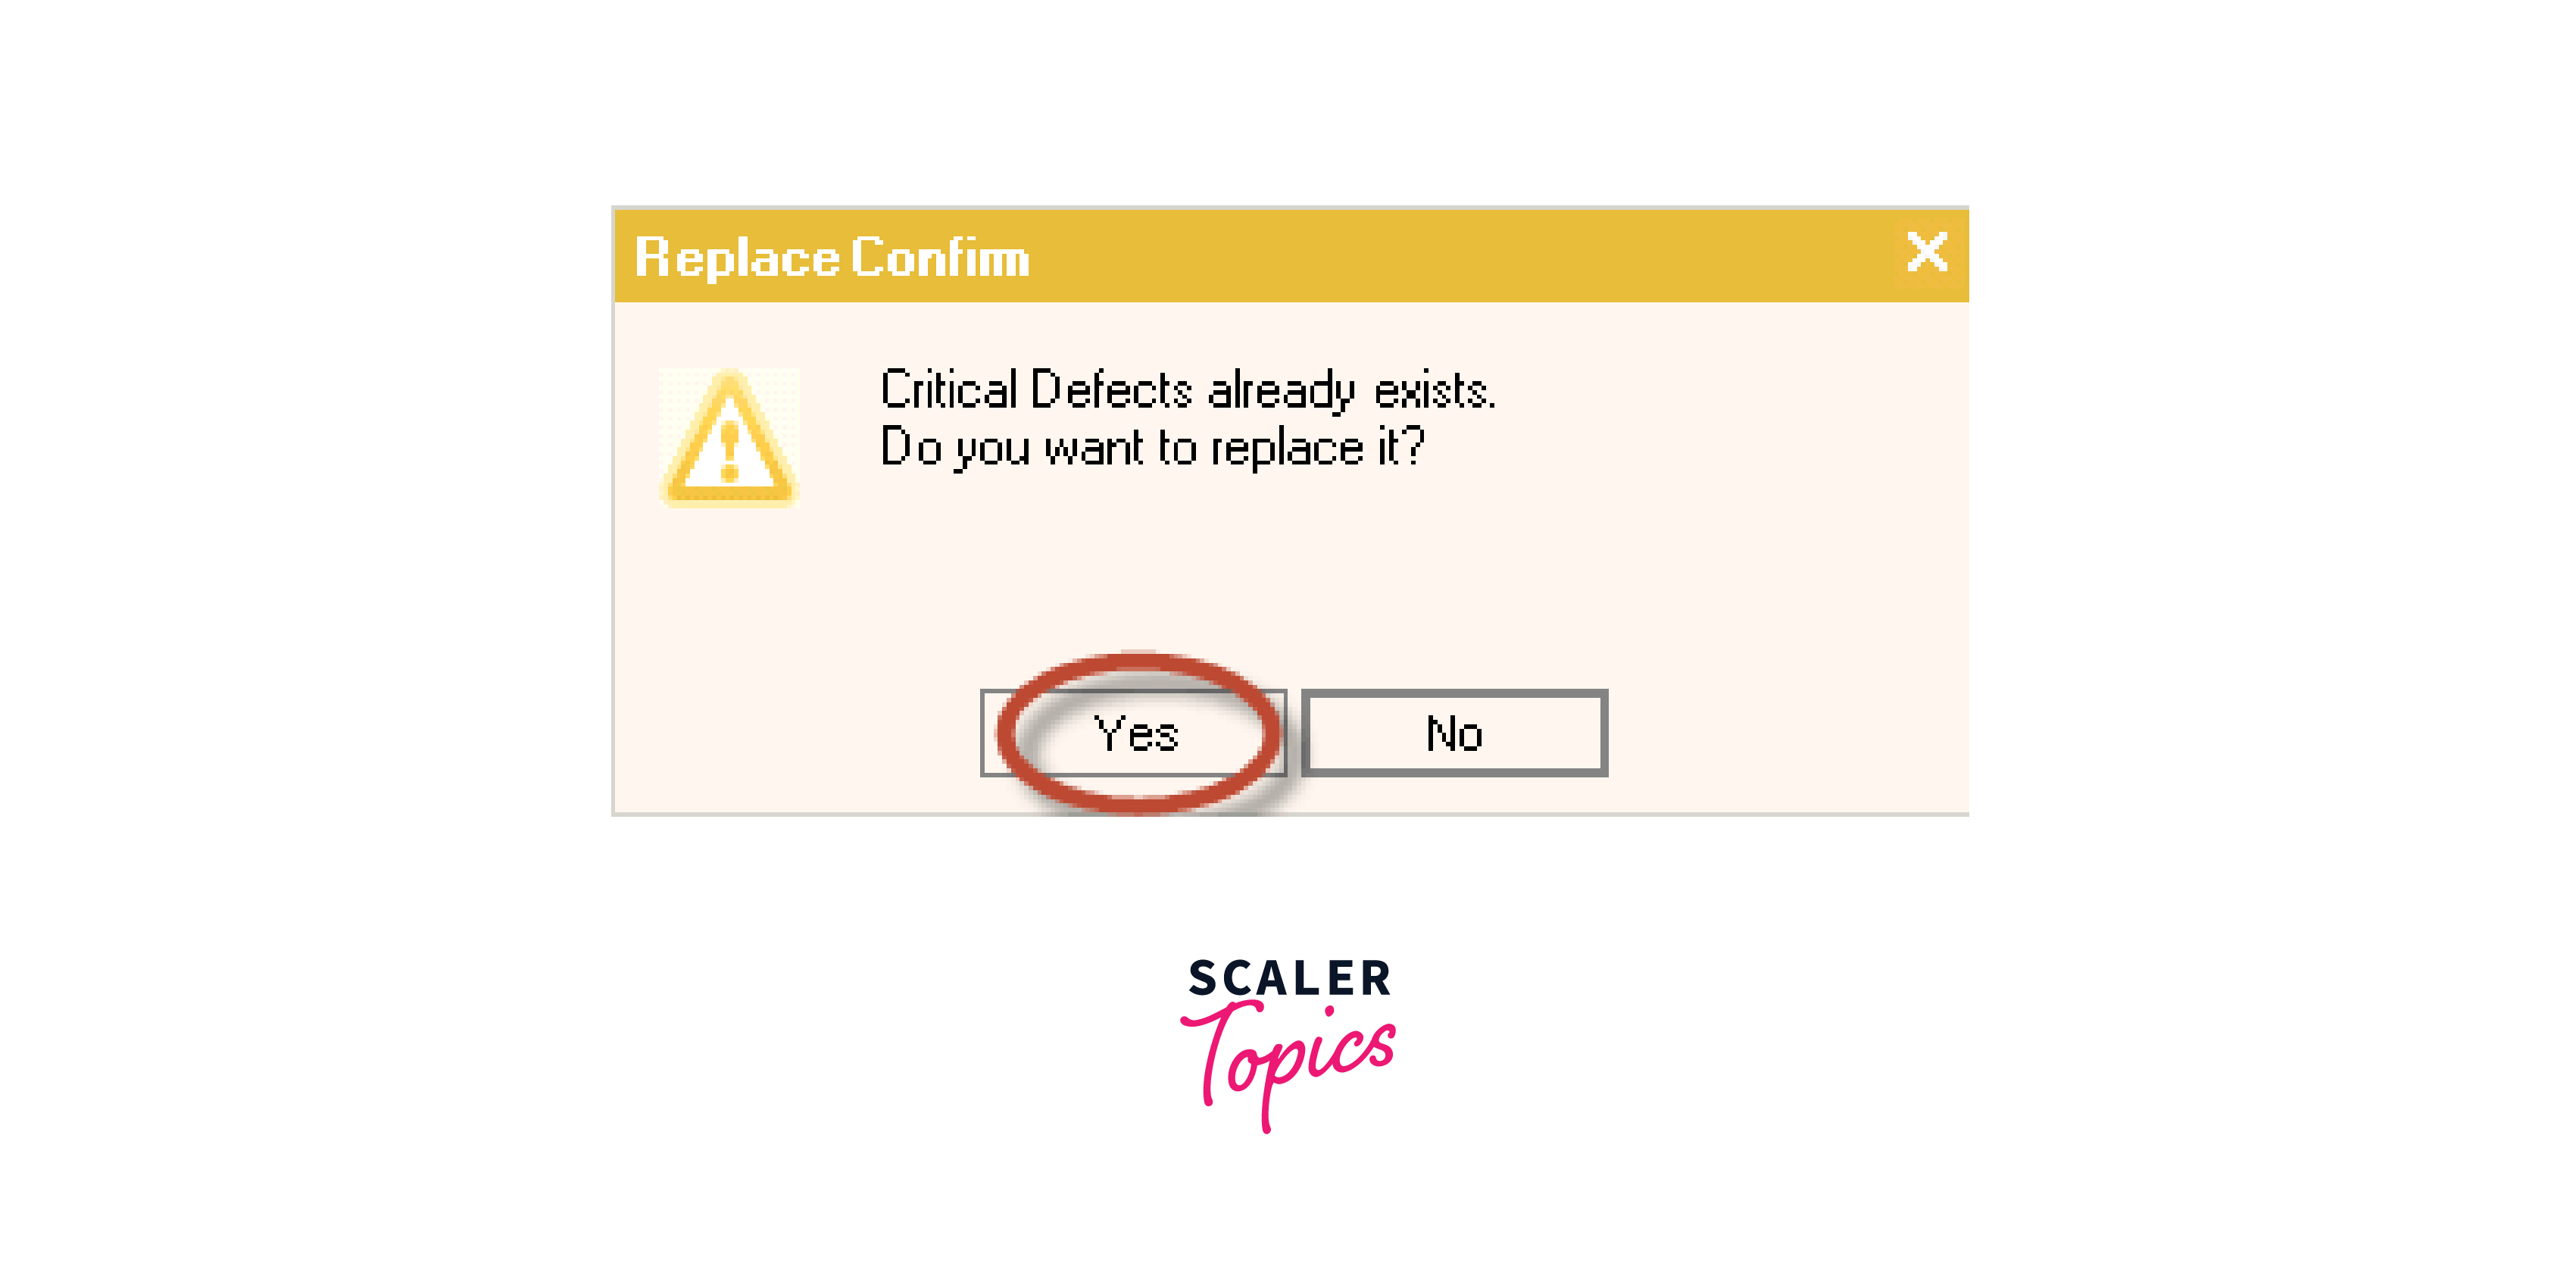
Step 12: The user may encounter the Confirm Save dialog when attempting to overwrite an existing file. To proceed with the overwrite, click "Yes" in the dialog box.
Note: ALM is requesting confirmation to replace the existing Excel report since we have used the same name as the report created in Step 2. It's important to note that in Step 2, the report was not defined or loaded, but rather just a reference point for the report. It's only after completing this step that the Excel report becomes available for the user to create and save in Excel format.
Step 13

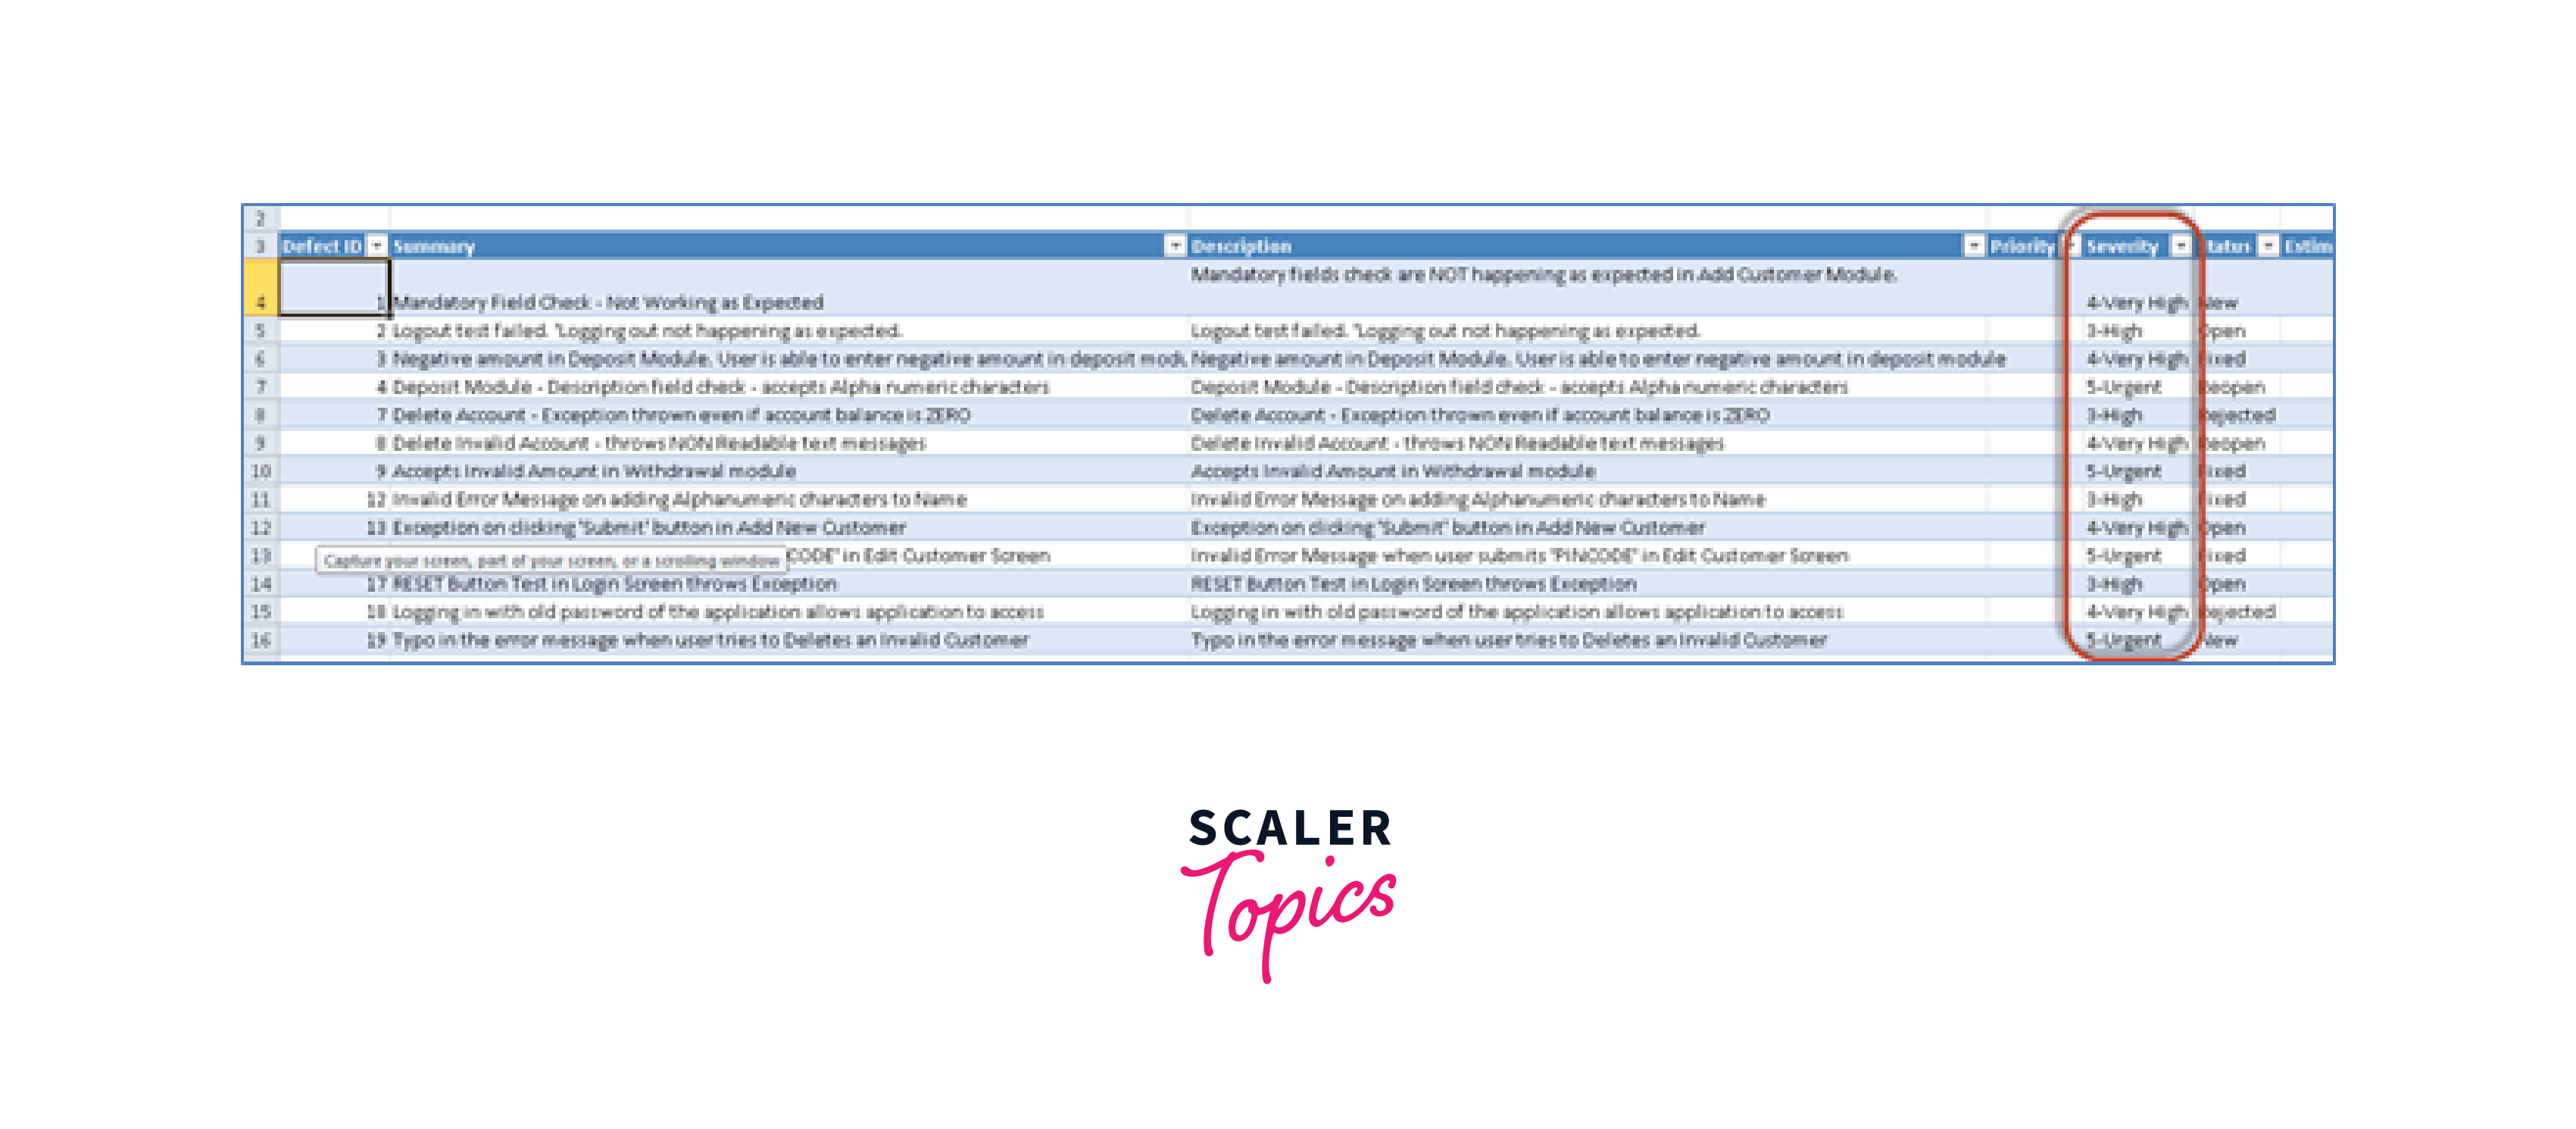
Step 14: The report will be displayed based on the criteria set by the user. Note: If defects are added or removed, or if the severity of the defect changes, the user can generate an updated Excel report again.
Generating Project Report
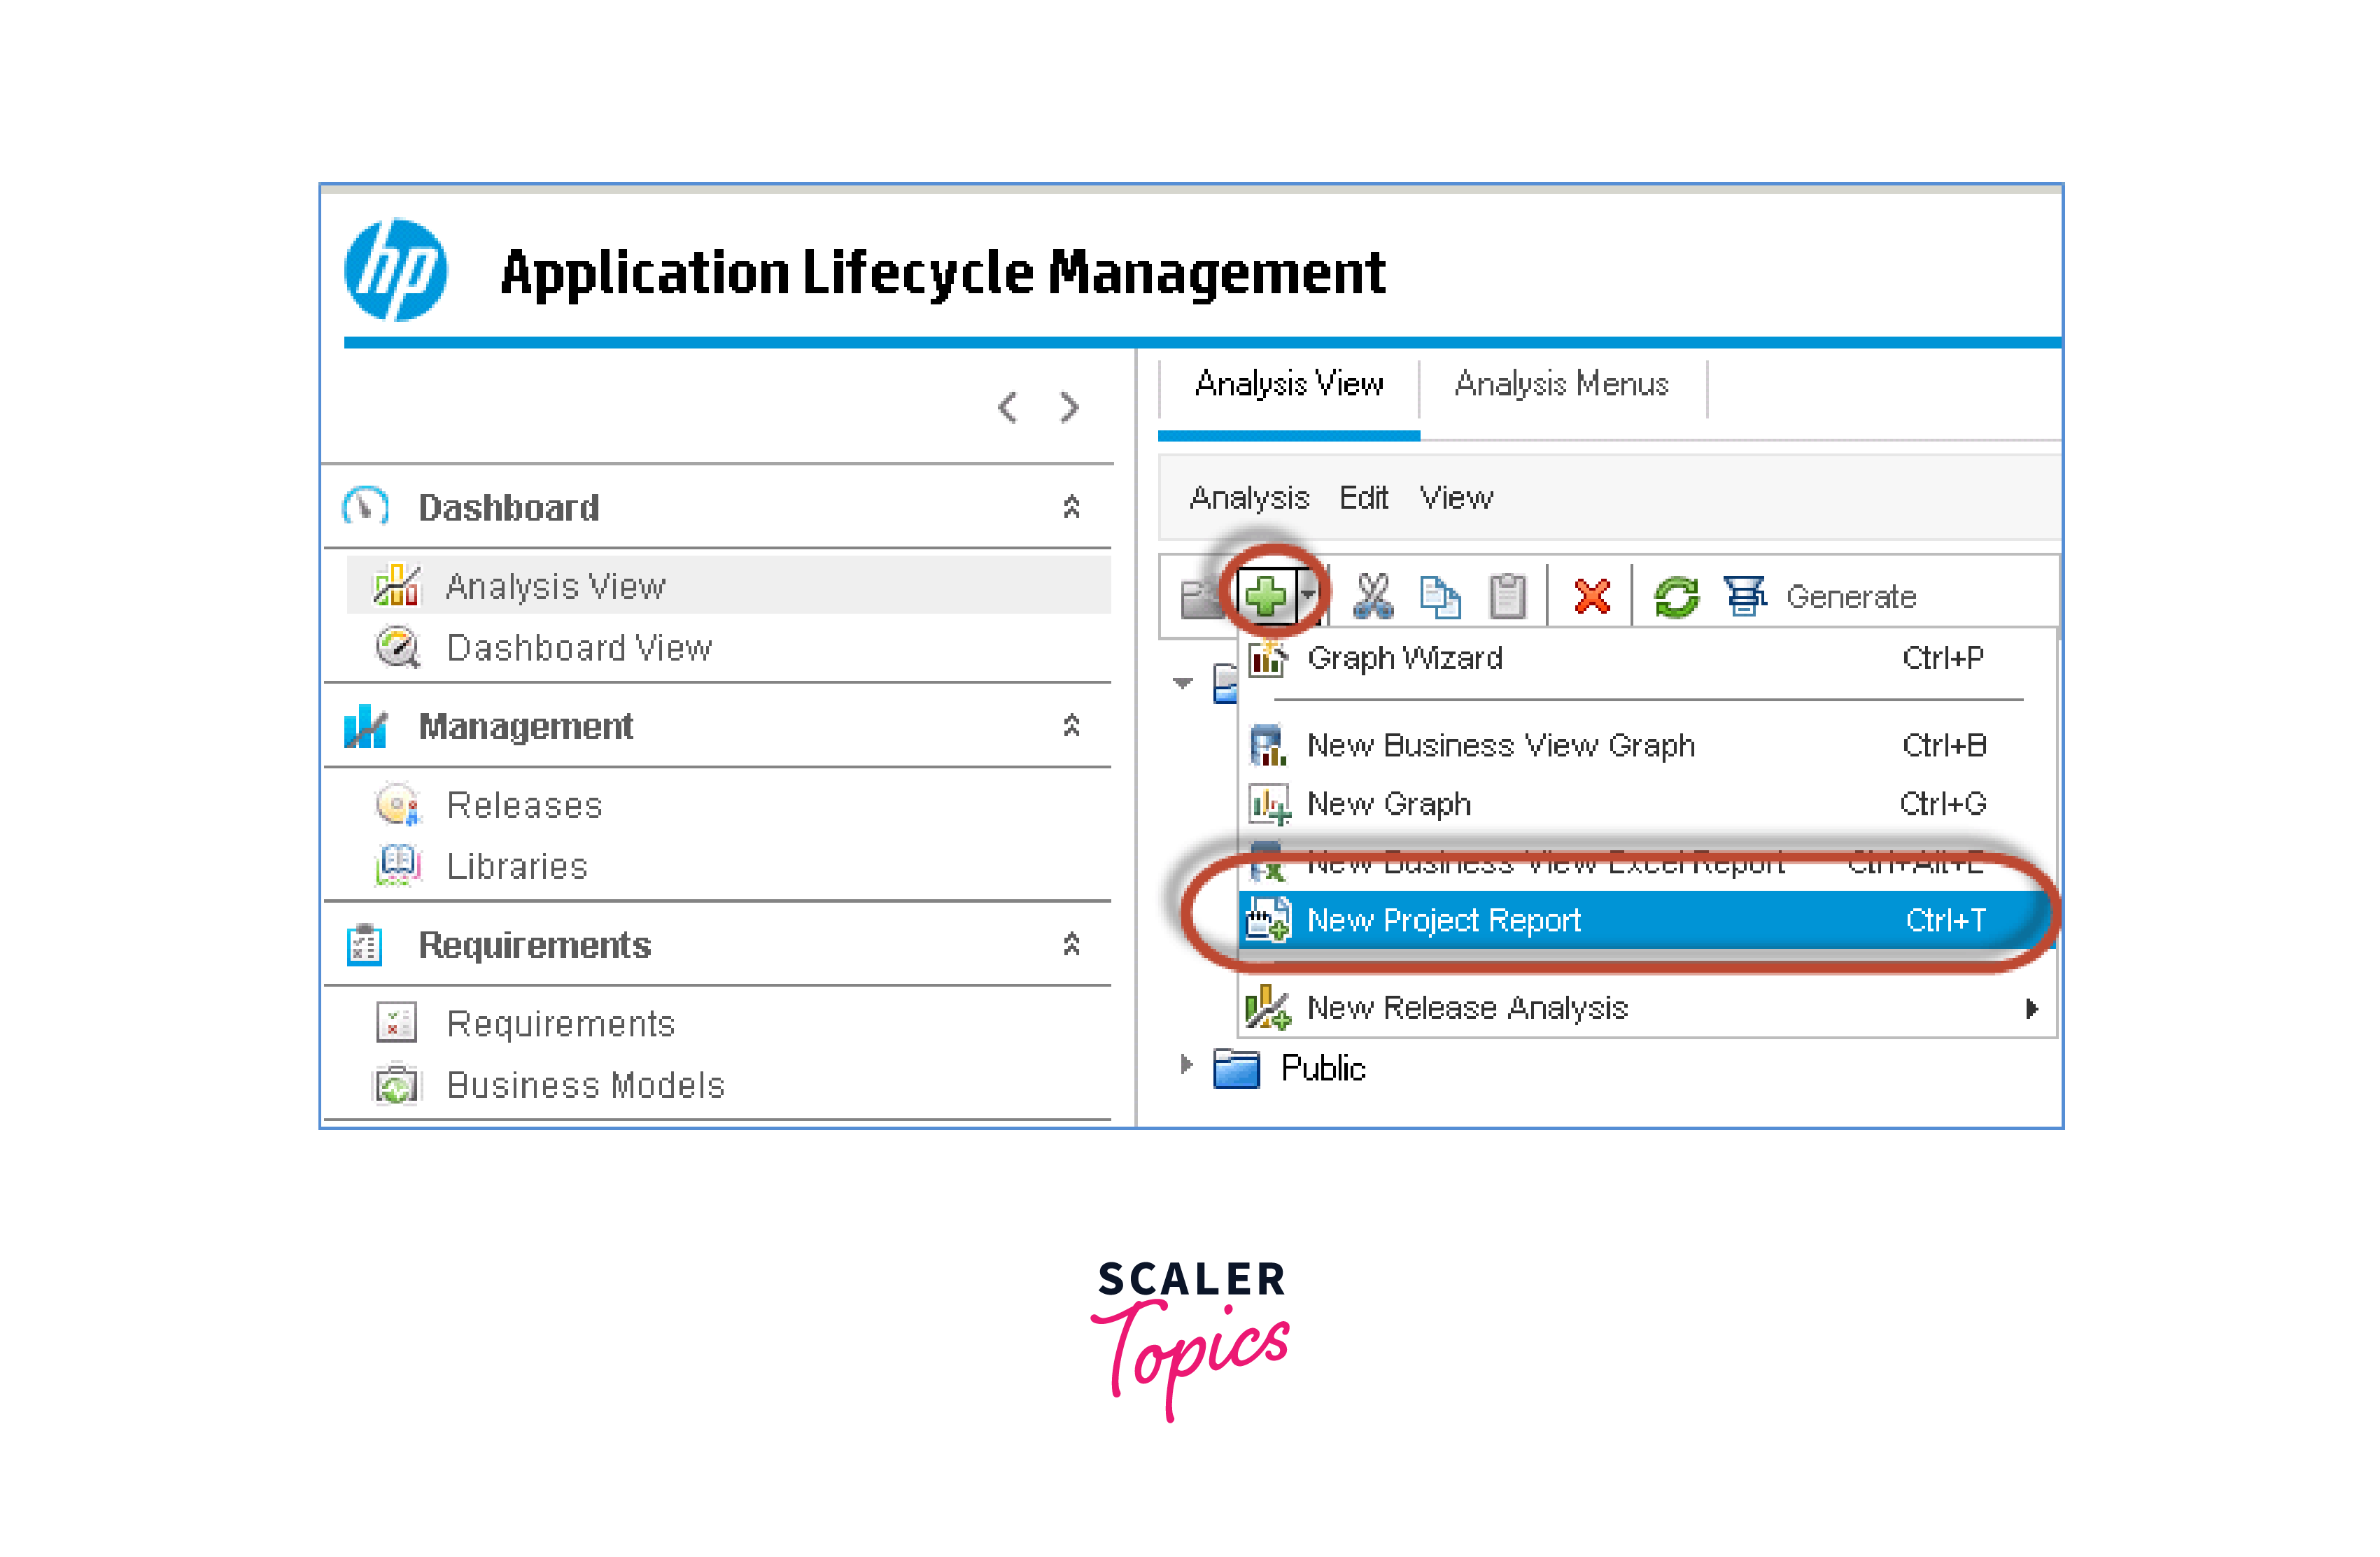
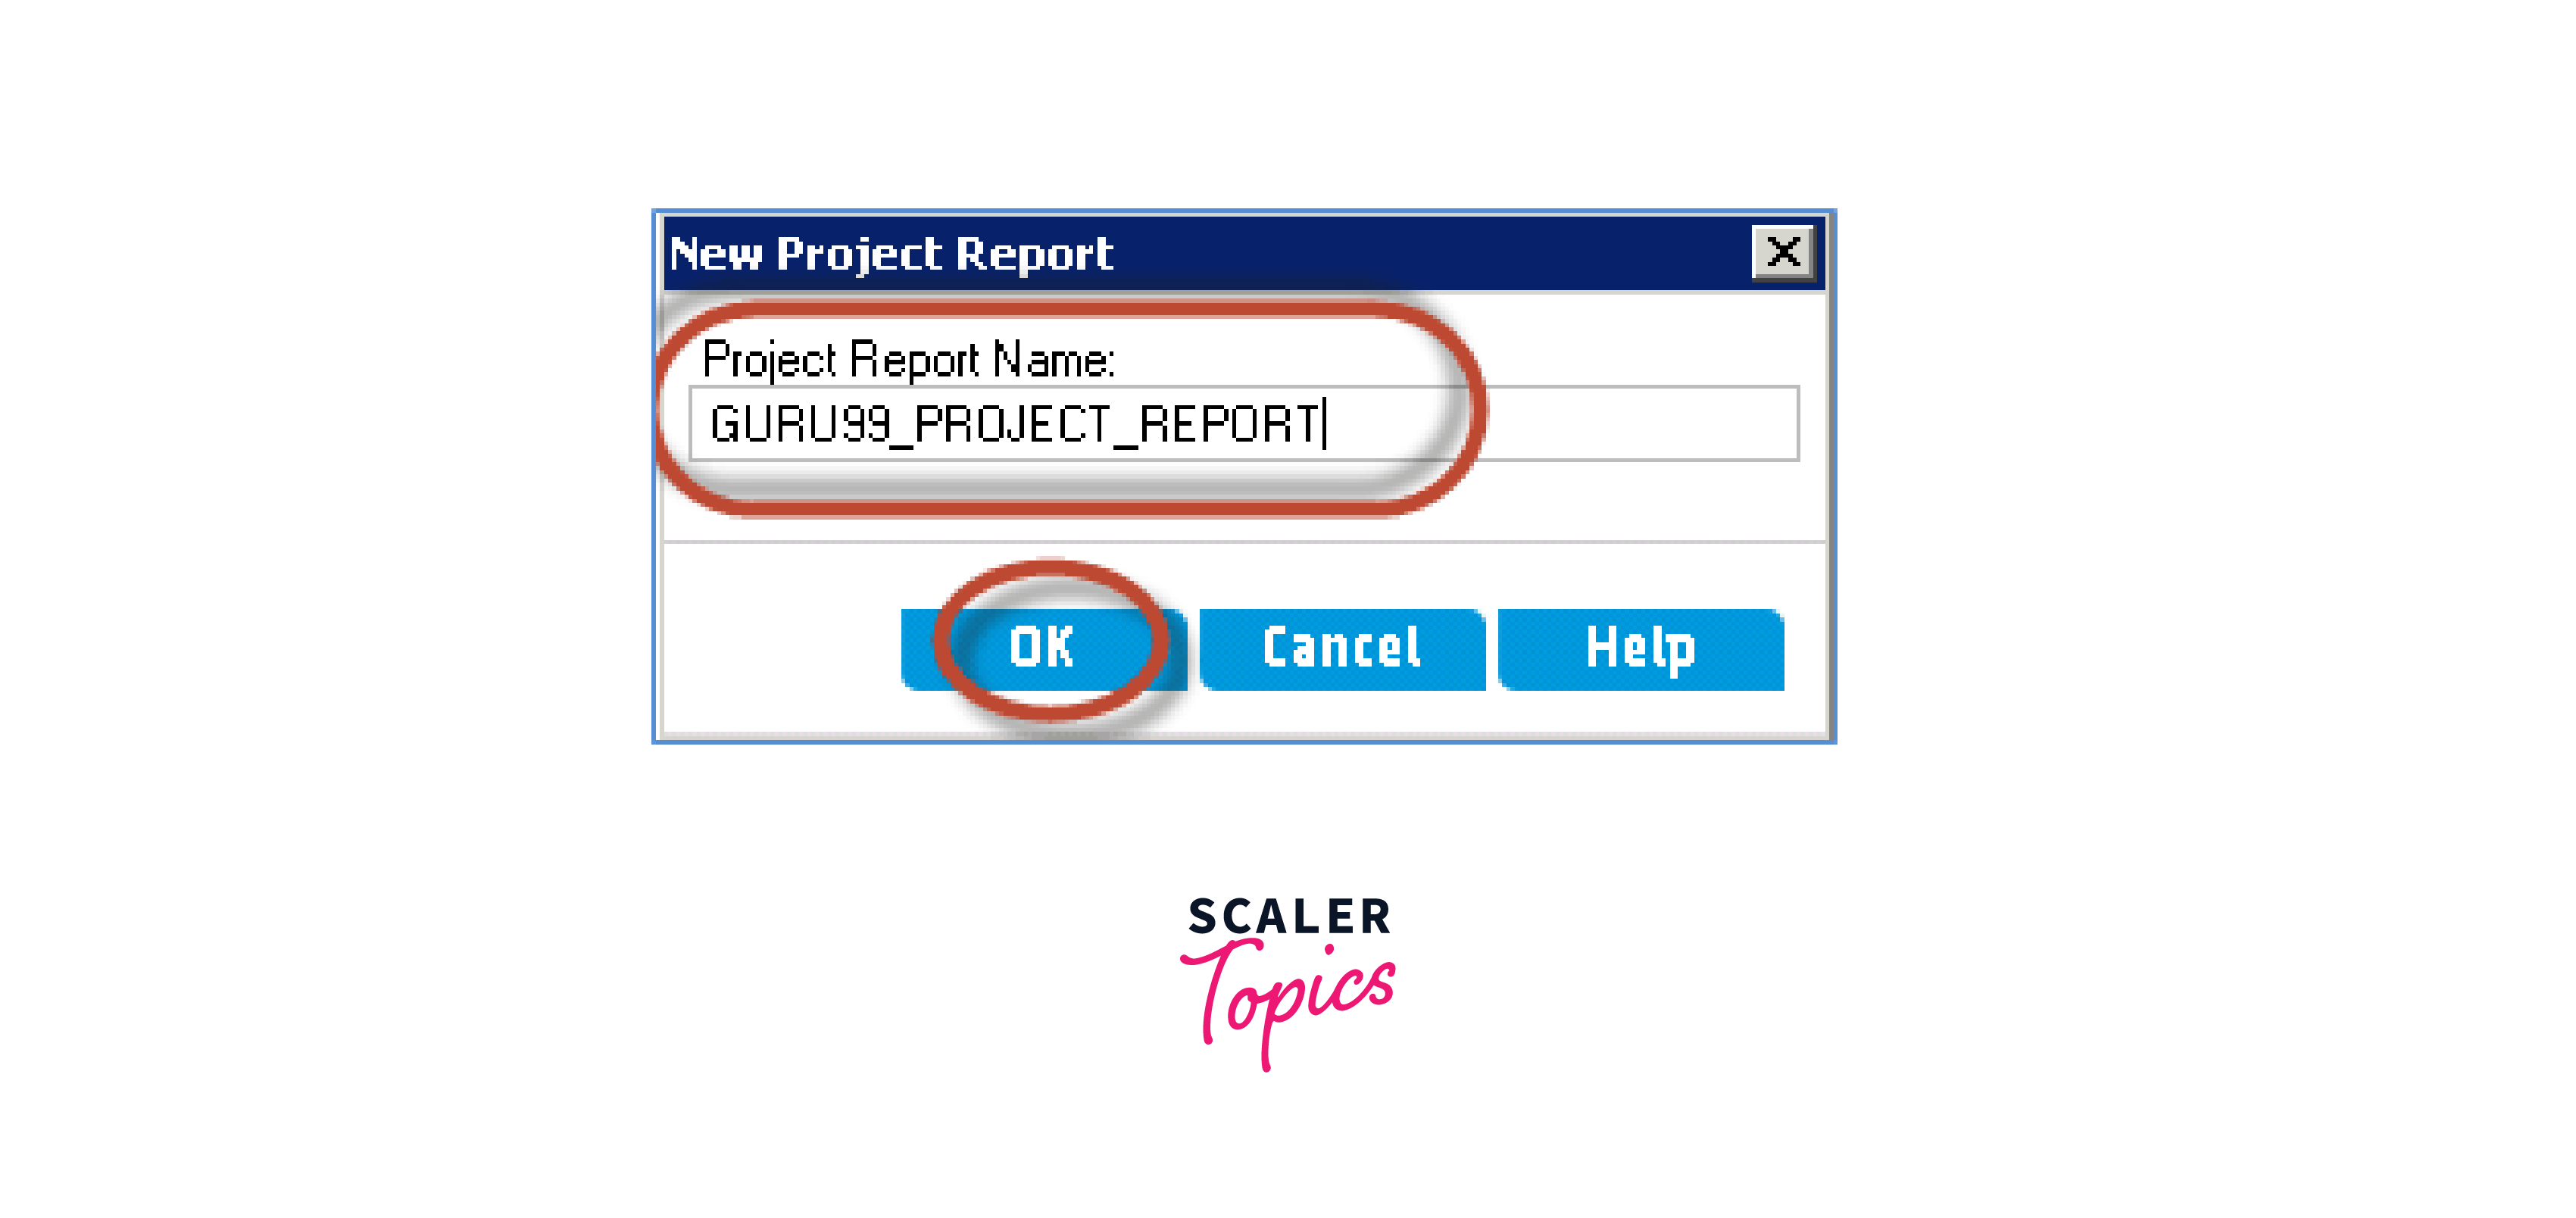
Step 1: Create a new project report by clicking on the analysis module "+" icon and selecting "New Project Report".
Step 2: To create a new project report, open the New Project Report dialog and provide a name for the project. Then, proceed by clicking on the "OK" button.
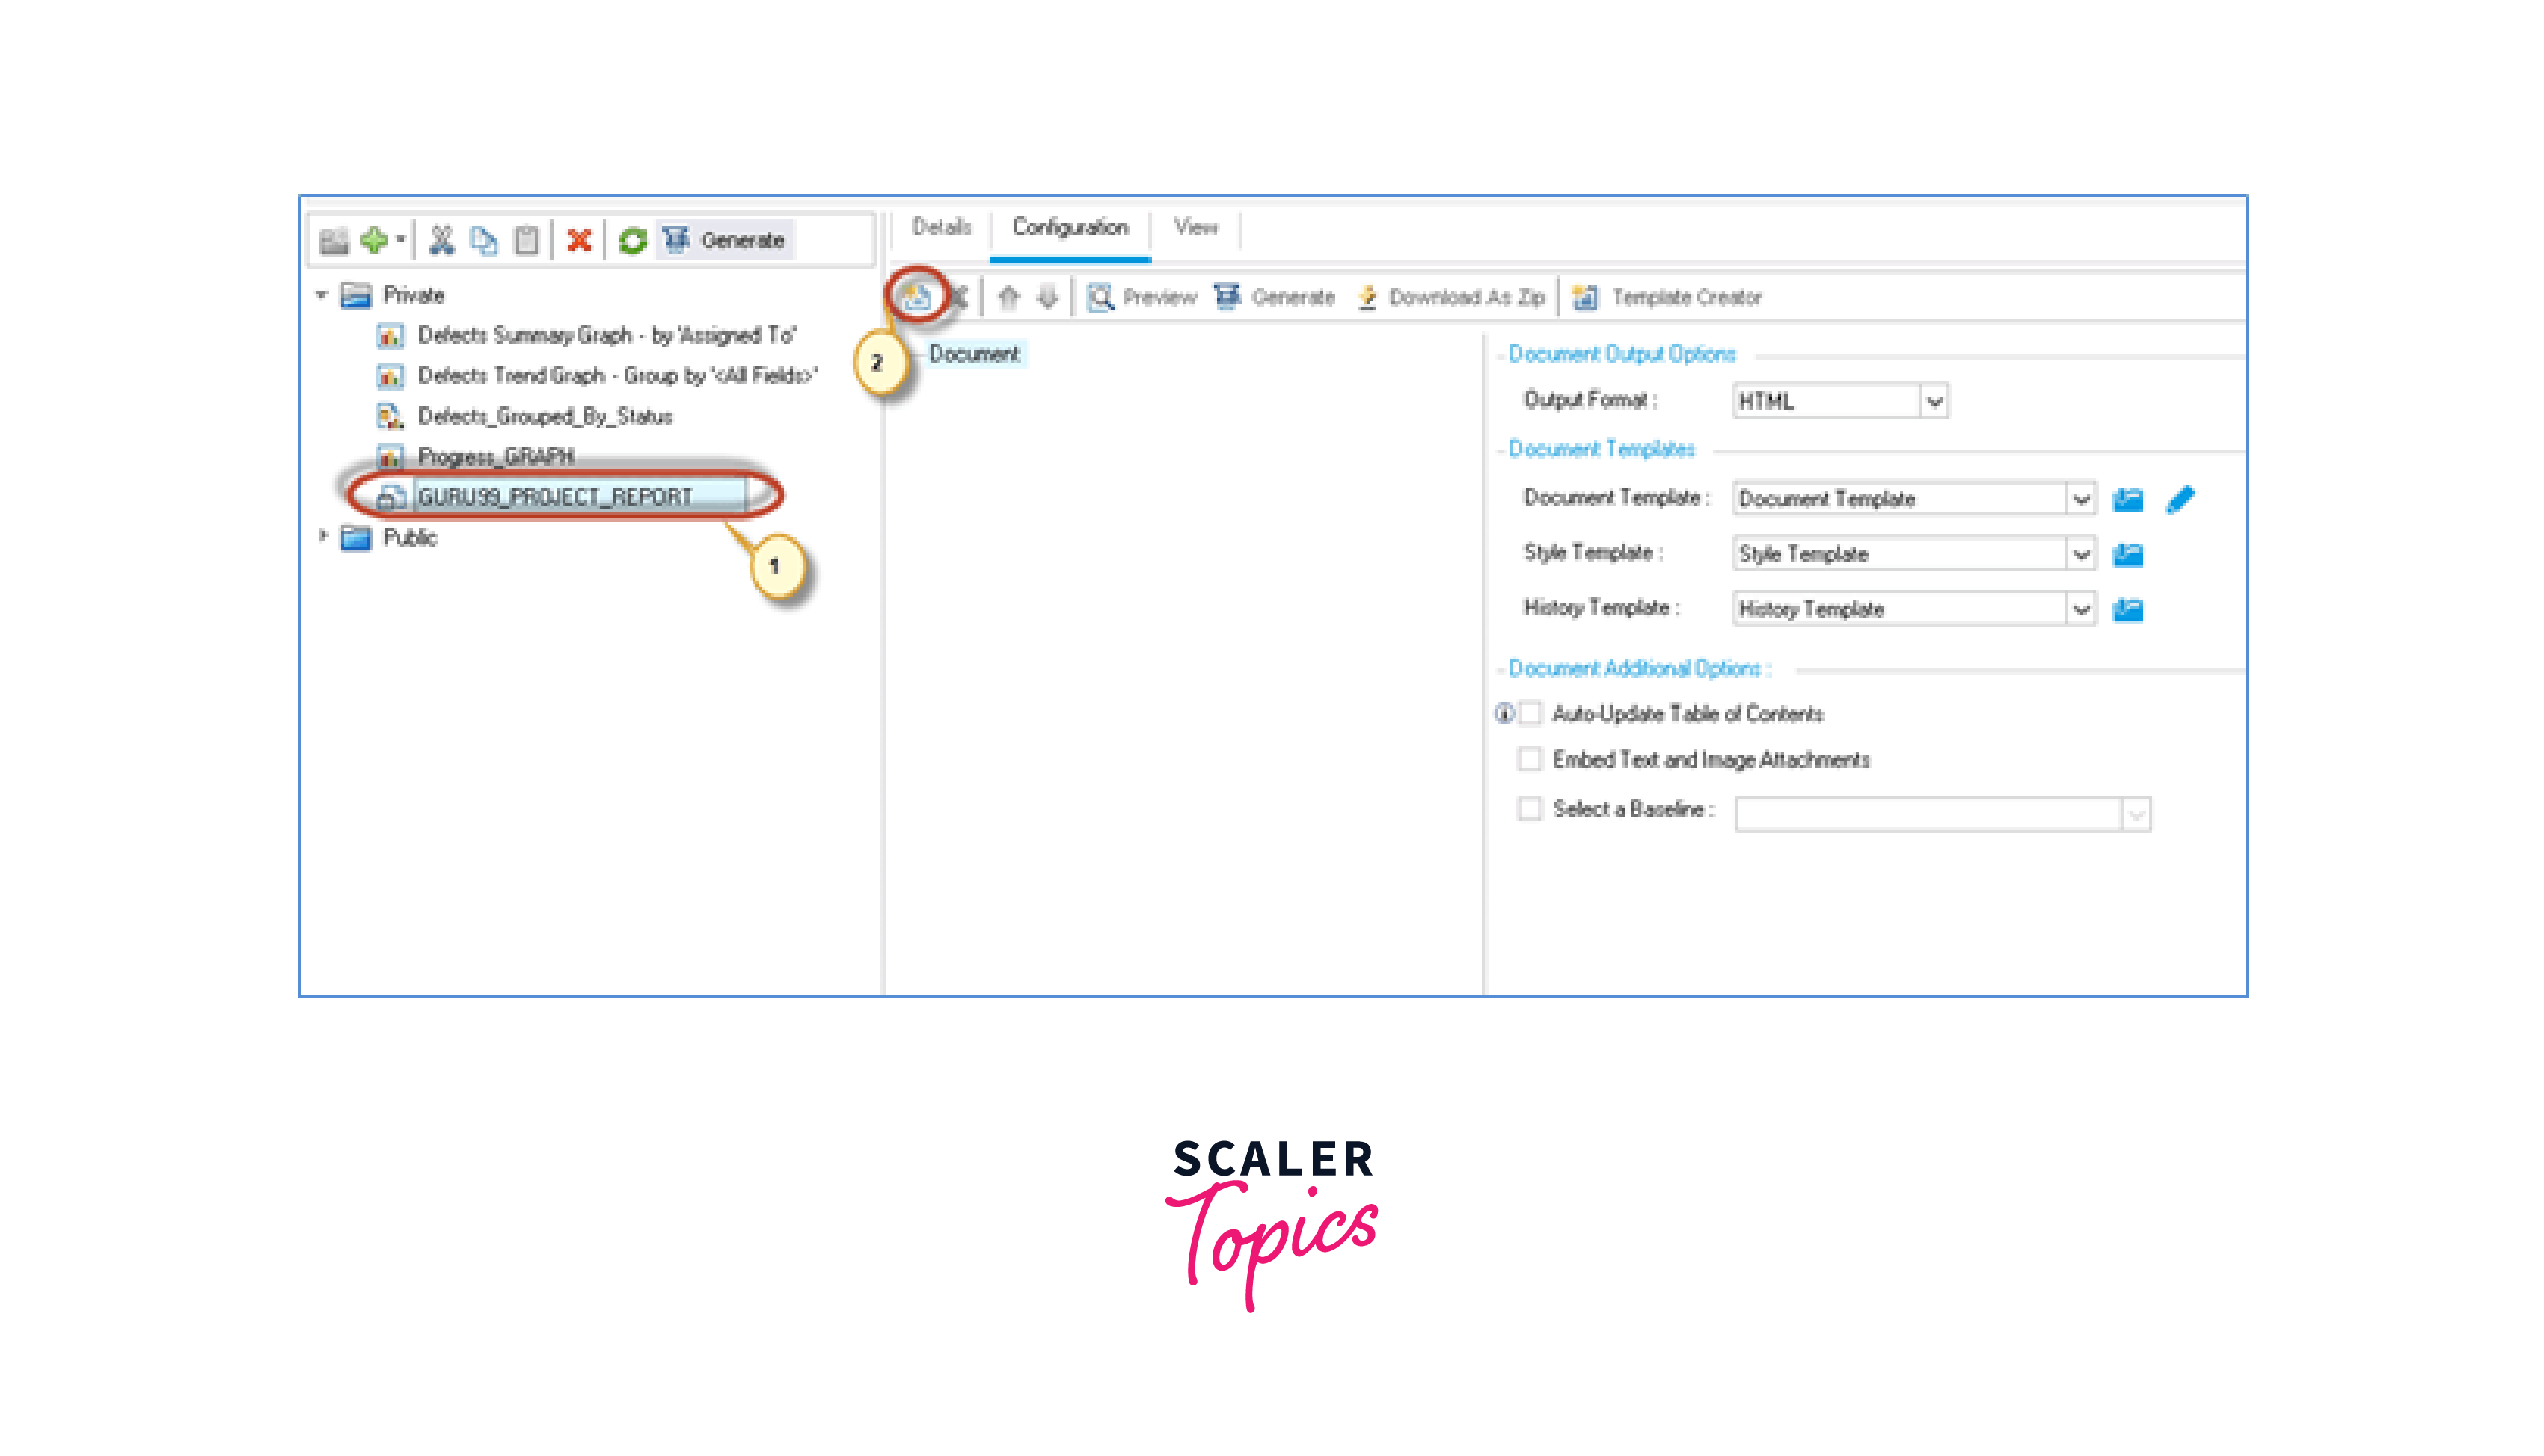
Step 3: The modifications will be displayed on the screen as demonstrated, and a project report is currently being generated. Click on the "Add Report Section" option to proceed.
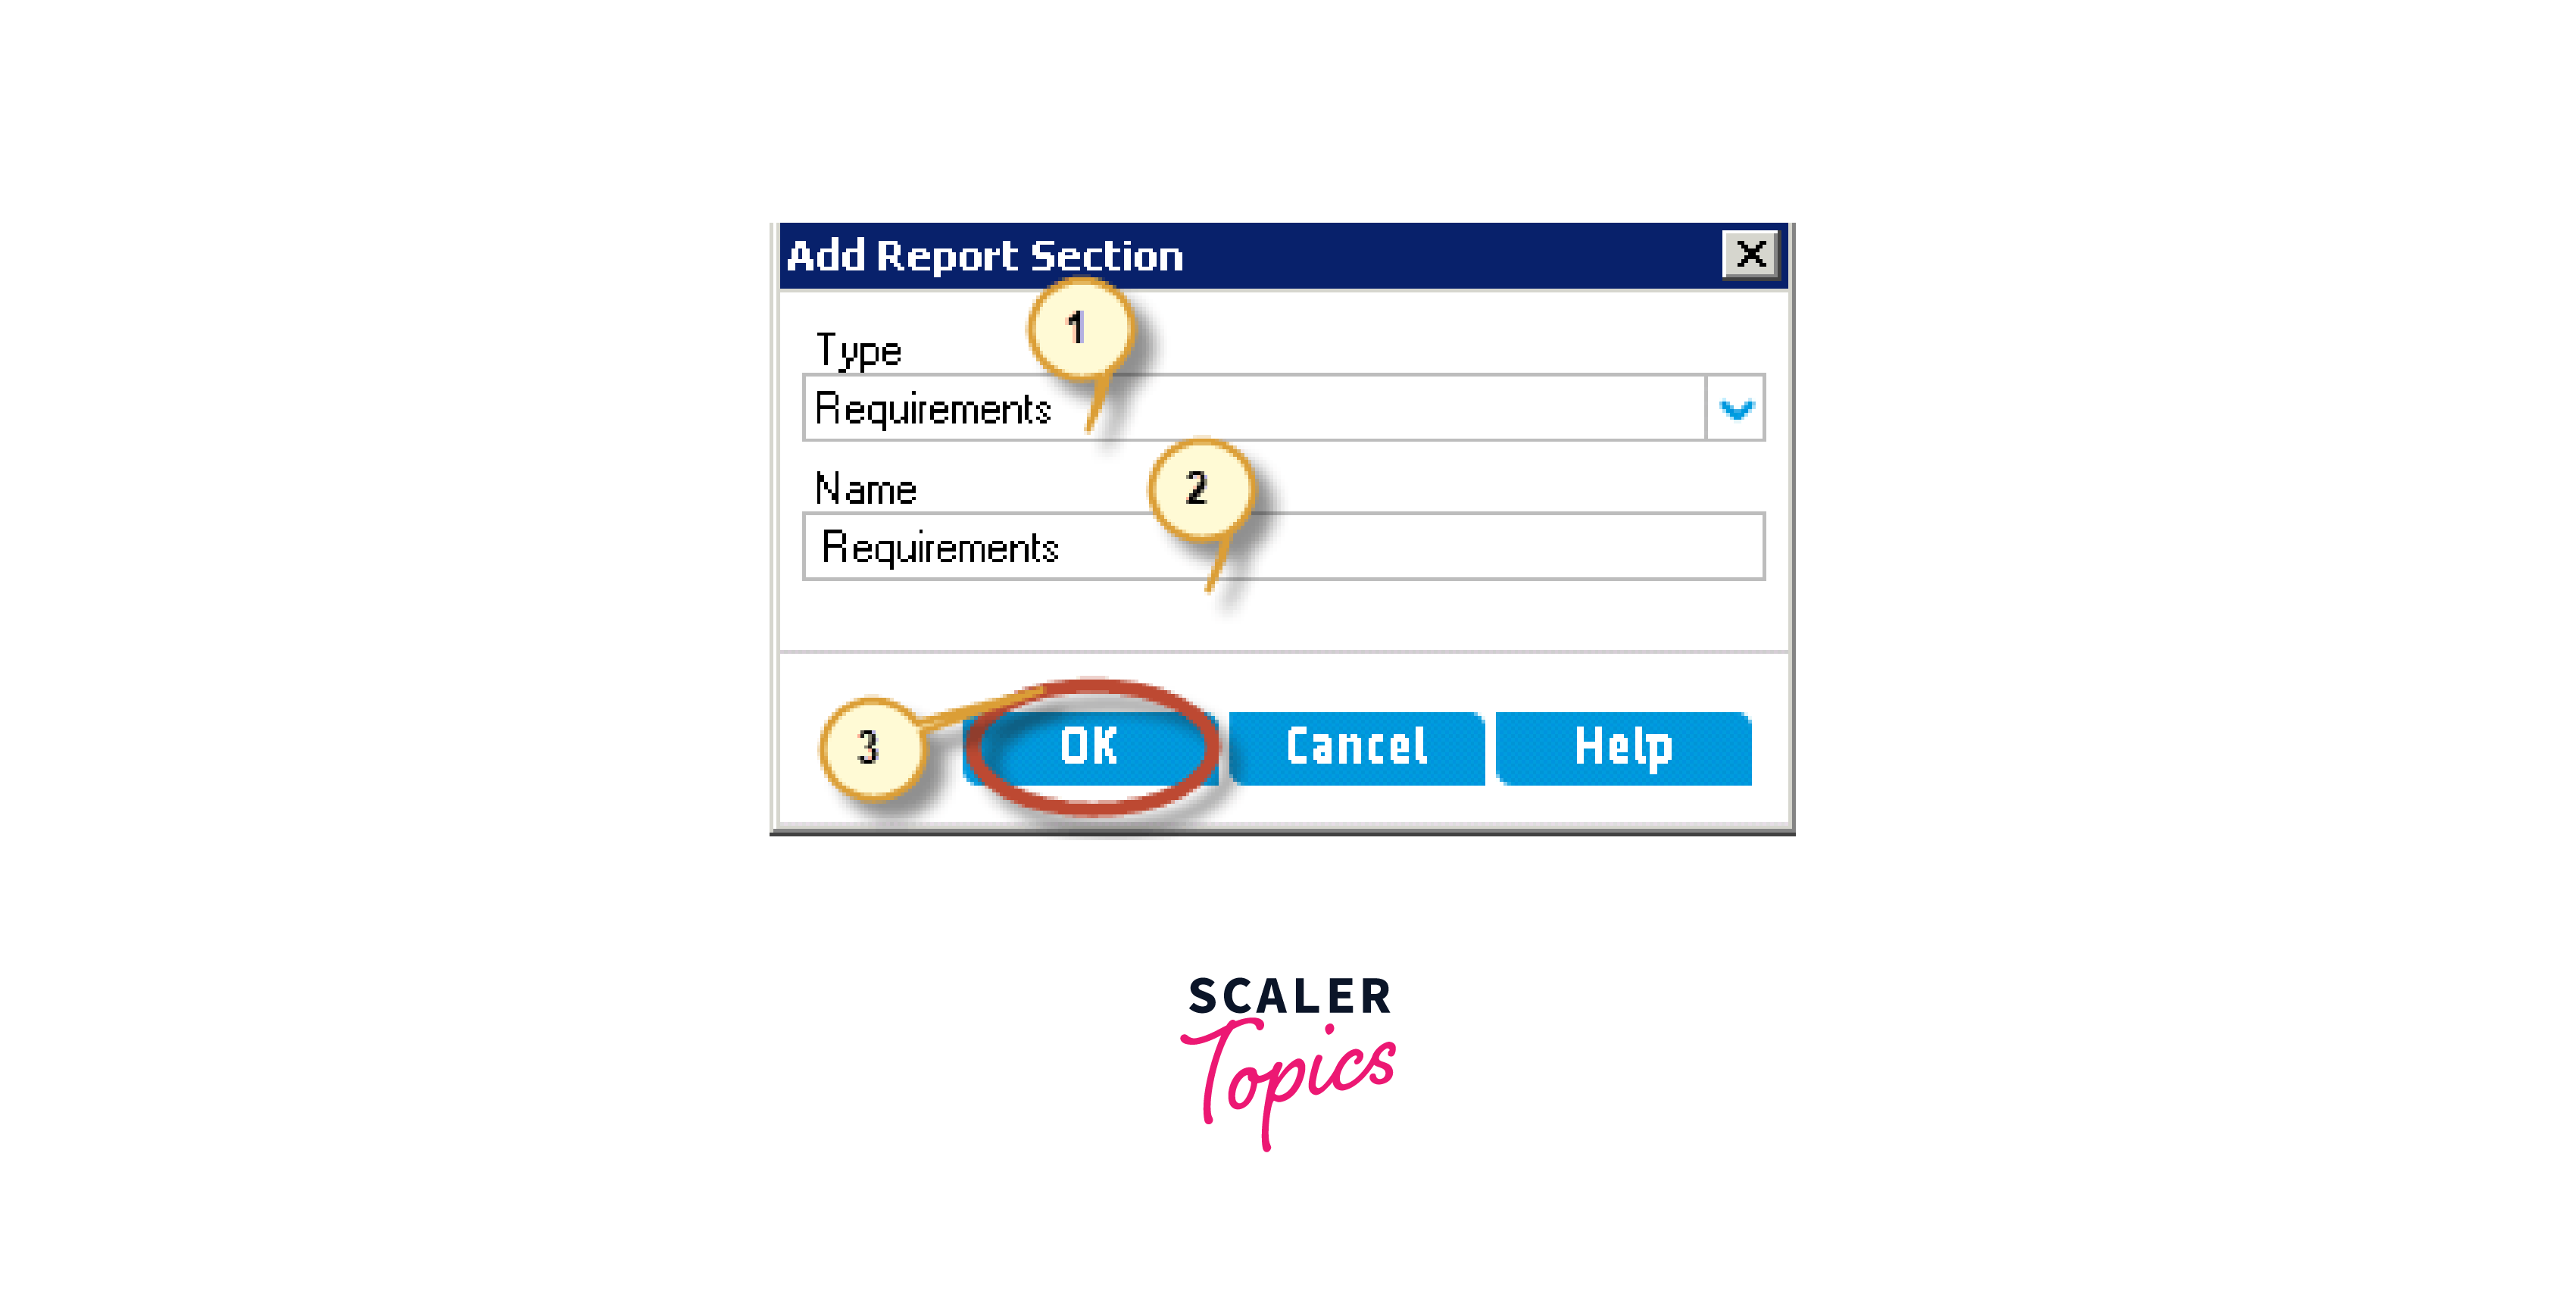
Step 4: Add report window will appear.
- The user needs to input the particular kind of section they desire to include.
- Fill a disk name
- Click the "OK" button.
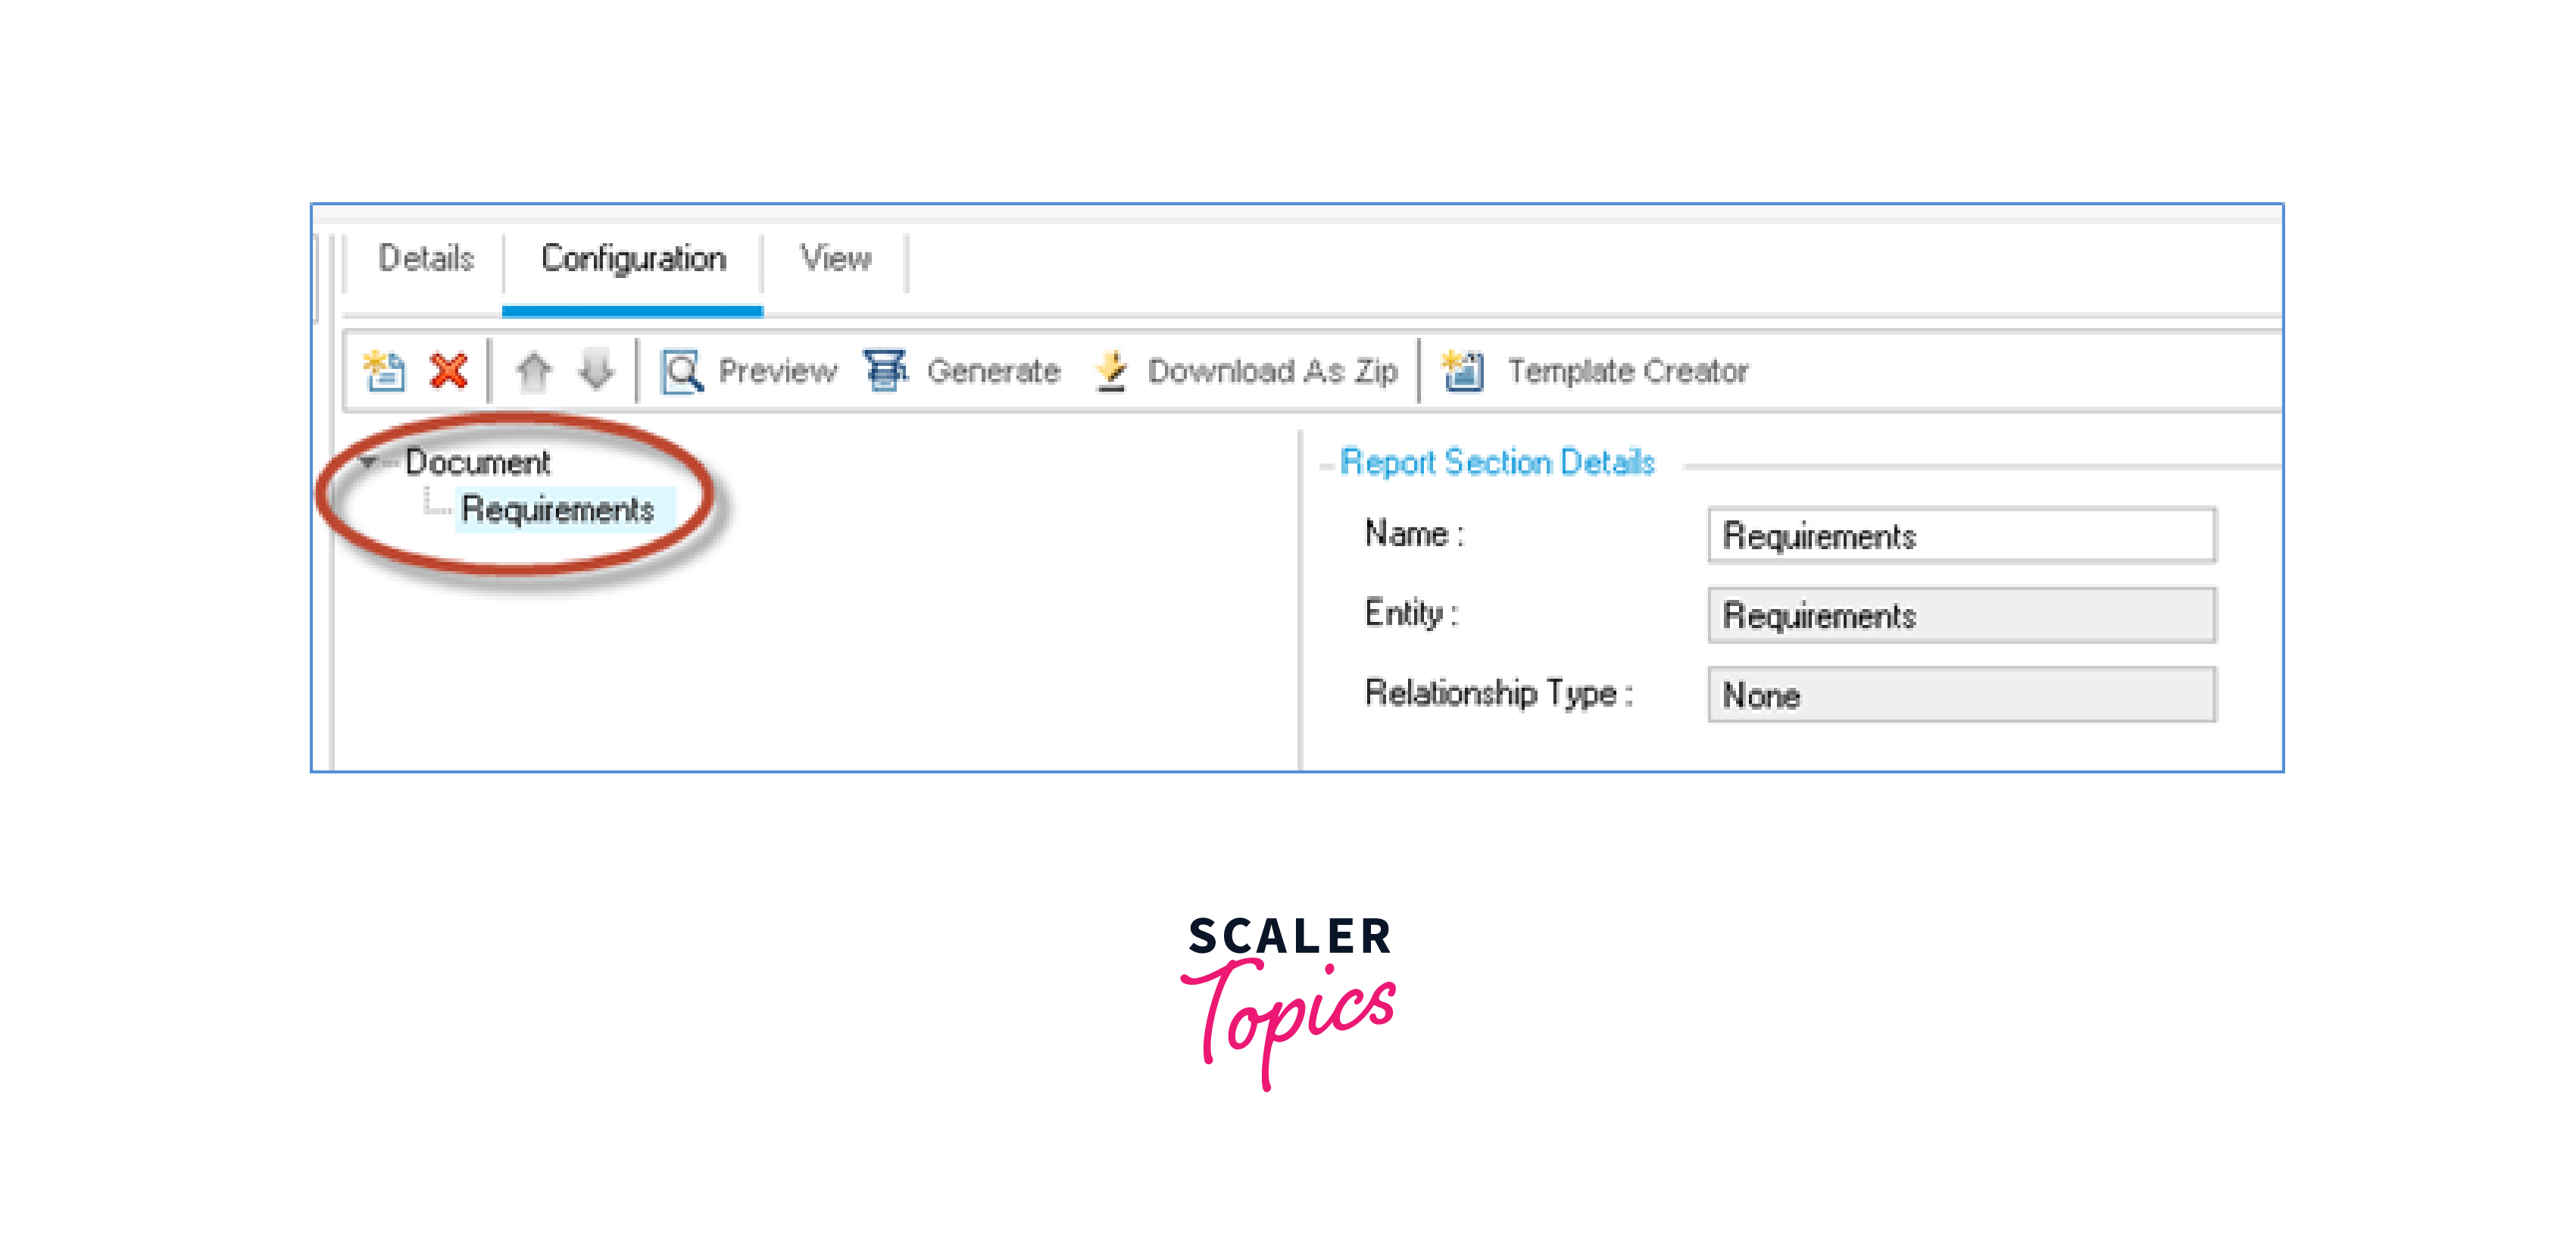
Step 5: The report will now include the section named "Requirement".
Step 6: Now let's add the test report section.
- Click "Add Report Section".
- From the "Add Report Section" dialog box, select "Report Type" to add.
- Enter a name for the report section. Click the 'OK' button.

Step 7: A report section called "Tests" will be added as shown below.

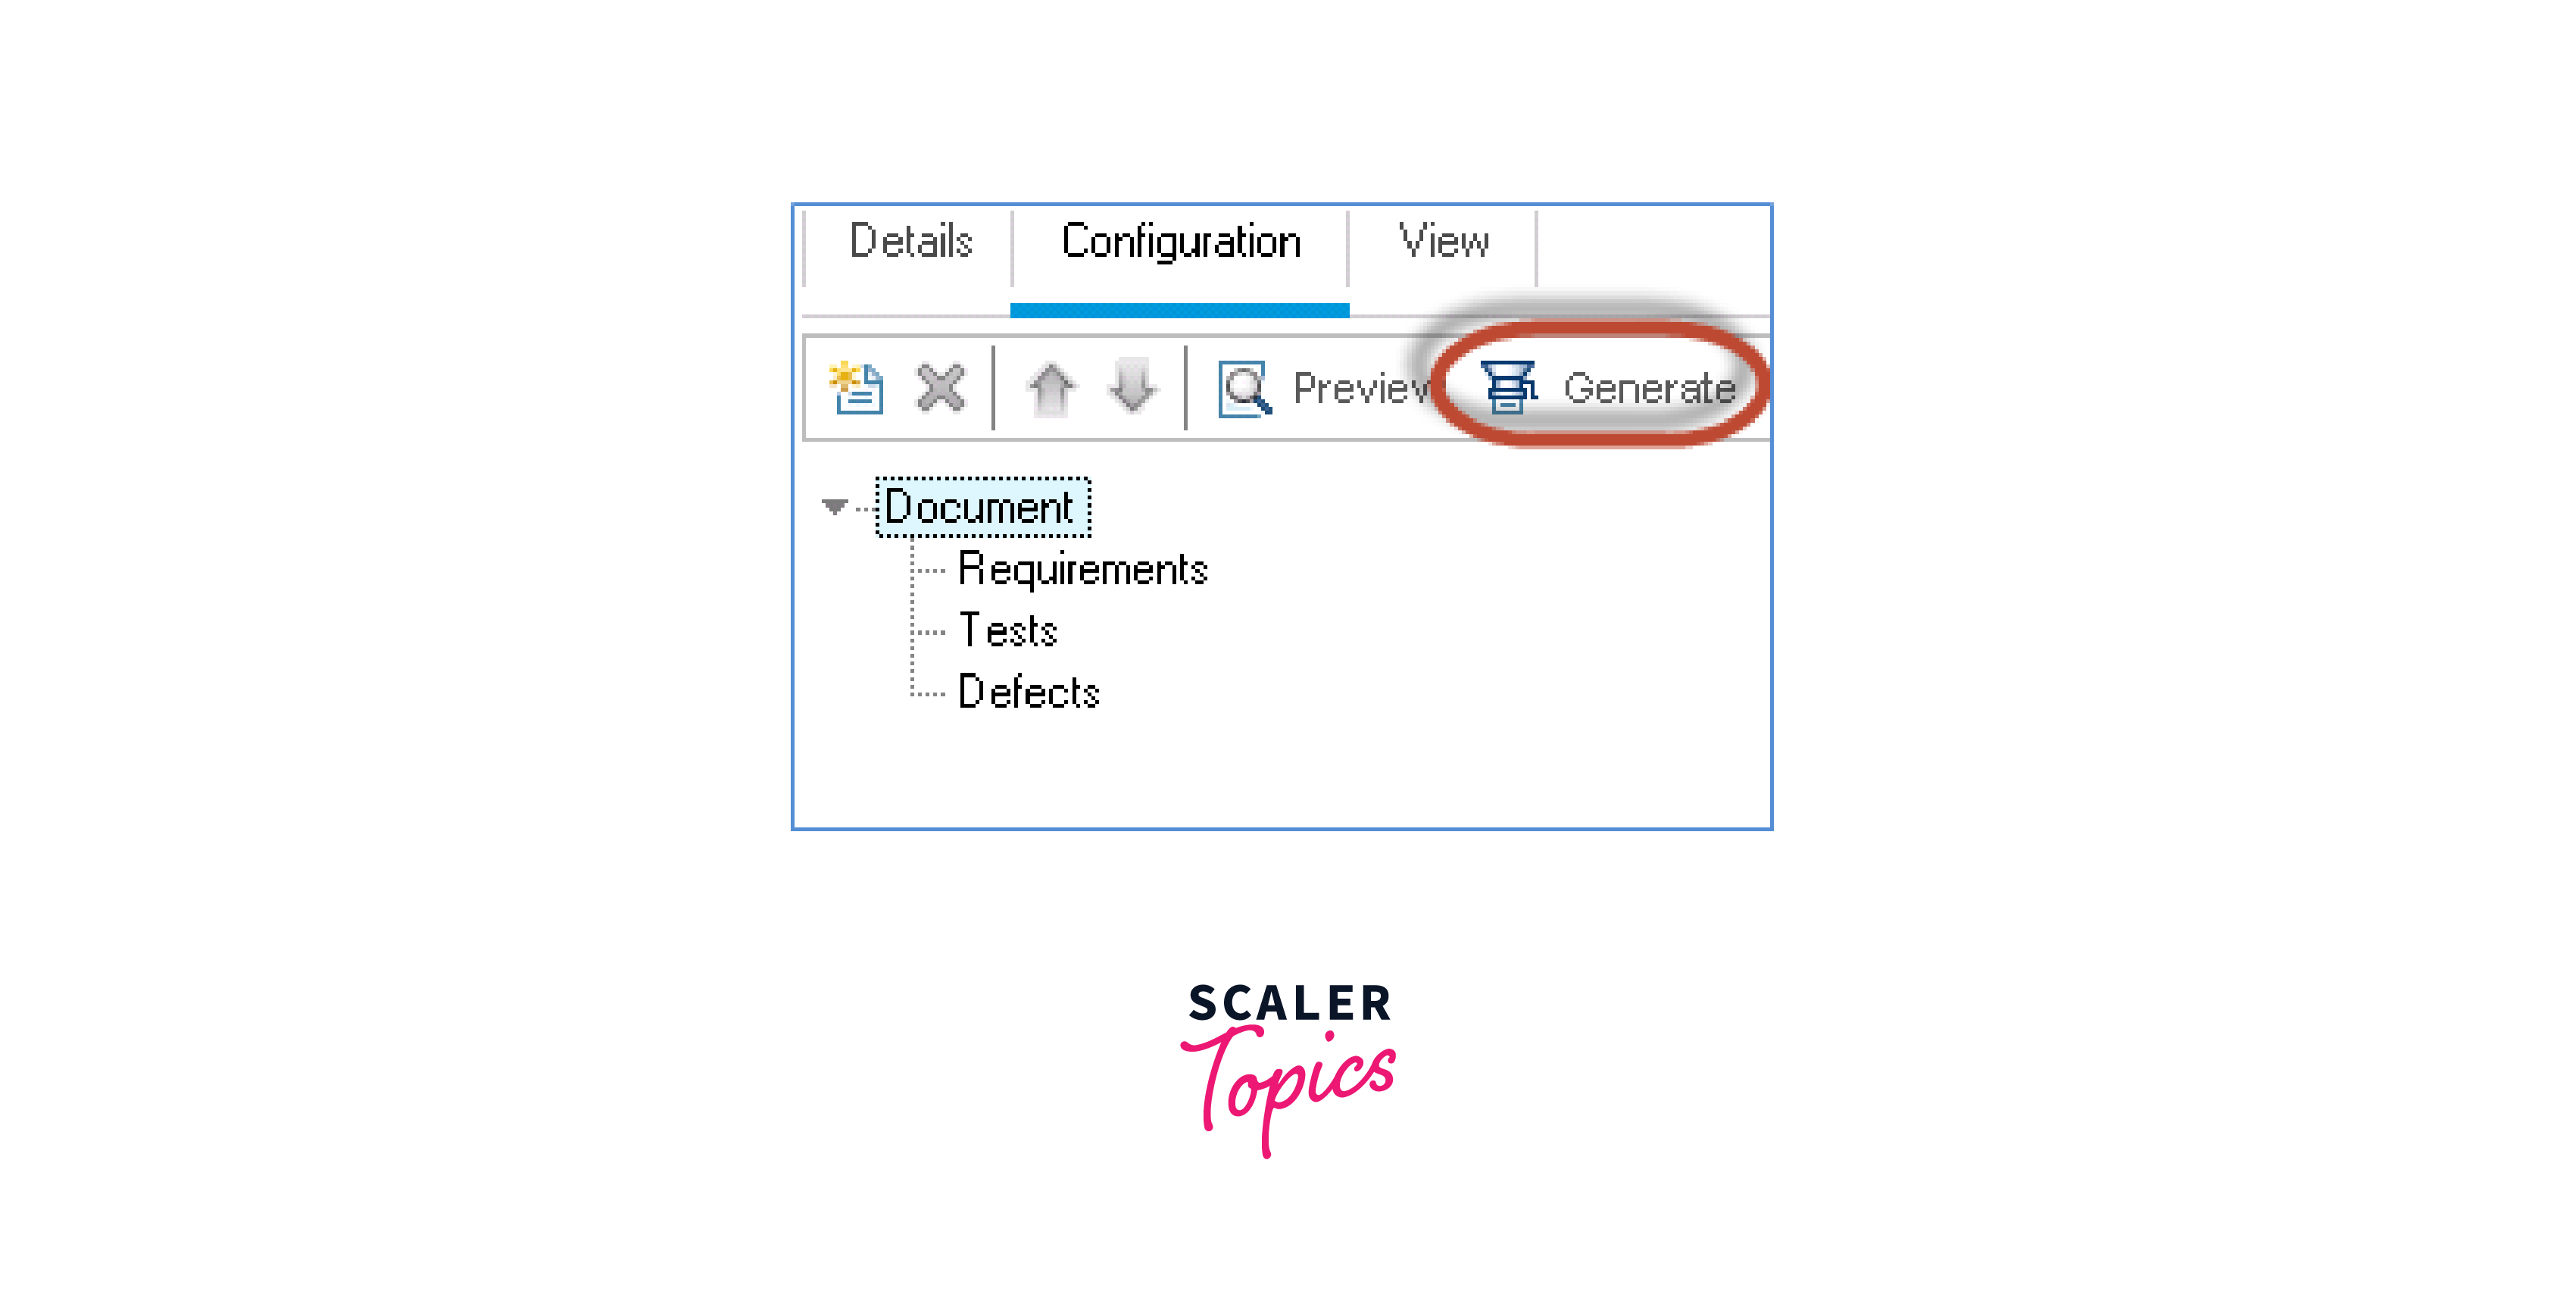
Step 8: Similarly create the error section and the layout of the final report will be as shown in the image below. After adding, click "Generate".
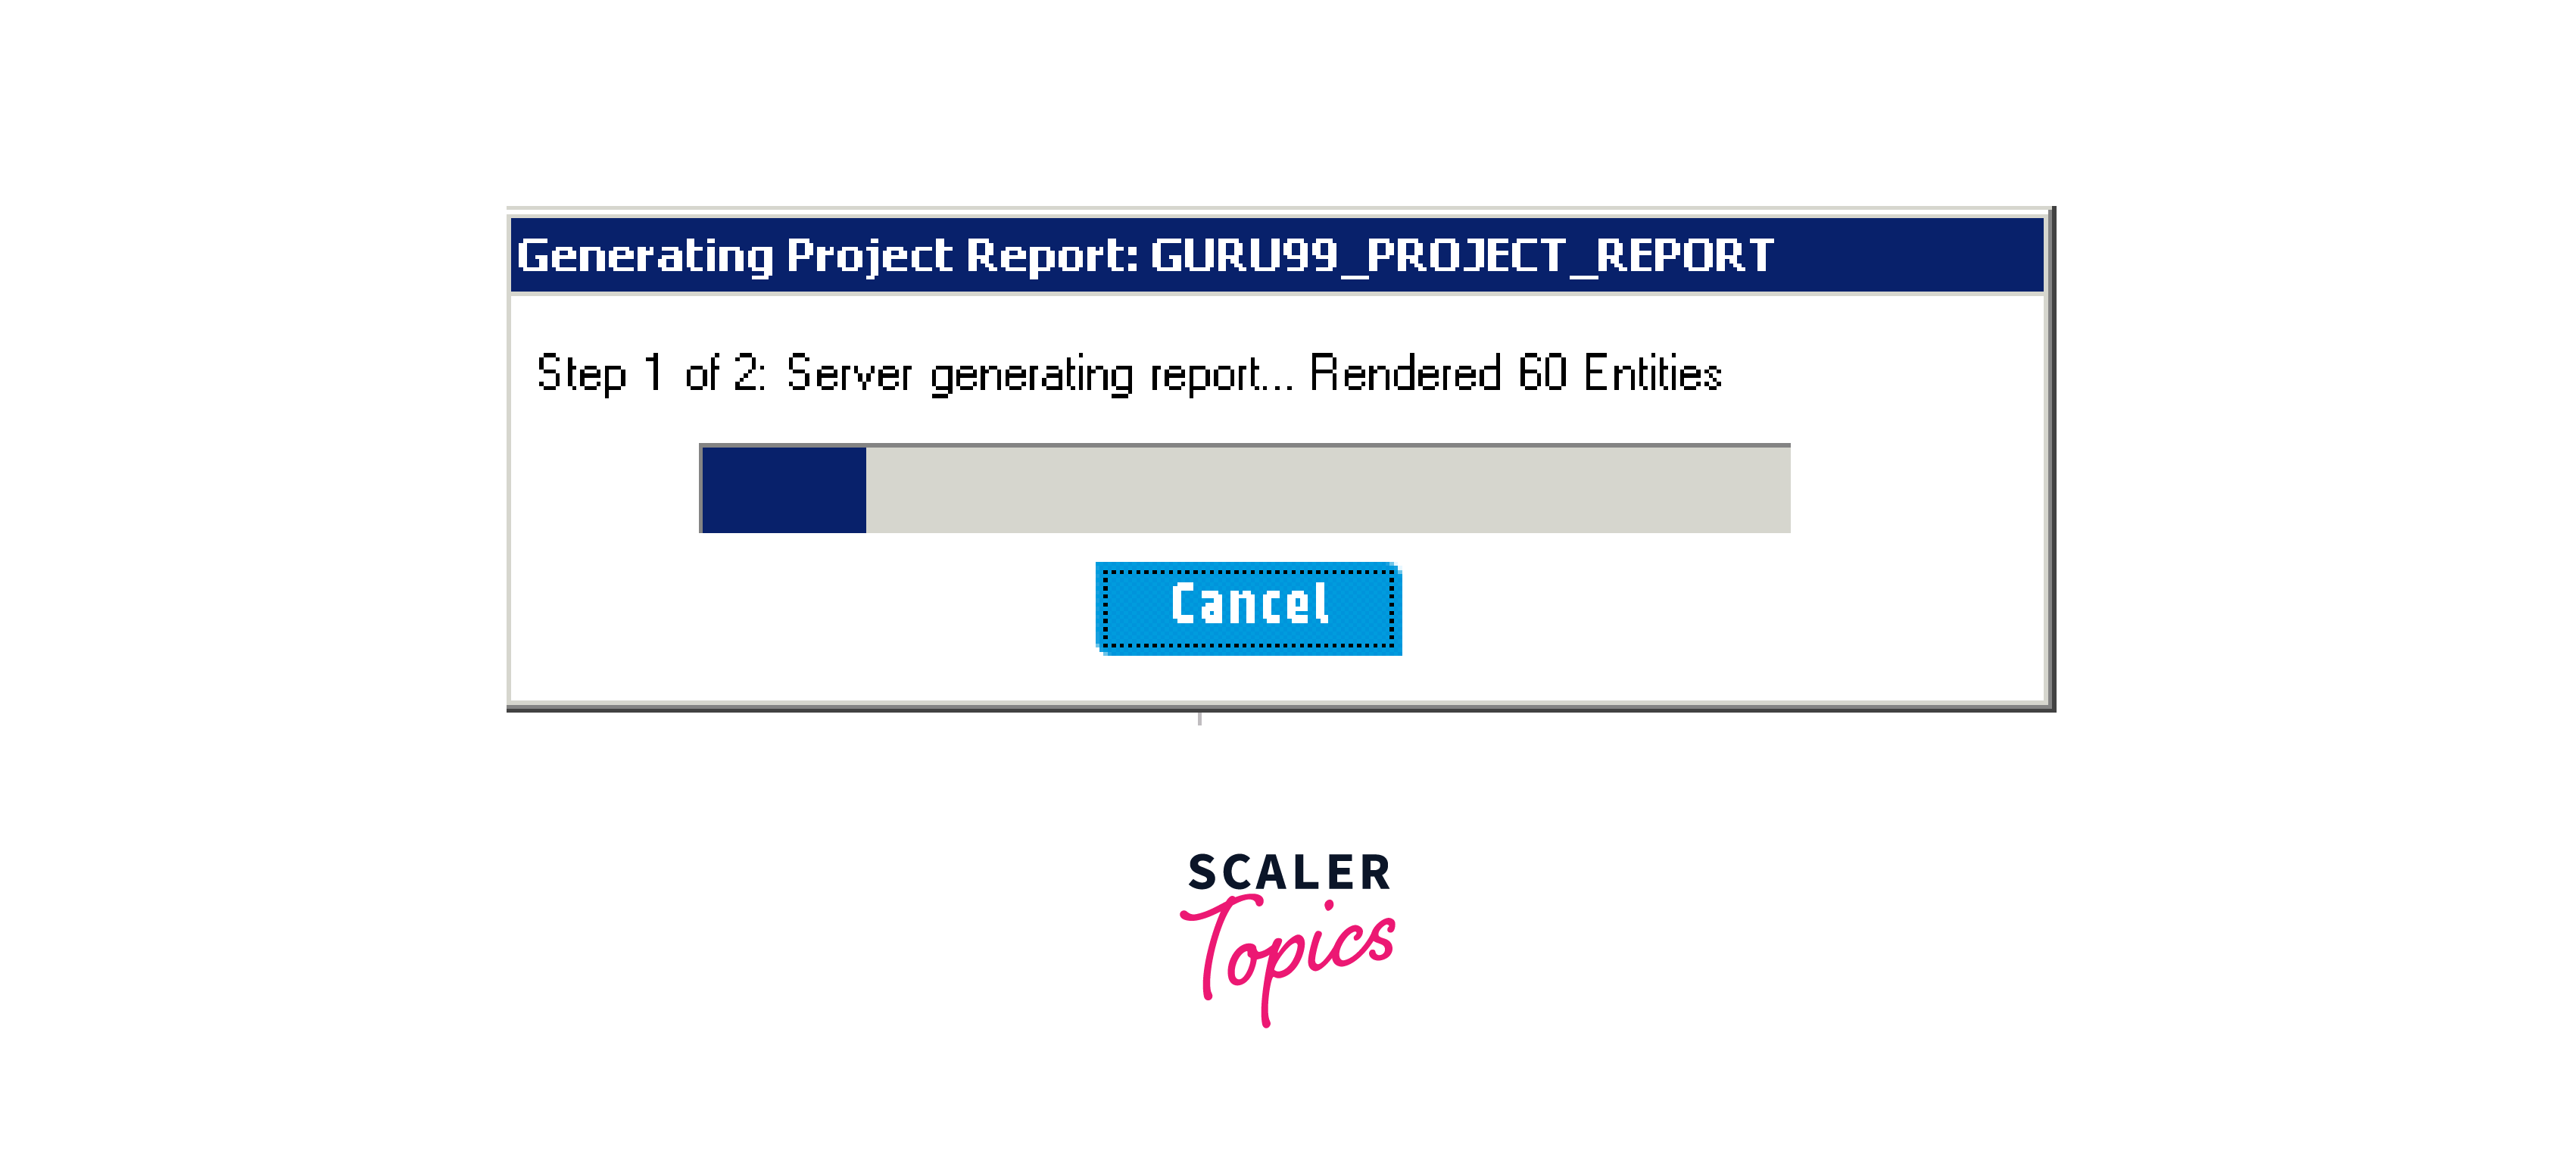
Step 9: The report is generated when connecting to the server.
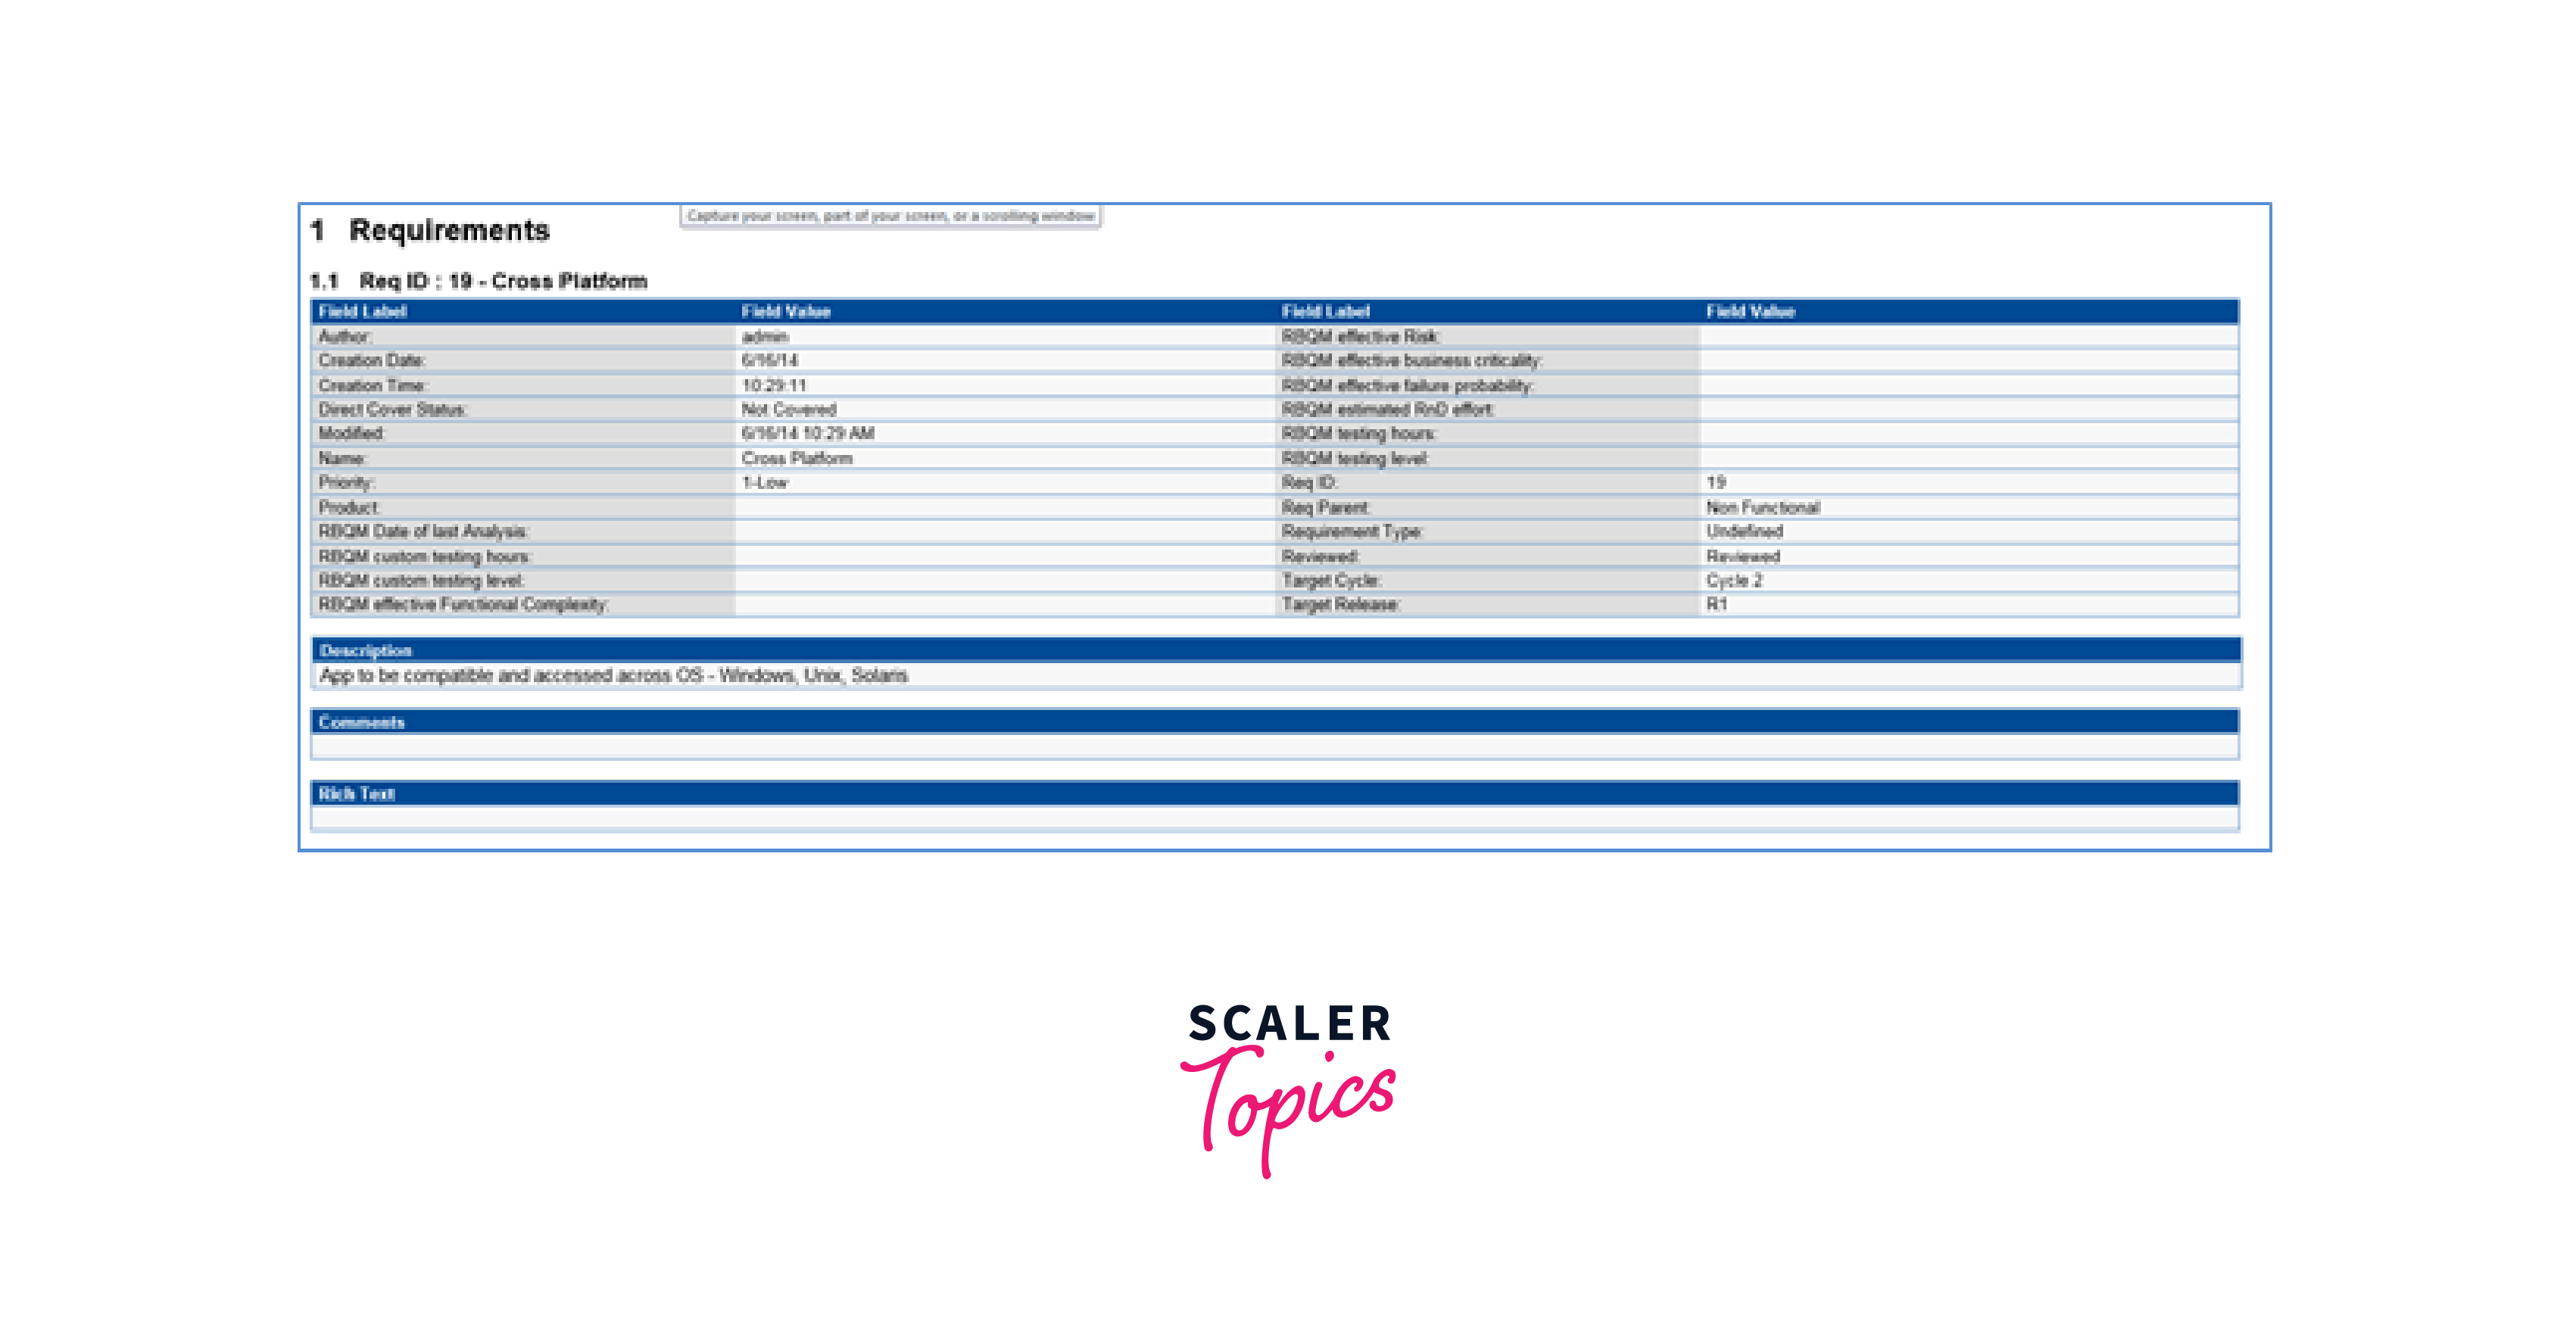
Step 10: The user can generate the project report according to their preferences, and save project report from the generated window. If the report is in doc or docx format, it can be saved through MS Word, while HTML format can be saved through the relevant browser. If the report is in PDF format, it can be saved via a PDF reader.
Dashboard
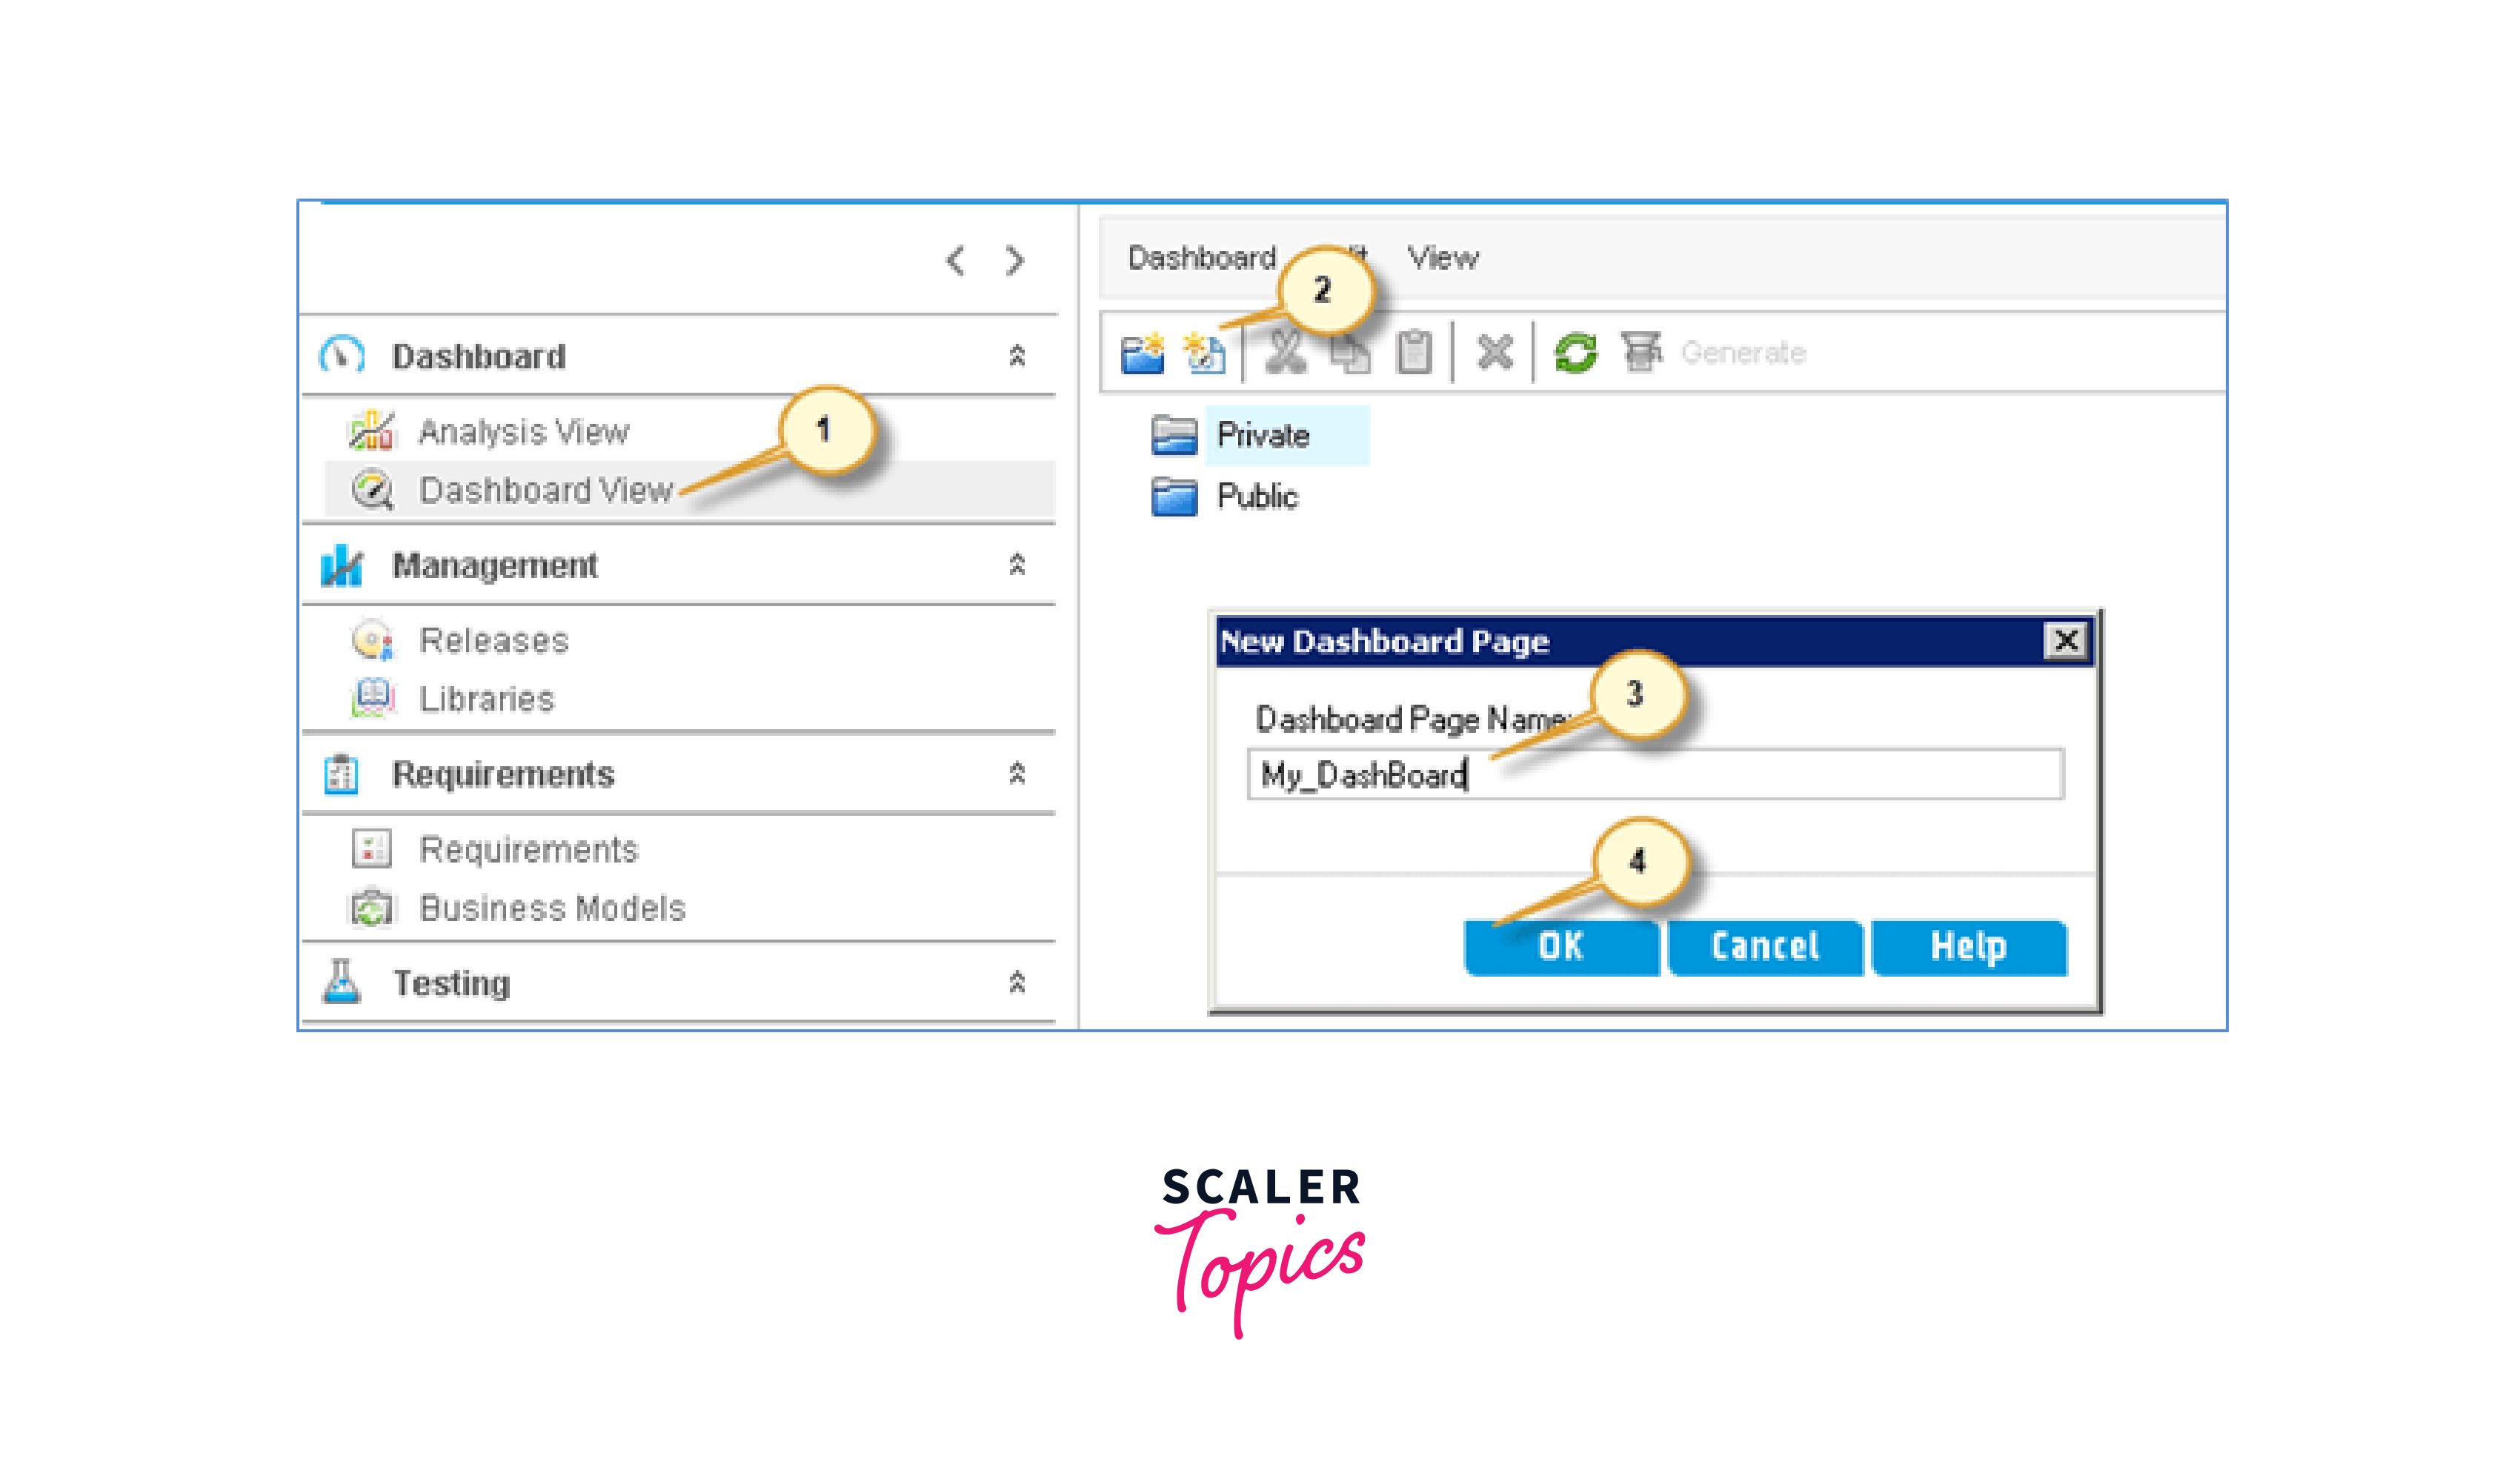
Step 1: For creating a dashboard page
- Click the Dashboard View button
- Click on the "New Dashboard Page" icon.
- The New Dashboard Page dialog box opens. Enter a dashboard page name.
- Click the "OK" button.
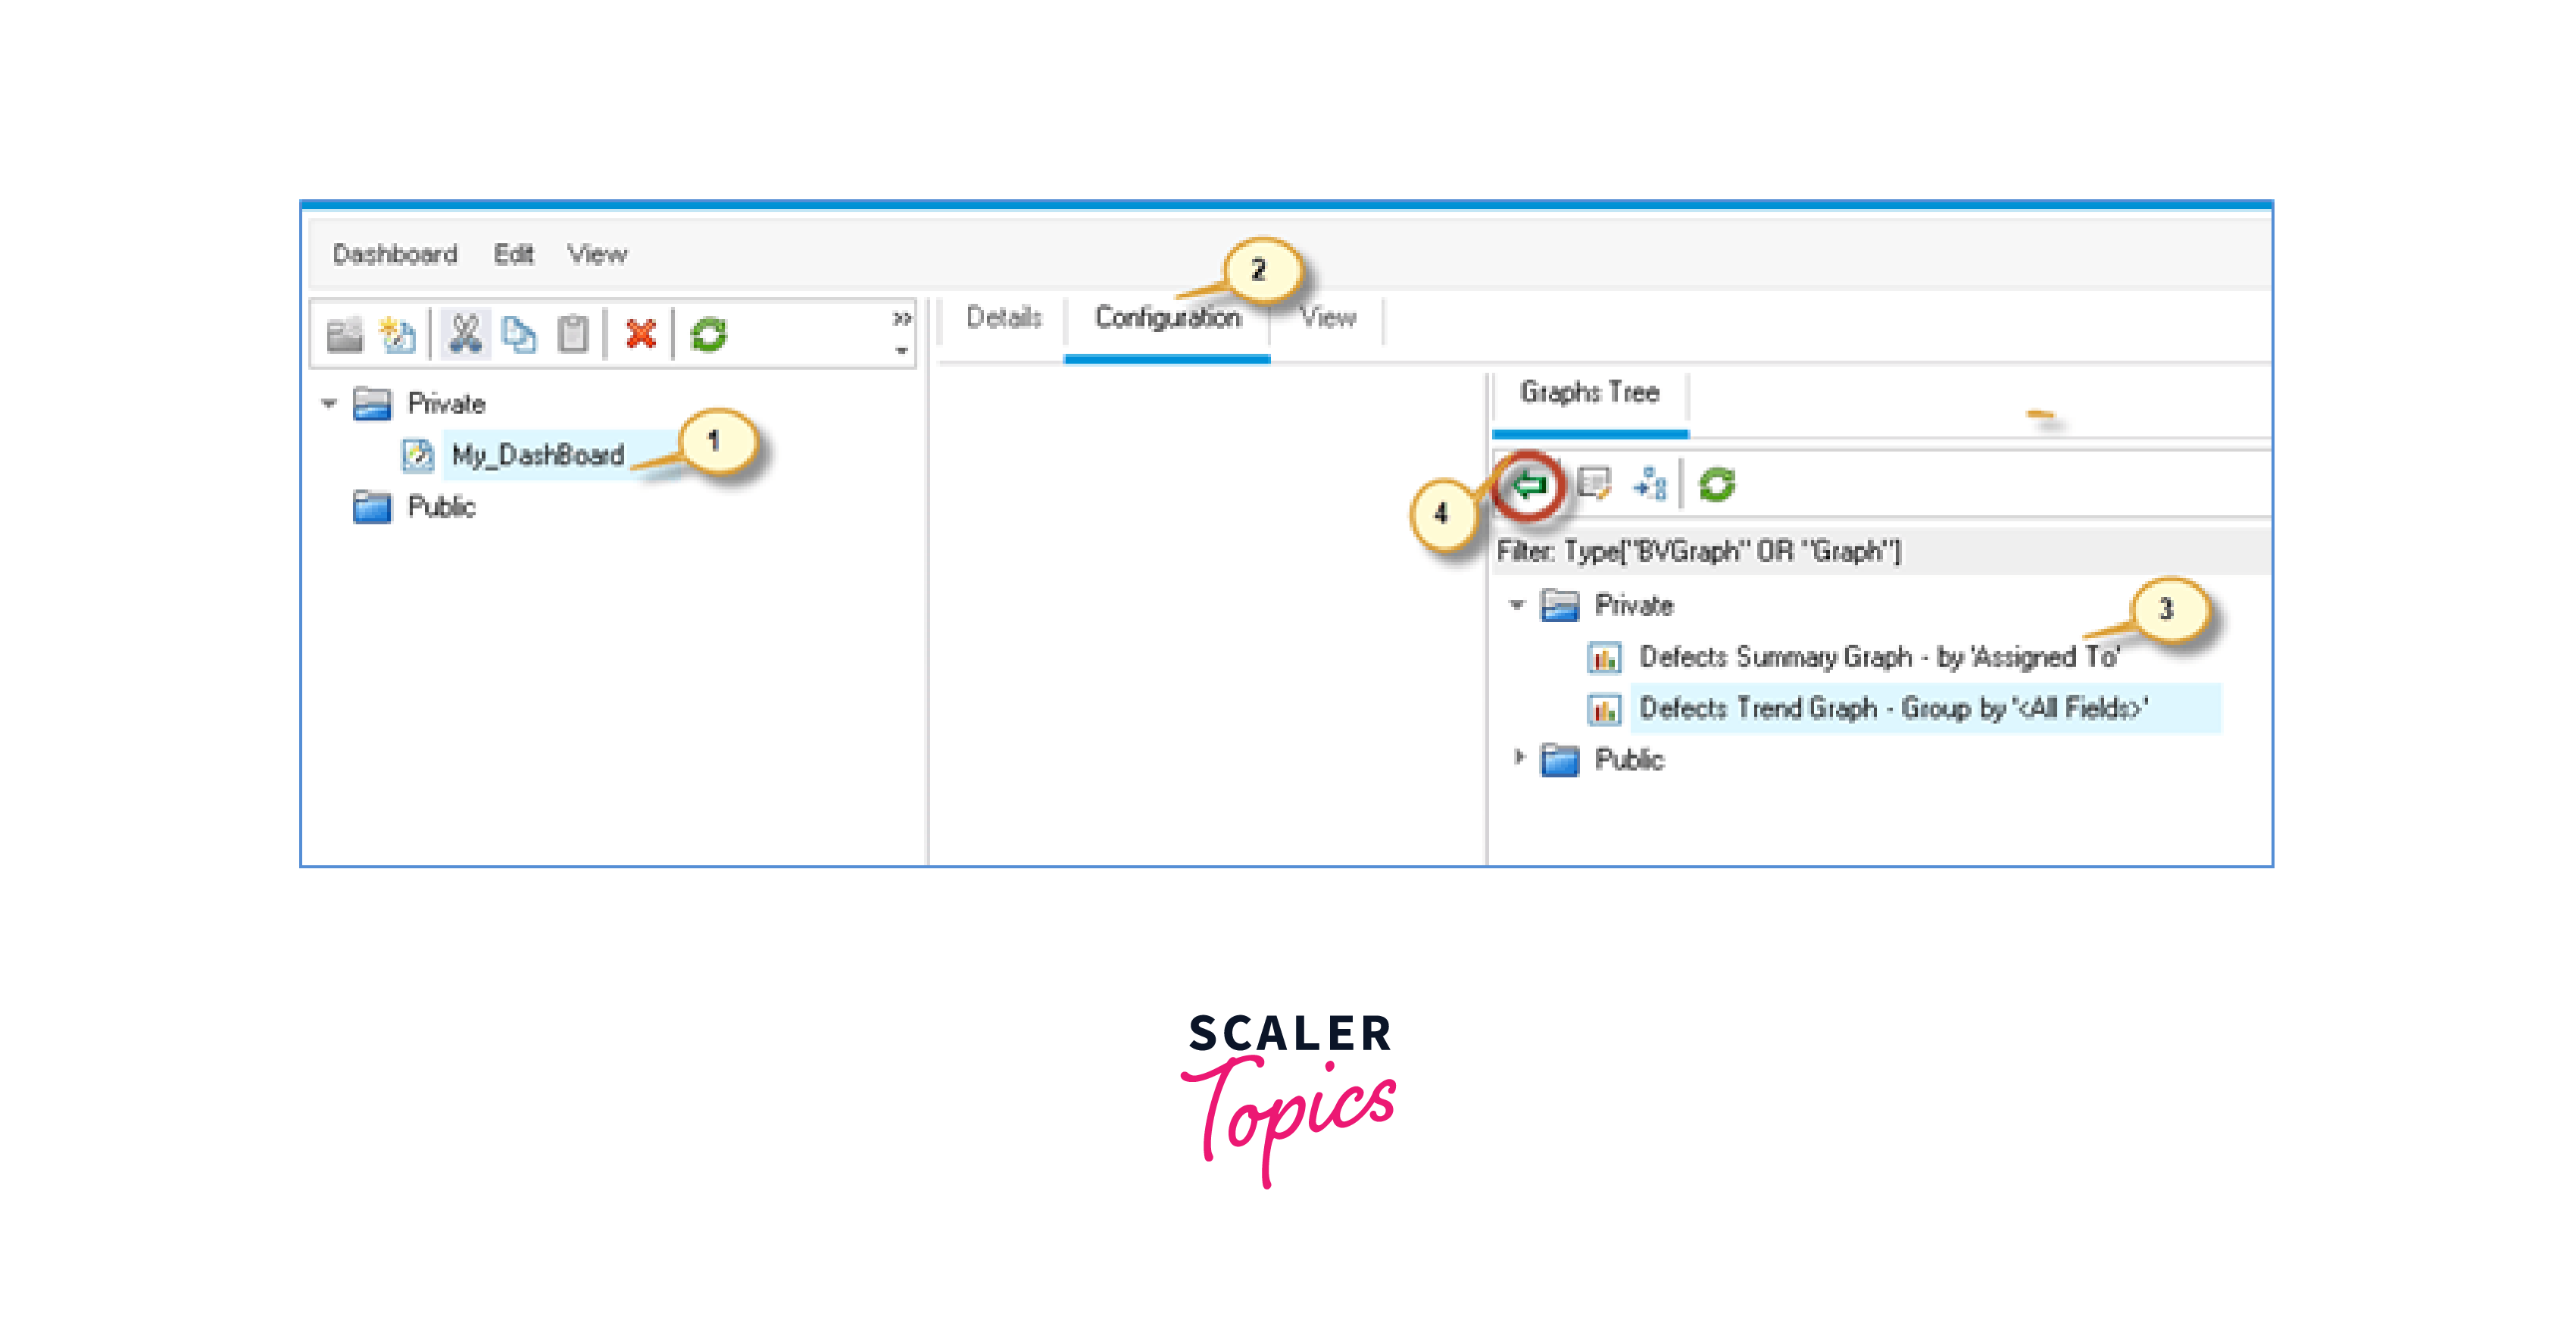
Step 2: The created panel will be displayed as shown below.
- Dashboard page created
- Click on "Settings". A graph tree is displayed where the user can select all graphs
- Click the "<=" button to add it to your dashboard page.
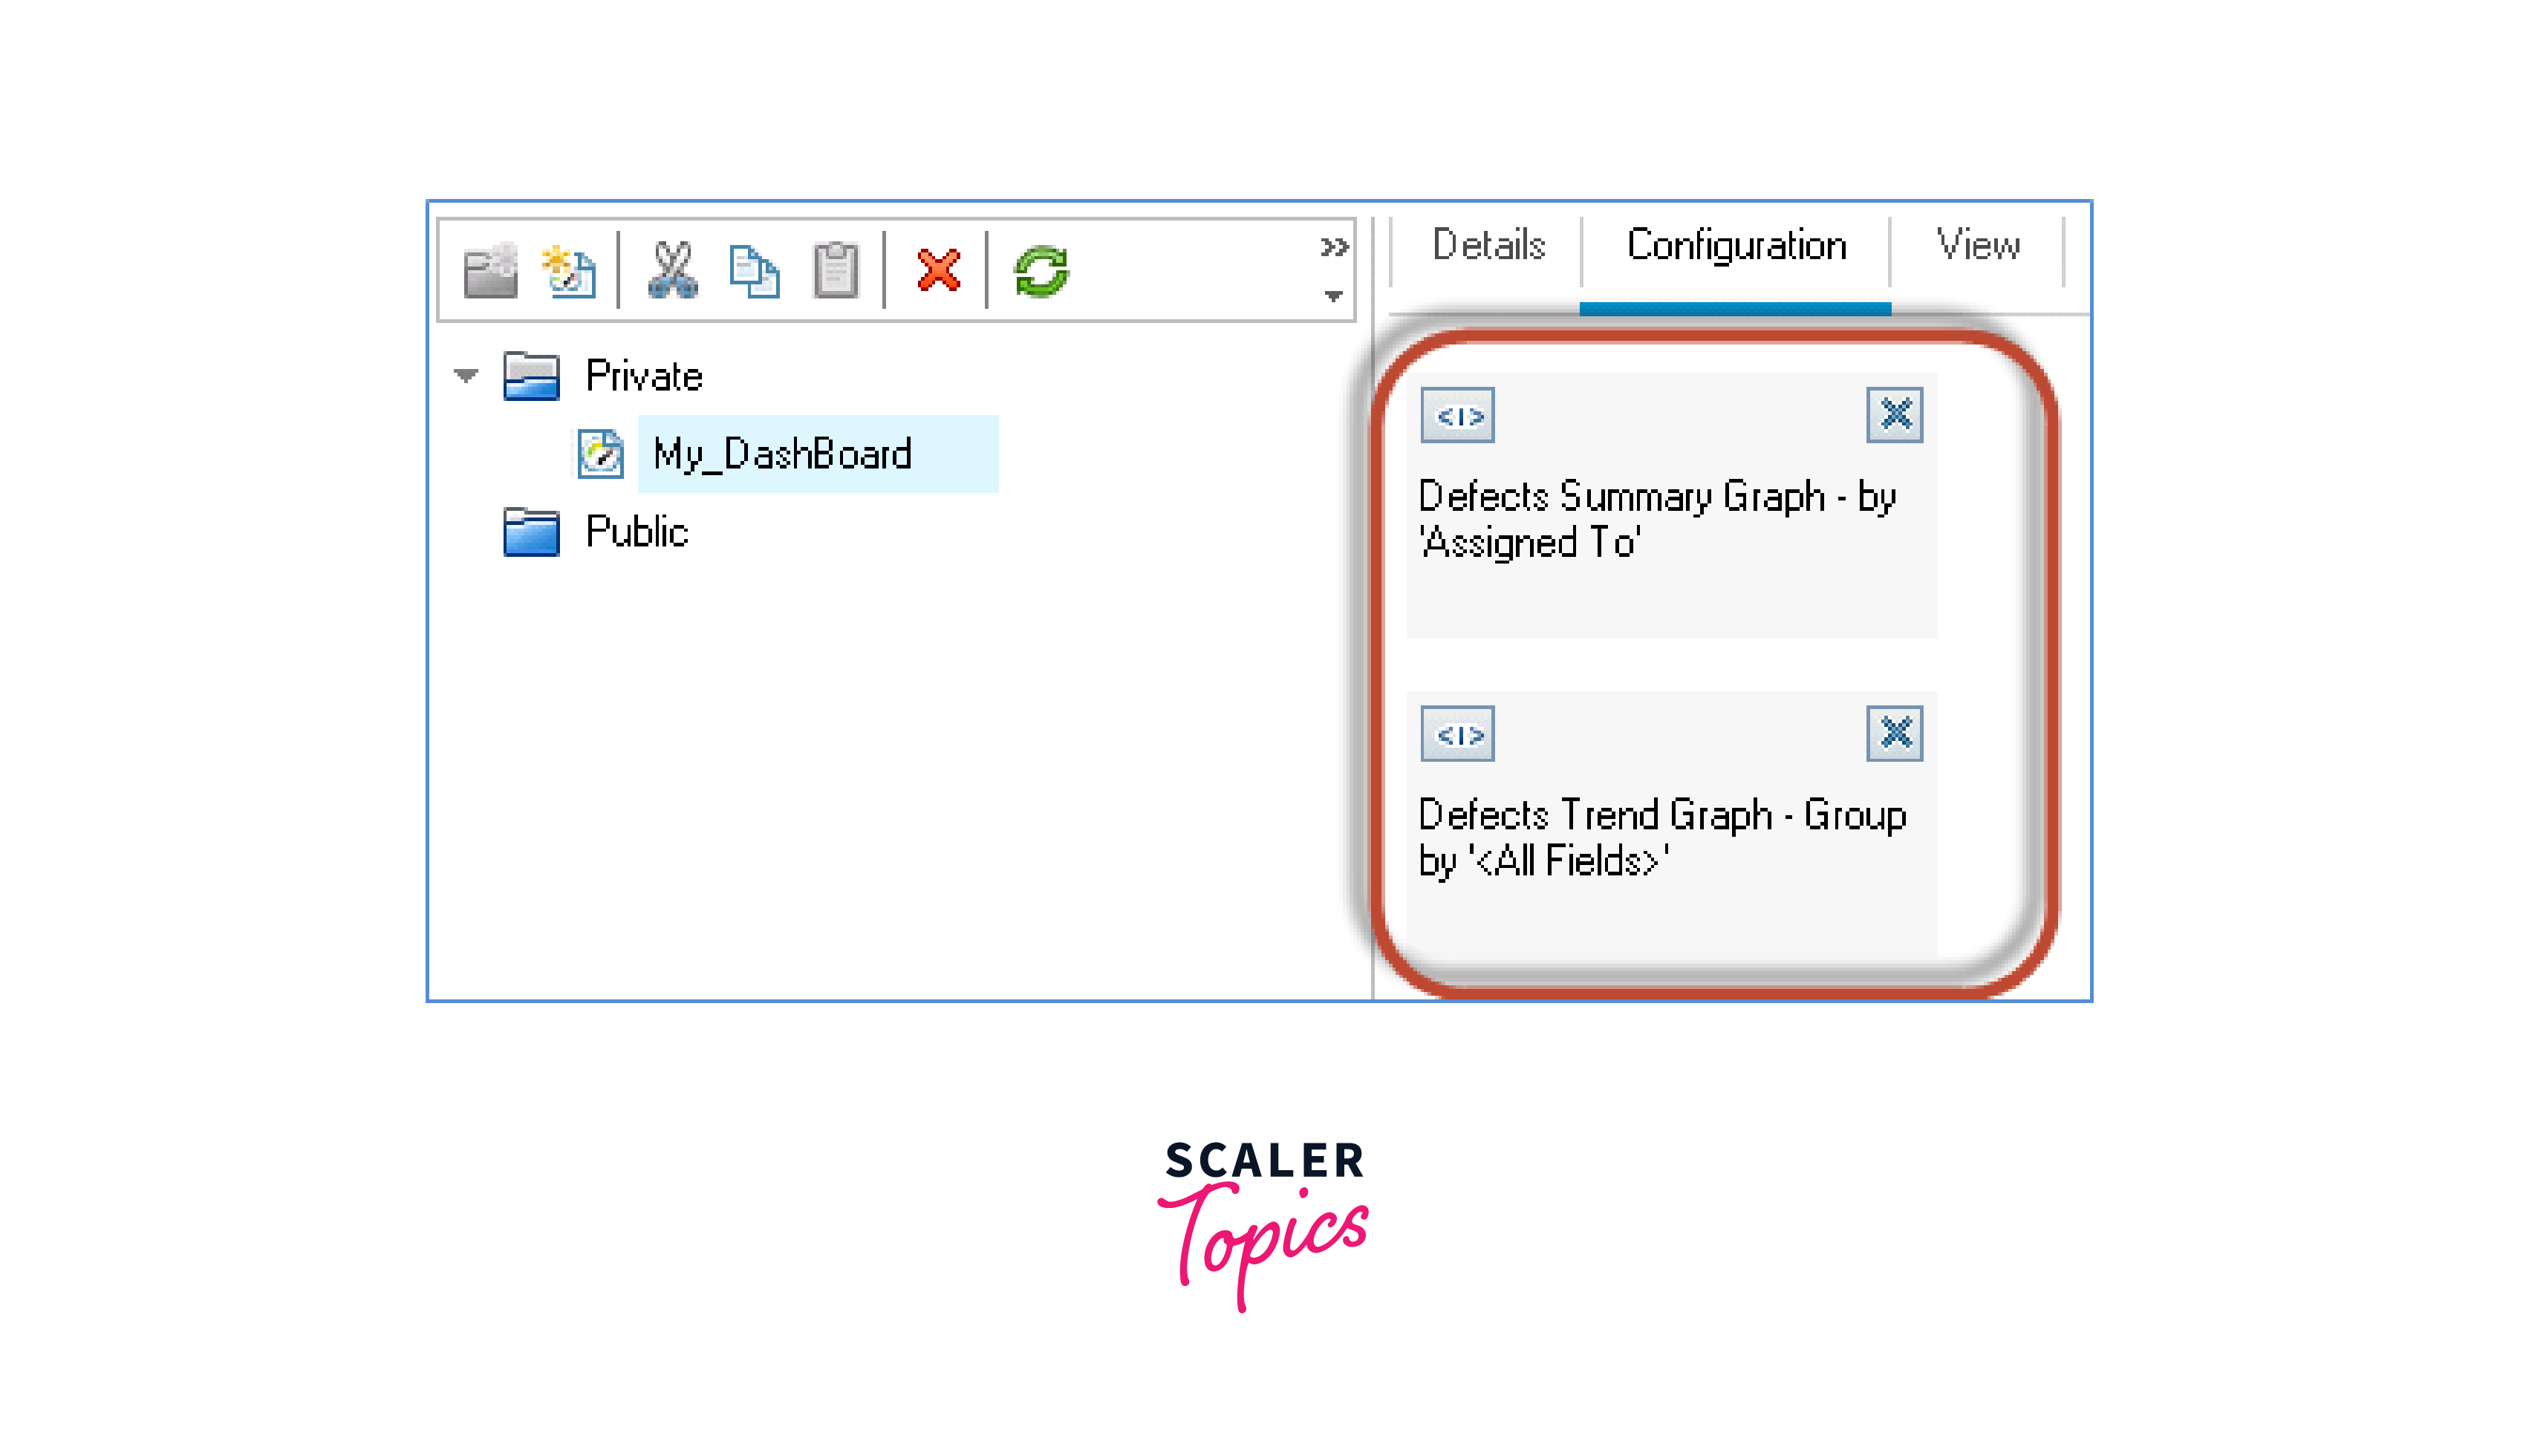
Step 3: The configuration should now display the selected graphics.
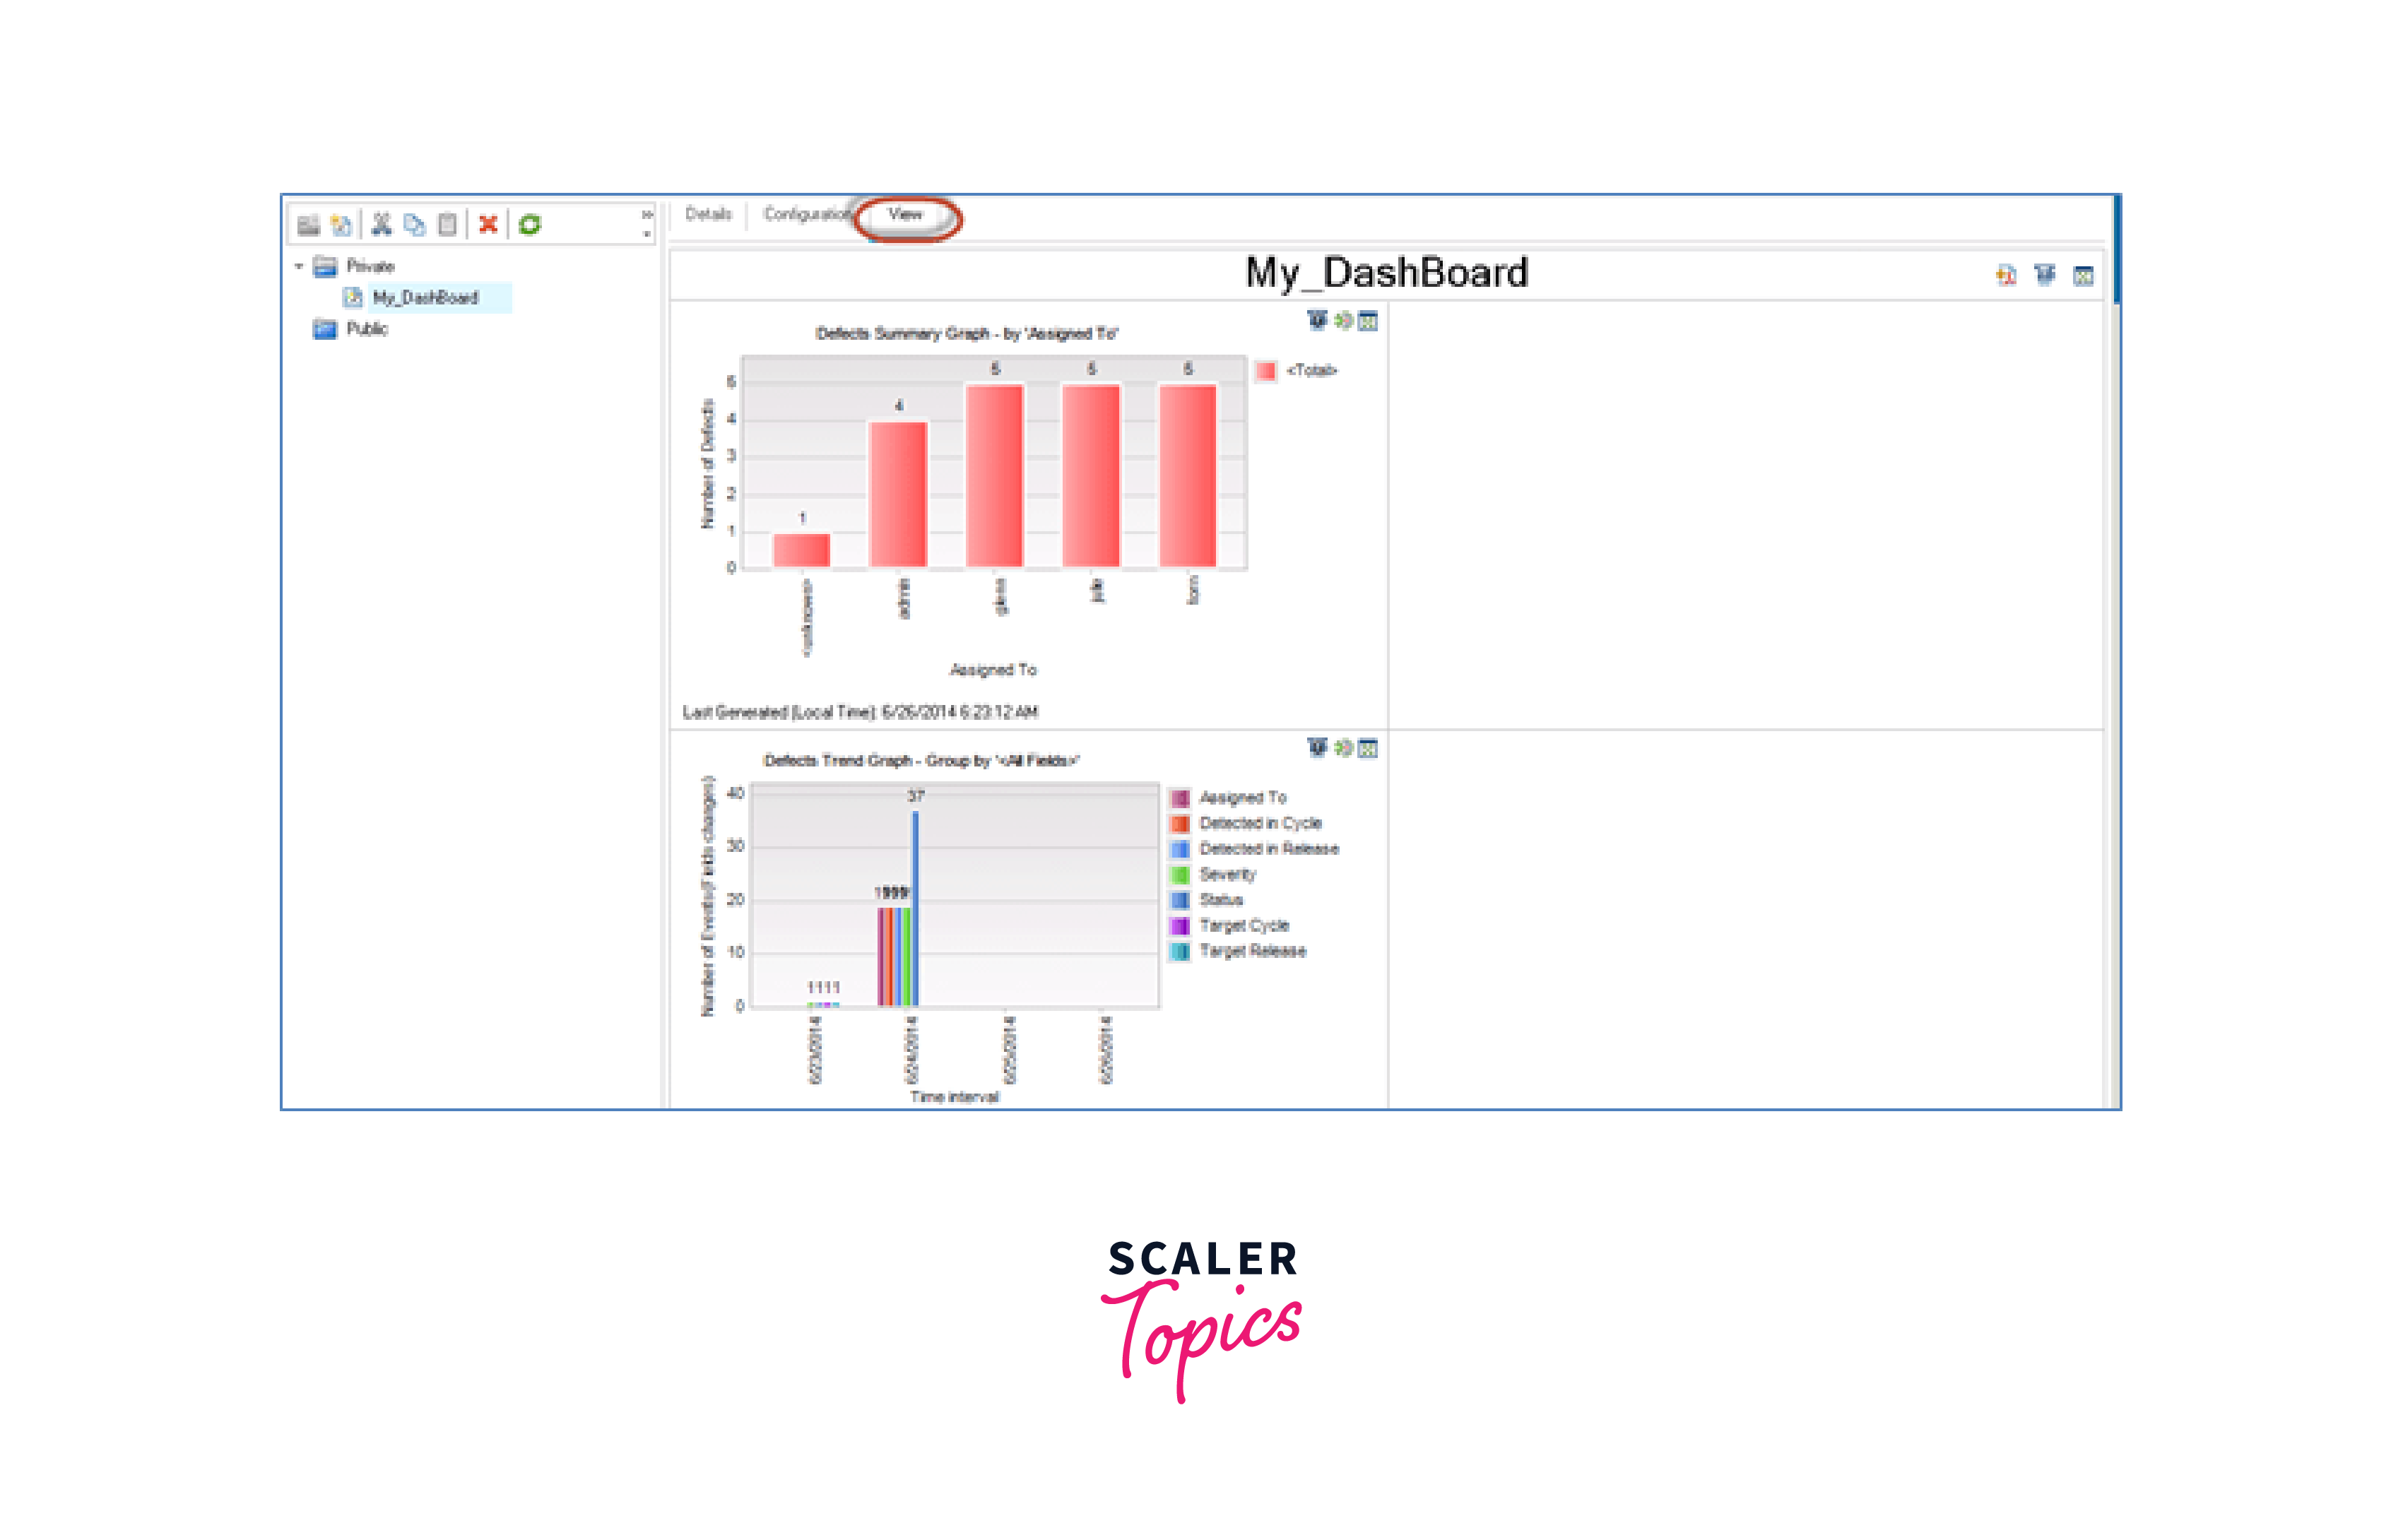
Step 4: Select the View tab to display the selected chart.
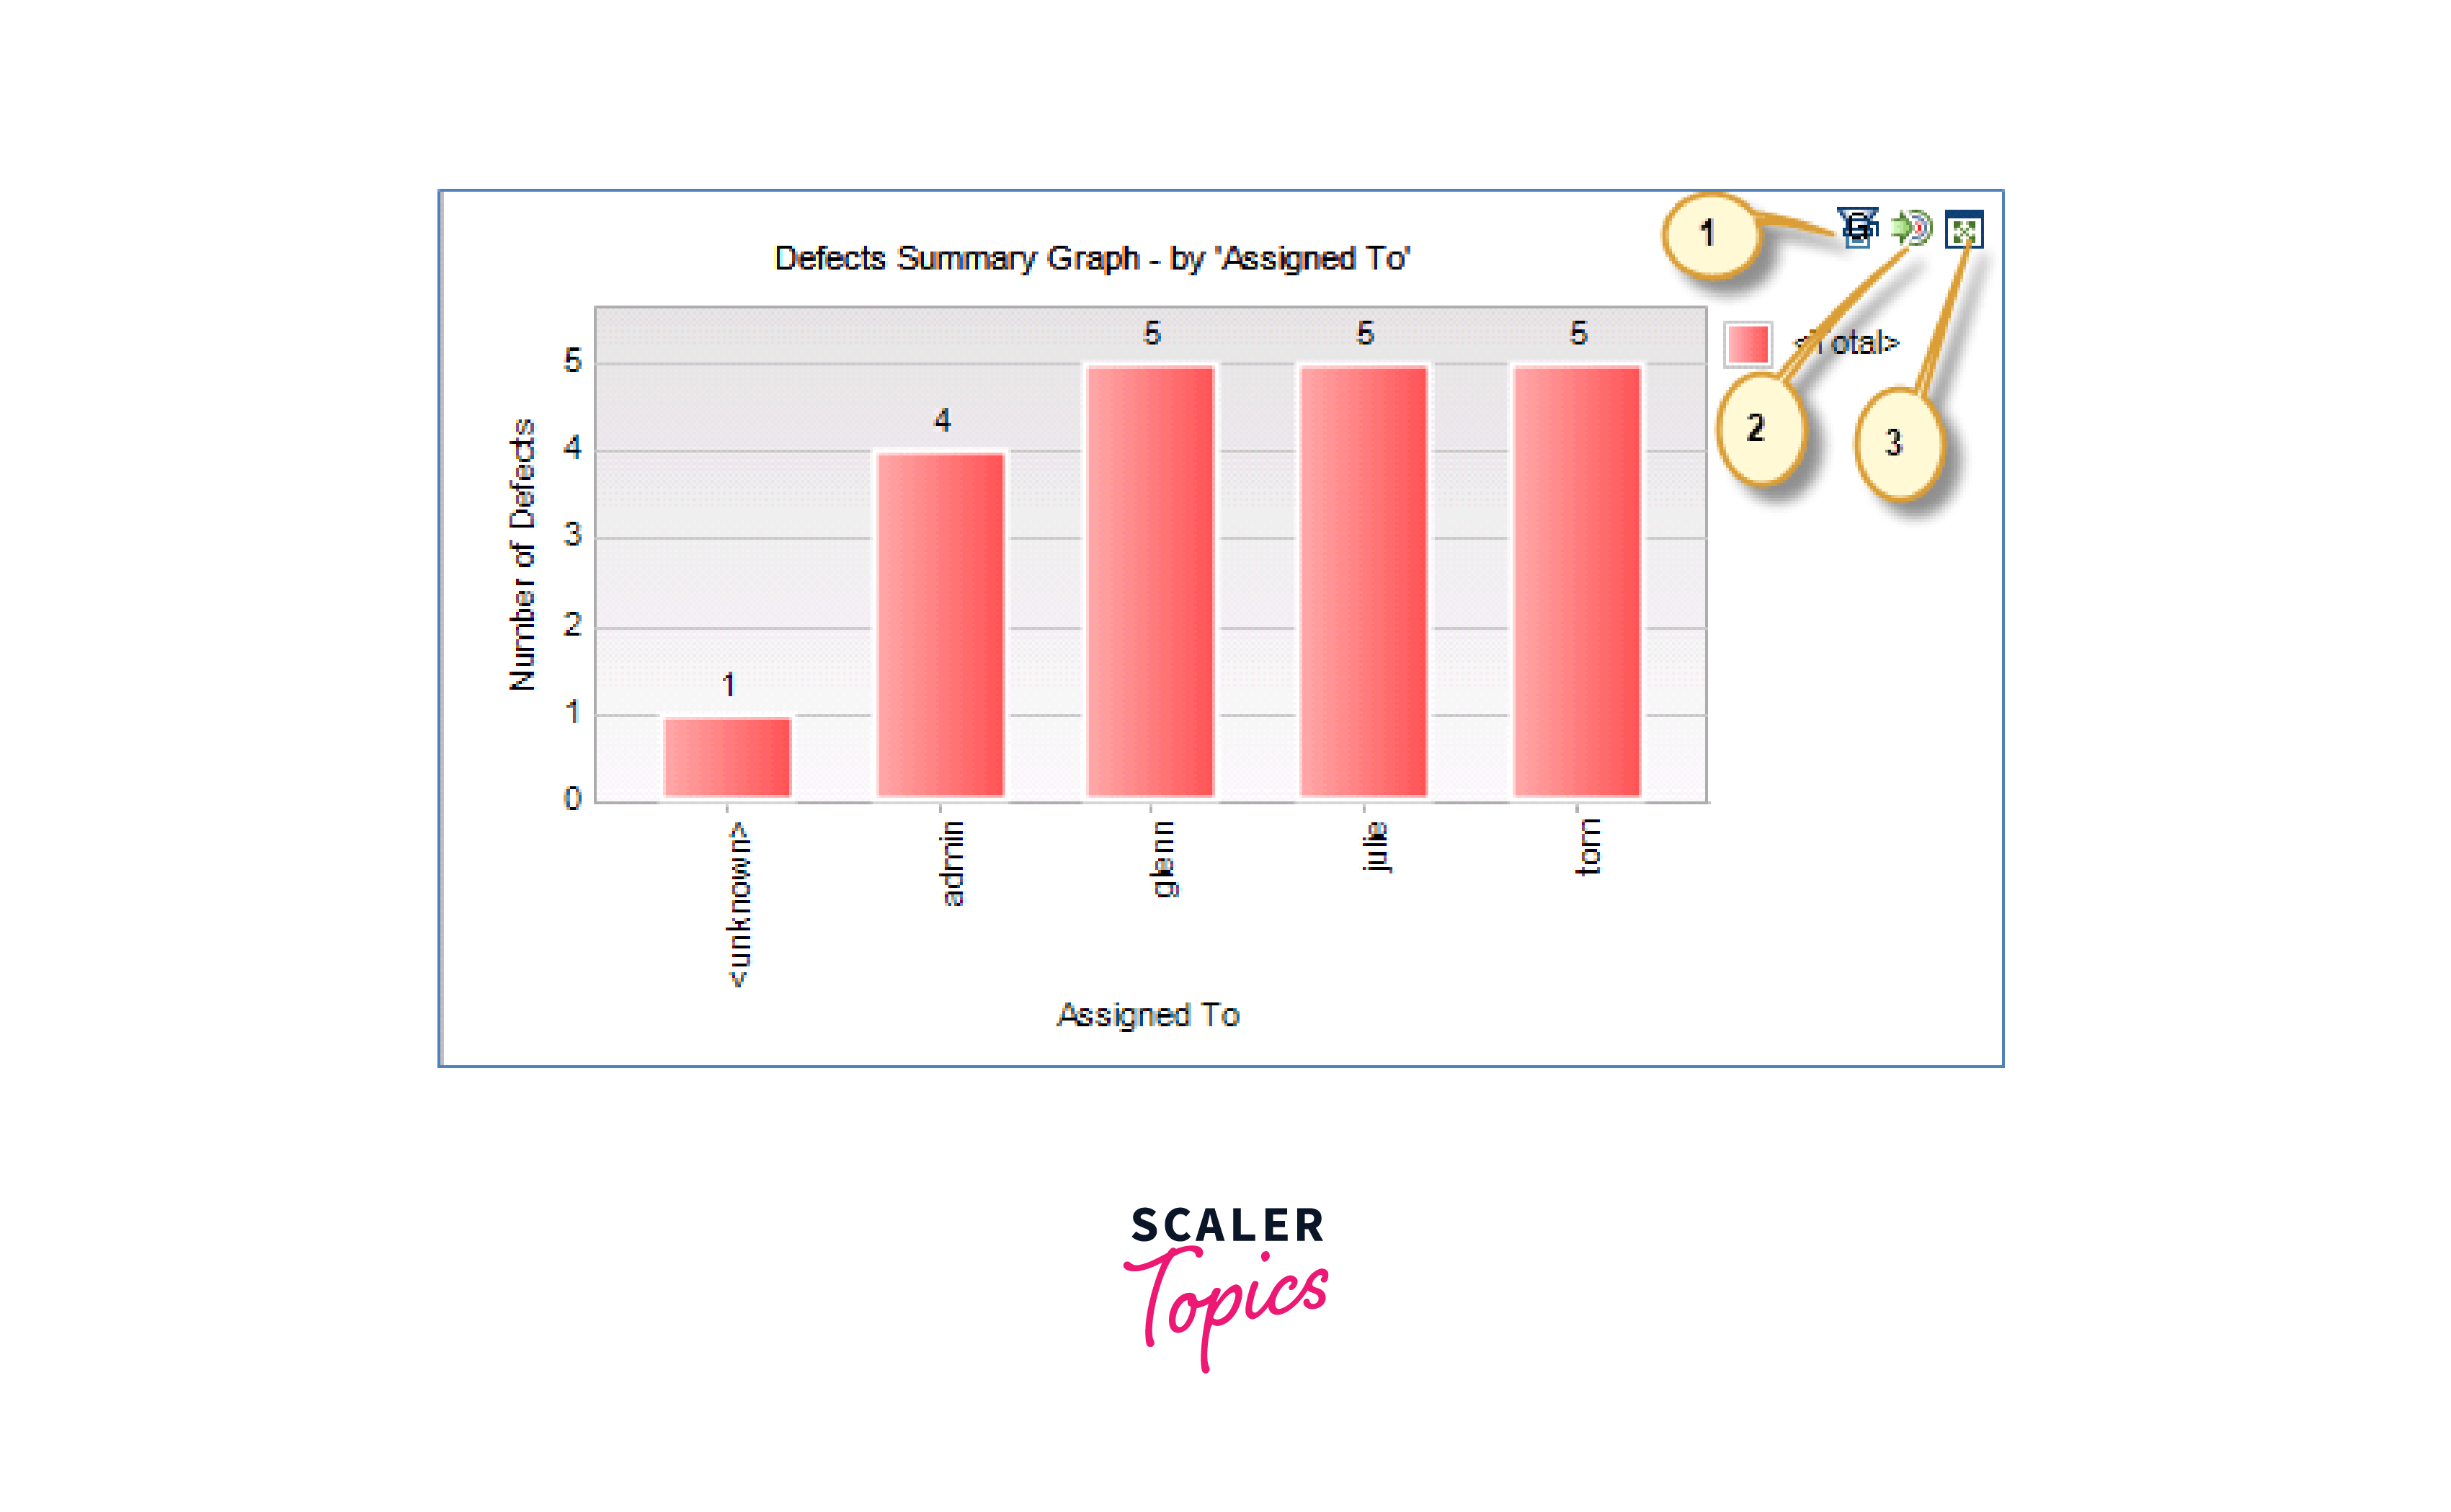
Step 5: Let's come up with icons that will appear on the right side of each diagram.
- Create Graph - Creates/updates the graph after changes.
- Open the chart's analysis tree - from the control panel, the user is redirected to the analysis tree.
- Show graph in full screen - displays the graph in full screen mode.
Conclusion
- HP ALM is a software tool for managing the entire application development lifecycle.
- Report and analysis features within HP ALM provide valuable insights into the performance of the development process.
- Metrics tracked by HP ALM include defect rates, test coverage, and cycle time.
- Information from HP ALM can be used to identify areas for improvement and optimize the development process.
- Customizable reports and dashboards make it easier for stakeholders to view relevant data and make informed decisions.
- The report and analysis features within HP ALM enable businesses to gain a better understanding of development team performance and track progress towards goals.
- By leveraging the insights provided by HP ALM, businesses can identify and address issues more quickly, streamline their workflows, and deliver higher-quality software products.