Reports in JIRA
Overview
Jira reports are used to check the health of the project at various stages of development. Reports give an immediate insight into the speed, bottlenecks, backlogs, and delivery rate.
Jira reports are a measuring tool that helps to take steps to manage the project better. Reports help to improve operations to meet time deadlines and manage resources and budget constraints.
Introduction to Reports in JIRA
Jira reports is the key tool to manage the workload and productivity of the team in agile. Agile methodology focuses on maximizing the team's output. Jira provides different types of reports based on the parameters like productivity, speed, and budget of the project. Jira reports help to keep up with the sprint and drill down the issues. Jira reports answer questions on productivity, predictability, schedule, scope, quality, and flow.
How to Access Reports?
-
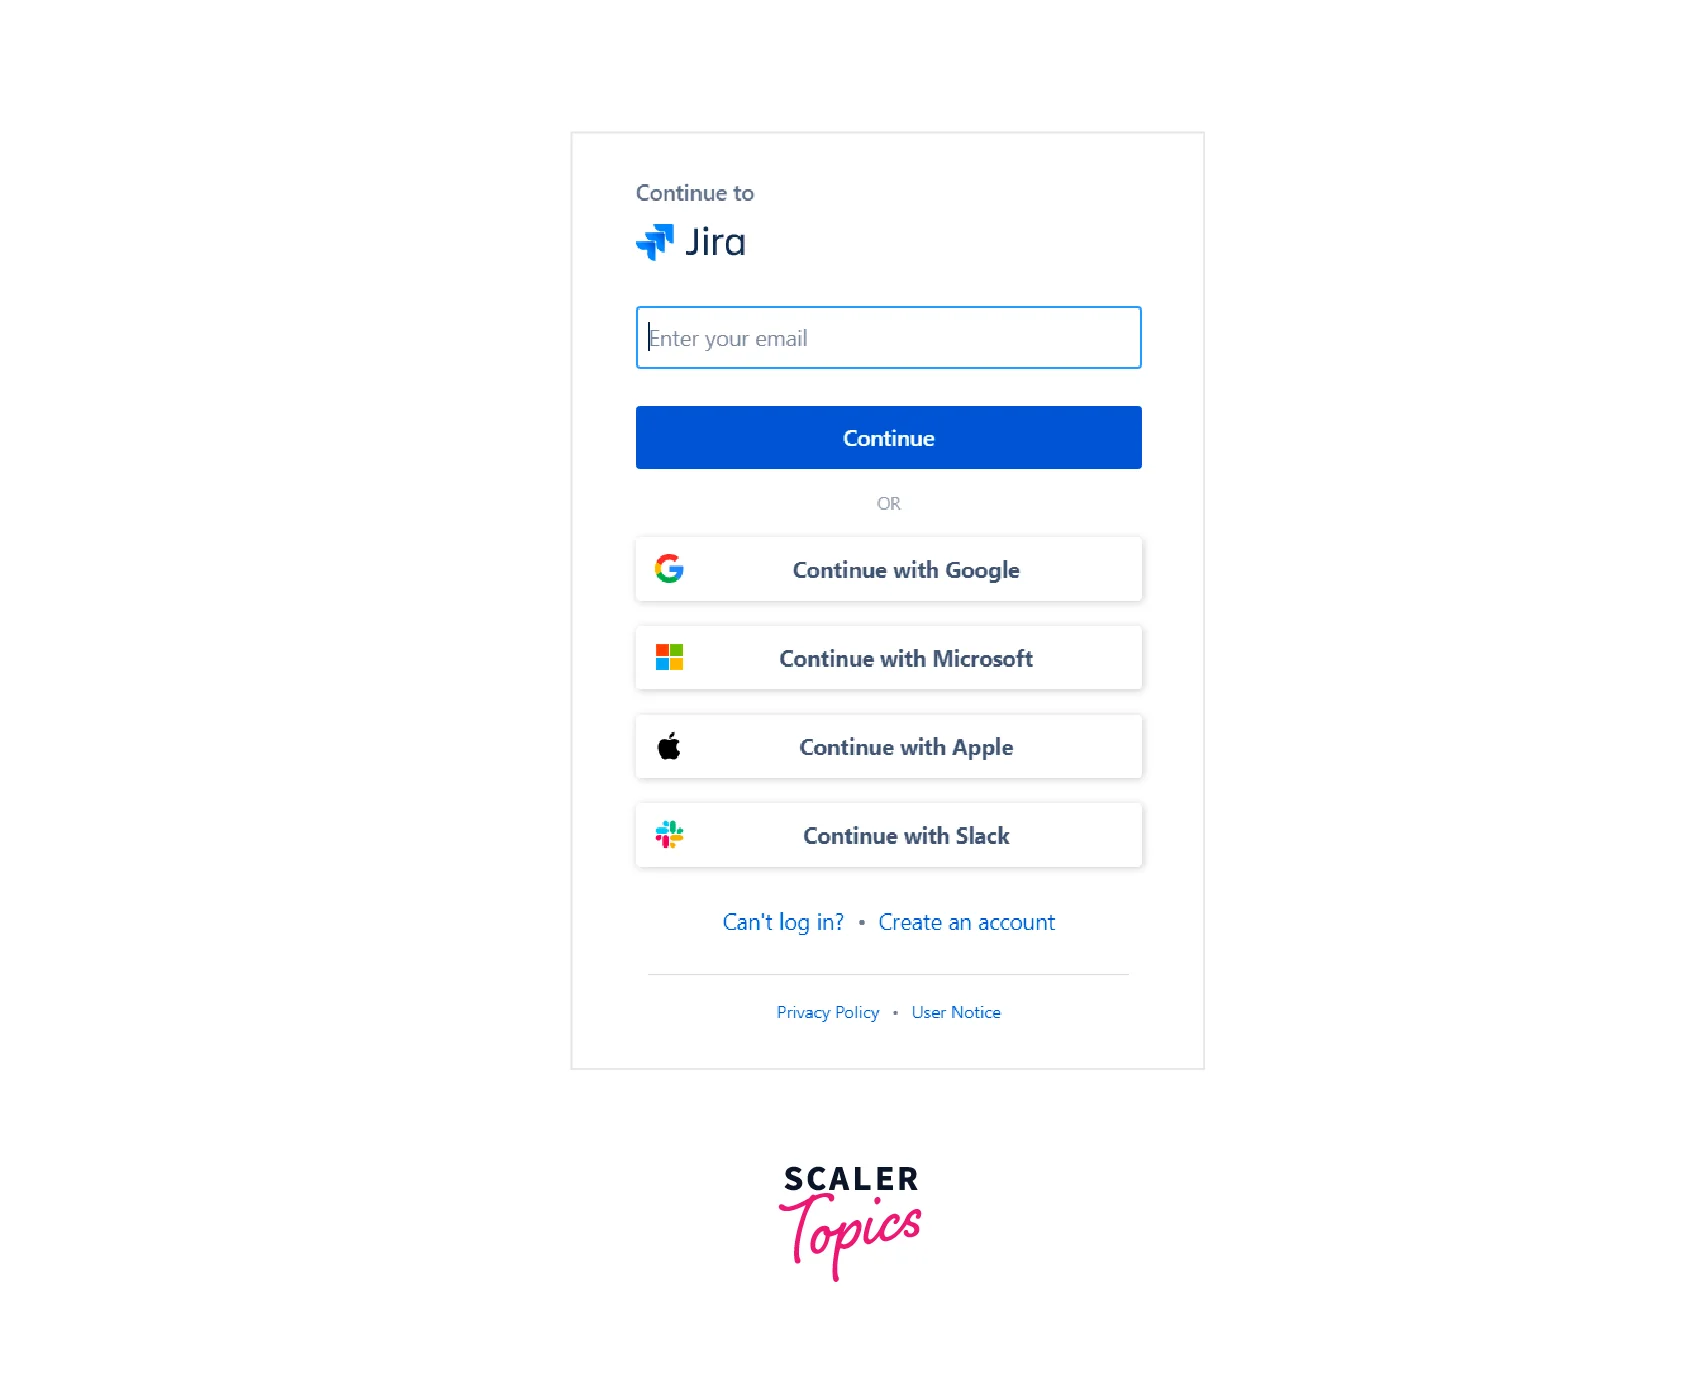
Log in to your Jira Account. Enter your username and credentials. Jira offers one month free trial period post that you have to use a premium paid account to access Jira.
-
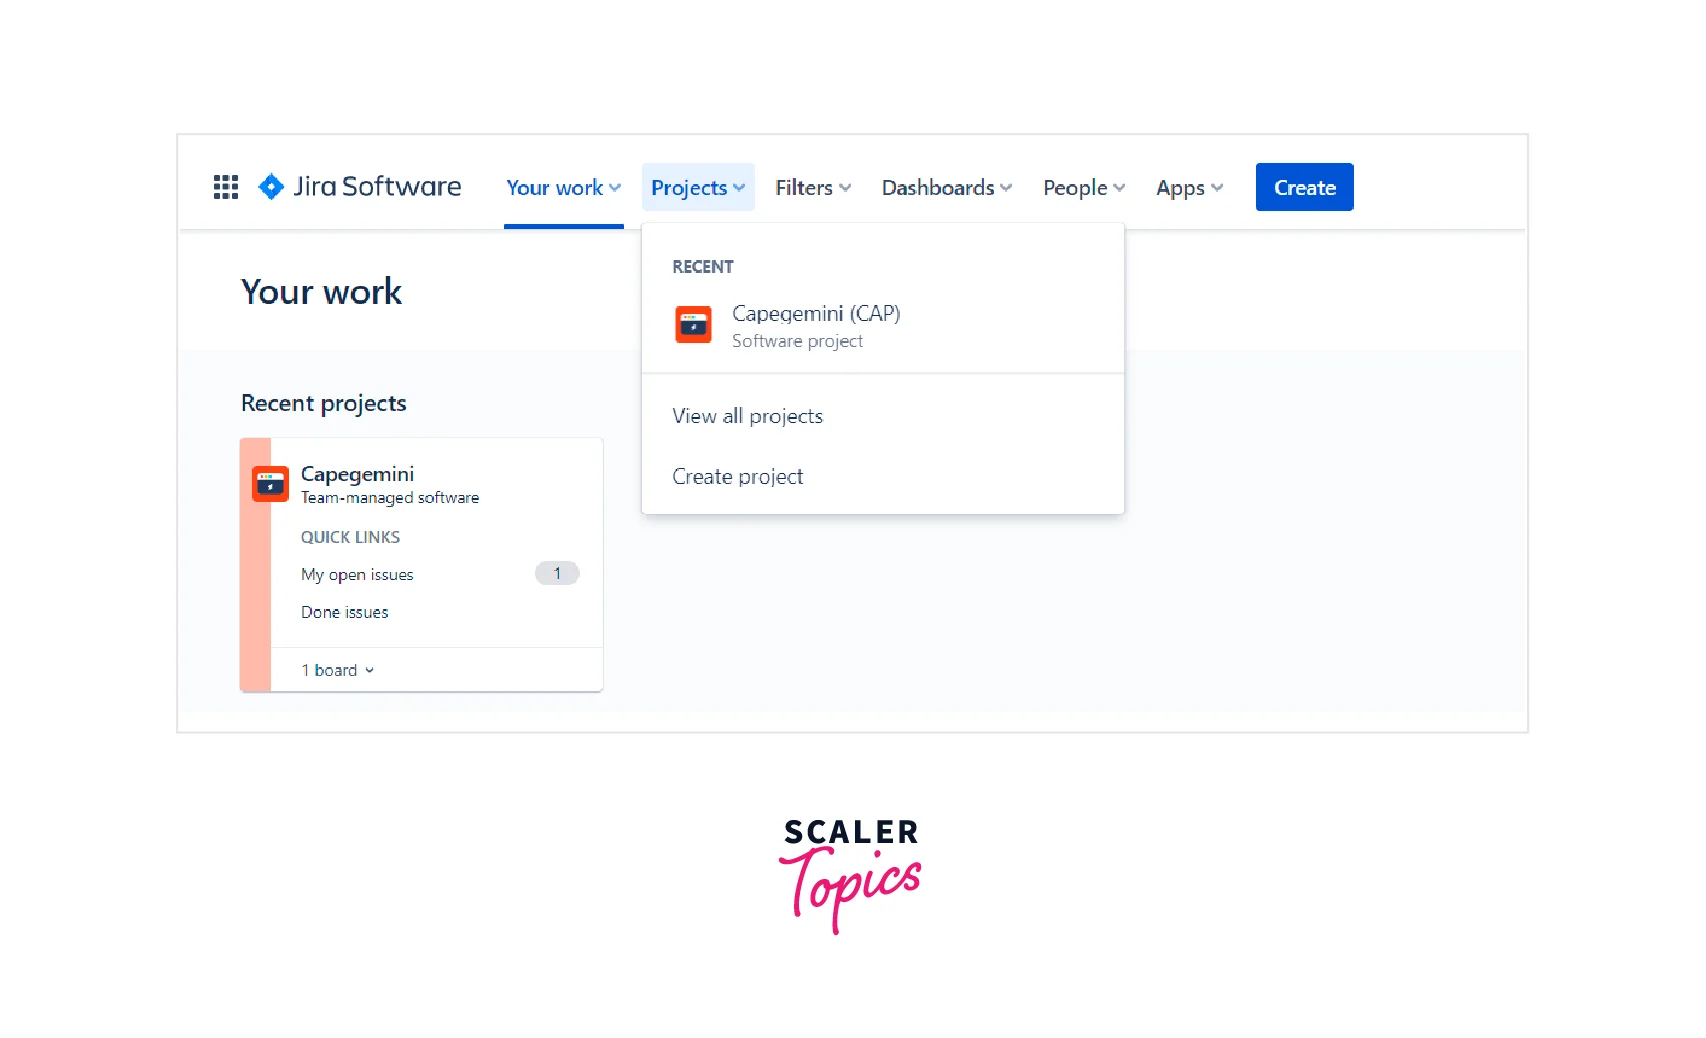
Select the project from the above dropdown. If there are multiple projects you are working on, choose the current one. Both agile and Kanban frameworks have been reported to them.
-
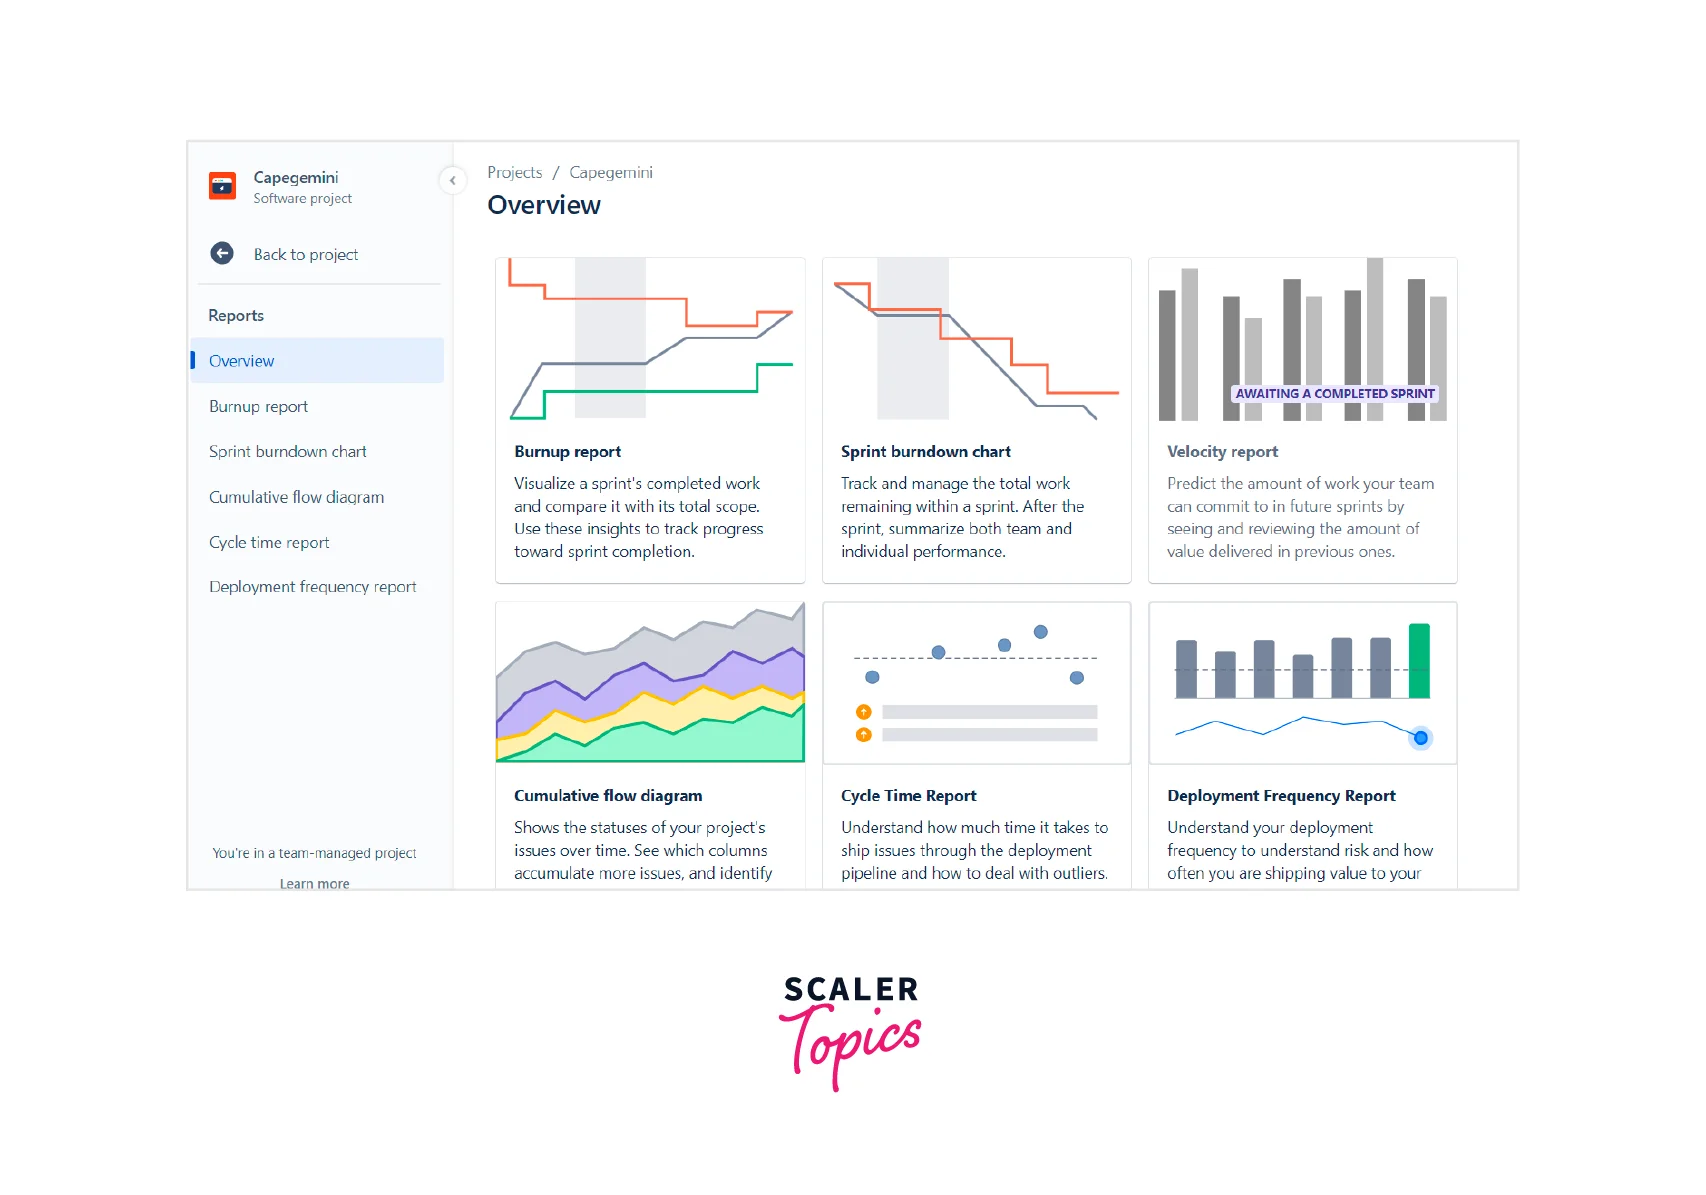
Select the Reports option from the left menu. A list of different types of reports would be visible on the screen. Select the report based on parameters to visualize.
-
Select the report for detailed visualization- burnup report, sprint burndown, velocity report, etc. For example, burn-up reports can be done with date vs. time parameters. And below, a complete description list will be formed.
Types of Reports in Jira (Add Features "for each")
Agile reports for Scrum teams:
-
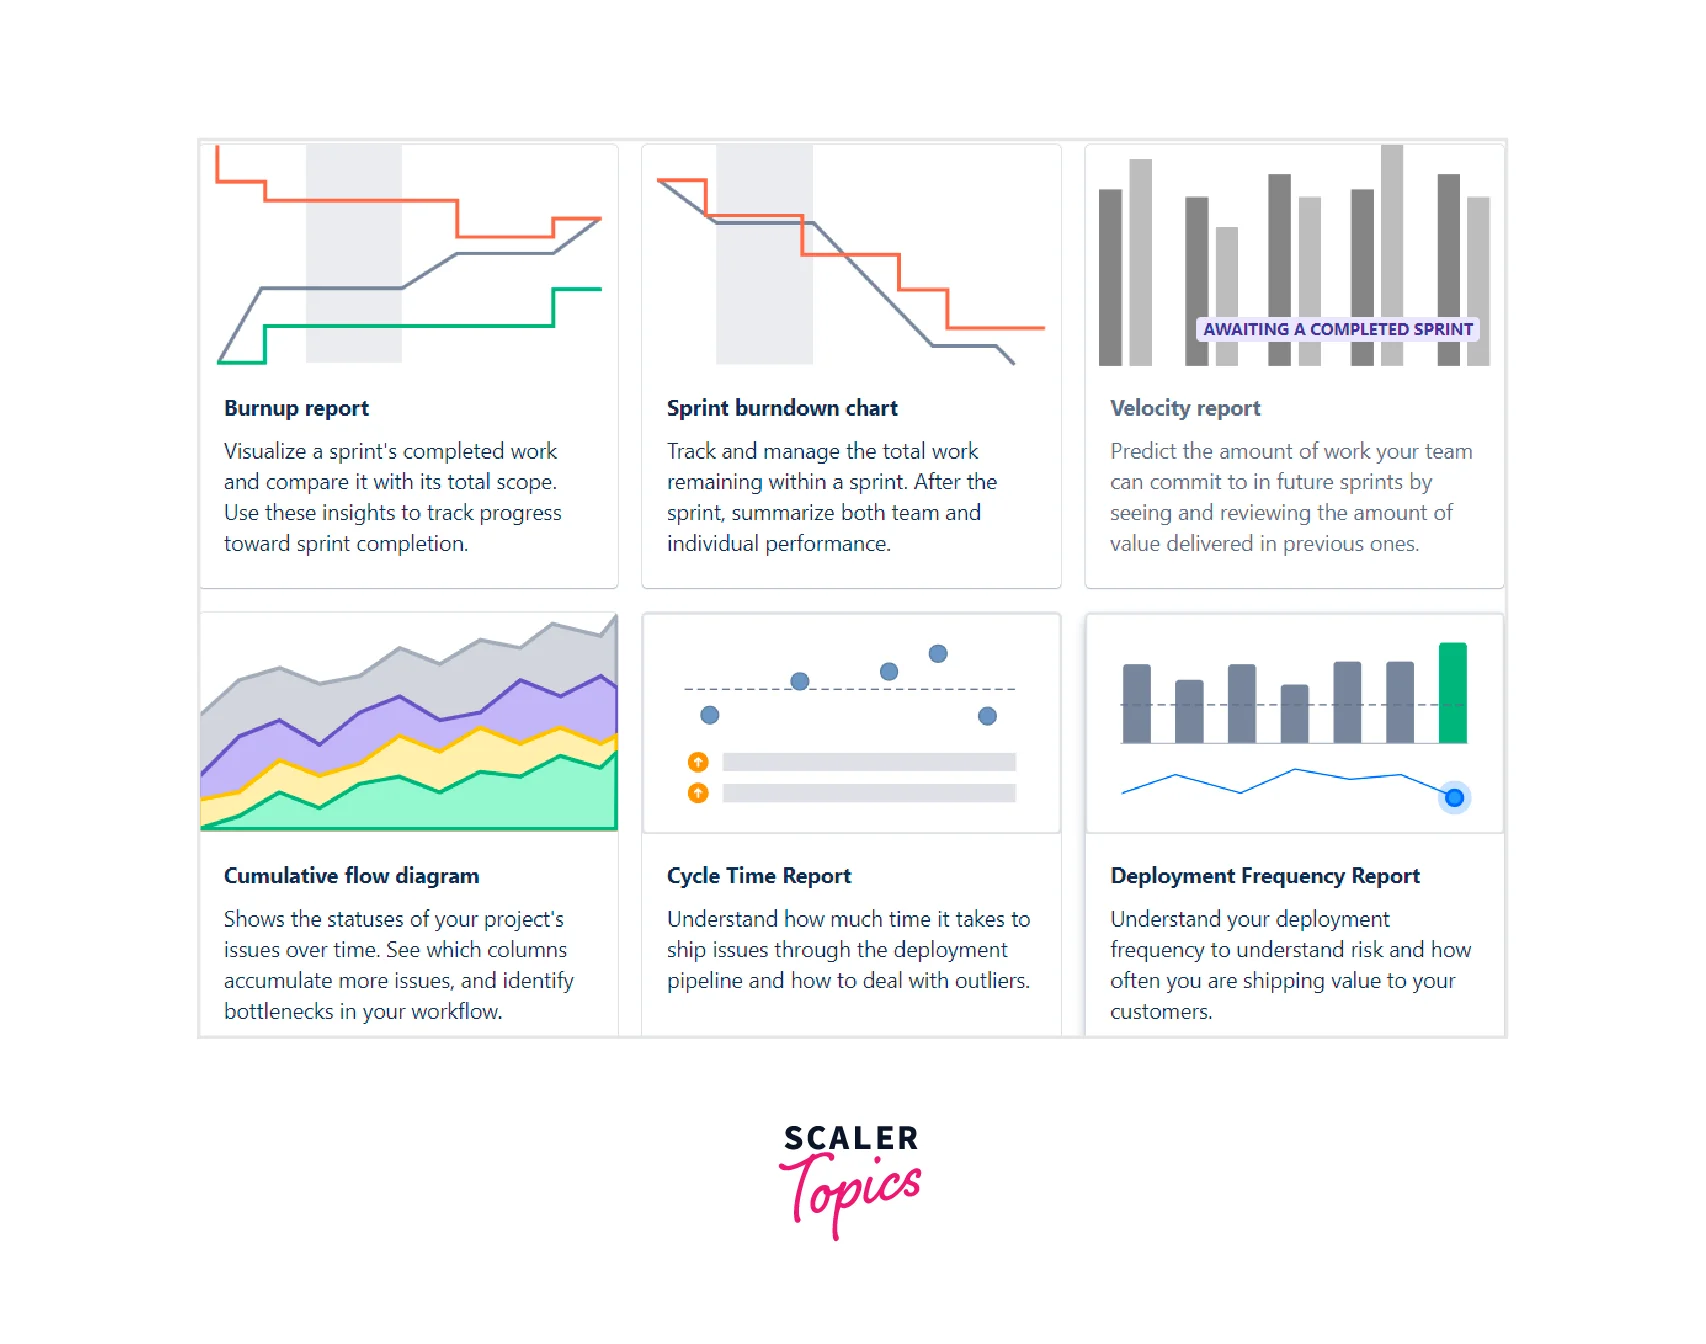
Scrum team uses sprints. Burndown charts are used to track down the progress.
-
Burnup charts are used to track down how much task is done to calculate any bottleneck.
-
Version reports are for future task recording.
-
Velocity chart would help identify the ongoing sprint's pace.
Agile reports for Kanban teams:
- Control charts are used for Kanban, which tells the cycle time for the product.
- Cumulative flow diagram shows the status of the issue over time.
- In Kanban, since there is no concept of the sprint, tasks completed and left bring crucial analysis factors.
- Version reports track down the release over some time.
Issue Forecast and management:
- Cycle Time records the time taken from the day issue was committed to the deployment period.
- Deployment frequency report shows the deployment frequency to see how often you are shipping value to your customers.
- In the Cumulative flow diagram, the distance between each column line shows how long issues take to get from one state to another. Look for points where one band grows faster than another to find bottlenecks.
Issue analysis:
- Created Vs. Resolved Issue Report displays the ratio of issues that were raised to those that had been resolved in a given period.
- Pie chart Report indicates the percentage of issues which are grouped.
- Recent Created Issue Report displays the date of issue was created and the time taken to resolve the issue.
Sprint Report:
- Sprint report shows the work status in progress and priority.
- It displays a burndown of issues and stories and the time taken to complete the task.
- Sprint report gives scrum team insights into the tasks that have been completed vs. left.
- It also shows the projected delivery of the pending task so that responsibilities can be shared for faster delivery
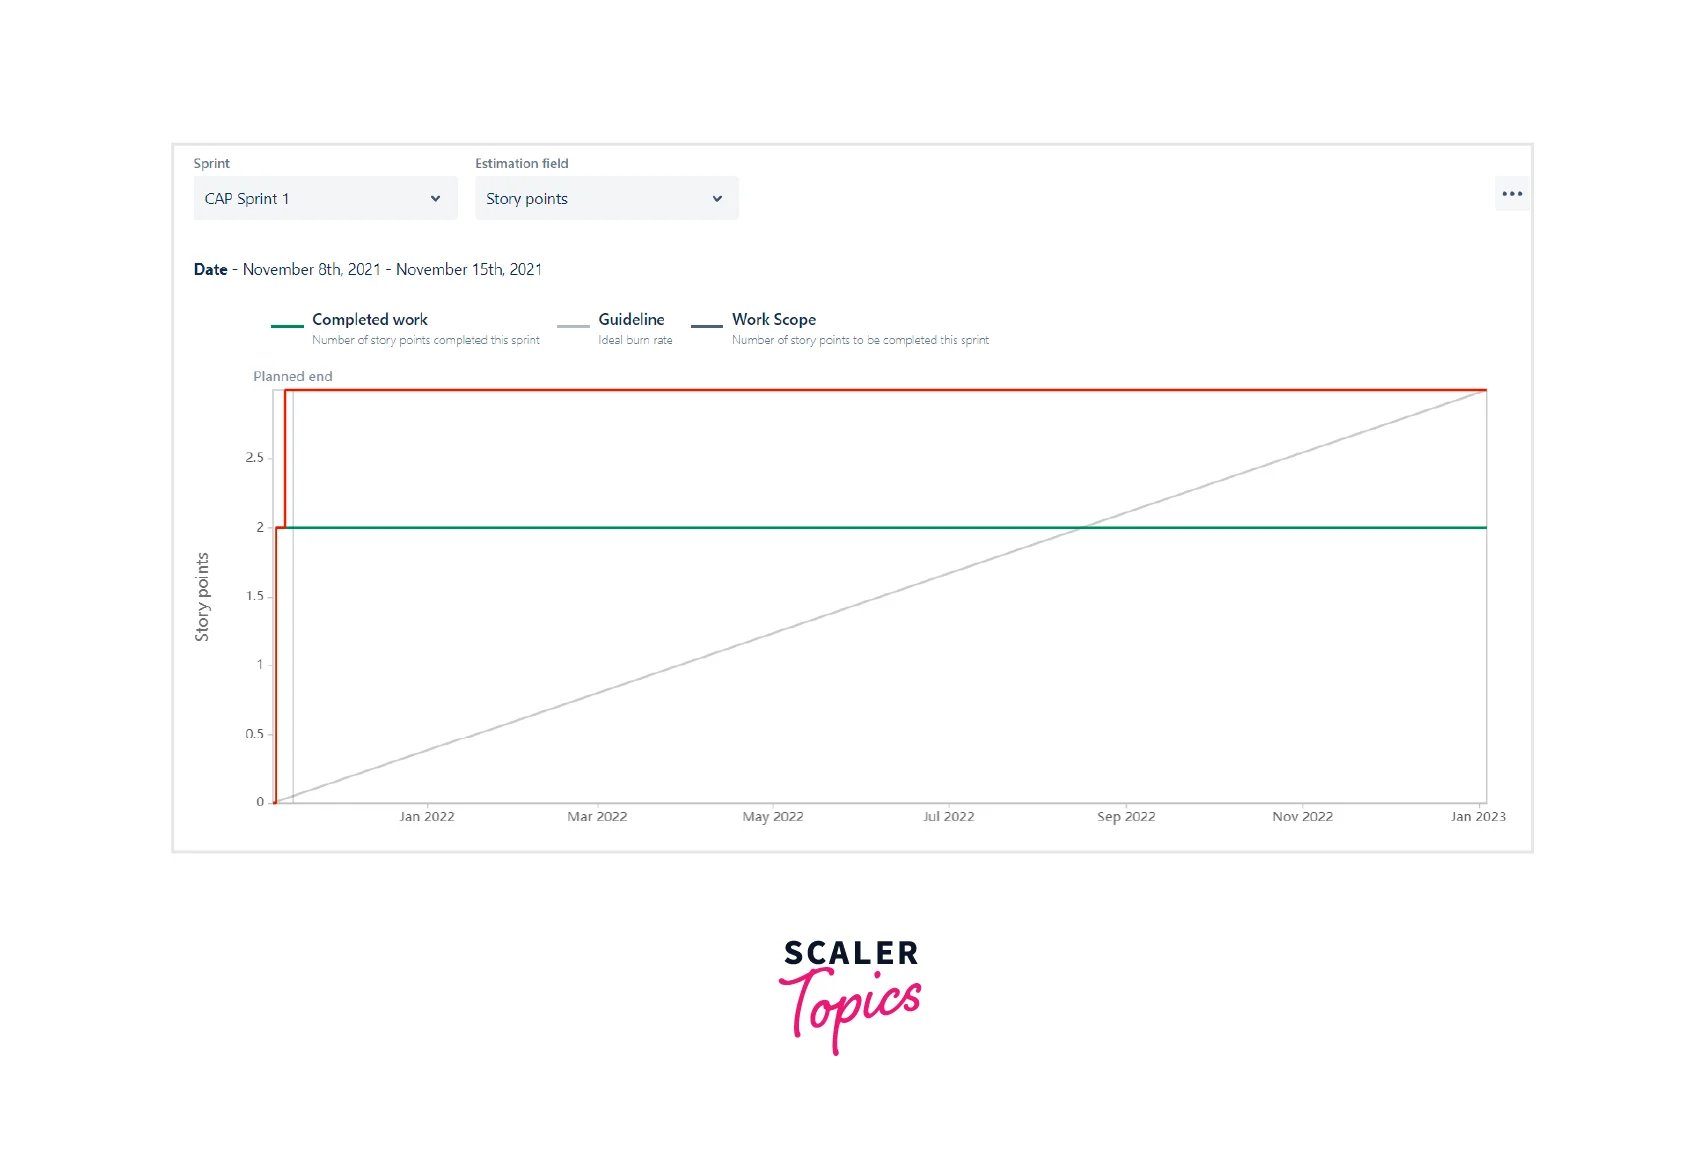
Burndown chart:
-
Burndown chart tracks down the remaining task in the sprint left.
-
It also estimates the delivery time and whether it meets the target.
-
Burndown chart also lets the team come together to meet the deadlines.
Release burndown:
- Release burndown tracks down the projected release date for the sprint based on the current team.
- It also let the team know if the project can meet the deadlines or if there are certain bottlenecks.
- The team can take necessary action to work on bottlenecks and deliver on time.
Velocity chart:
- Velocity chart compares the work done from one sprint to another.
- It helps manage the team's pace, hence the project.
- It ensures smooth delivery of the product in every phase.
Steps to Generating and Accessing Reports in Jira
To create a new custom report:
- Select Reports> New report.
- Enter a name for the report.
- Select Add series.
- Add a label name for the series that you’re measuring.
- Select the filter based on priority, time, etc.
- Select Add.
- Select Create.
Reports Based on Team Management of Agile Projects (for Scrum and Kanban)
- Workload pie chart report displays an assignee’s relative workload.
- The Version workload report shows the tasks completed so far and how many are left.
- The version time tracking report displays the progress of the version based on issues.
Conclusion
- Reports are Jira tools that give immediate insight into a project's health.
- The most common charts offered are the burndown chart, velocity chart, and burn-up chart.
- User can also create a custom report in Jira and use Jira Query Language.
- Jira reports are an integral part of both scrum and kanban-based frameworks.