Software Testing Metrics
Overview
Software test metrics are used to quantify the process of software testing. The quality, growth, or improvement needed at a stage can be measured using the metrics. So that whatever is lagging this time can be improved for the next cycle. Metrics provide a comparative measure of a process. Metrics also help to determine software's quality and measures required to create a defect-free quality product. The average time taken to fix a bug is a better parameter than the time allocated for the same.
What are Software Testing Metrics?
A software testing metric indicates the degree to which a process, component, or tool is efficient. Here we have a quantitative measure of the effectiveness of an approach. Let's say we automated certain test cases and we have 50% test coverage using tool A. Next time the tool was changed and manual testing was also used so test coverage was 66%. Now we have solid data to justify why manual testing in combination with automation would be better to test the product.
Why Test Metrics are Important?
- Software testing metrics are used to increase the overall productivity of the development process.
- It helps to make more informed choices about the tools and technologies being used.
- It helps to identify unique ways and techniques that are beneficial for their system, hence increasing performance.
- Software testing metrics determine the health of a process, tool, and approach used.
Types of Software Testing Metrics
There are three types of software testing metrics:
- Process Metrics: The quantitative measures that define the efficiency of a process based on parameters like speed, time, utilization of resources, etc. Managers can look at these numbers and set new guidelines for the phase.
- Product Metrics: Measures to determine the quality, size, performance, and efficiency of the product come under product metrics.
- Project Metrics: Quality and productivity of the project, utilization of resources, cost, and time come under the project metrics.
Manual Test Metrics
Since manual testing is a step-by-step testing process carried out by a quality analyst, finding quantitative measures in the process are little different. These metrics are manual test metrics. There are two types of manual test metrics:
- Base Metrics: The essential data taken out via the carrying testing process comes under base metrics. It comprises test cases and test cases completed.
- Calculated Metrics: The base metrics data is further taken out to carry differential results that provide more information about the process or product. It is more useful for tracking project progress.
Some Other Metrics
- Defect metrics: The measures telling about defect ratio, speed taken to fix a defect, and complexity of a defect come under defect metrics.
- Schedule Adherence: Schedule Adherence tells the expected time given for a task vs the time taken to complete it.
- Defect Severity: Defect severity talks about how much the impact that defect/bug has on the product.
- Test case efficiency: Test case efficiency covers how well a test case can determine the impact of a test case.
- Defects finding rate: It tells what is the pattern of flaws over some time.
- Defect Fixing Time: The time difference between when the defect was assigned vs when it got fixed.
- Test Coverage: How much of the requirements and functionalities are covered in the testing process comes under test coverage.
- Defect cause: The modules or components causing the defect.
Metrics Life Cycle
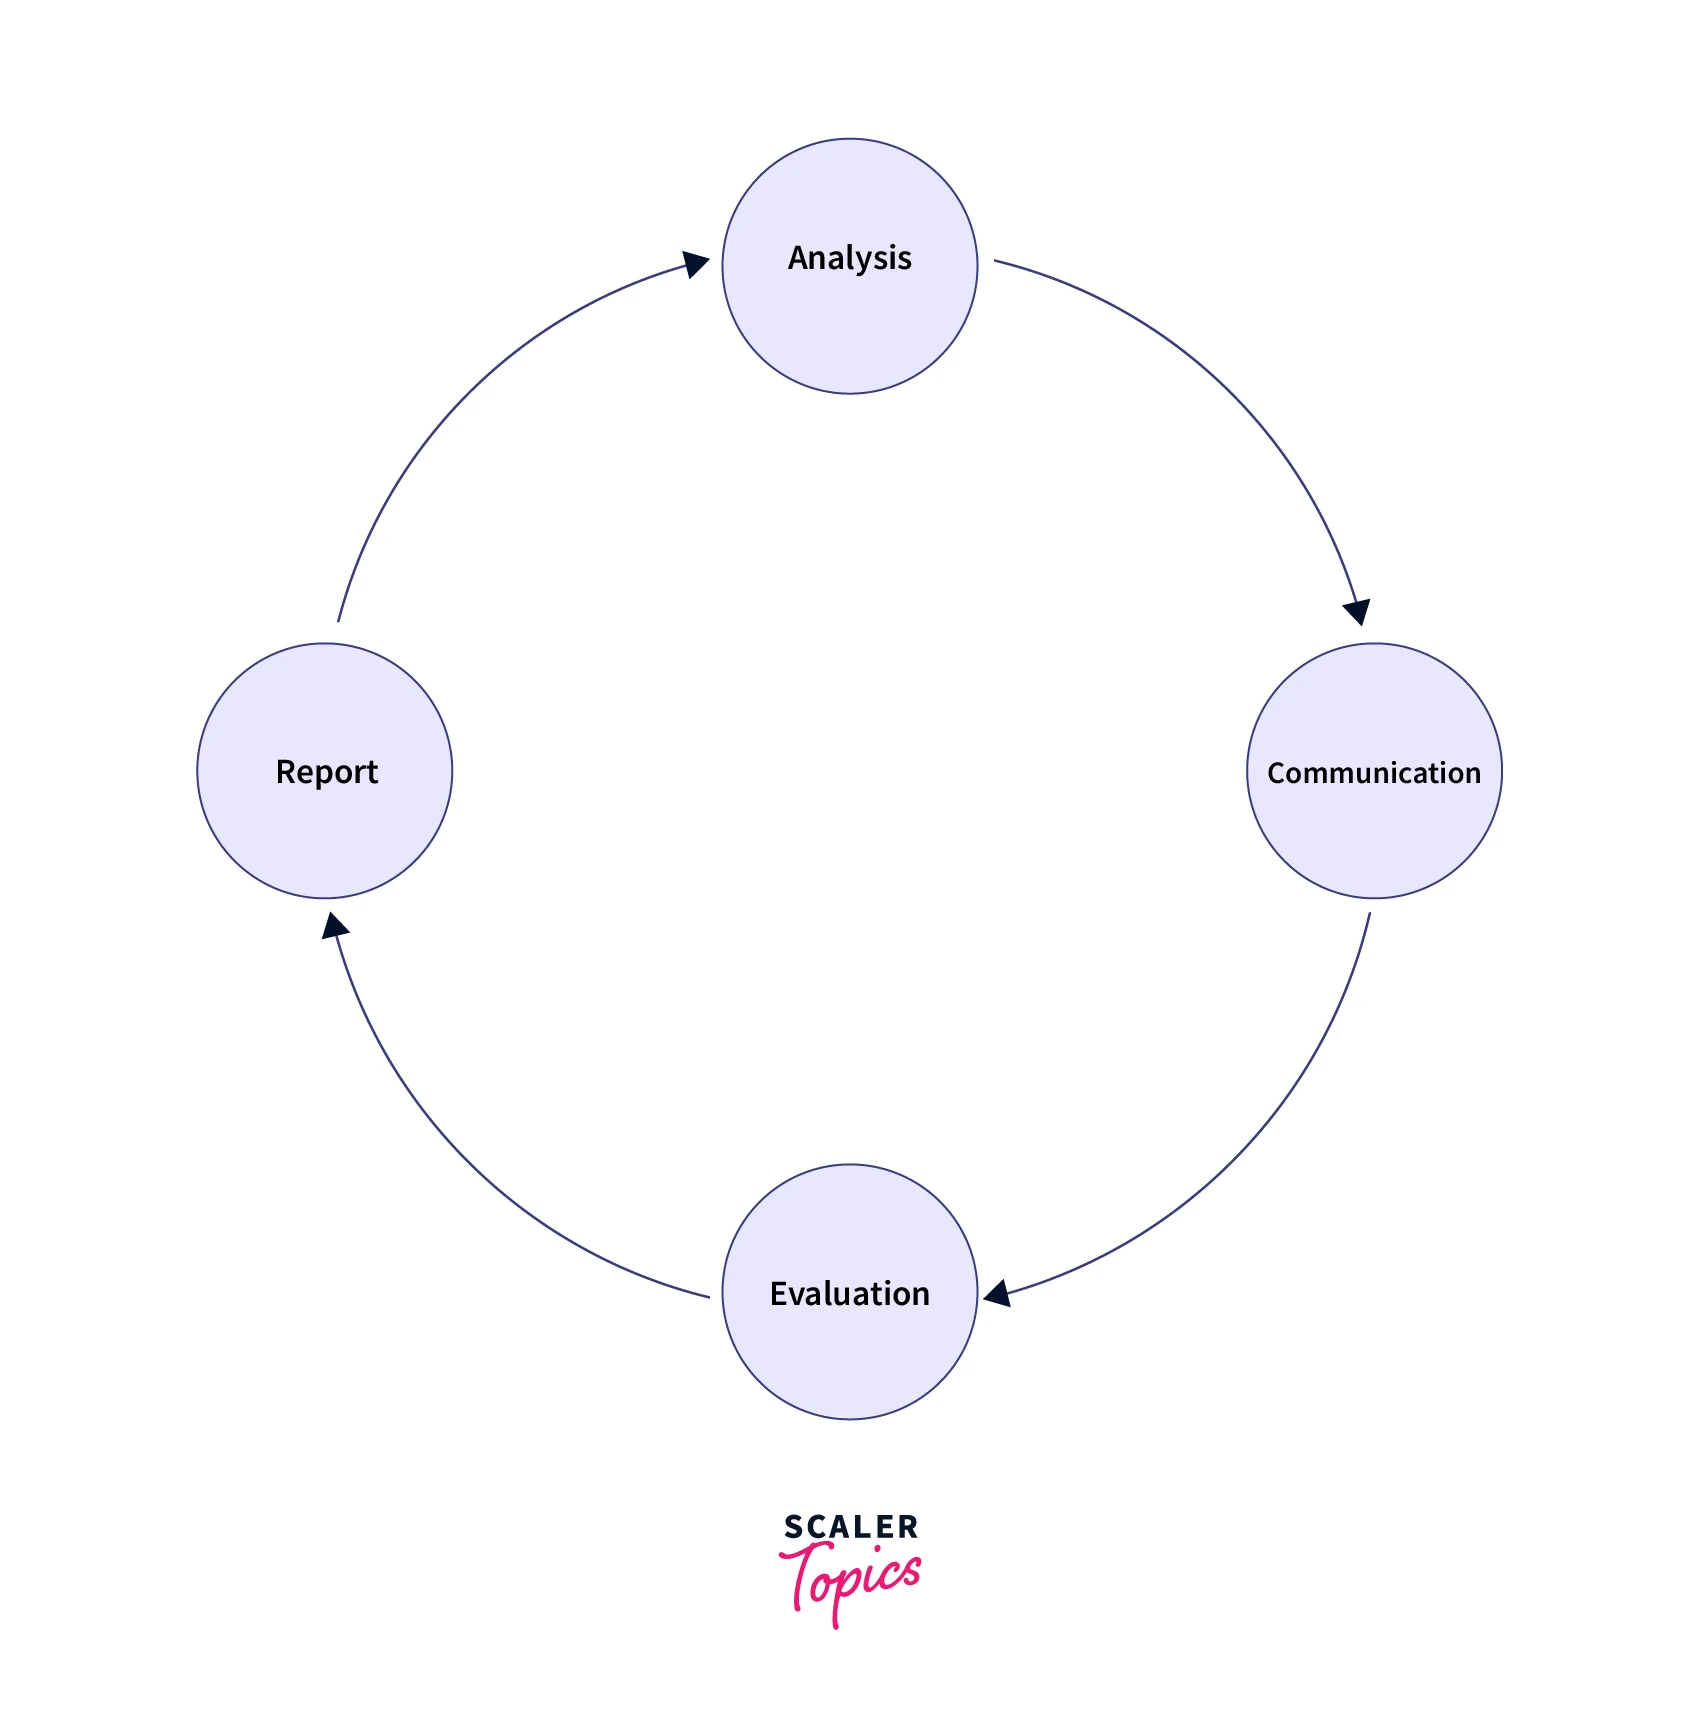
Let's look at various stages of the test metrics lifecycle:
- Analysis: The QA team identifies the metrics like time, effort, efficiency, etc.
- Communicate: Communication among the testing team as to how to capture the metrics, the process of it, and what all data needs to be extracted.
- Evaluation: All the calculation of the data happens here. Preparation of these metrics is done.
- Report: These metrics are reported. Data is compared, and loopholes and analysis of the report are done. Measures to improve are discussed so that next time the process would be more effective.
Formula for Test Metrics
-
Test Case Effectiveness: Test Case Effectiveness = (Total defects detected / Total number of test cases) x 100
-
Passed Test Cases Percentage: Passed Test Cases Percentage = (Total number of tests passed / Total number of test cases) x 100
-
Failed Test Cases Percentage: Failed Test Cases Percentage = (Total number of test cases failed / Total number of tests executed) x 100
-
Blocked Test Cases Percentage: Blocked Test Cases Percentage = (Number of blocked/skipped tests / Total number of test cases) x 100
-
Fixed Defects Percentage: Fixed Defects Percentage = (Total number of defects fixed / Total number of defects) x 100
-
Rework Effort Ratio: Rework Effort Ratio = (Rework efforts spent in that phase/ Total efforts spent in that phase) x 100
-
Accepted Defects Percentage: Accepted Defects Percentage = (Defects Accepted by Development Team / Total number of Defects Reported) x 100
-
Defects Deferred Percentage: Deferred means that we know that there is a bug but would fix that bug in the next release Defects Deferred Percentage = (Defects deferred / Total number of Defects Reported) x 100
Examples of Software Testing Metrics
Let’s take an example to calculate test metrics:
| S No. | Testing Metric | Data retrieved during test case development |
|---|---|---|
| 1 | No. of requirements | 20 |
| 2 | The average number of test cases written per requirement | 10 |
| 3 | Total no. of Test cases written for all requirements | 200 |
| 4 | Total no. of Test cases executed | 180 |
| 5 | No. of Test cases passed | 100 |
| 6 | No. of Test cases failed | 80 |
| 7 | No. of Test cases blocked | 0 |
| 8 | No. of Test cases unexecuted | 20 |
| 9 | Total no. of defects identified | 10 |
| 10 | Defects accepted as valid by the dev team | 10 |
| 11 | Defects deferred for future releases | 0 |
| 12 | Defects fixed | 10 |
-
Percentage of test cases executed = (No of test cases executed / Total no of test cases written) x 100 = (180 / 200) x 100 = 90%
-
Test Case Effectiveness = (Number of defects detected / Number of test cases run) x 100 = (10 / 180) x 100 = 5.55%
-
Failed Test Cases Percentage = (Total number of failed test cases / Total number of tests executed) x 100 = (80 / 180) * 100 = 44.44%
-
Blocked Test Cases Percentage = (Total number of blocked tests / Total number of tests executed) x 100 = (0 / 180) * 100 = 0%
-
Fixed Defects Percentage = (Total number of flaws fixed / Number of defects reported) x 100 = (10 / 10) * 100 = 100%
-
Accepted Defects Percentage = (Defects Accepted as Valid by Dev Team / Total Defects Reported) x 100 = (10/ 10) * 100 = 100%
-
Defects Deferred Percentage = (Defects deferred for future releases / Total Defects Reported) x 100 = (0 / 10) * 100 = 0%
Conclusion
- Software test metrics are quantifying measures of the testing process.
- They are useful to enhance the overall productivity of the cycle
- Manual test metrics are used while carrying out the manual testing process which is of two types based metrics and calculated metrics
- Metrics life cycle goes through the process of analysis, communication, evaluation, and reporting.