AB Testing in Excel
Overview
A/B testing in Excel is a statistical analysis method that compares two versions of a product, web page, or marketing campaign to see which performs better. It entails splitting a sample audience into two groups and presenting version A to one group. In contrast, version B is presented to the other group, assessing how well each group performs. Excel can analyze and visualize results, making it a valuable tool for companies looking to improve their marketing or product design.
What are we Building?
A/B testing is a statistical technique that divides people into control and test groups at random. The test group is shown a changed version of the product, website, or campaign, which may contain modifications to the design, phrasing, or other components, as opposed to the control group, which is shown the original version of the product, website, or campaign.
Excel is an effective A/B testing tool since it simplifies data collection and statistical analysis. The experiment's data may be entered into Excel. Several statistical tools, such as computing means, standard deviations, confidence intervals, t-values, and p-values, can be used to assess the findings.
Imagine, for instance, that you have an e-commerce website and want to compare the conversion rates of two distinct iterations of your homepage. Whereas version B has a smaller banner but more prominently features customer reviews, version A has a massive banner advertising a deal. You randomly choose which half of the people visiting your website will view Version A and half will see Version B. The number of conversions from each group is entered into Excel after a week of data collecting, and you then apply statistical analysis to evaluate which version generated the most conversions and whether the findings are statistically significant.
a. Pre-requisites
Before we get started with building the A/B testing framework in Excel, here are some of the key topics you should be familiar with:
- Hypothesis testing:
Hypothesis testing is a statistical approach used to test a hypothesis or claim about a population parameter based on sample data. In A/B testing, this involves testing whether there is a significant difference between the conversion rates of two different groups. - t-values:
t-values measure how far the sample mean is from the null hypothesis (i.e., the expected value of the population). A higher t-value indicates that the sample mean is farther from the null hypothesis, which means that the difference between the two groups is more significant. - p-values:
p-values are a measure of the probability of observing a test statistic as extreme or more extreme than the one observed, assuming that the null hypothesis is true. In A/B testing, a p-value of less than 0.05 (i.e., 5%) indicates that the observed difference in conversion rates between the two groups is statistically significant and that the null hypothesis should be rejected. - Confidence intervals:
Confidence intervals are a range of values likely to contain the true population parameter with a certain level of confidence. In A/B testing, a confidence interval can be used to estimate the range of possible values for the difference in conversion rates between the two groups based on the sample data. - Excel basics:
You should know basic Excel functions such as SUM, AVERAGE, COUNT, and IF statements.- T.TEST:
This formula performs a two-sample t-test to determine whether two sets of data are significantly different from each other. In A/B testing, it can be used to calculate the t-value and p-value for the difference in means between group A and group B.
- T.TEST:
b. How are we Going to Build this?
Here are the steps we will take to build the A/B testing framework in Excel:
- Define the problem and hypothesis:
We will start by defining the problem we are trying to solve and formulating a hypothesis to test. - Design the experiment:
Next, we will design the A/B testing experiment by identifying the variables, determining the sample size, and randomizing the sample selection. - Collect and input the data:
We will collect the data from both the control and test groups and input it into Excel. - Analyze the data:
We will use Excel to analyze the data and calculate the relevant statistical measures, such as the mean, standard deviation, and p-value. - Draw conclusions:
Based on the statistical analysis, we will draw conclusions about which version performed better and whether the results are statistically significant. - Visualize the results:
Finally, we will use Excel to create visualizations that will help us understand and communicate the results.
c. Final Output
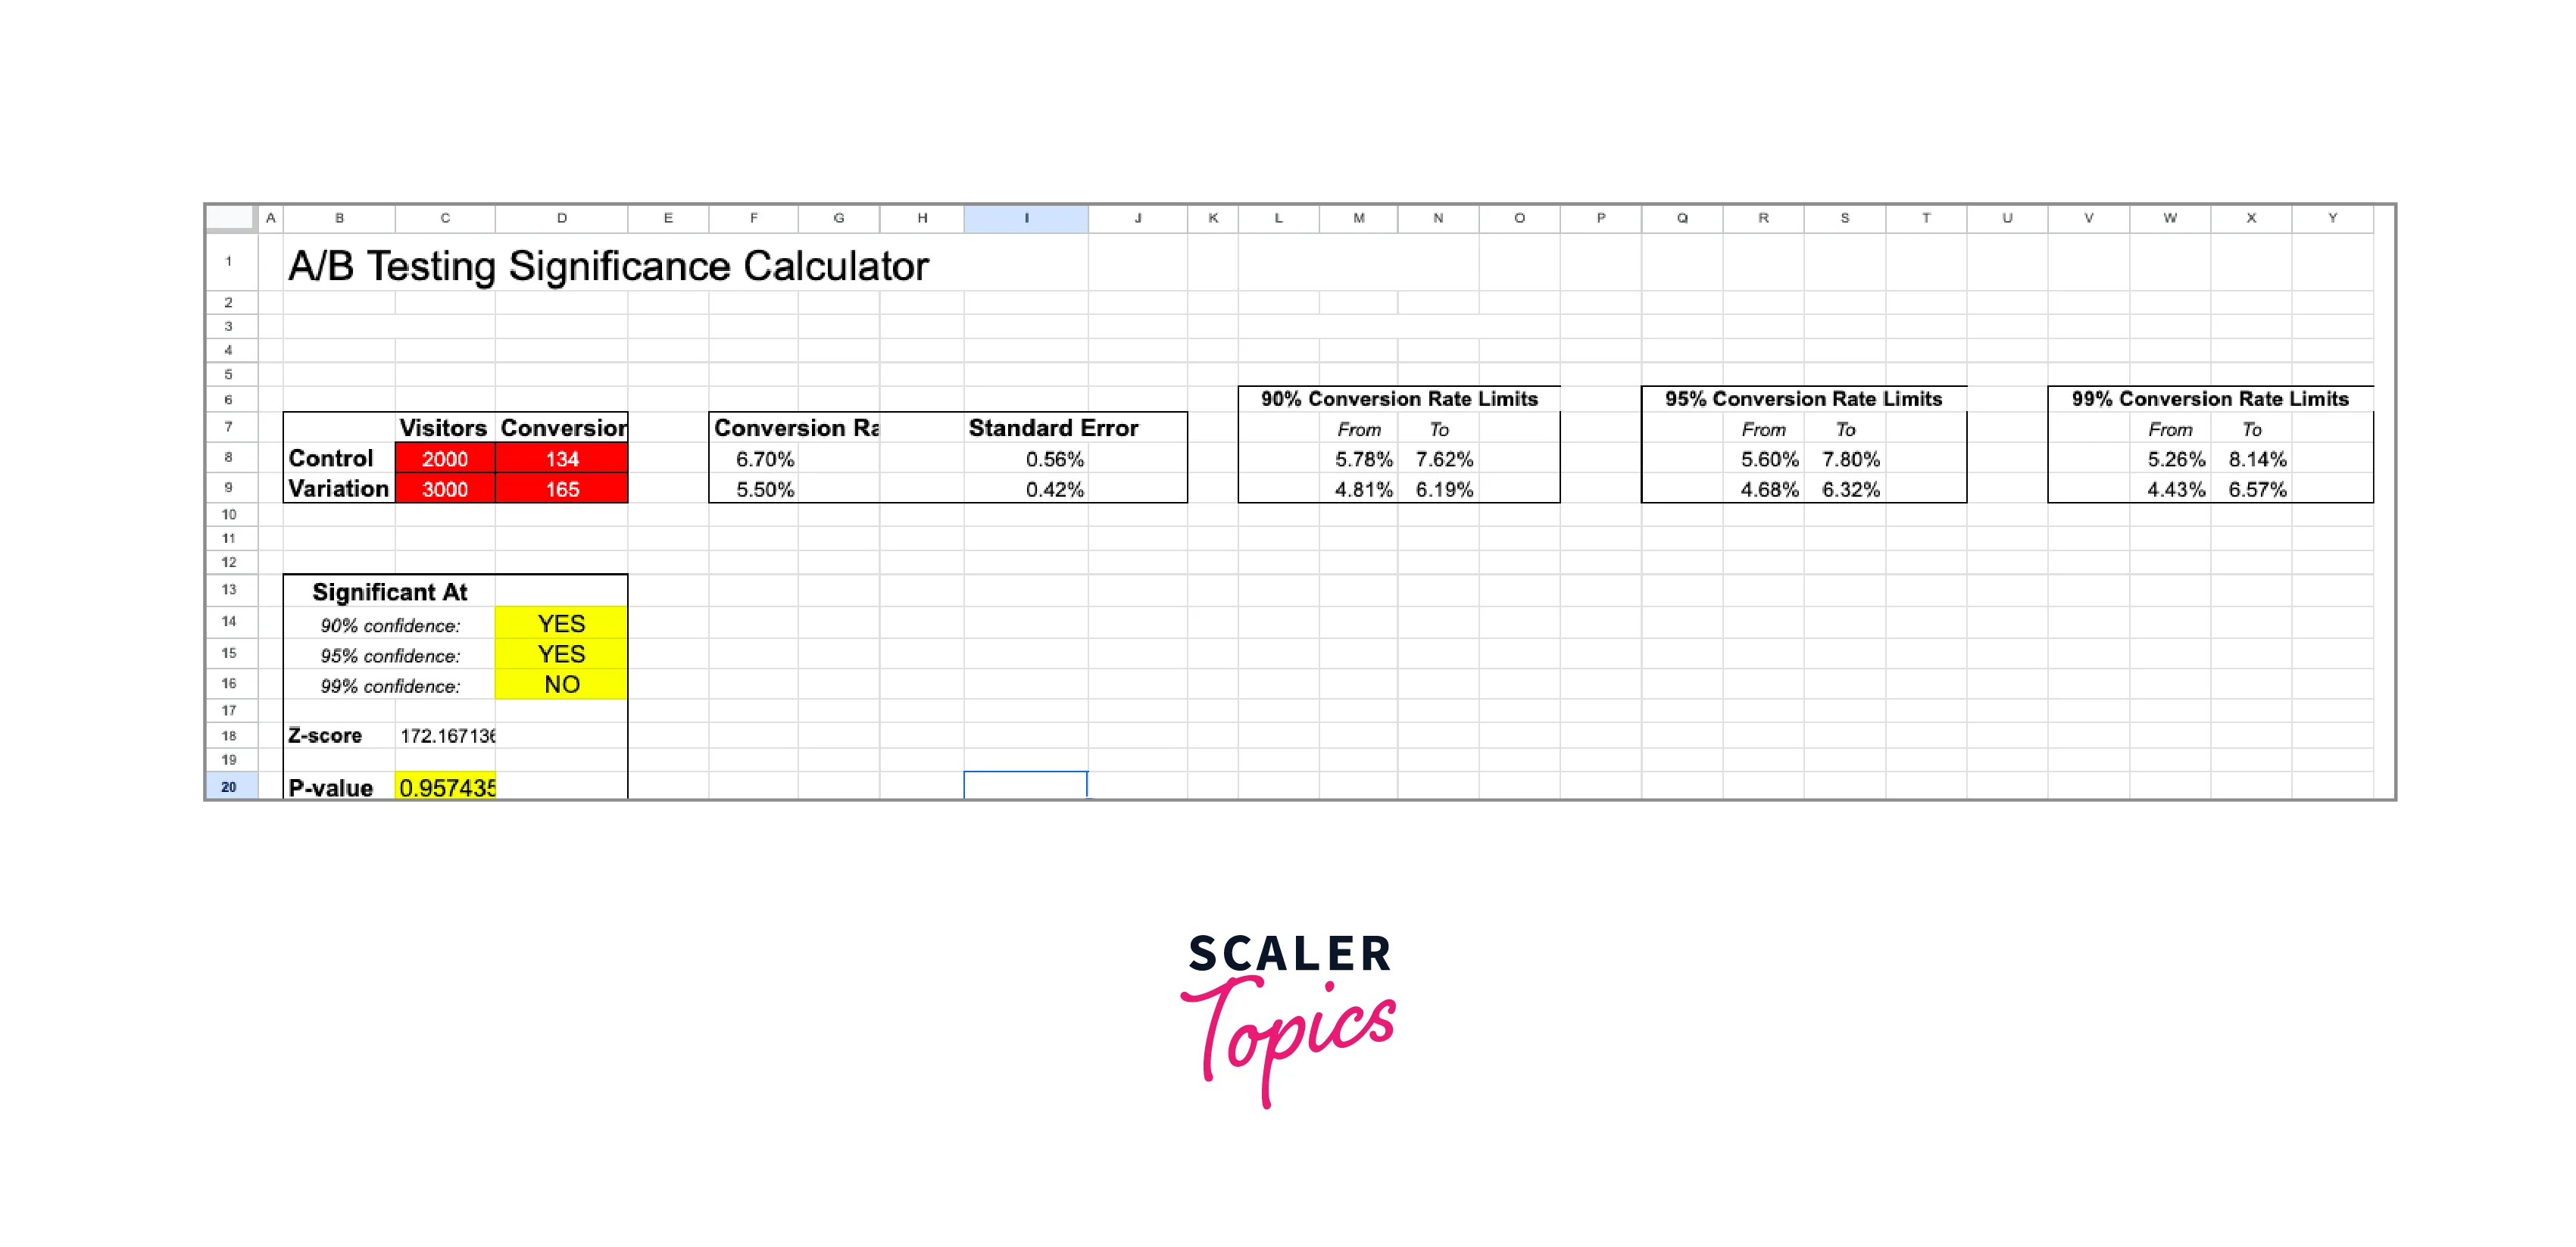
Requirements
As Excel is a self-contained software, it doesn't require any external libraries or modules to build an A/B testing framework project. Some recommended requirements for building an A/B testing framework project in Excel:
- Data Analysis ToolPak:
The Data Analysis ToolPak is an Excel add-in that provides data analysis tools such as t-tests, ANOVA, and regression analysis. This add-in needs to be enabled in Excel before using it. - Charts and Graphs:
Excel provides various chart and graph options to visualize the results of A/B testing. Creating charts and graphs in Excel is easy, and you can customize them according to your needs.
A/B Testing in Excel
Step - 1: Define your Hypothesis
- Hypothesis: Changing the color of the "Buy Now" button on a website from green to blue will result in a higher click-through rate (CTR).
- Null hypothesis: Changing the color of the "Buy Now" button on a website from green to blue will not result in a higher CTR.
That implies that we immediately presume Variation B is NOT a substantial improvement over Variation A. We either fail it or demonstrate that Variant B's conversion rate outperforms Variation A statistically, or we succeed in doing so.
Step - 2: Set Up your Experiment
- Create two versions of the web page, one with a green "Buy Now" button and the other with a blue "Buy Now" button.
- Randomly divide the website visitors into two groups, with one group seeing the green button and the other group seeing the blue button.
- Record the number of clicks for each group over a specific time (e.g., one week).

Step - 3: Randomly Assign Participants
Use a random number generator function in Excel to assign each participant to either the control group (green button) or the test group (blue button).
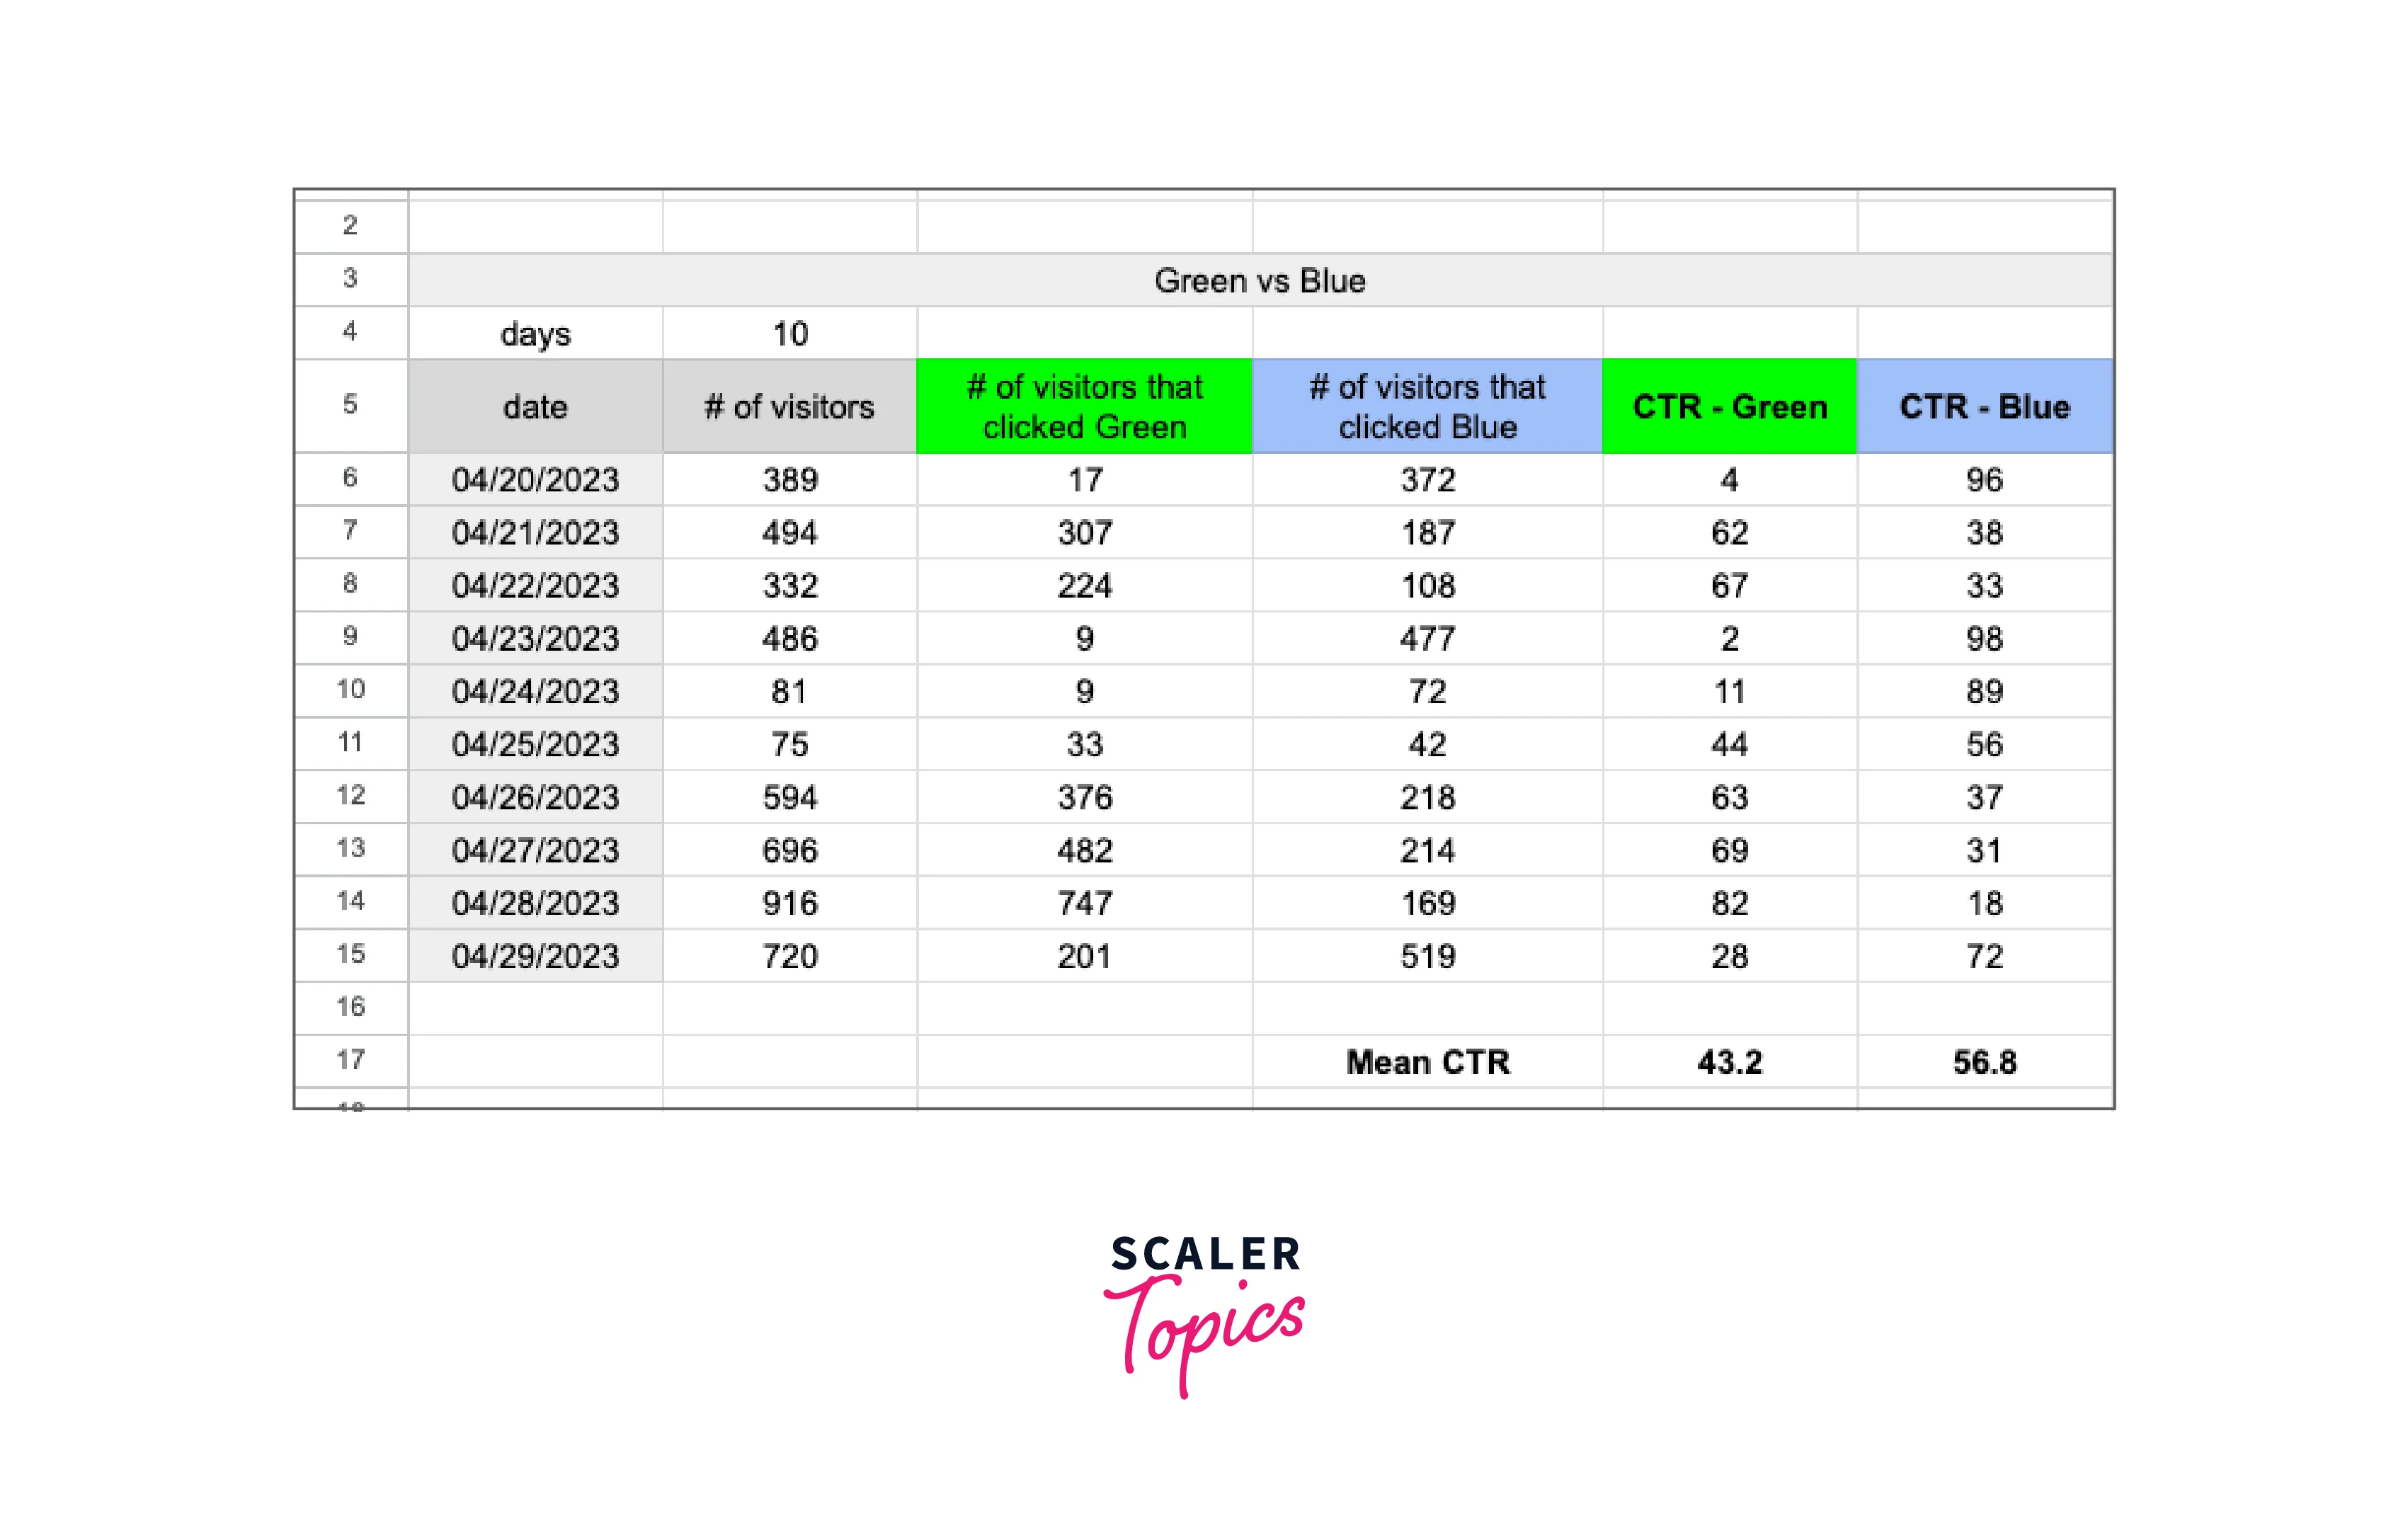
Step 4: Record your Results
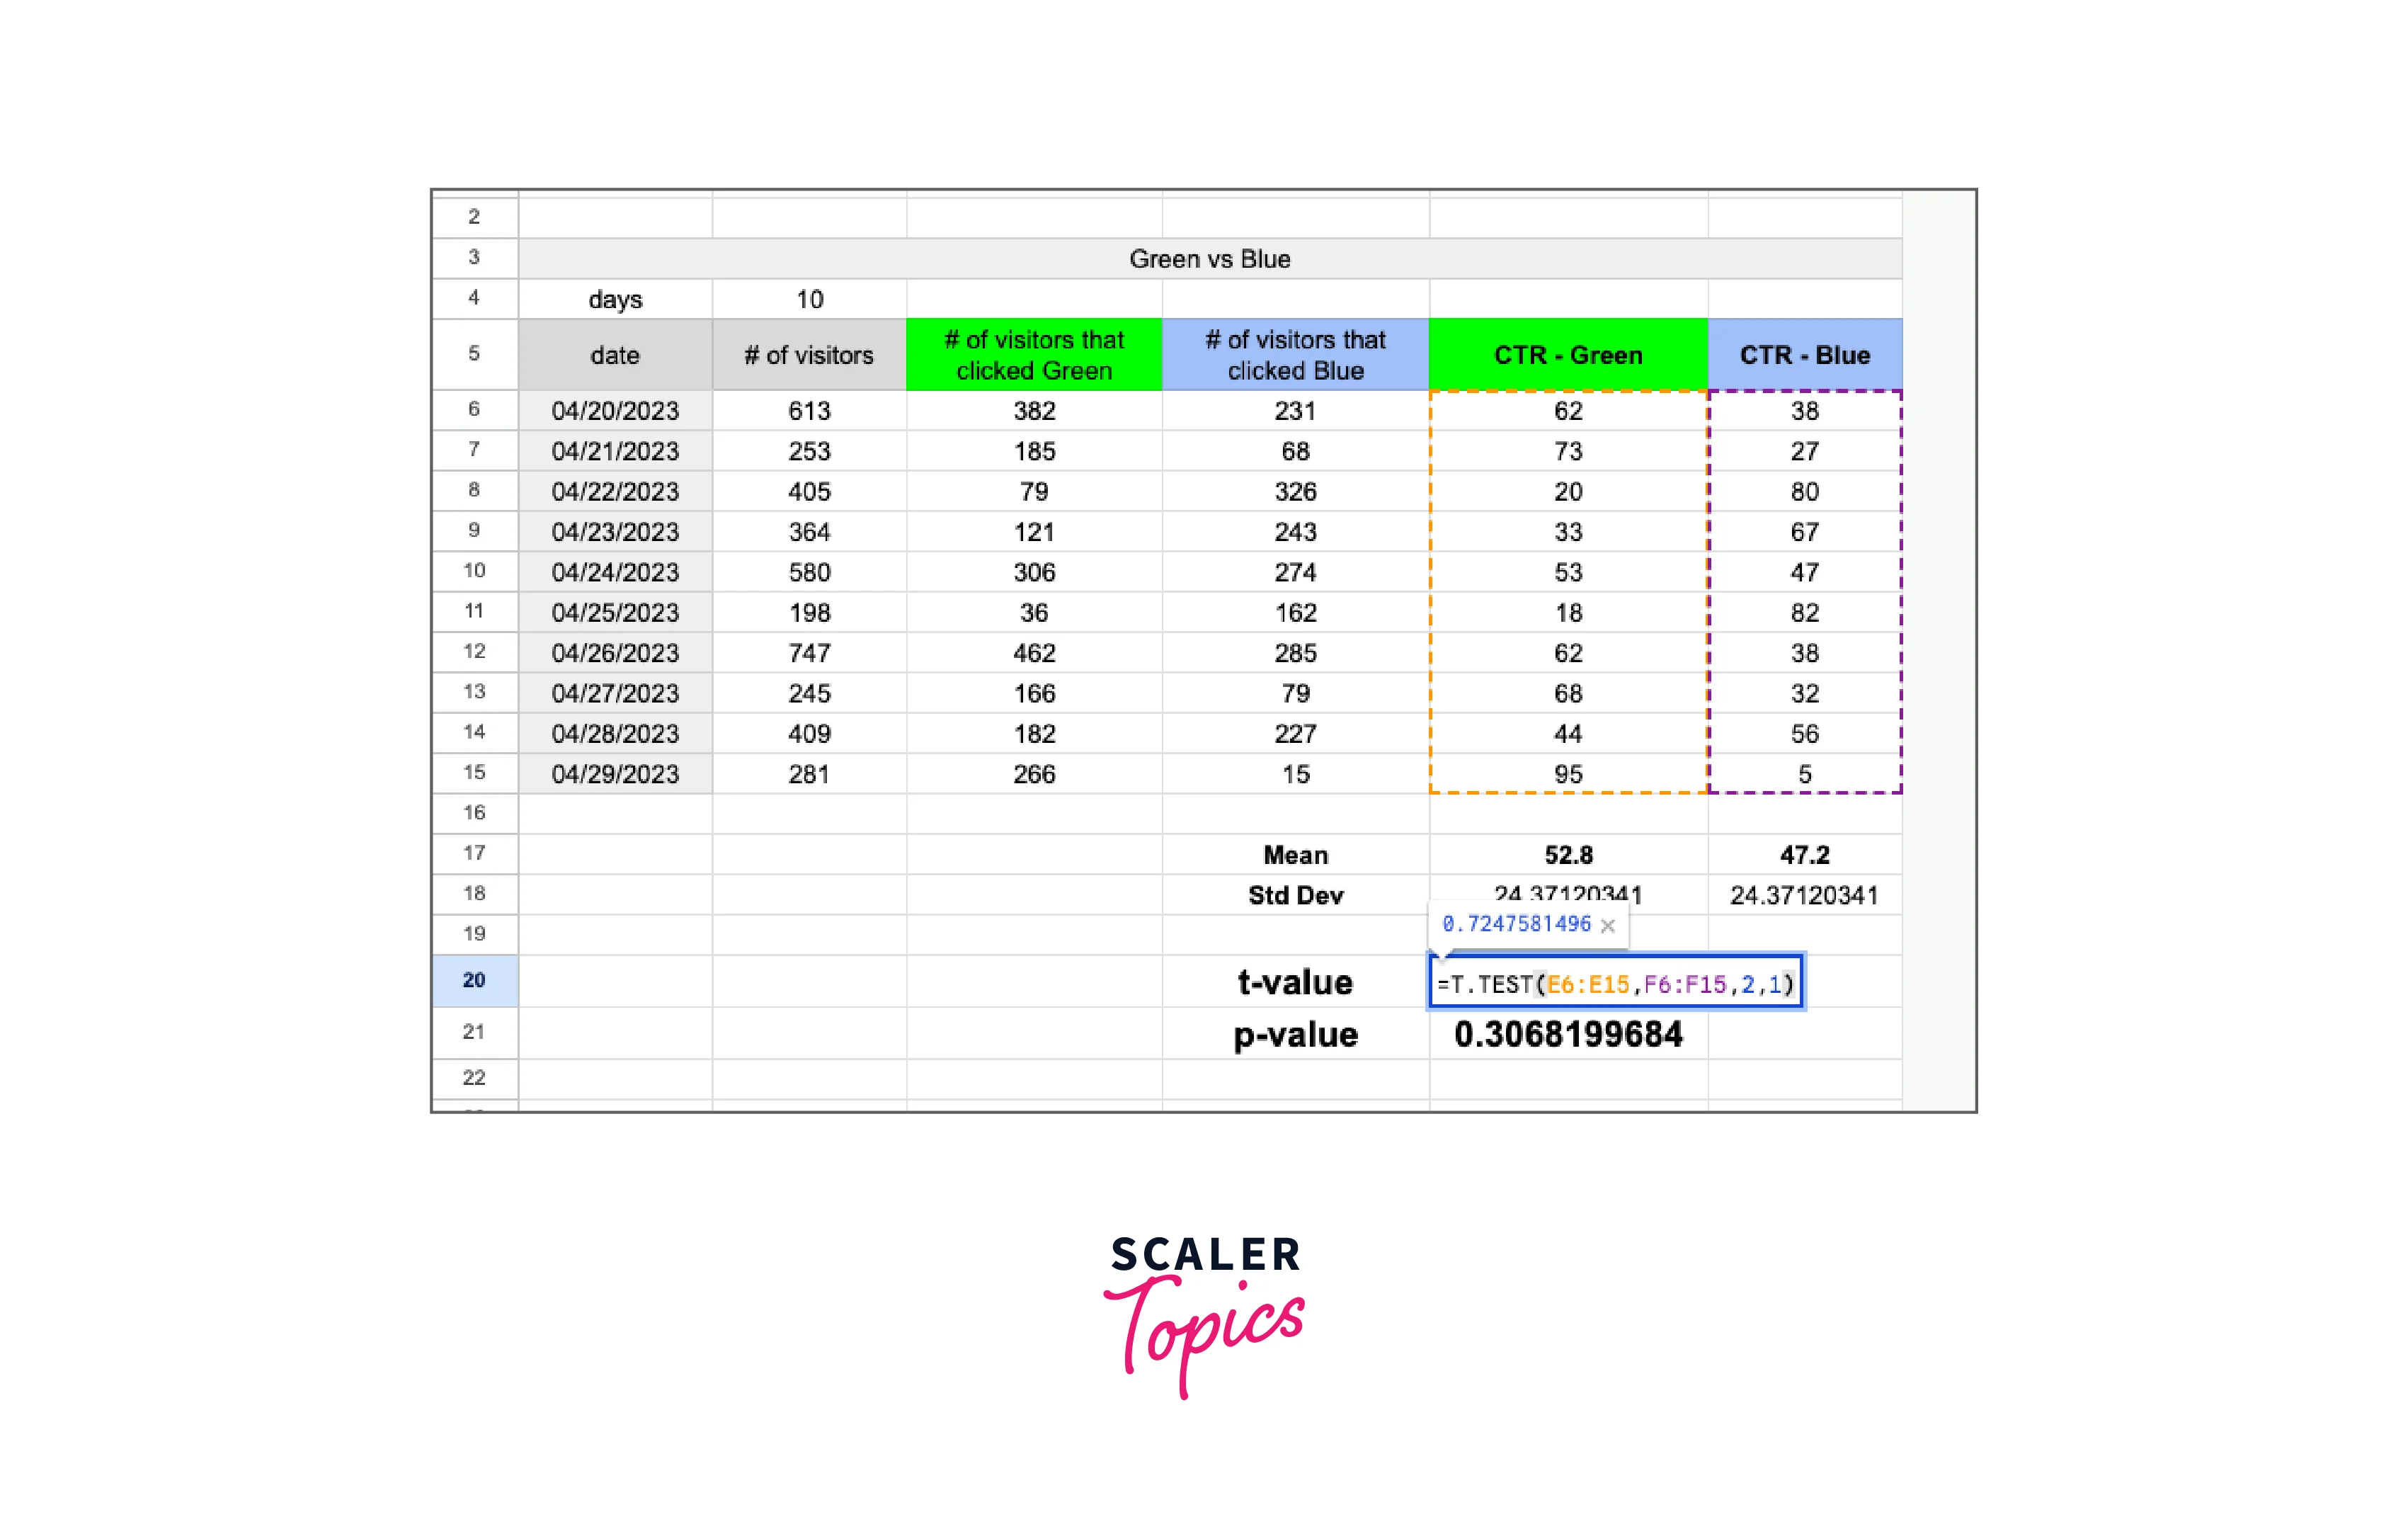
- Create a table in Excel to record the number of clicks for each group.
- Calculate the click-through rate (CTR) for each group by dividing the number of clicks by the number of participants in each group.
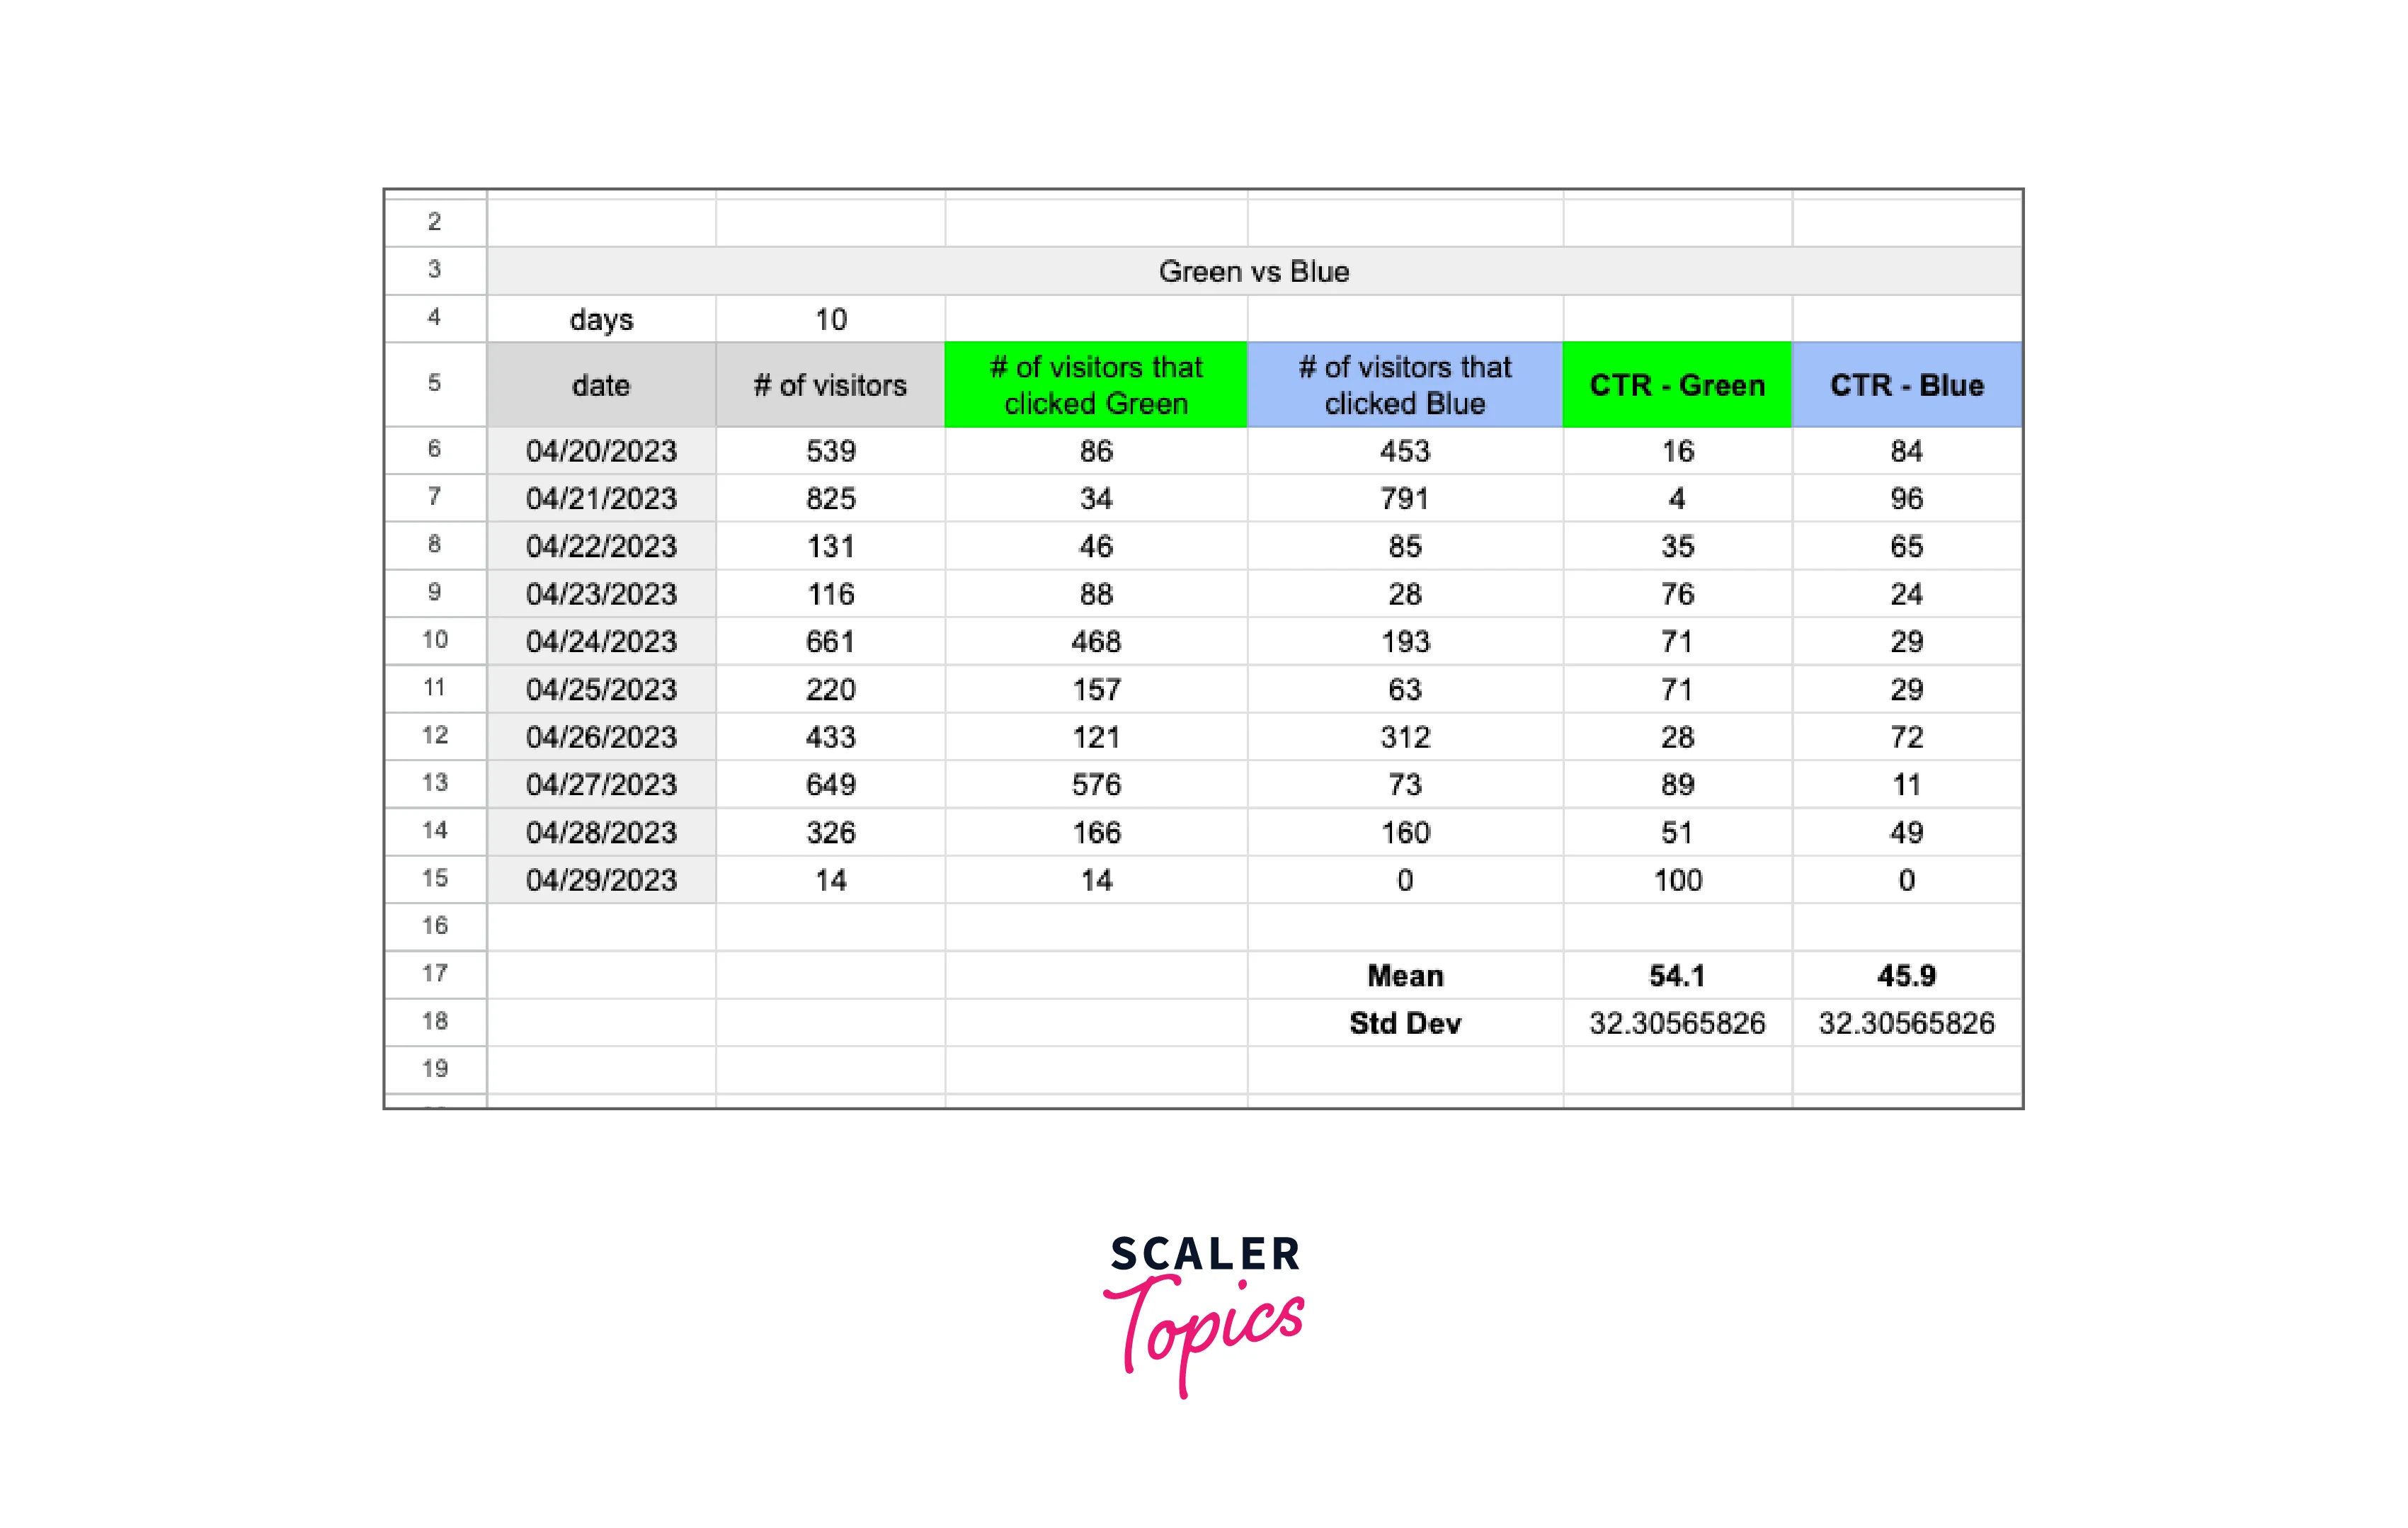
Step 5: Calculate the Mean and Standard Deviation
- Use the AVERAGE function in Excel to calculate the mean CTR for each group.
- Use the STDEV function in Excel to calculate the standard deviation of the CTR for each group.
Step 6: Calculate the t-value
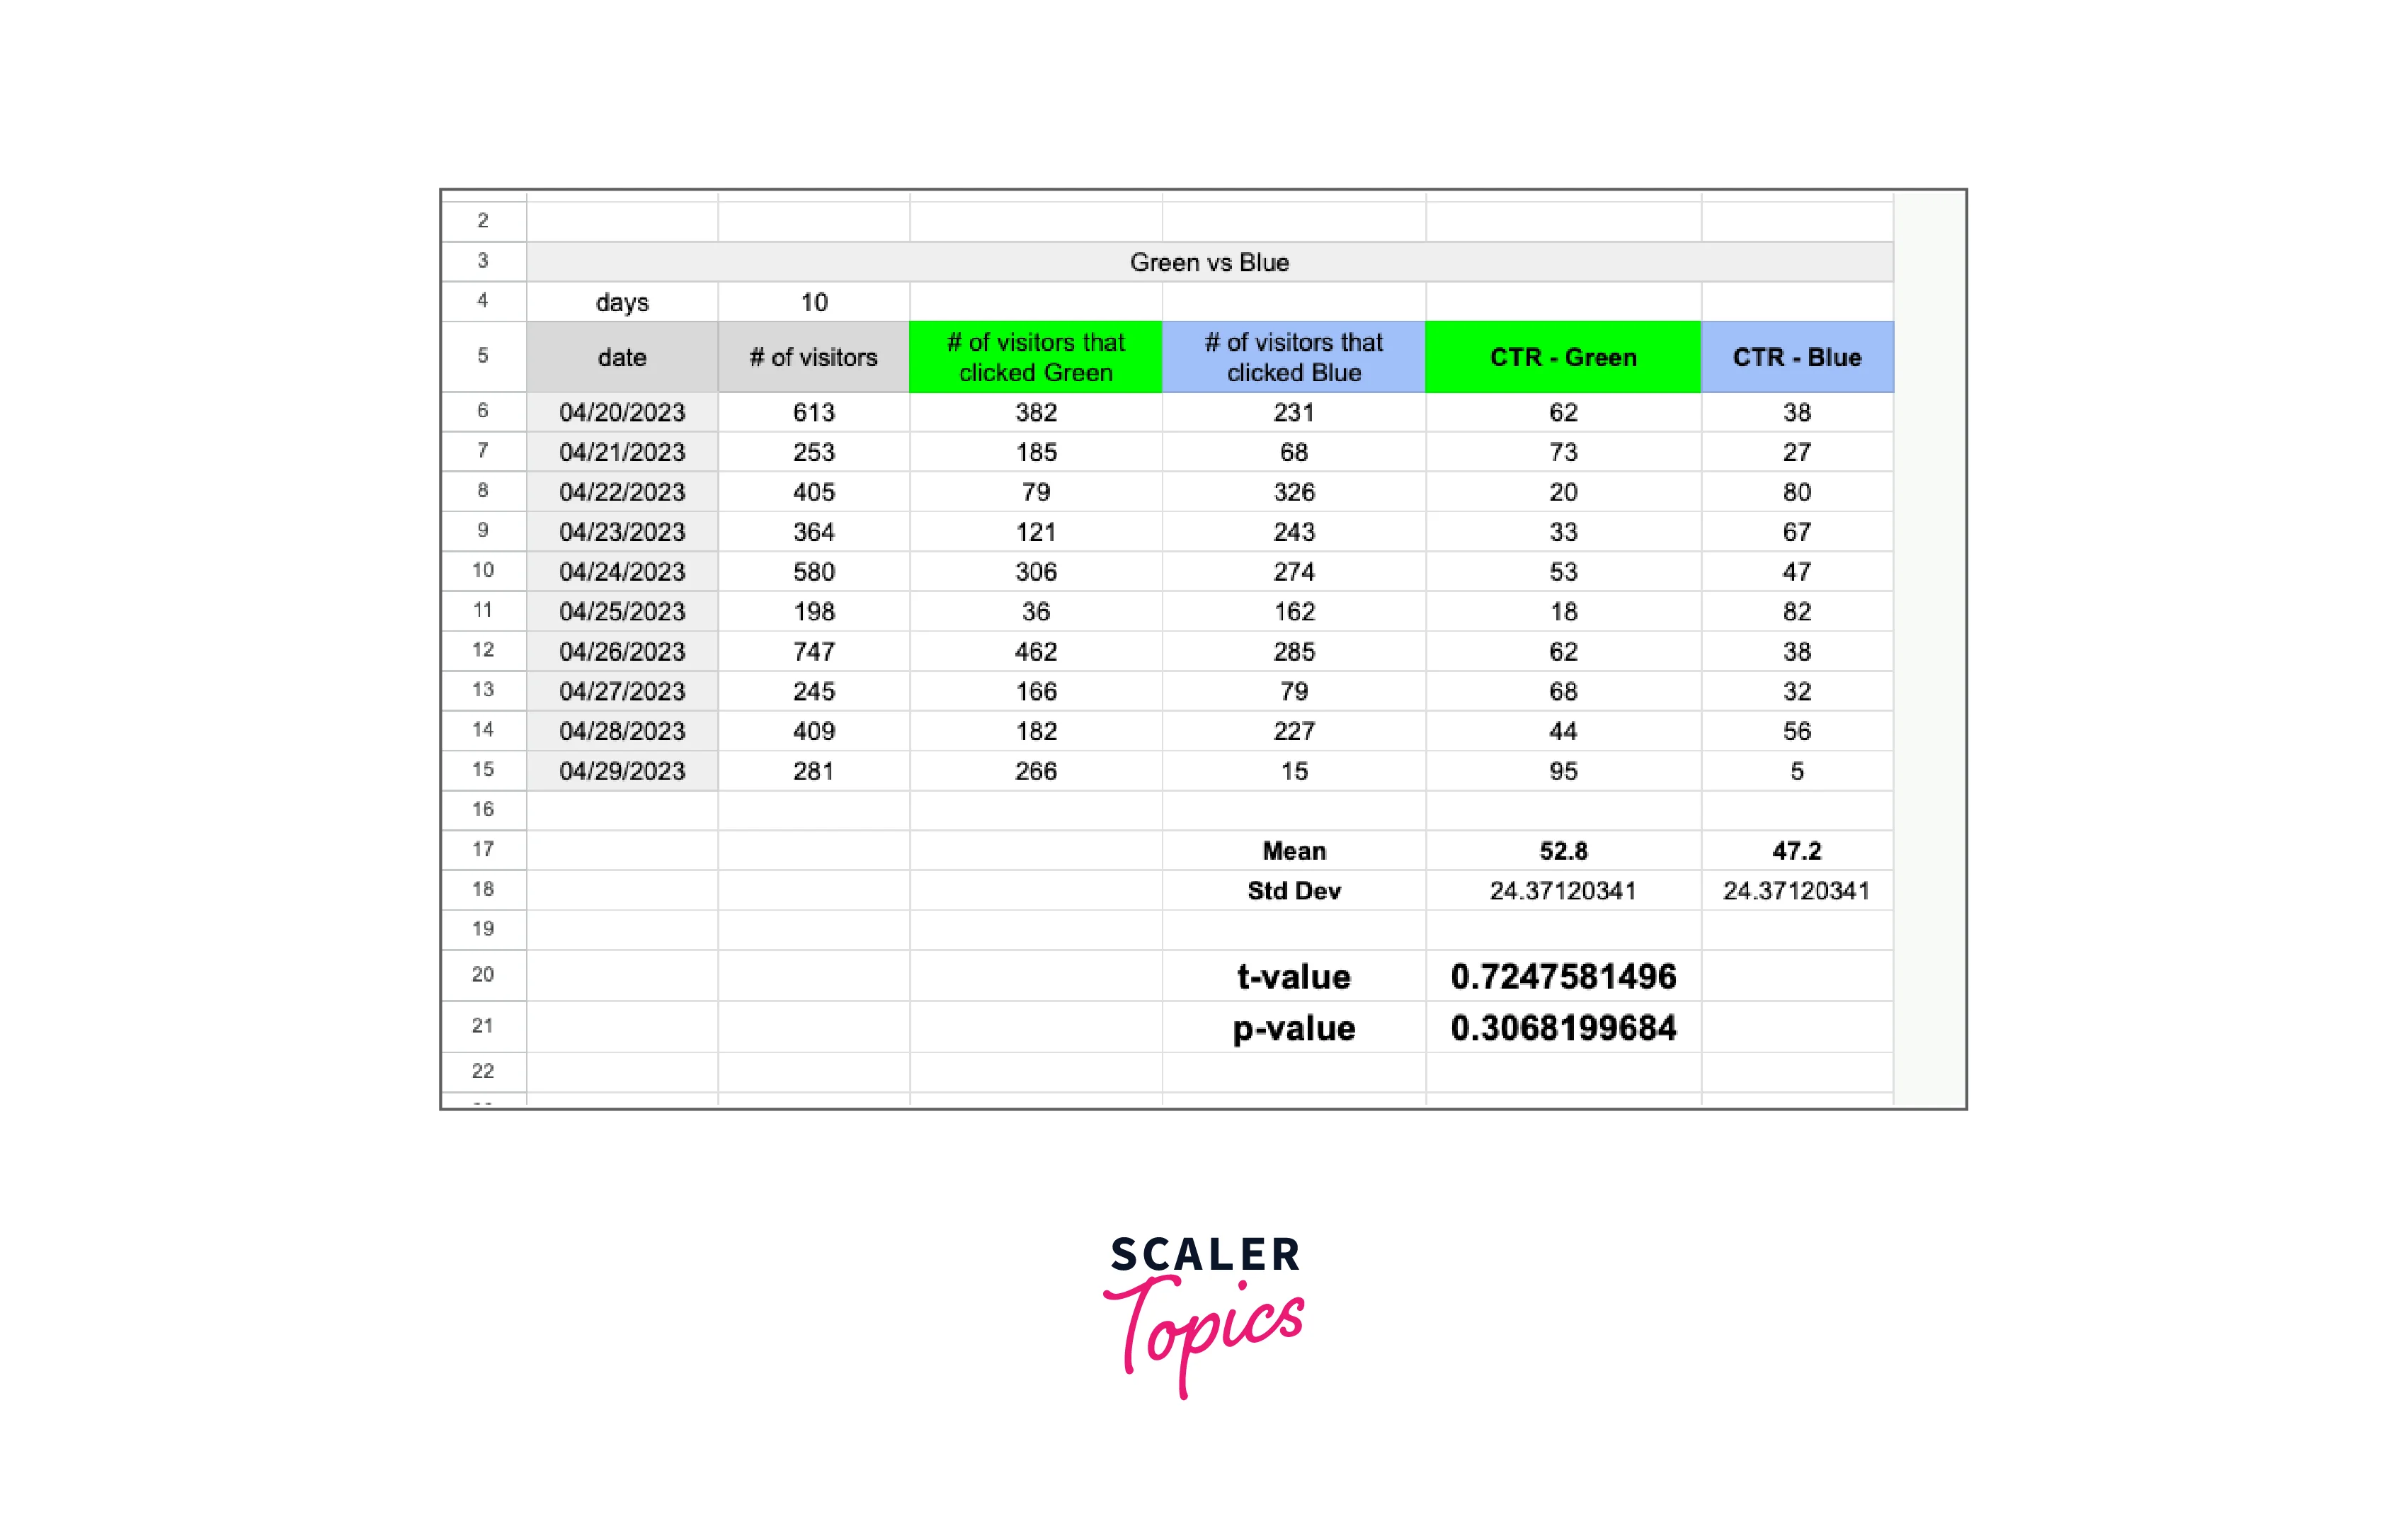
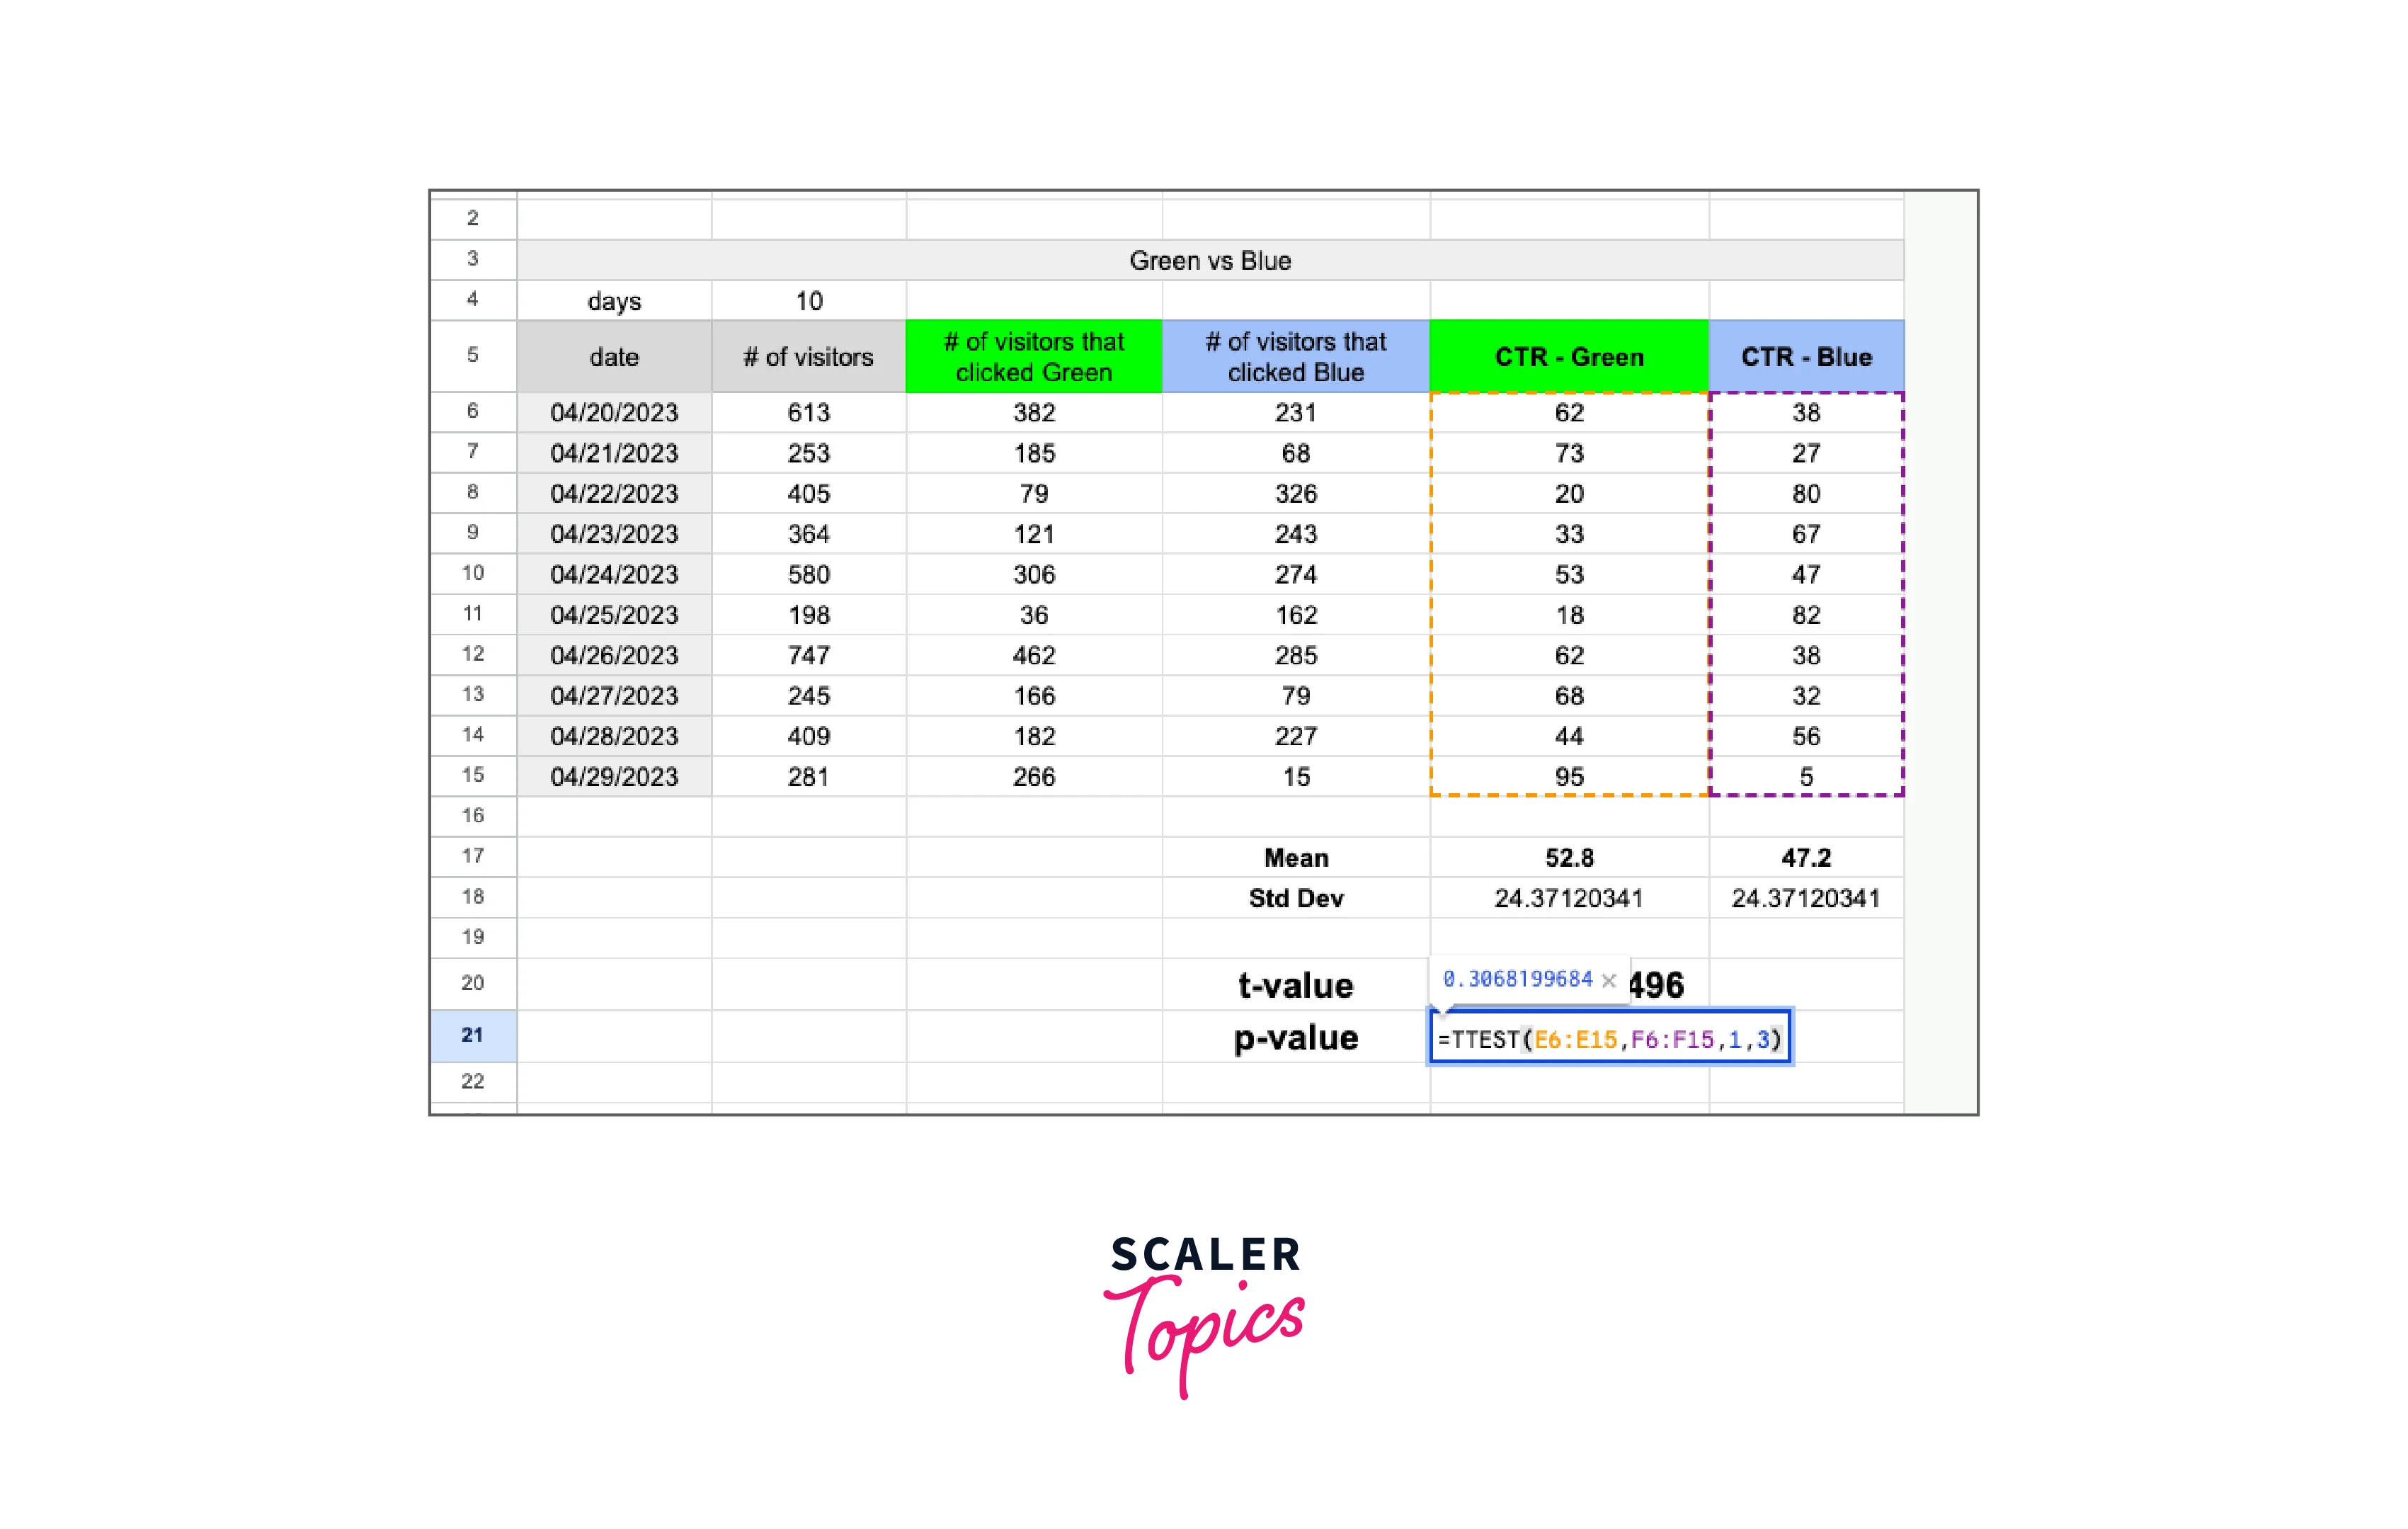
- Use the T.TEST function in Excel to calculate the t-value and p-value for the experiment.
- The t-value represents the difference in means between the control and test groups
- While the p-value indicates the statistical significance of the difference.
- Set the type of test to "two-sample equal variance" since we are comparing the means of two groups with equal variances.
Step 7: Interpret the Results
The null hypothesis can be rejected, and it can be said that the change in button color had a statistically significant impact on the CTR if the p-value is less than the significance level (for example, 0.05). Thus, we cannot rule out the null hypothesis and conclude that the CTR was not significantly affected by the change in button color.
This example shows that the test group's mean CTR is greater than the control group's (green button) and that the difference is statistically significant because the p-value from the T.TEST function is less than 0.05. We can thus rule out the null hypothesis and conclude that the CTR was positively impacted by the "Purchase Now" button's switch from green to blue.
More on A/B Testing in Excel
-
Use a large enough sample size:
To guarantee that your results are precise and representative of the population you are evaluating, you must use a sample size that is large enough. A limited sample size might result in misleading findings and erroneous inferences. The required sample size will vary depending on several variables, including the degree of data variability, the desired level of confidence, and the impact size you are looking to measure. Generally speaking, a bigger sample size will produce more accurate results, lower the margin of error, and boost the test's power. -
Randomize the assignment of participants:
To avoid bias and guarantee the validity of the results, randomization is a critical component of A/B testing. To distribute members to each group at random, use Excel's RAND function. It's critical to ensure the two groups share the same demographics, hobbies, and other pertinent criteria, to obtain reliable findings. -
Calculate confidence intervals:
To ascertain the range of values that the genuine difference between the two groups is likely to lie within, you can compute confidence intervals in addition to applying the t-test. Using confidence intervals can help you gauge the accuracy of your findings and assess the size of the impact you are investigating. You can adjust the confidence level to the appropriate degree of significance, which is often 95% or 99%. -
Consider testing multiple variables:
Several variables, such as various colors, designs, or contents, may be tested simultaneously using A/B testing. Testing too many variables at once should be avoided, though, since this might cause interactions and confounding effects that can make it challenging to understand the results. Prioritizing the factors you test and concentrating on those that are most likely to have a substantial influence on your objectives is also crucial. -
Automate your testing:
If you often undertake A/B testing, it may be advantageous to spend money on a tool or piece of software that can automate the procedure and produce reports for you. This can lessen the possibility of bias and inaccuracies induced by human data gathering and analysis while also increasing efficiency and saving time. The design of the experiment, estimation of the sample size, randomization, data collecting, analysis, and reporting can all be aided by a variety of A/B testing tools. It's crucial to pick a tool that is trustworthy, simple to use, accurate, and suitable for your demands and budget.
Conclusion
- Excel's A/B testing feature is a useful tool for contrasting two variants of a product, website, or marketing campaign.
- You must specify your hypothesis and the measurements you'll use to assess the findings before you begin your experiment.
- To eliminate bias in the experiment, volunteers must be randomly assigned to each group.
- Careful data collection and analysis are essential to determining which variant outperformed the others and why.
- You can assess whether the results are significant by using statistical metrics like the mean and standard deviation.
- You may compute the mean differences between two groups and assess if they are statistically significant using Excel's t-value calculation.
