Stock Price Prediction Using Machine Learning

Stock price prediction using machine learning is a fascinating application of artificial intelligence in the financial domain. By leveraging historical data and various algorithms, machine learning models aim to forecast future stock prices, aiding investors in making informed decisions. It involves analyzing historical market data to forecast future price movements. While it's not an exact science, machine learning models can provide valuable insights to traders and investors, aiding in decision-making processes. In this article, we'll delve into the intricacies of building a stock price prediction model.
Fundamental Analysis vs. Technical Analysis
Fundamental analysis involves evaluating a company's financial health, including its earnings, assets, and liabilities, to determine its intrinsic value. On the other hand, technical analysis focuses on analyzing past market data, such as price and volume, to predict future price movements based on patterns and trends.
Fundamental Analysis:
- Entails assessing the financial well-being of a company to ascertain its inherent worth.
- Considers factors like earnings, assets, liabilities, and overall market trends.
- Used in machine learning-based stock price prediction by analyzing historical financial data.
- Key inputs include earnings per share, price-to-earnings ratio, debt-to-equity ratio, etc.
- Helps algorithms understand the relationship between fundamental factors and stock price movements.
Technical Analysis:
- Focuses on analyzing past market data, primarily price, and volume, to predict future price movements.
- Identifies patterns and trends in historical data to determine buy and sell signals.
- Utilizes tools like moving averages, support/resistance levels, and chart patterns.
- Integrated into machine learning models by using historical price data and technical indicators.
- Helps models recognize recurring patterns associated with price movements.
What are we building?
In this article, we embark on the creation of a machine-learning model designed to predict stock prices by leveraging historical market data. The objective is to develop a robust and accurate forecasting system that aids investors and traders in making informed decisions. By analyzing past price movements and employing various algorithms and techniques, we aim to construct a predictive model that provides valuable insights into future price trends.
Pre-requisites
Before delving into the project, it's imperative to grasp several key concepts that form the foundation of machine learning-based stock price prediction:
How are we going to build this?
To construct the stock price prediction model, we'll adhere to a structured approach:
A. Understanding the Problem Statement
The objective of this project is to develop machine learning models capable of accurately predicting future stock prices based on historical stock market data. The goal is to provide investors and traders with reliable forecasts to support their decision-making process in the dynamic stock market environment.
B. About the Algorithms Used
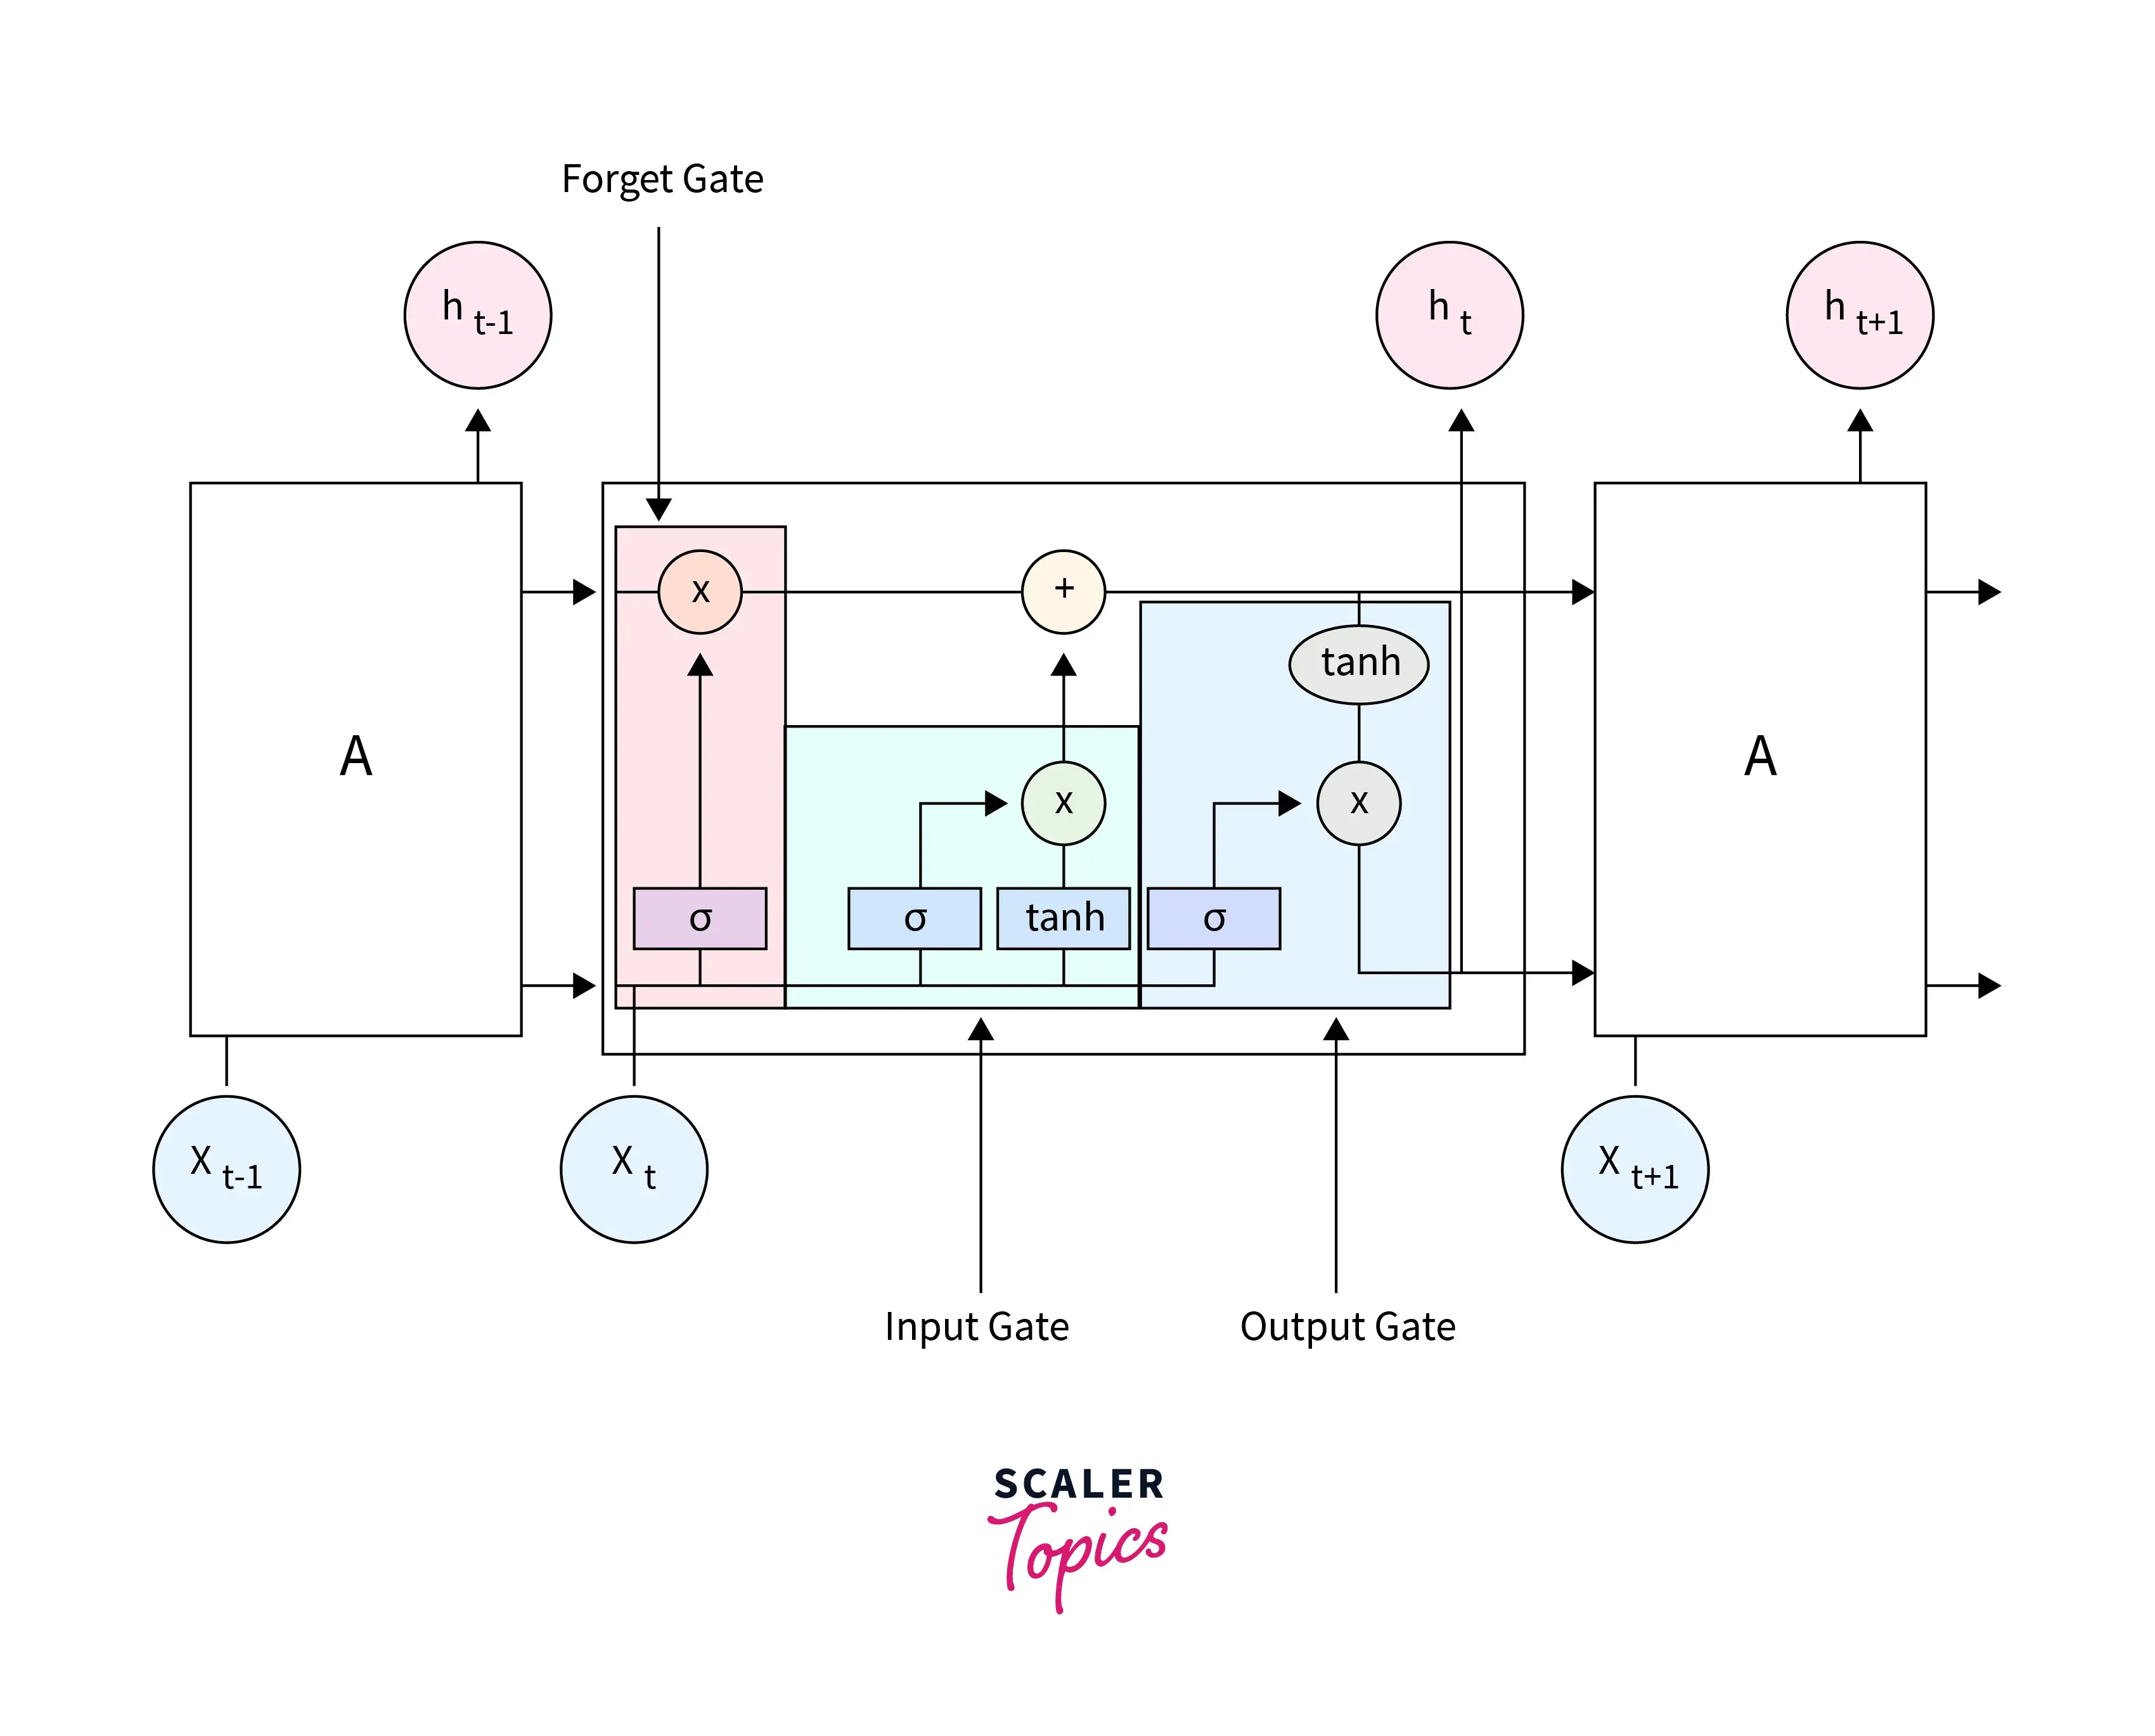
We are building a machine learning model to predict stock prices using Long Short-Term Memory (LSTM) neural networks. LSTM networks are well-suited for sequence prediction tasks, making them ideal for analyzing time series data like stock prices.
LSTM (Long Short-Term Memory) is a specialized recurrent neural network architecture designed to model sequential data effectively. It addresses the vanishing gradient problem encountered in traditional RNNs, enabling it to capture long-term dependencies in sequences. With its three gates regulating information flow, LSTM networks selectively retain or discard information over time, making them adept at analyzing historical patterns in data. Particularly in stock price prediction, LSTM's ability to learn from past information allows it to forecast future stock prices accurately. Overall, LSTM networks offer a powerful solution for modeling sequential data, making them valuable tools in various domains, including finance.
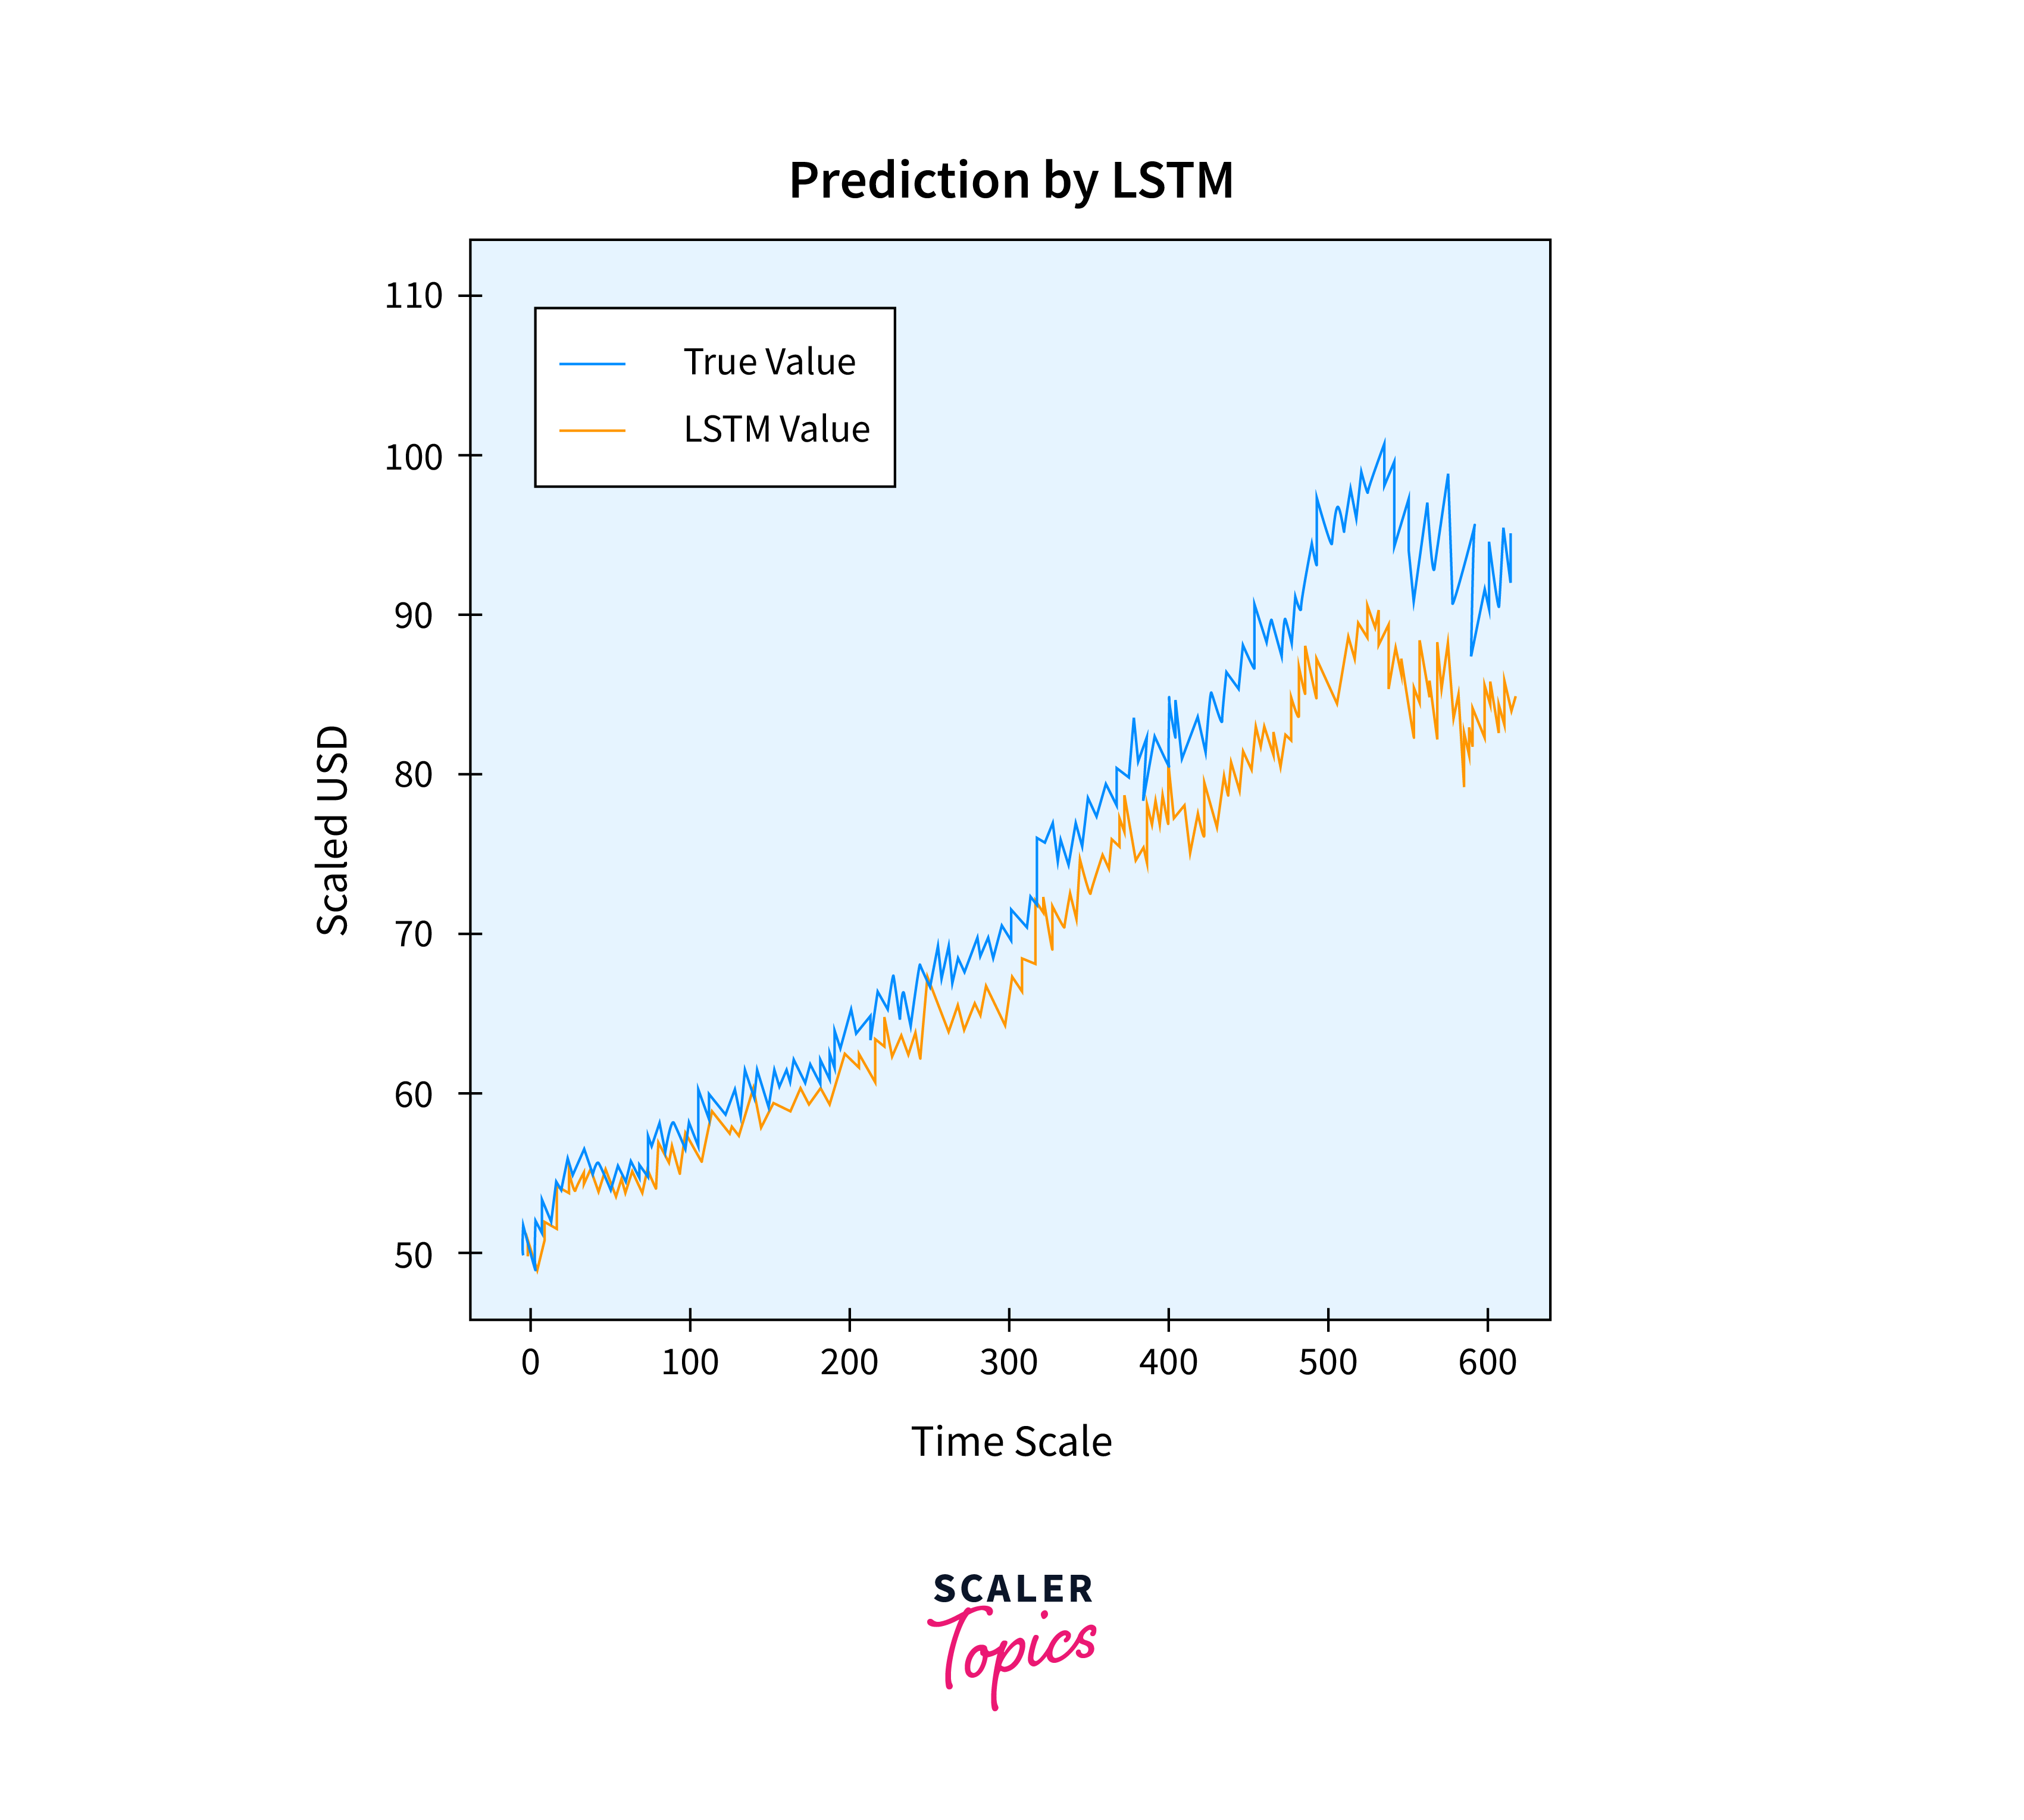
Final Output
This is what our result is going to look like:
Requirements
To execute this project, you'll need the following libraries and modules:
- NumPy
- Pandas
- Scikit-learn
- Matplotlib
- TensorFlow or PyTorch
- Pycharm/Google Colab or any Python editor
About the Data
Let's examine the data that we will be working with. The stock price information will be sent in the form of a comma-separated file (.csv), which may be opened and examined in a spreadsheet or Microsoft Excel. Trading is not permitted on Saturdays or Sundays in the market. There is a space between the two dates as a result. For every date, the stock's Opening Value, its Highest and Lowest values on that particular day, and its Closing Value at the end of the trading day are all displayed.
The Adjusted Close Value shows the stock's value following dividend announcements. In addition, the total volume of stocks traded on the market is given. Our task with this information is to examine the data and create various algorithms that could be able to identify trends in the historical data of the stock.
Building the Stock Price Prediction Model
In the process of building a stock price prediction model using machine learning, several key steps are involved to ensure the development of an effective and accurate classifier. Let's delve into each of these steps:
Importing the Libraries
Start by importing the necessary libraries for data preprocessing, model development, and visualization.
Importing the Dataset
Next, import the stock price dataset. This dataset contains historical stock prices that will be used to train and test the LSTM model.
EDA (Exploratory Data Analysis)
Conducting exploratory data analysis is crucial for gaining insights into the dataset's characteristics and identifying patterns that may influence stock prices. This step involves visualizing the data, examining summary statistics, detecting outliers, and exploring relationships between variables.
We are first printing the dataset's structure in this stage. The data frame will next be examined for null values to make sure there aren't any. Because null values act as outliers and introduce large volatility into the training process, their presence in the dataset causes problems during training.
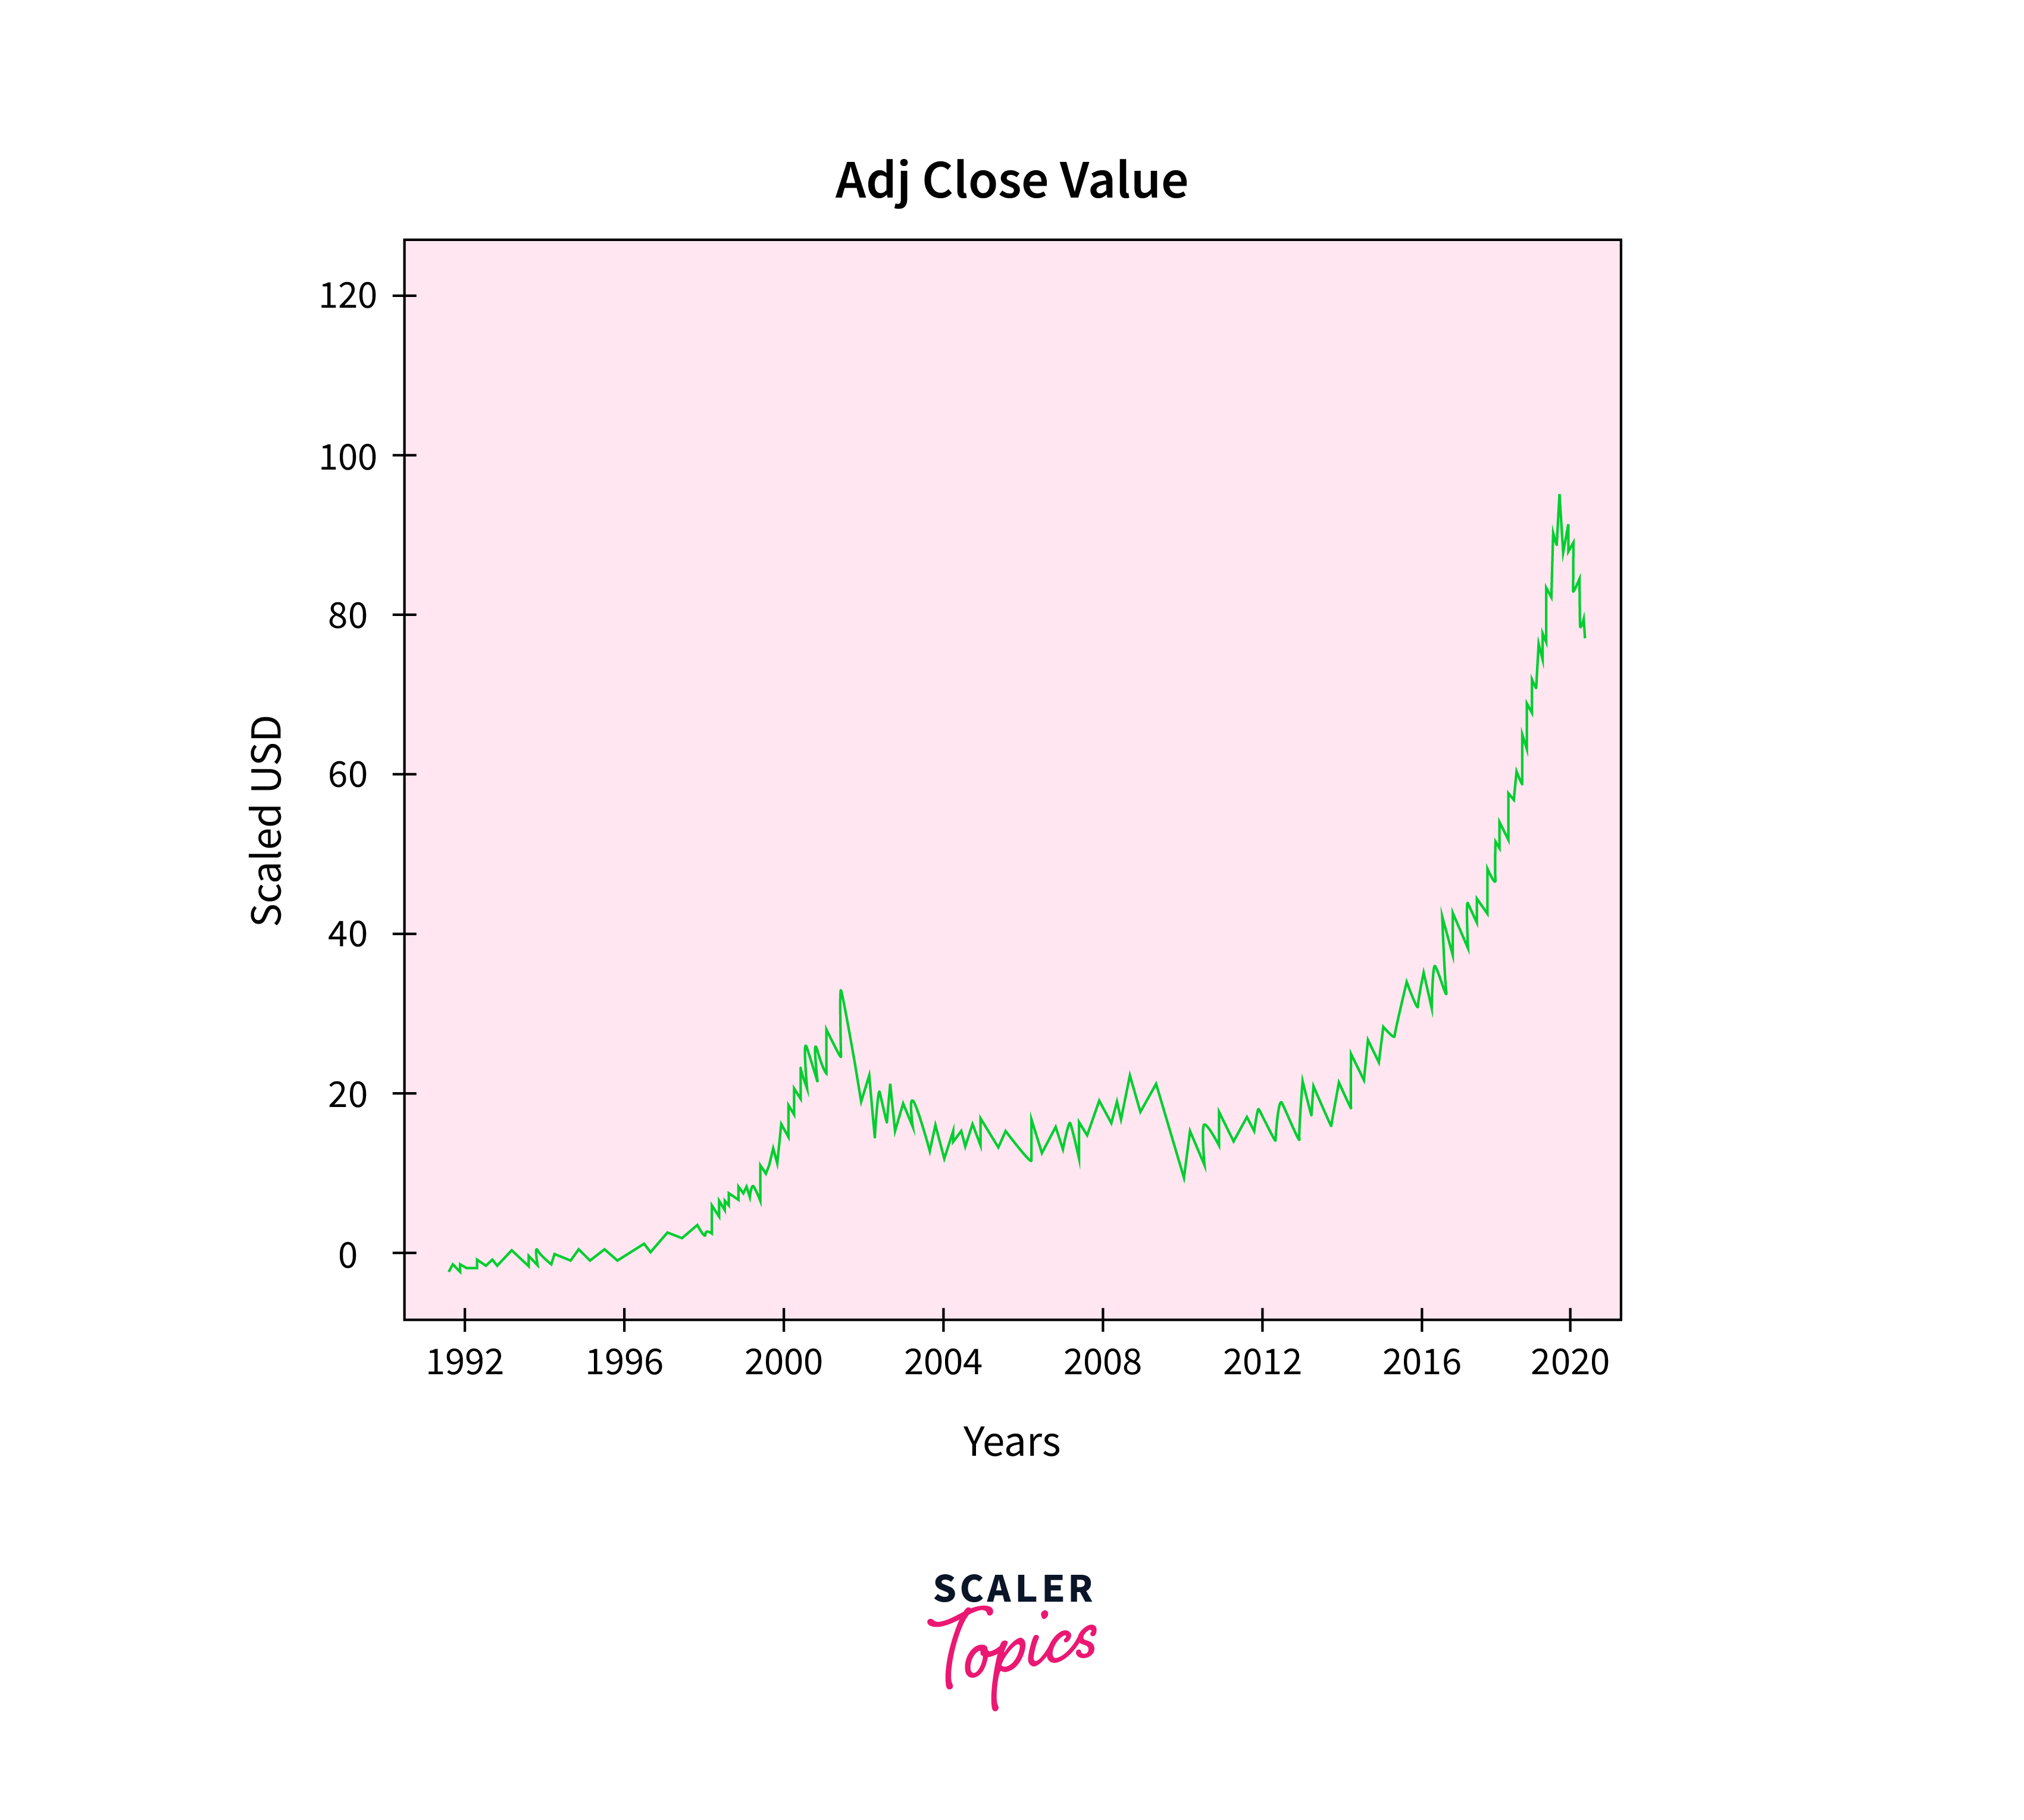
Output:
The ultimate output value that the machine learning model will forecast is called the Adjusted Close Value. The closing price of the stock on that specific day of trading on the stock market is shown in this figure.
Output:
Feature Engineering
Feature engineering plays a vital role in enhancing the predictive power of the model. In this step, relevant features are extracted from the dataset, and new features may be engineered to capture important patterns and relationships.
We assign the output column to the target variable. In this case, it is the stock's adjusted relative value. Additionally, we select the qualities that act as the target variable's independent variable (dependent variable).
Data Splitting and Normalization
We will scale the stock values to values between 0 and 1 in order to reduce the processing cost of the data in the table. This reduces all of the data in big quantities, which in turn reduces memory usage. Furthermore, by scaling down, we can attain greater precision because the data is not dispersed over large quantities. We will use the sci-kit-learn library's MinMaxScaler class to do this.
Next, we divide the dataset into training and test sets before adding the whole collection to the training model. The training set's data will be used to train the Machine Learning LSTM model, and the test set will be used to evaluate the model's accuracy and backpropagation. Ten splits will be configured, meaning that 10% of the data will be used as the test set and the remaining 90% will be used to train the LSTM model.
Data Processing For LSTM
Now we will enter the data into the LSTM model after the training and test sets are complete. The training and test set data must first be converted into a format that the LSTM model can understand before we can proceed. We first convert the training and test data to NumPy arrays because the LSTM requires the data to be provided in three dimensions. We next reorganize the data to conform to the format (Number of Samples, 1, Number of Features). Currently, there are 6667 samples in the training set or 90% of 7334, and there are 4 characteristics. The training set is therefore modified to account for this (6667, 1, 4). The test set is also reorganized.
Model Development and Evaluation
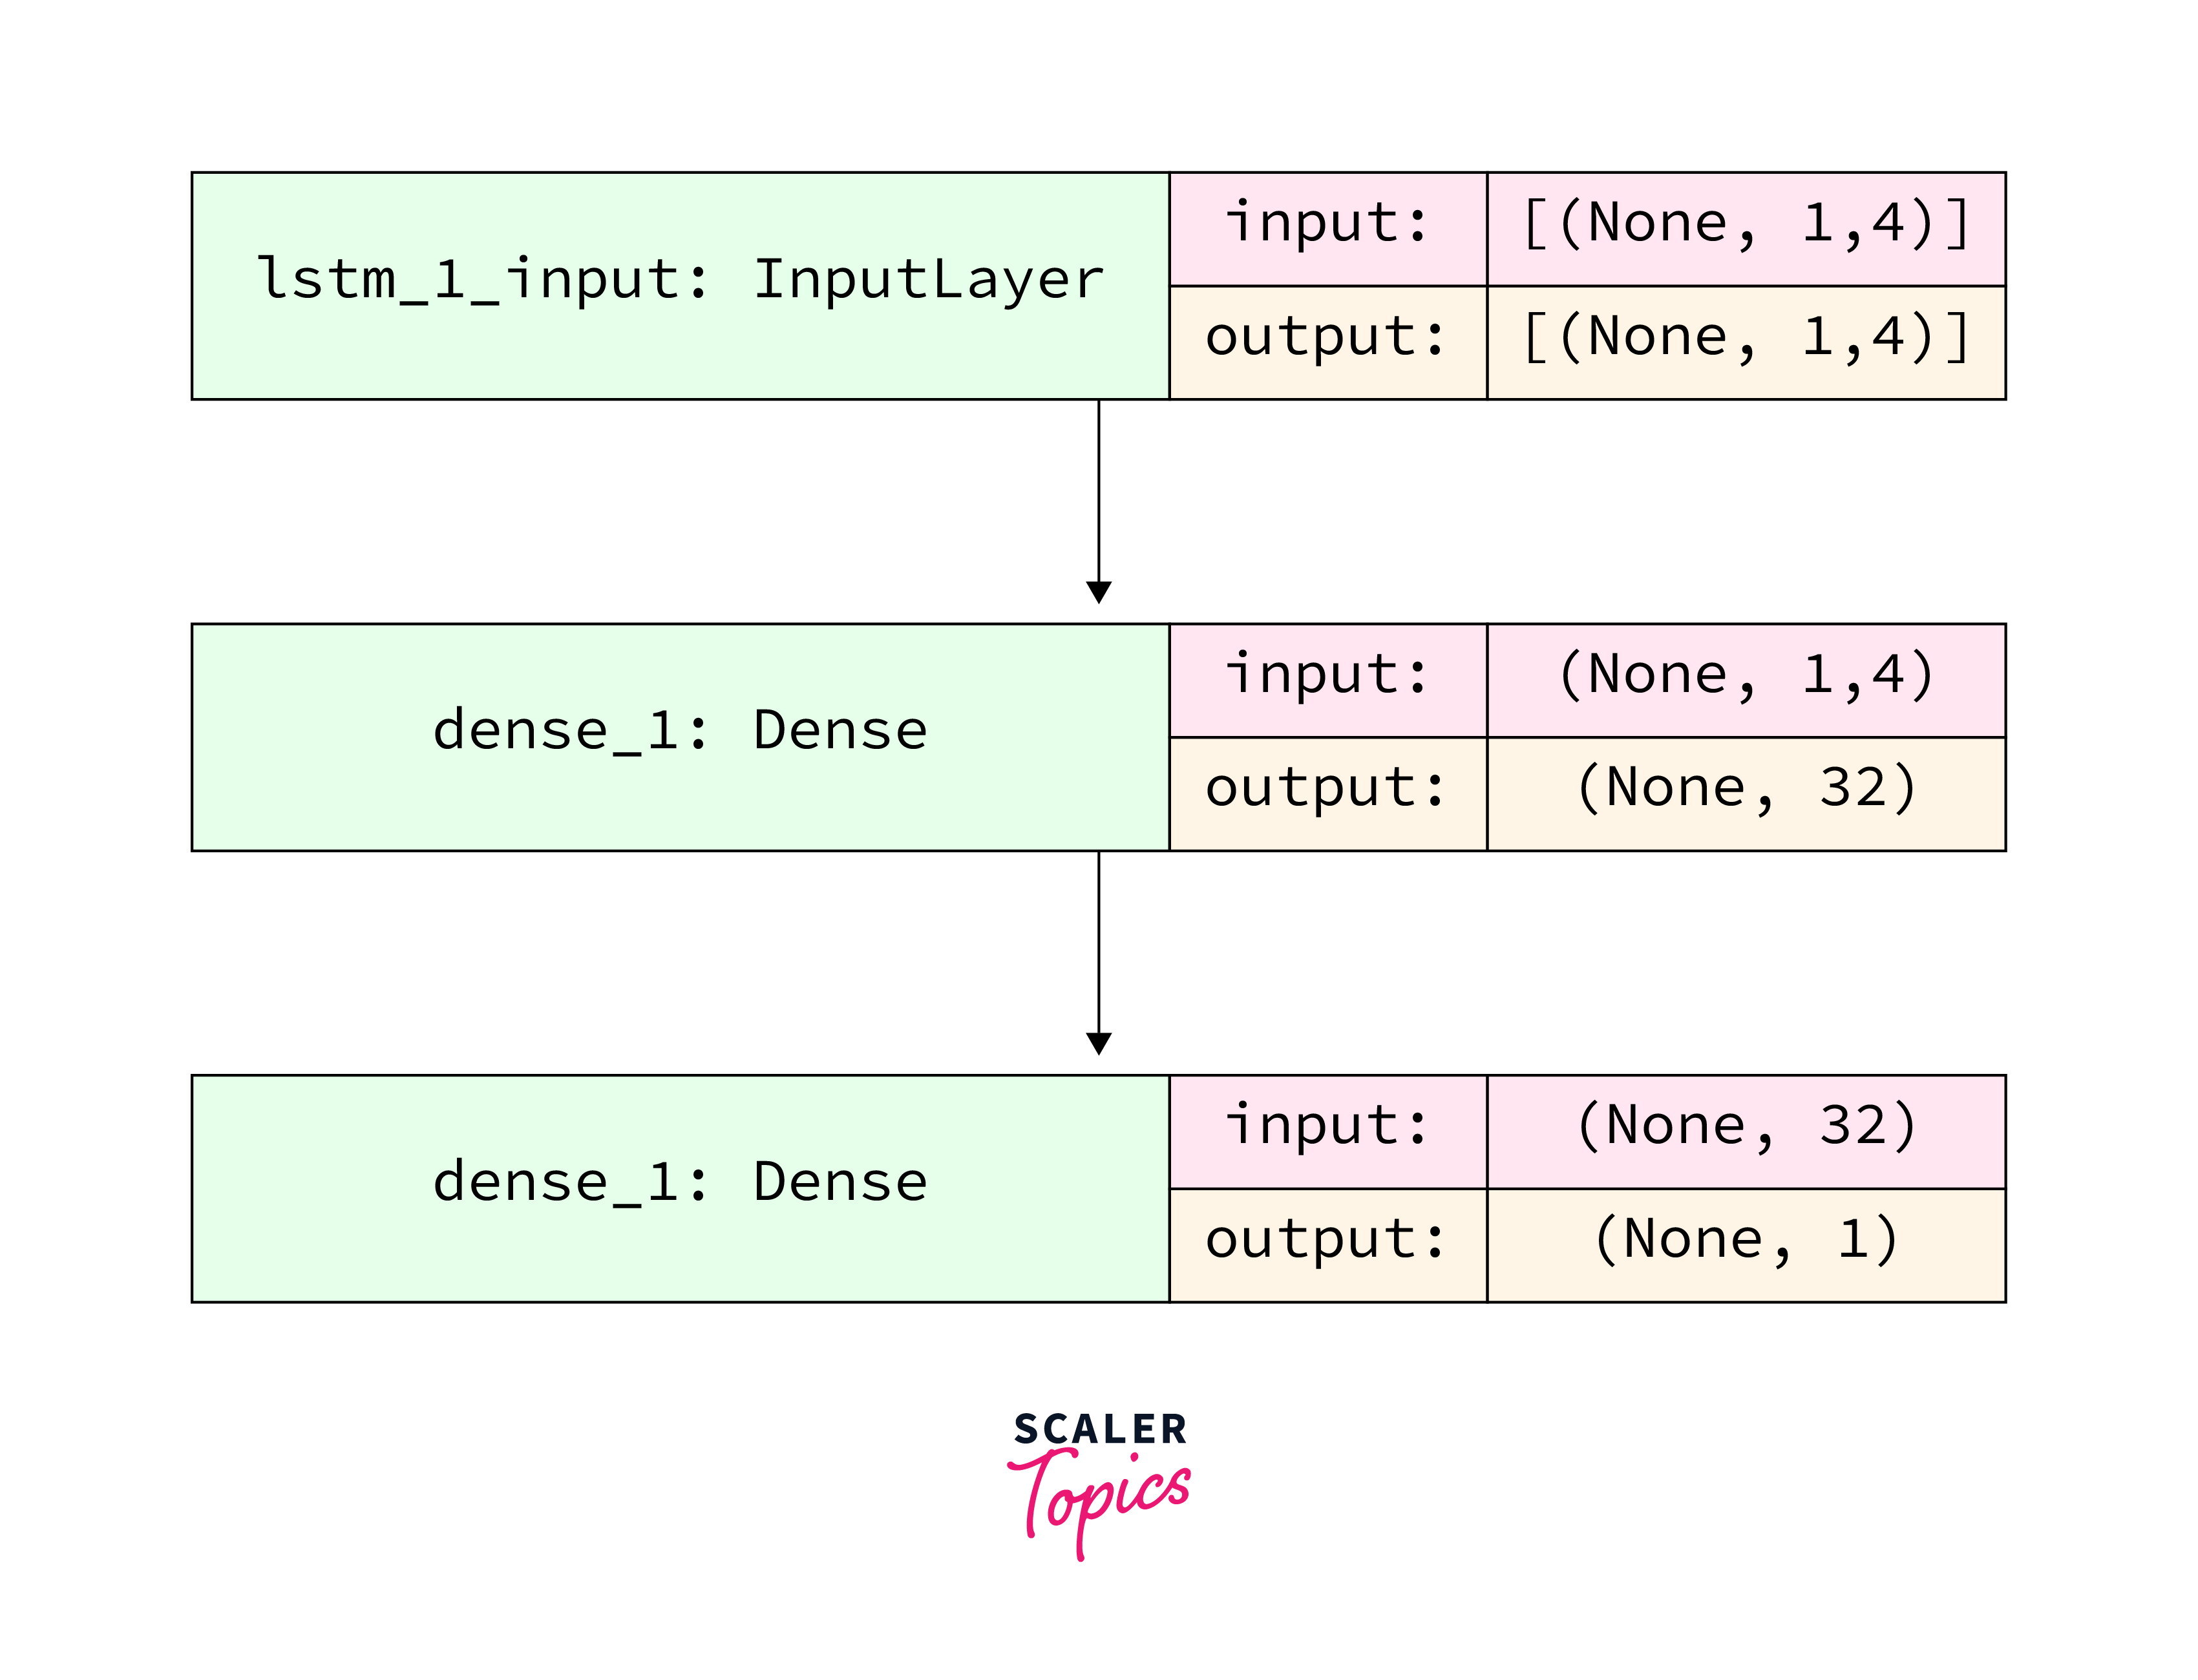
At last, we reach the stage where the LSTM Model is built. We will construct a Sequential Keras model using a single LSTM layer in this stage. One Dense Layer with one neuron follows the 32-unit LSTM layer.
We use the Mean Squared Error as the loss function and the Adam Optimizer to construct the model. This combination is the most desirable for an LSTM model.
Lastly, we train the previously constructed LSTM model on the training data for 100 epochs with a batch size of 8 using the fit function.
With a model trained using the LSTM network on the test set, we can now utilize our prepared model to estimate the Adjacent Close Value of the stock. Using a straightforward prediction model on the LSTM model, we can achieve this.
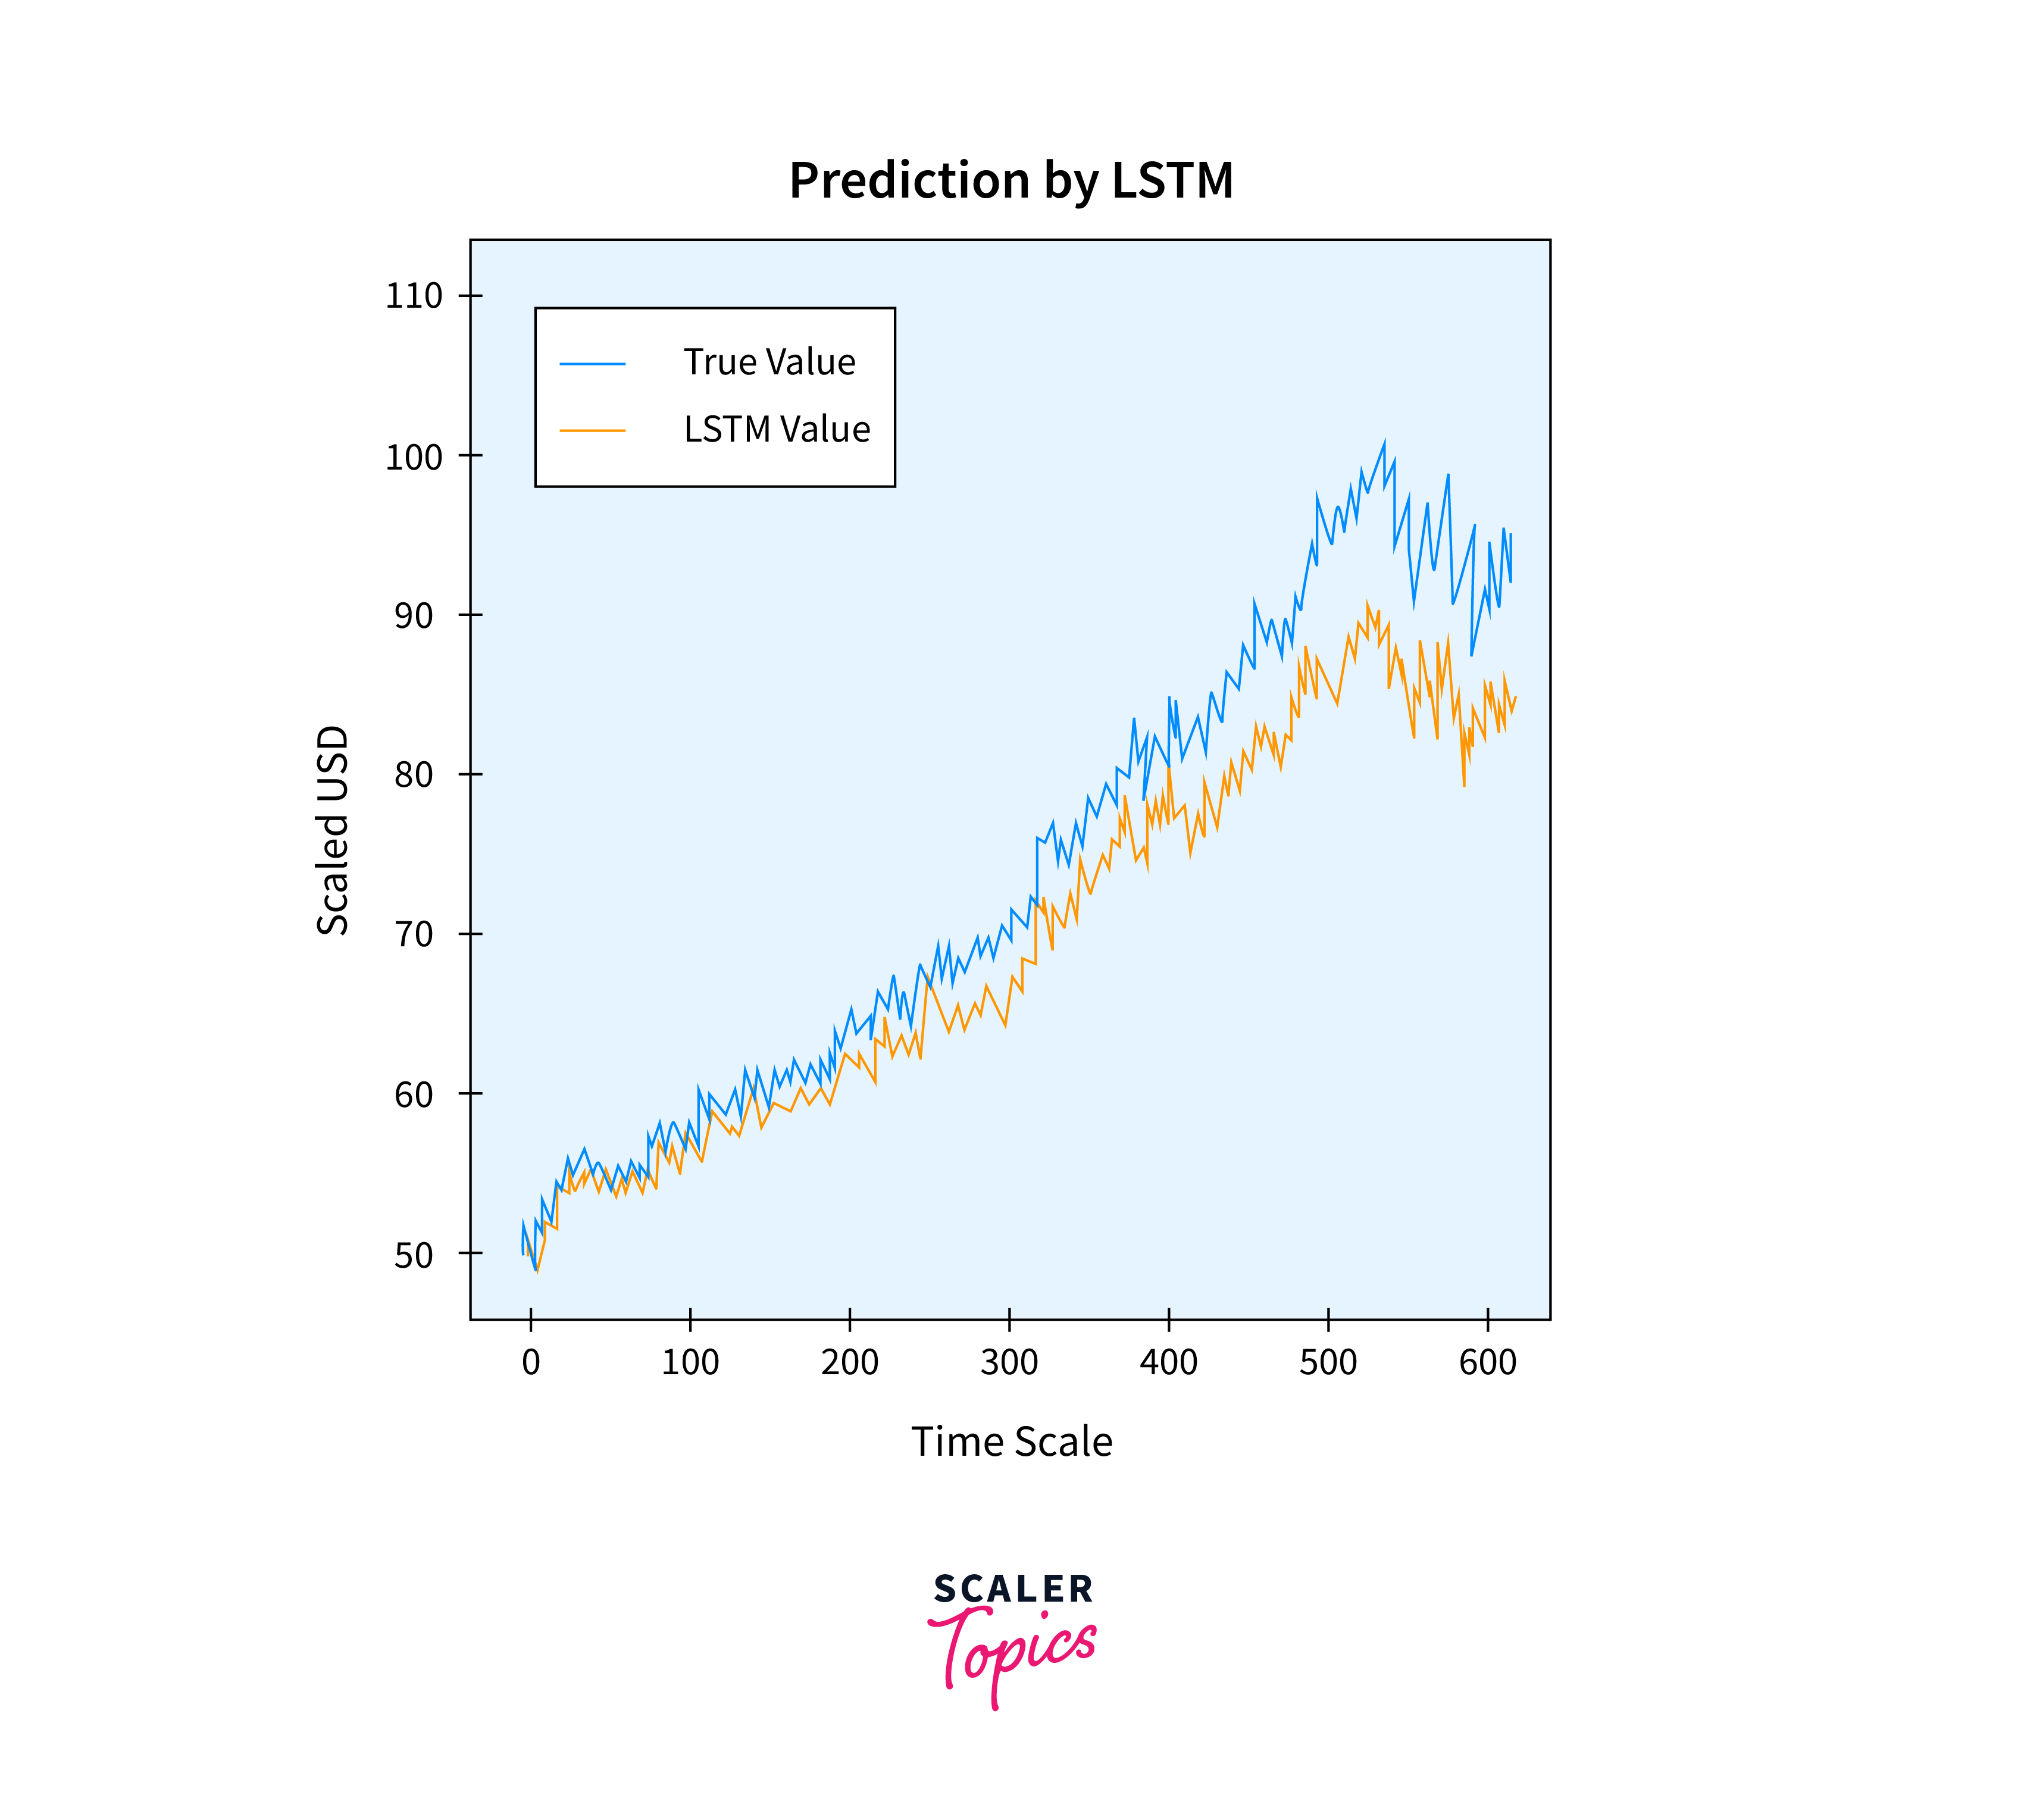
After projecting the values for the test set, we can now compare the true values of Adj Close with the predicted value of Adj Close using the LSTM Machine Learning model on the graph.
Output:
What's Next?
Now that you can predict stock price using ML you can explore additional features such as sentiment analysis of news articles, macroeconomic indicators, or incorporating external datasets for more accurate predictions.
Conclusion
- Stock price prediction using machine learning presents substantial potential for investors and traders.
- Leveraging historical data and advanced algorithms enables the development of robust models capable of forecasting future price movements with reasonable accuracy.
- However, it's crucial to acknowledge the limitations and uncertainties inherent in financial markets.
- Predictive models should be viewed as decision-support tools rather than definitive predictors.
- Investors and traders should exercise caution and combine predictive insights with their own expertise and judgment when making investment decisions.
- Continuous monitoring and refinement of predictive models are necessary to adapt to changing market conditions and improve predictive accuracy over time.