Inferential Statistics -1 with Excel
Overview
T-tests are among the statistical studies that Excel is capable of doing. Excel is accessible to almost everyone, making it a great choice. Even if Excel isn't your main statistical software application, this piece is a great introduction to running and understanding t test in excel.
Introduction to Z-Test
We compare the means of two datasets in Excel that are equal or not by using the Z-Test. The Z-Test function in Excel requires an array, the X value (the hypothetical sample mean), and the Sigma value according to the syntax (Optional). Most of the time, it is assumed that X has at least a 95% chance of falling between 0 and 5. Z-Test can also be performed using the Data Analysis option on the Data menu item. We require two variable ranges with two variations for each range. We shall reject the null hypothesis if Z< Z Critical.
The Z-Test Formula is given below:

Z-Test Formula contains the following justifications:
- Array:
The set of numbers that will be used to test the sample mean hypothesis. - X:
The sample mean hypothesis that must be tested. - Sigma:
The population standard deviation is represented by this optional input. Use the sample standard deviation if it's not specified or known.
One-Tailed Tests
The critical area of a distribution in a one-tailed test is one-sided, meaning that it can only be higher than or less than a specific value and not both. The alternative hypothesis will be accepted instead of the null hypothesis if the sample under test falls into the one-sided critical region.
The Z TEST function, a statistical function, is used when just one dataset is available. This Z TEST function in Excel offers the one-tailed probability value of a test.
Z-Test
This function provides the probability that the specified hypothesized sample mean exceeds the given data values' mean. Z-Test Function is highly straightforward and user-friendly.
Let's look at some examples to better understand how Excel's Z-Test Function operates. We have provided the values shown below:
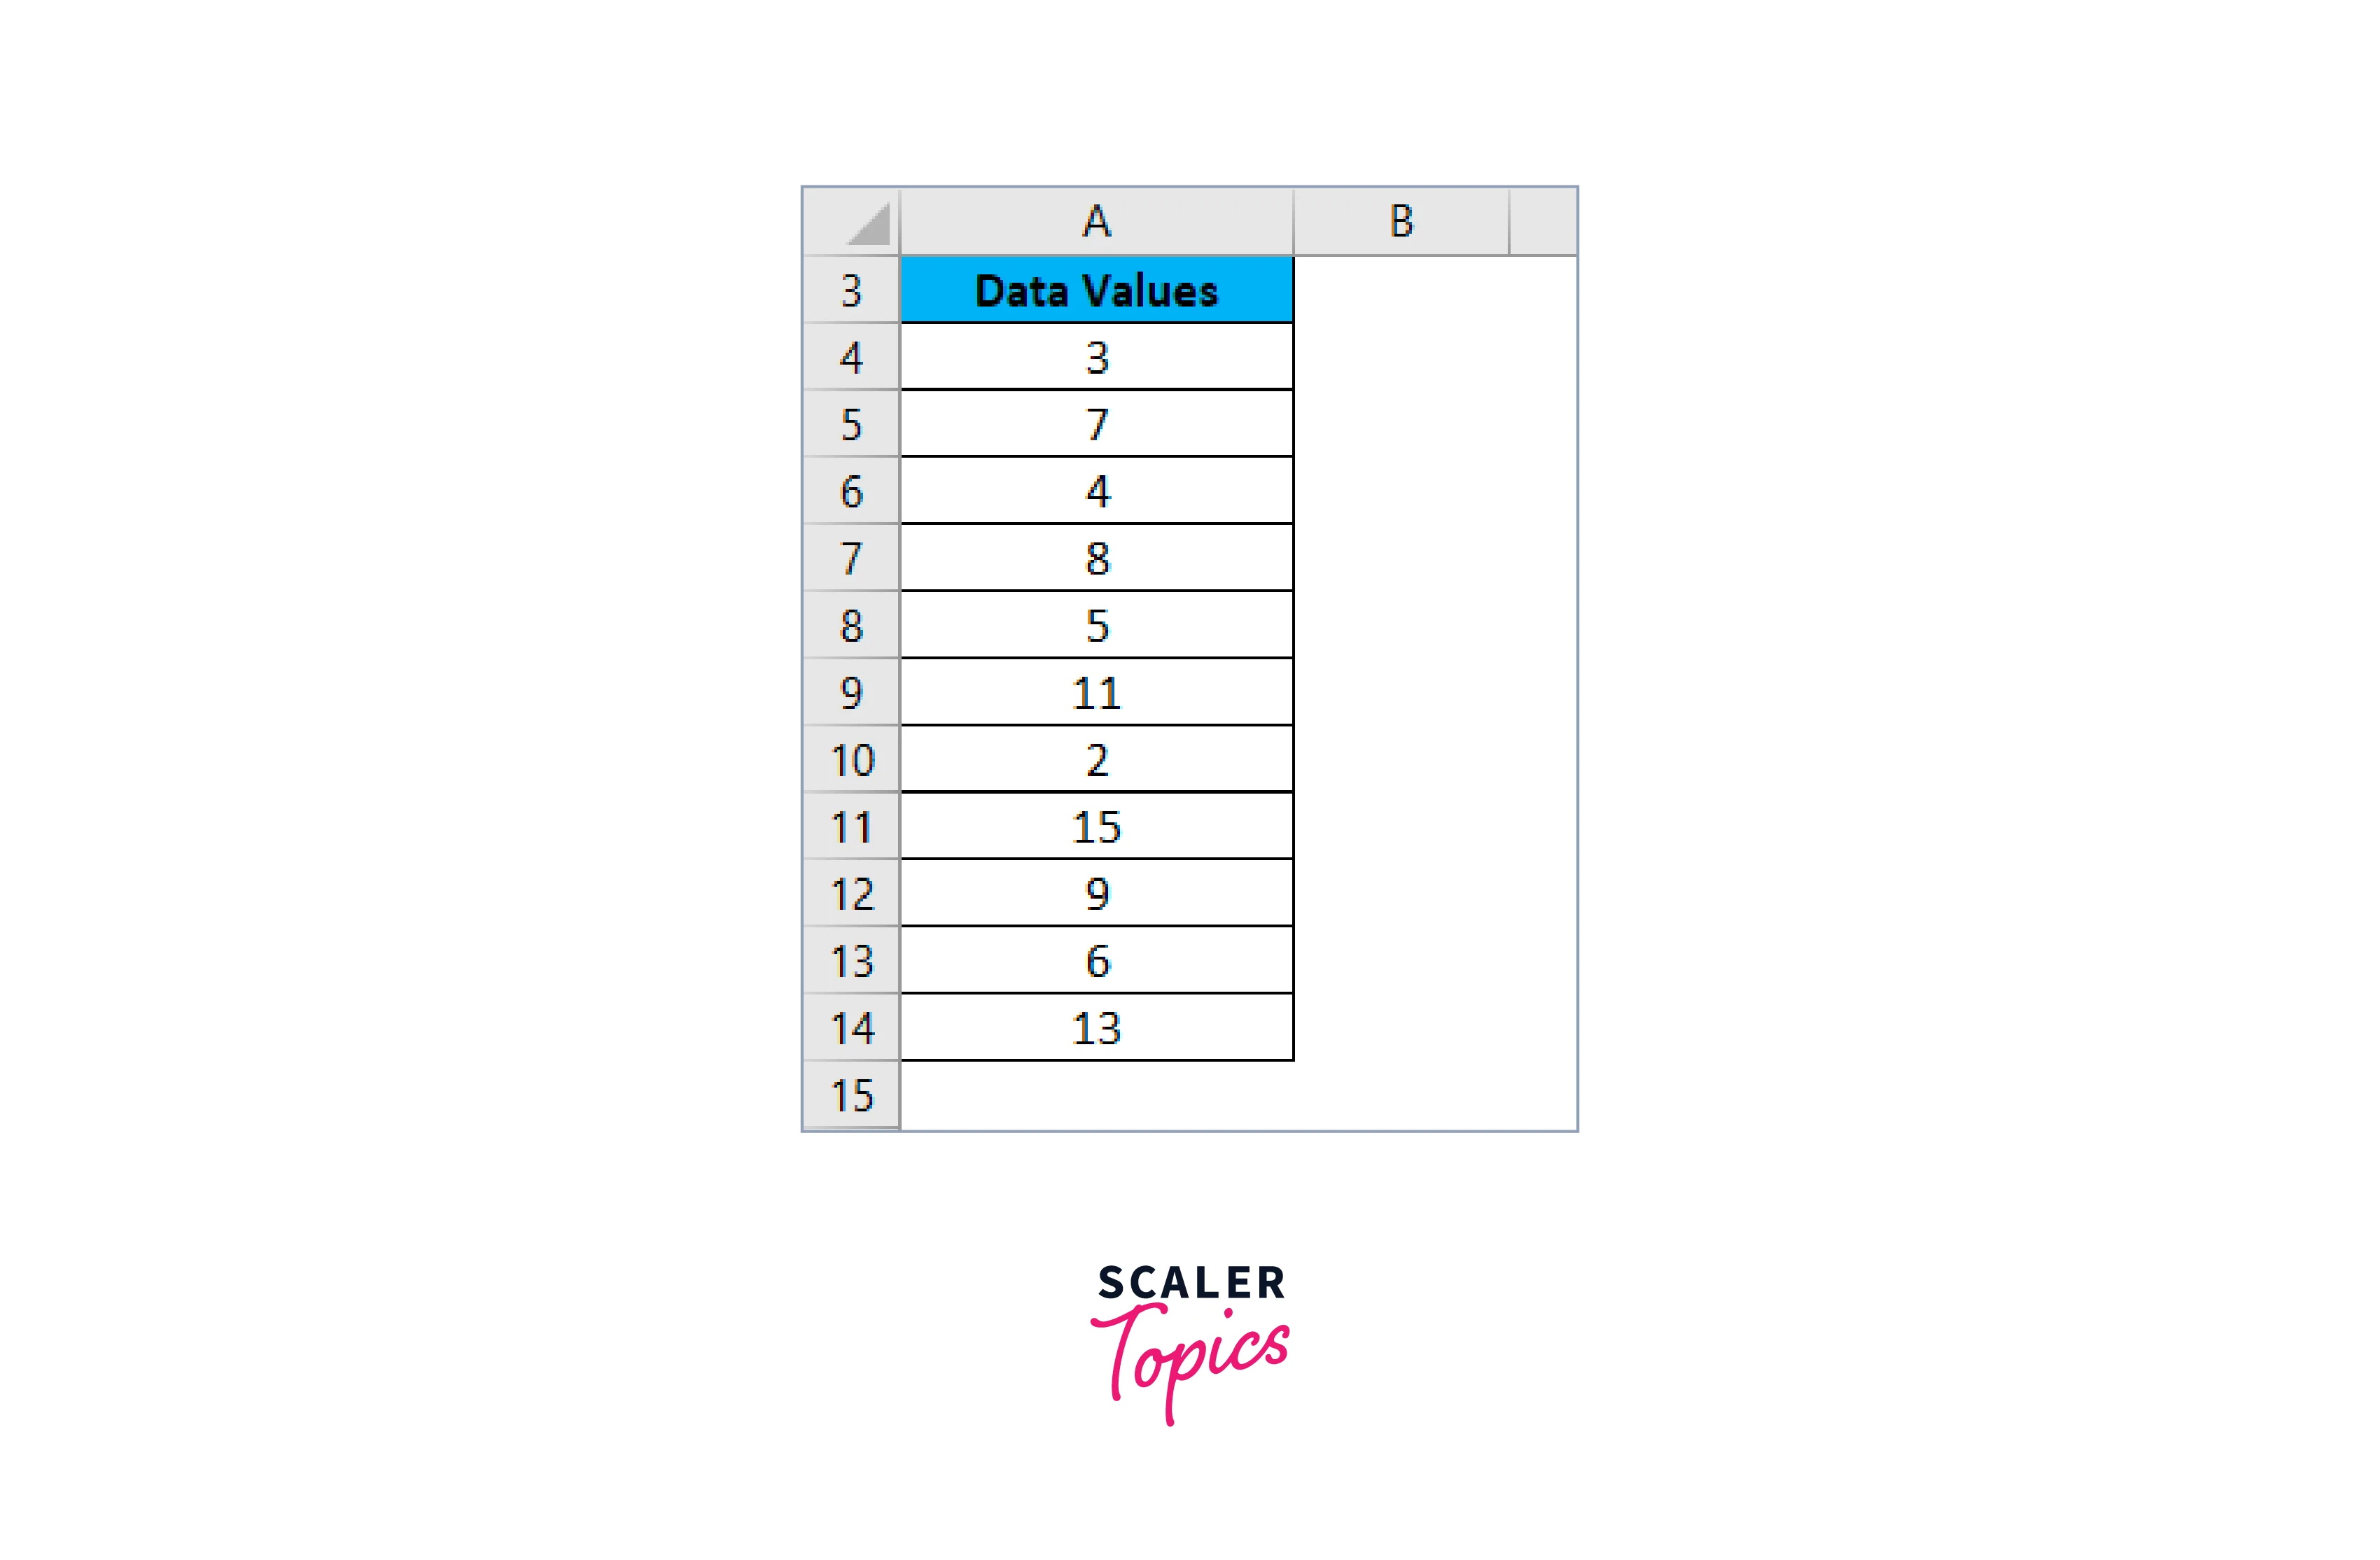
-
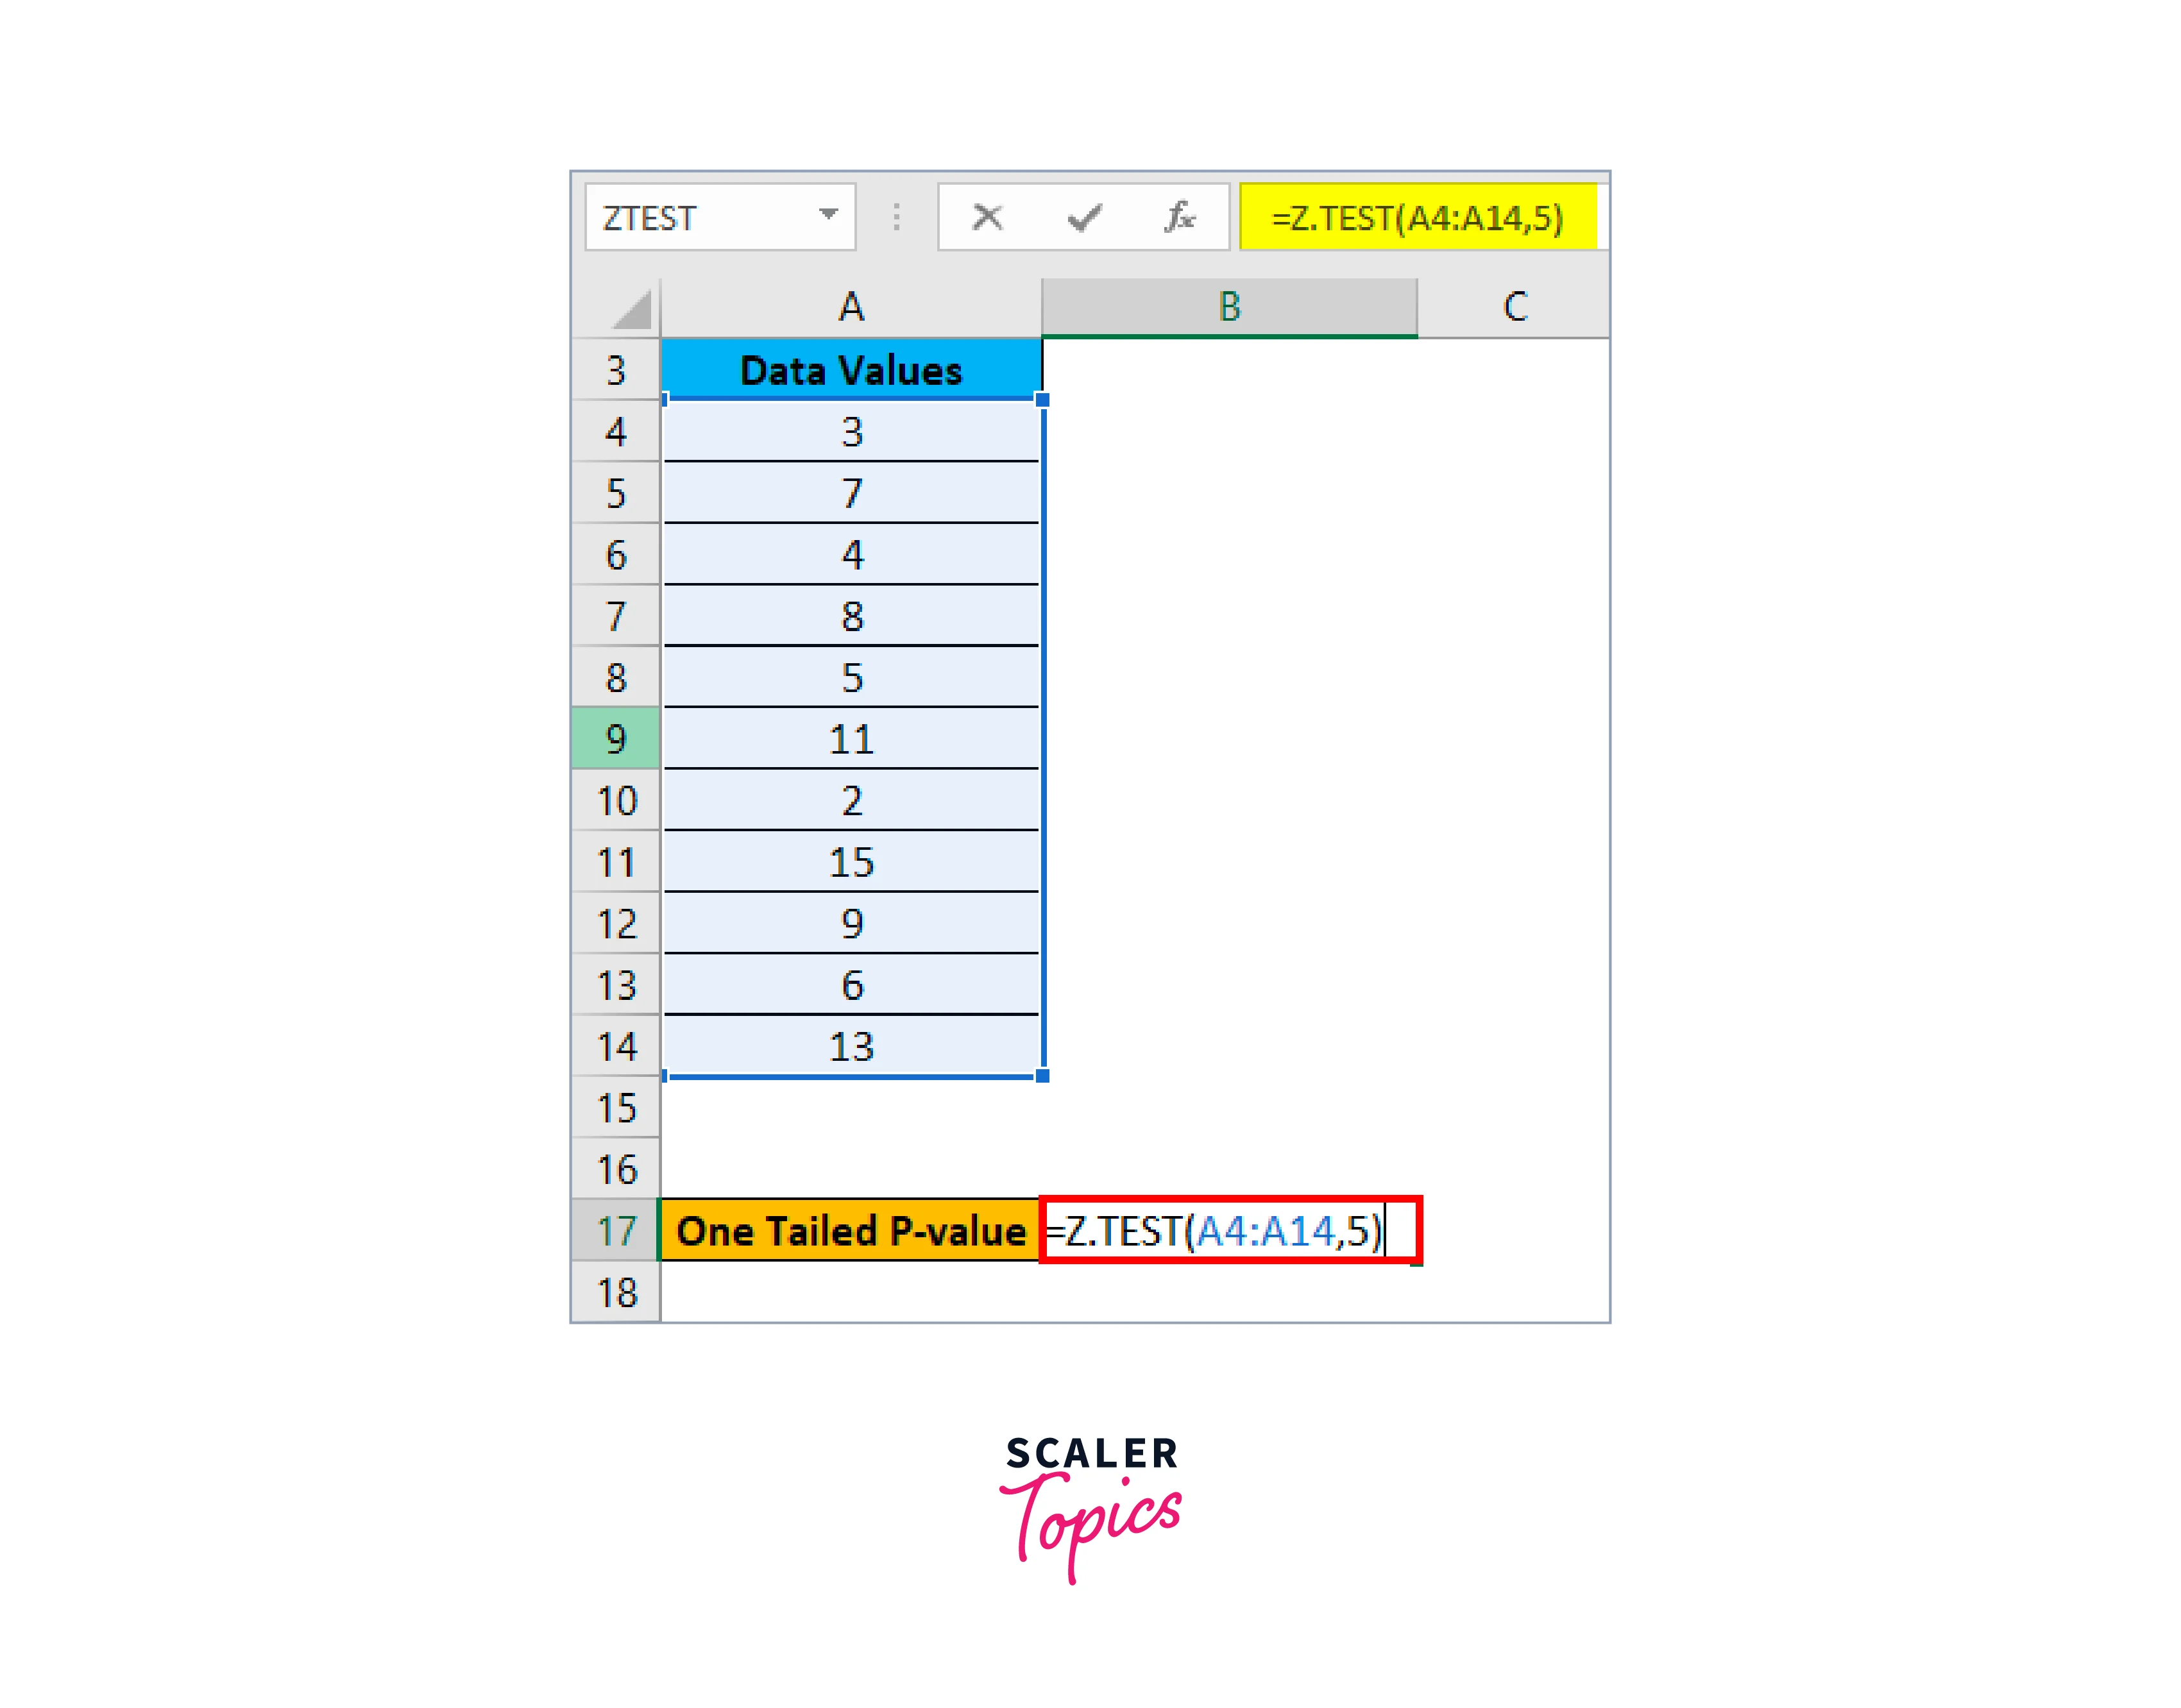
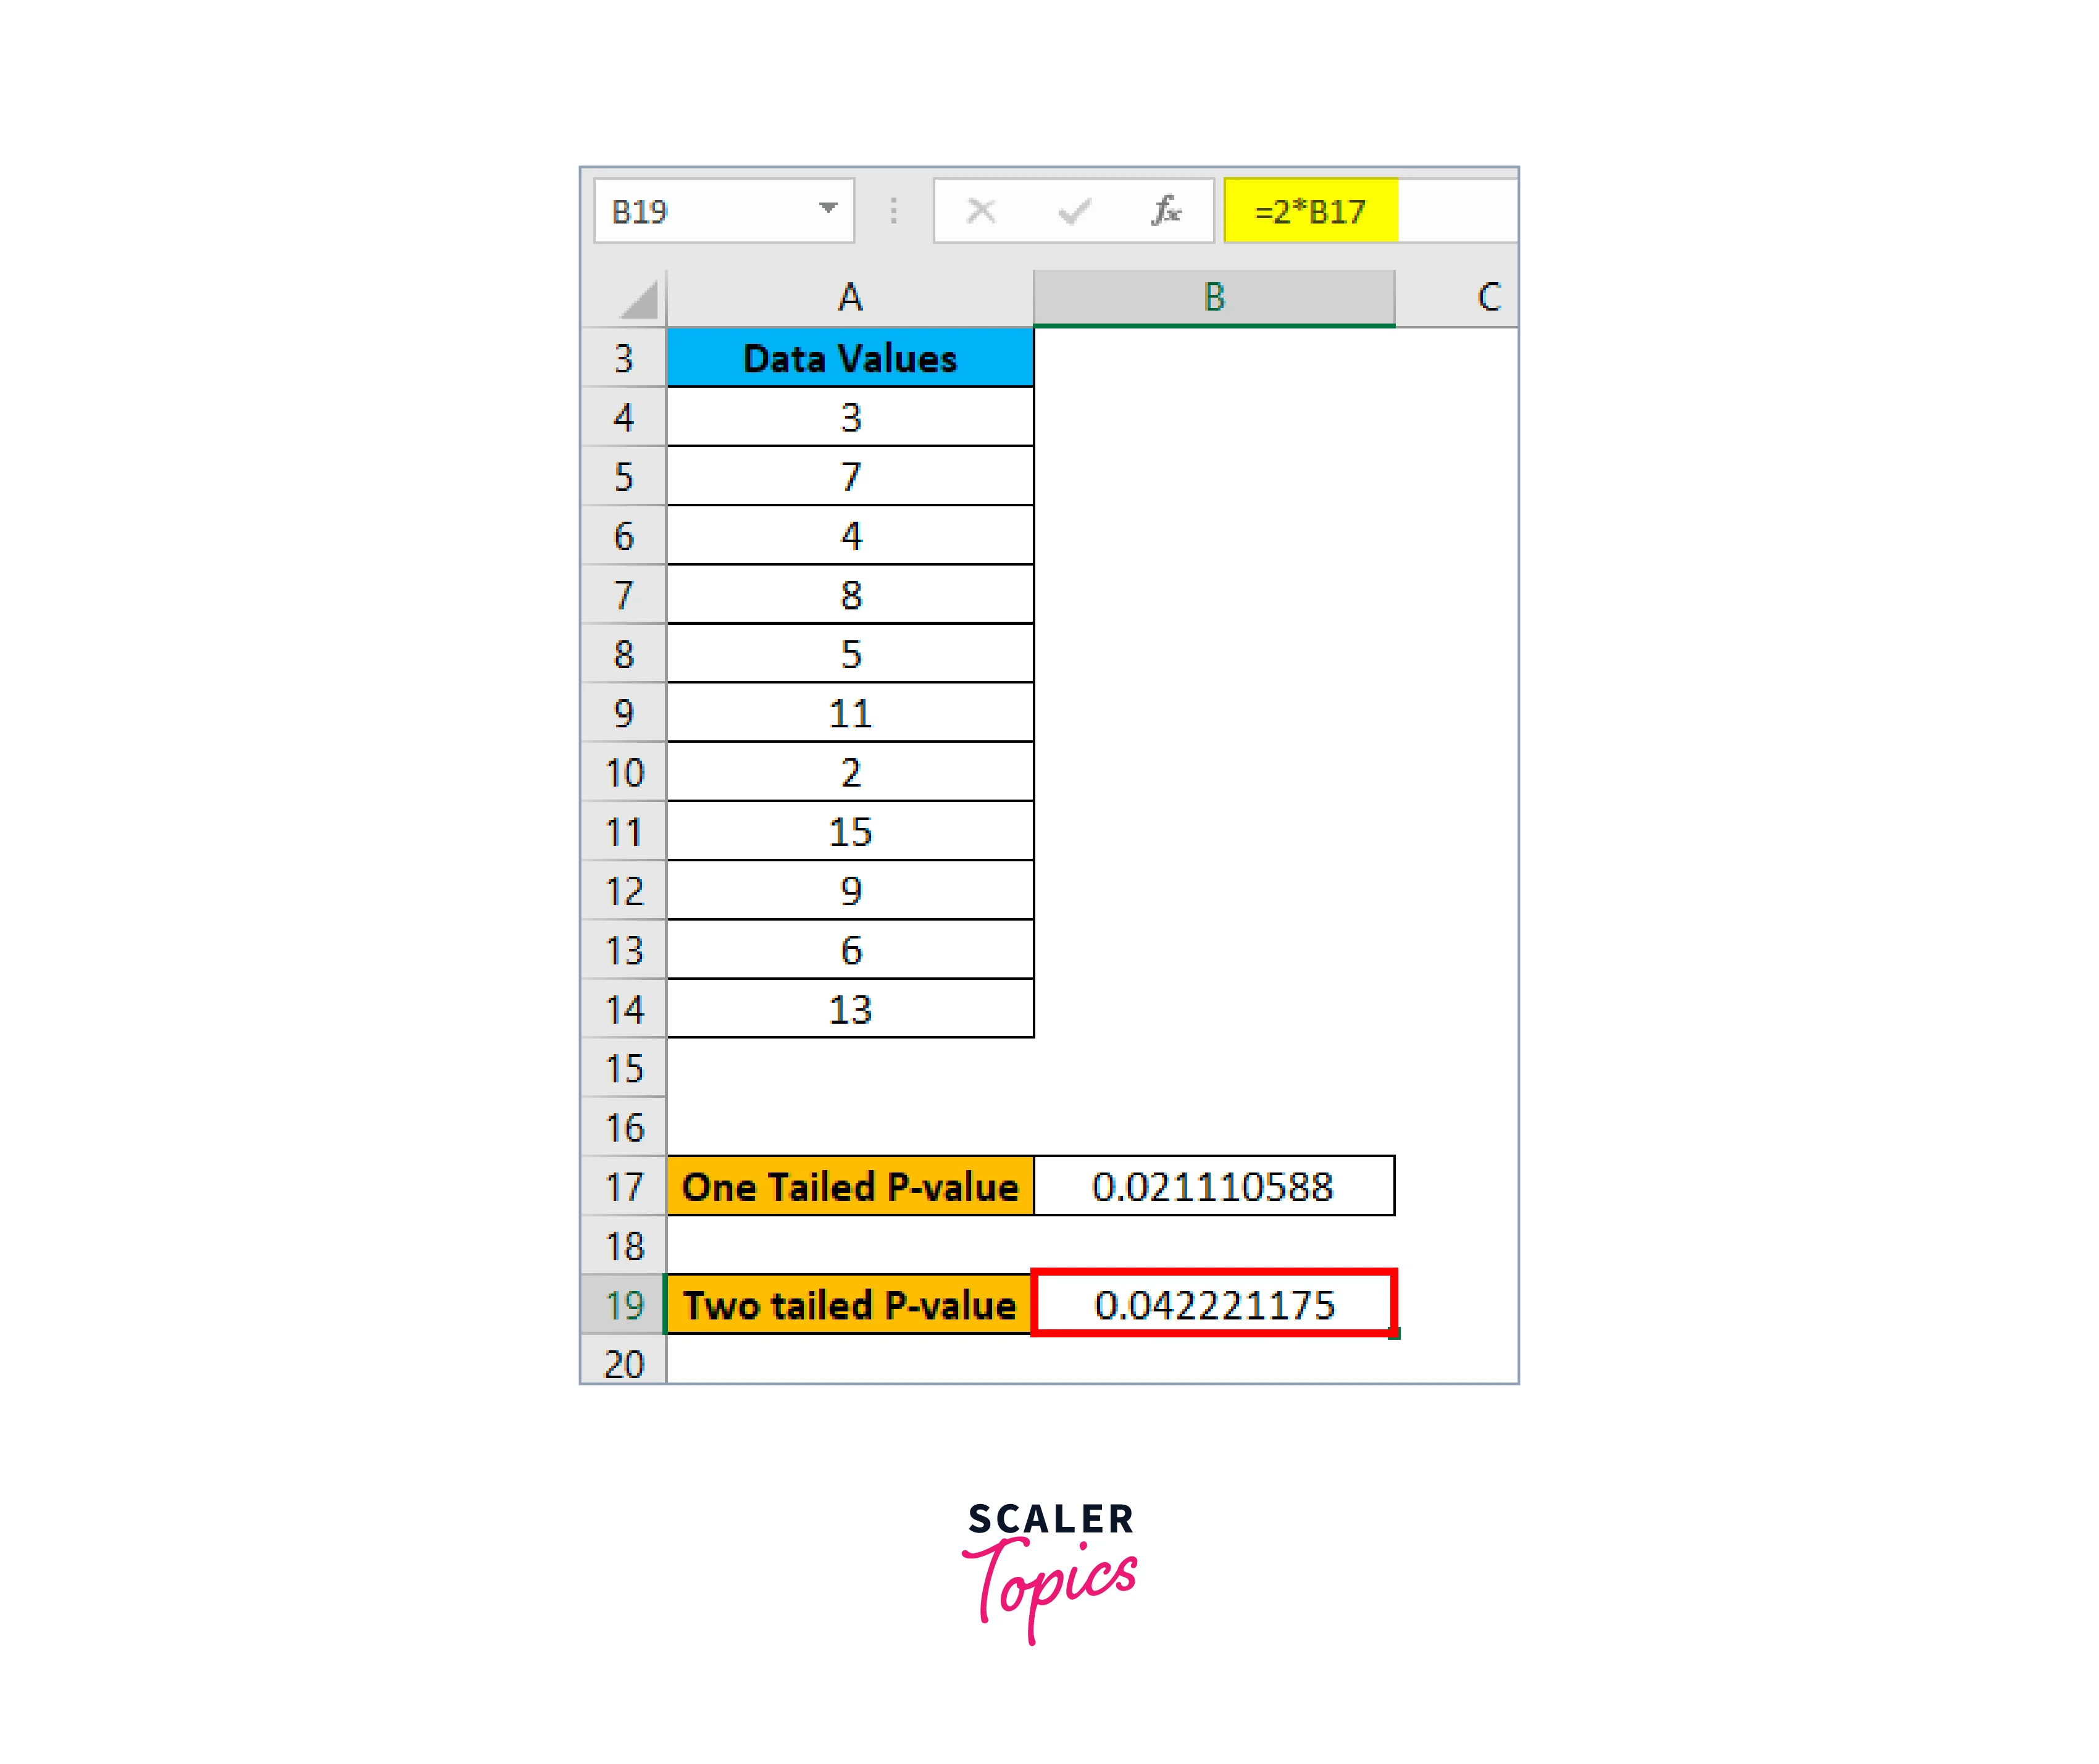
Let's assume that the population means for the aforementioned data is 5, and then we will apply the Z TEST formula as shown below to determine the one-tailed probability value of a Z test:
-
Let's assume that the population means for the aforementioned data is 5, and then we will apply the Z TEST formula as shown below to determine the one-tailed probability value of a Z test:

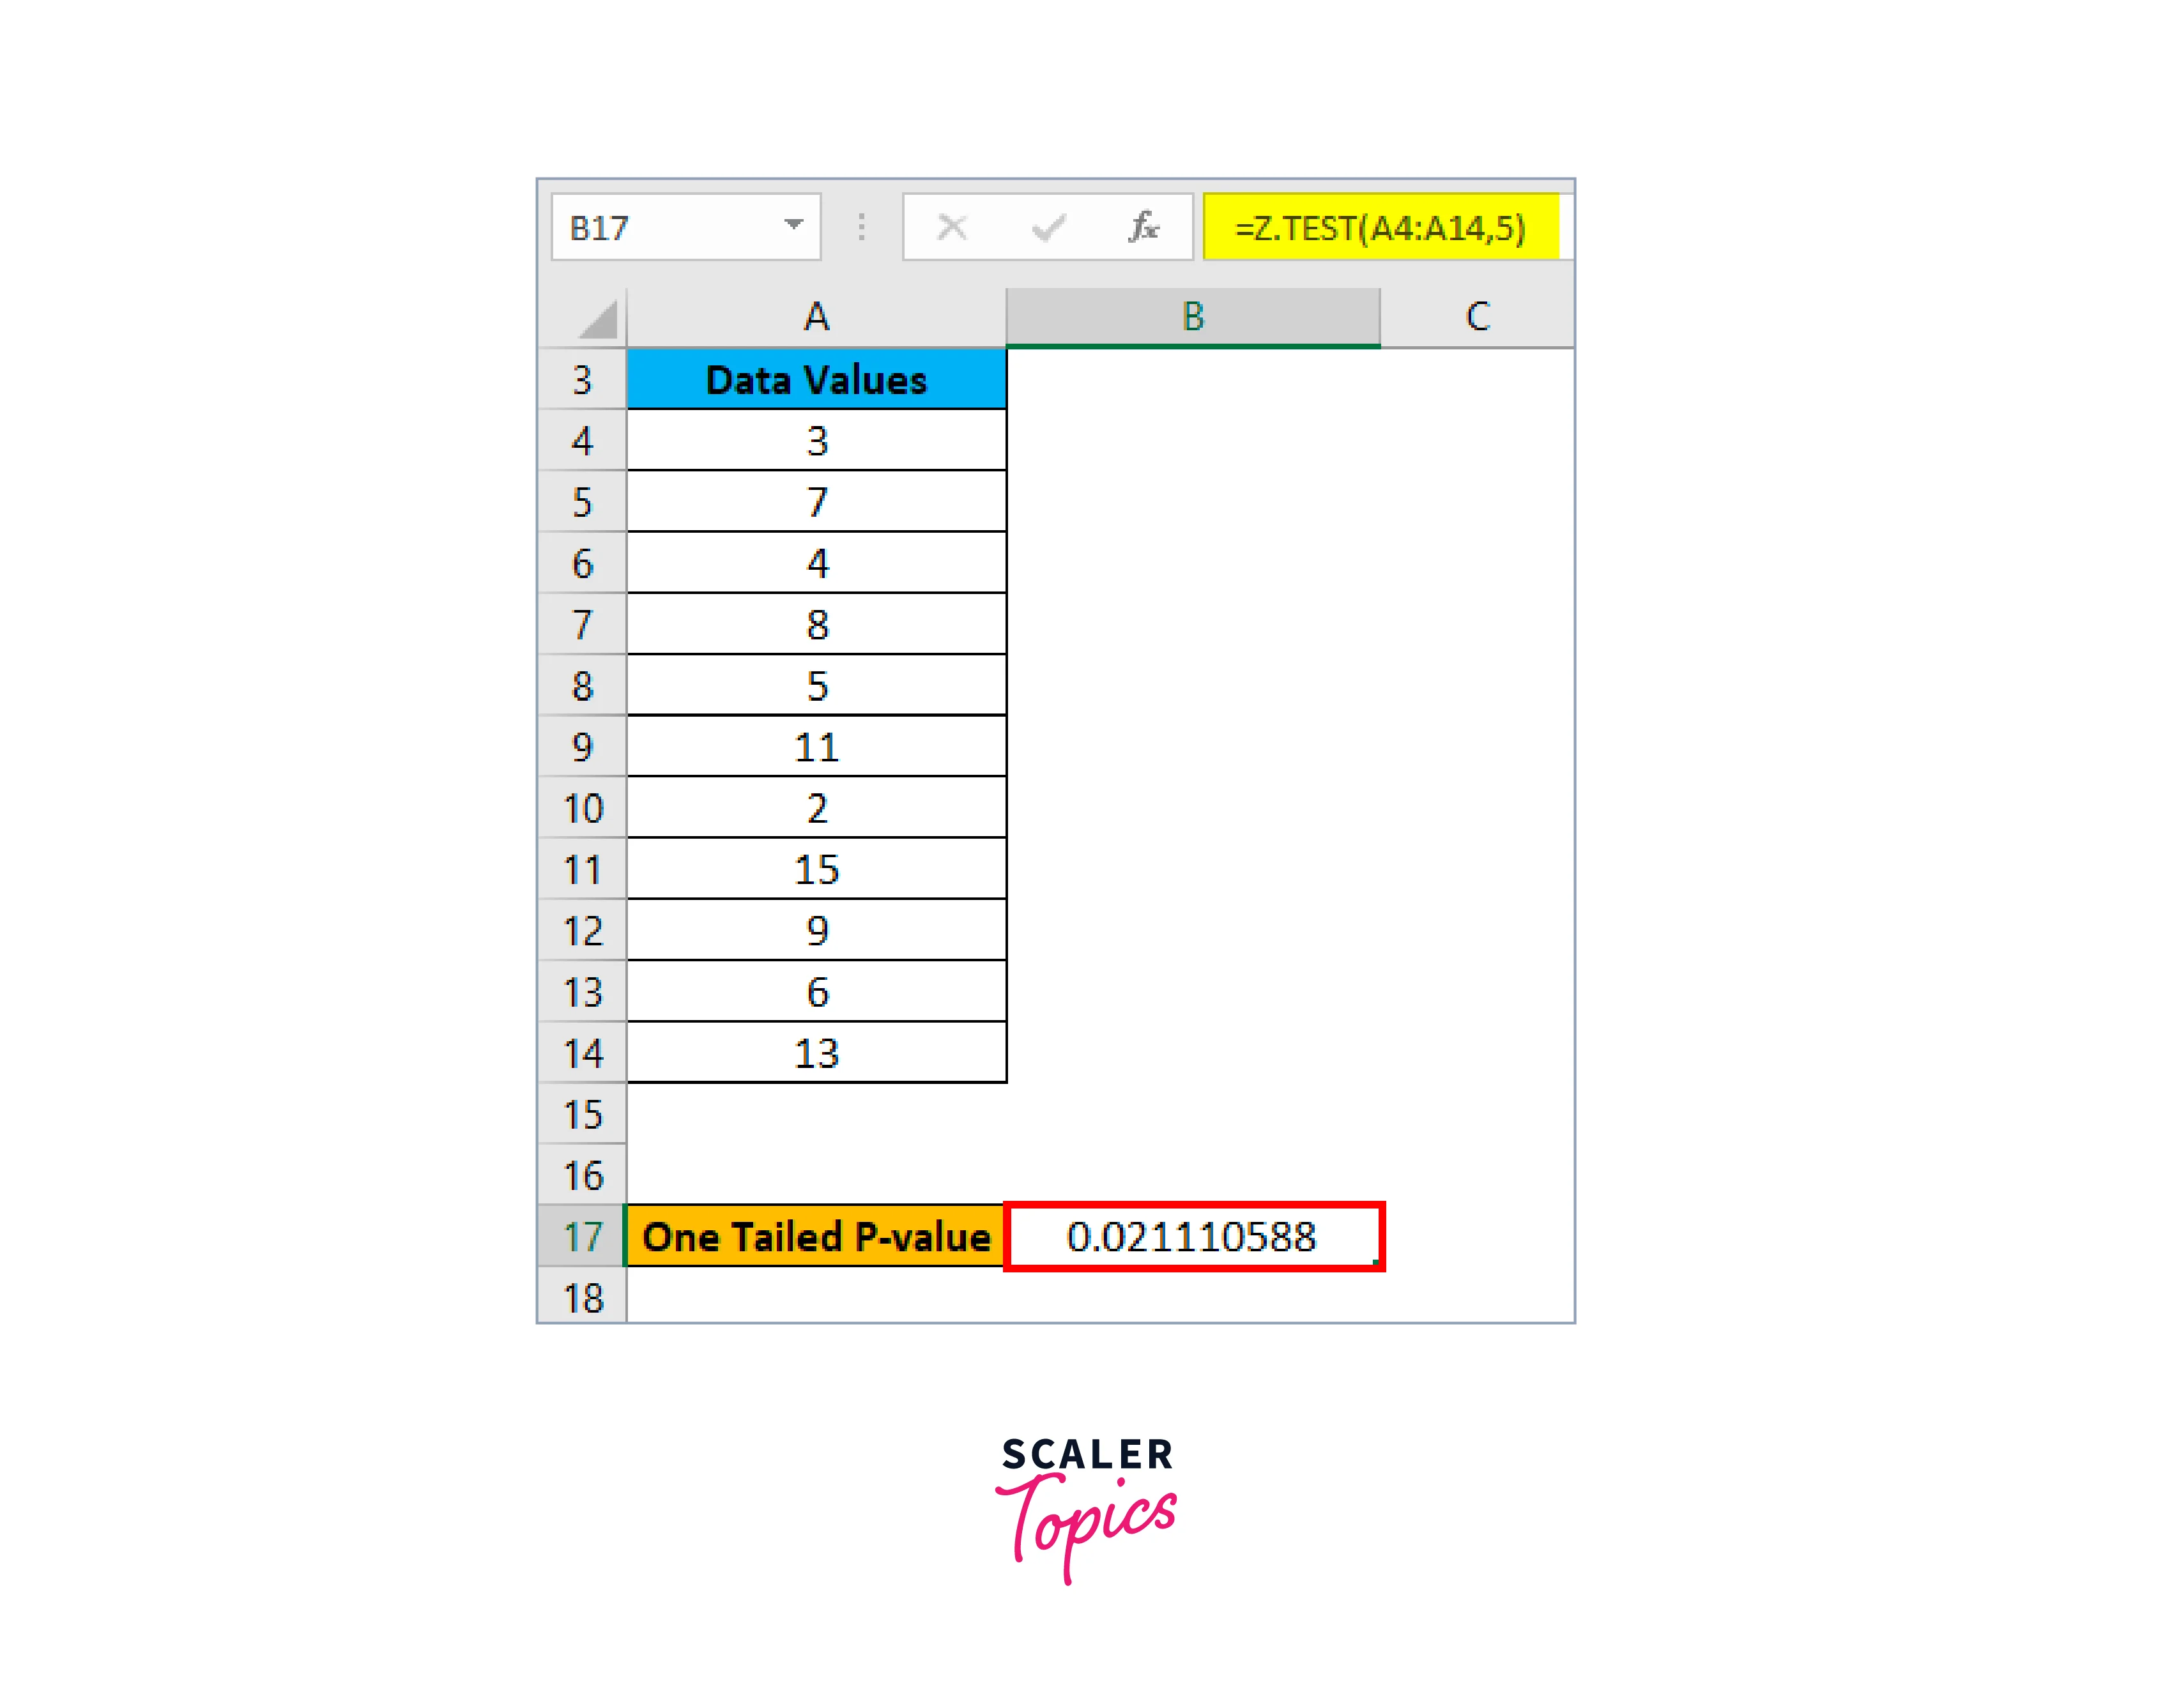
The result is shown below:
-
Using the above approach, we can also get the two-tailed probability of a Z TEST in this situation. With the given hypothesized population of 5, the formula for determining the two-tailed P-value of a Z TEST is shown below.
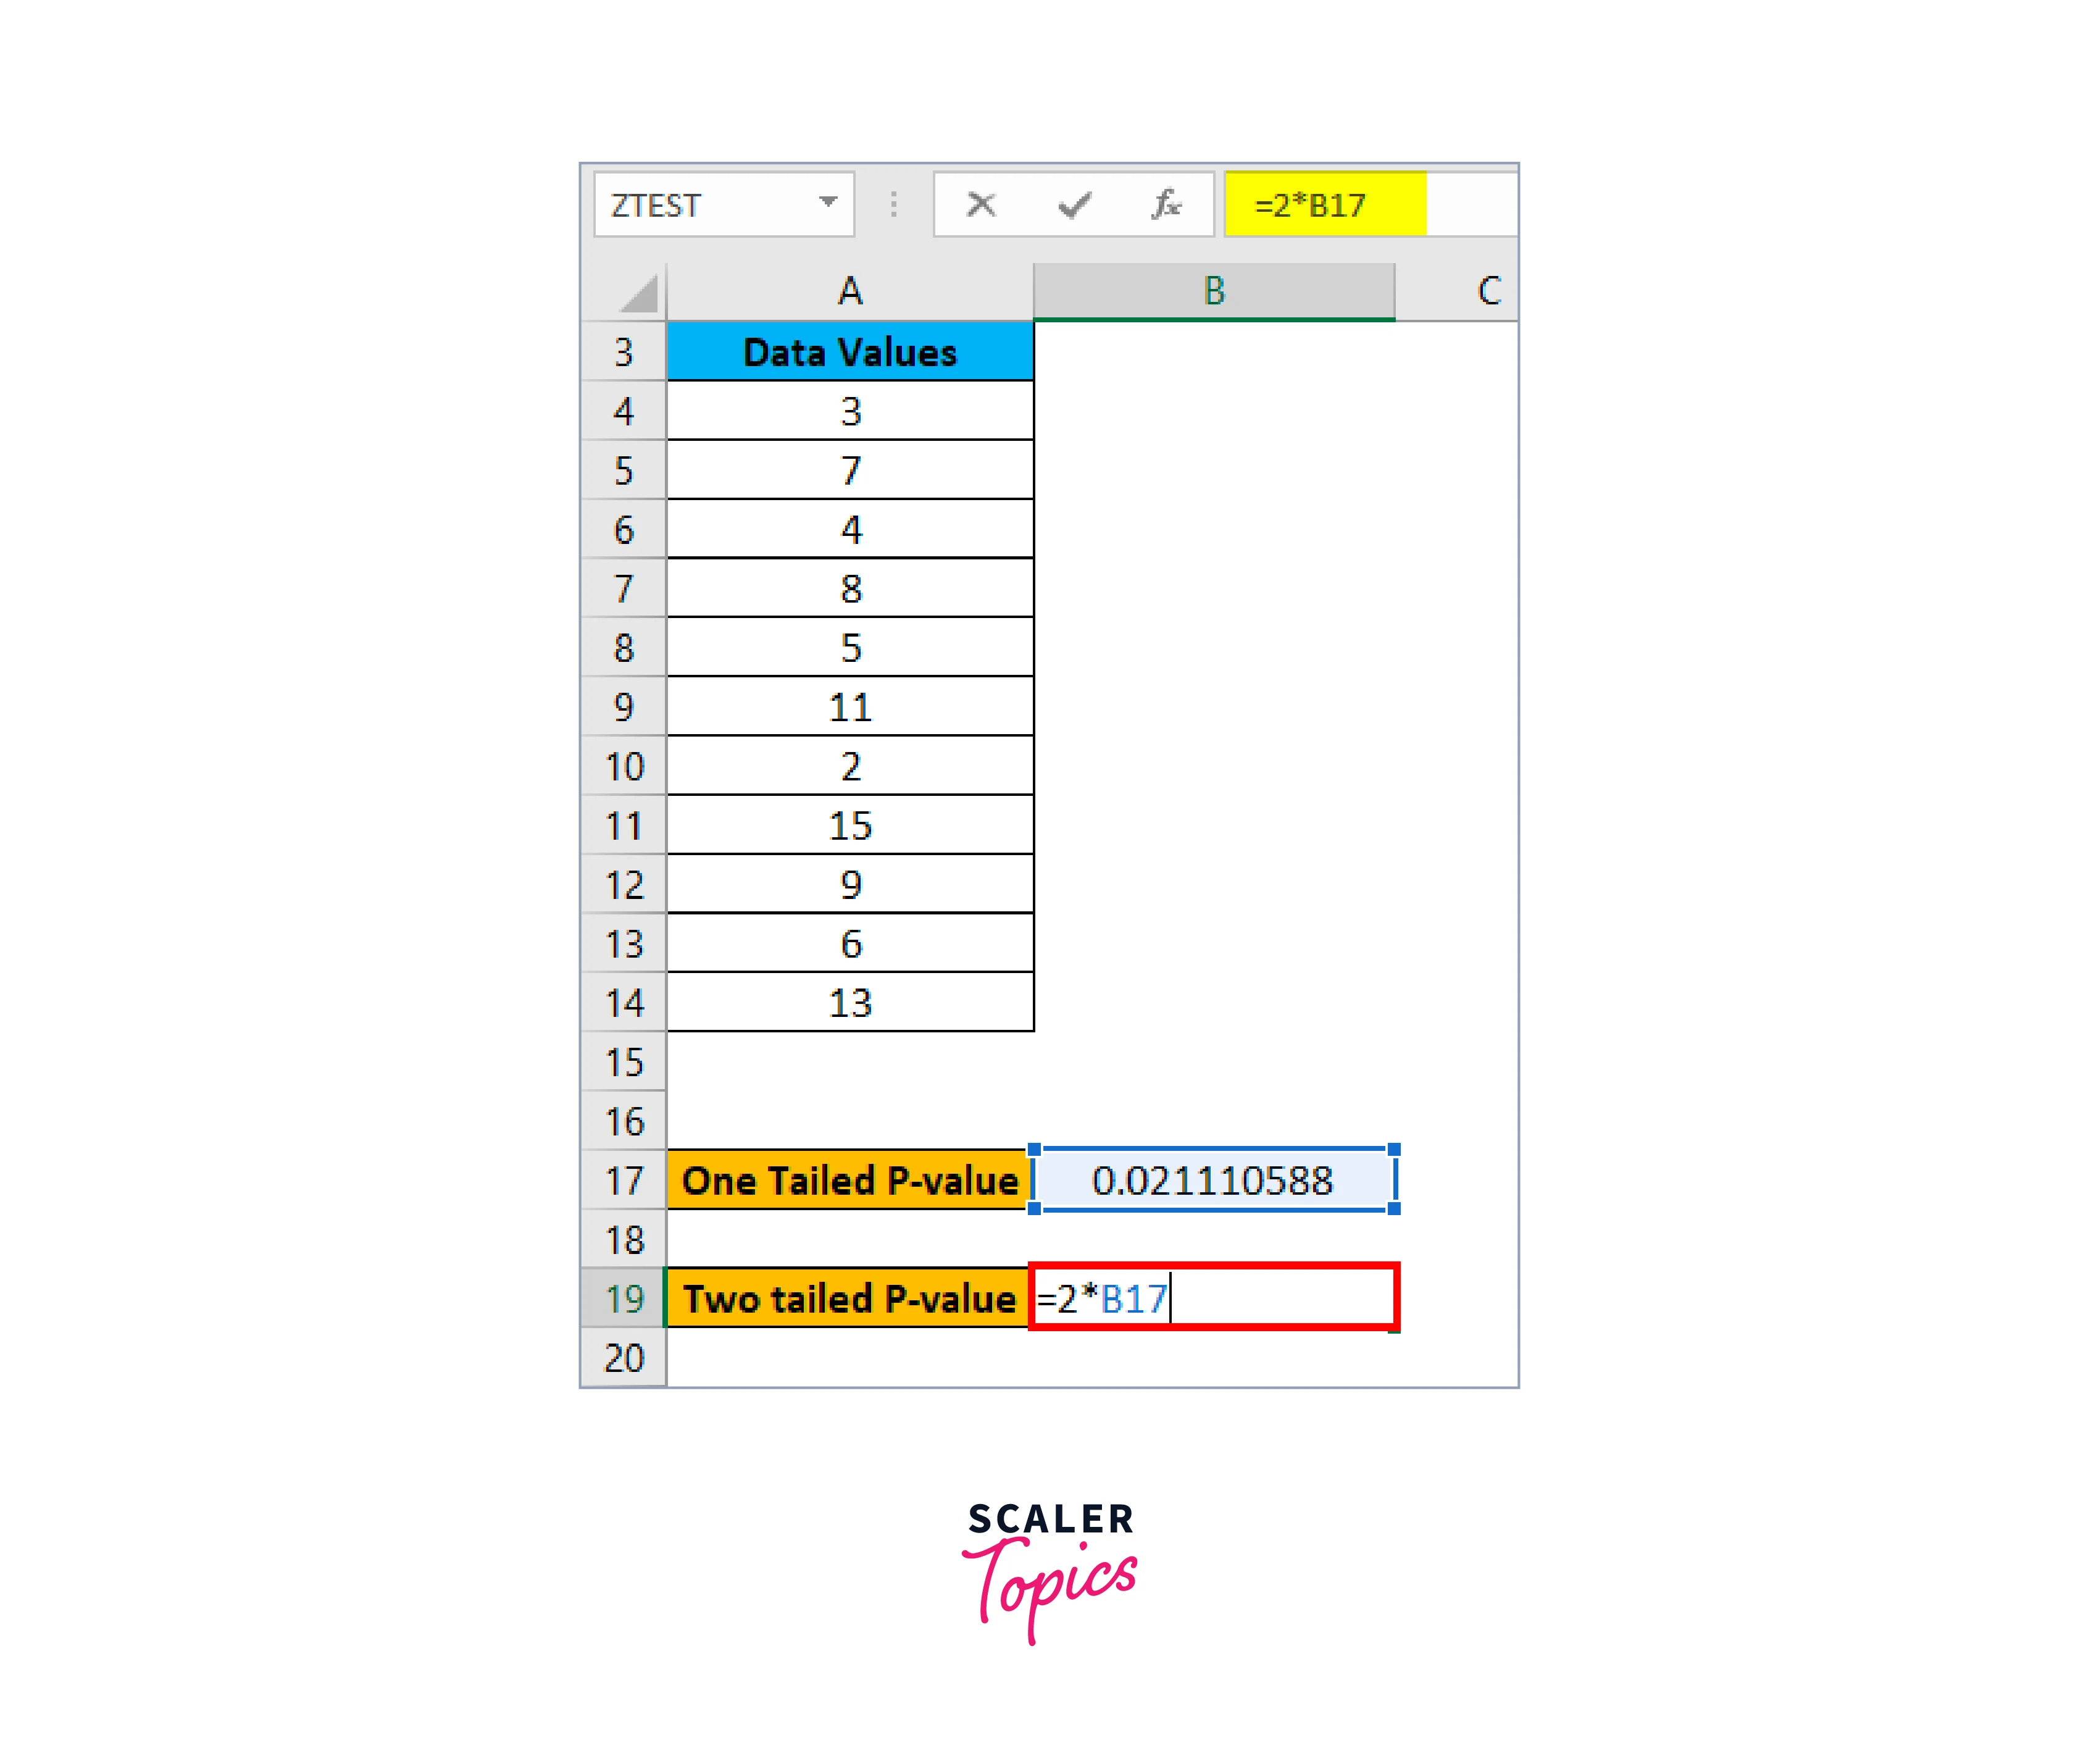
The result is shown below:
T-test
The potential of a one-direction association is tested using a one-tailed t test in excel. However, directional relationships in other directions are not considered.
Two-Tailed Tests
Z-Test
We examine the null hypothesis that the means of the two populations are equal using the Z-Test. i.e.
qThe mean of the two populations is unequal, so H1 is referred to as an alternate hypothesis.
Let's look at an example to understand how to use the two sample Z-Tests.
-
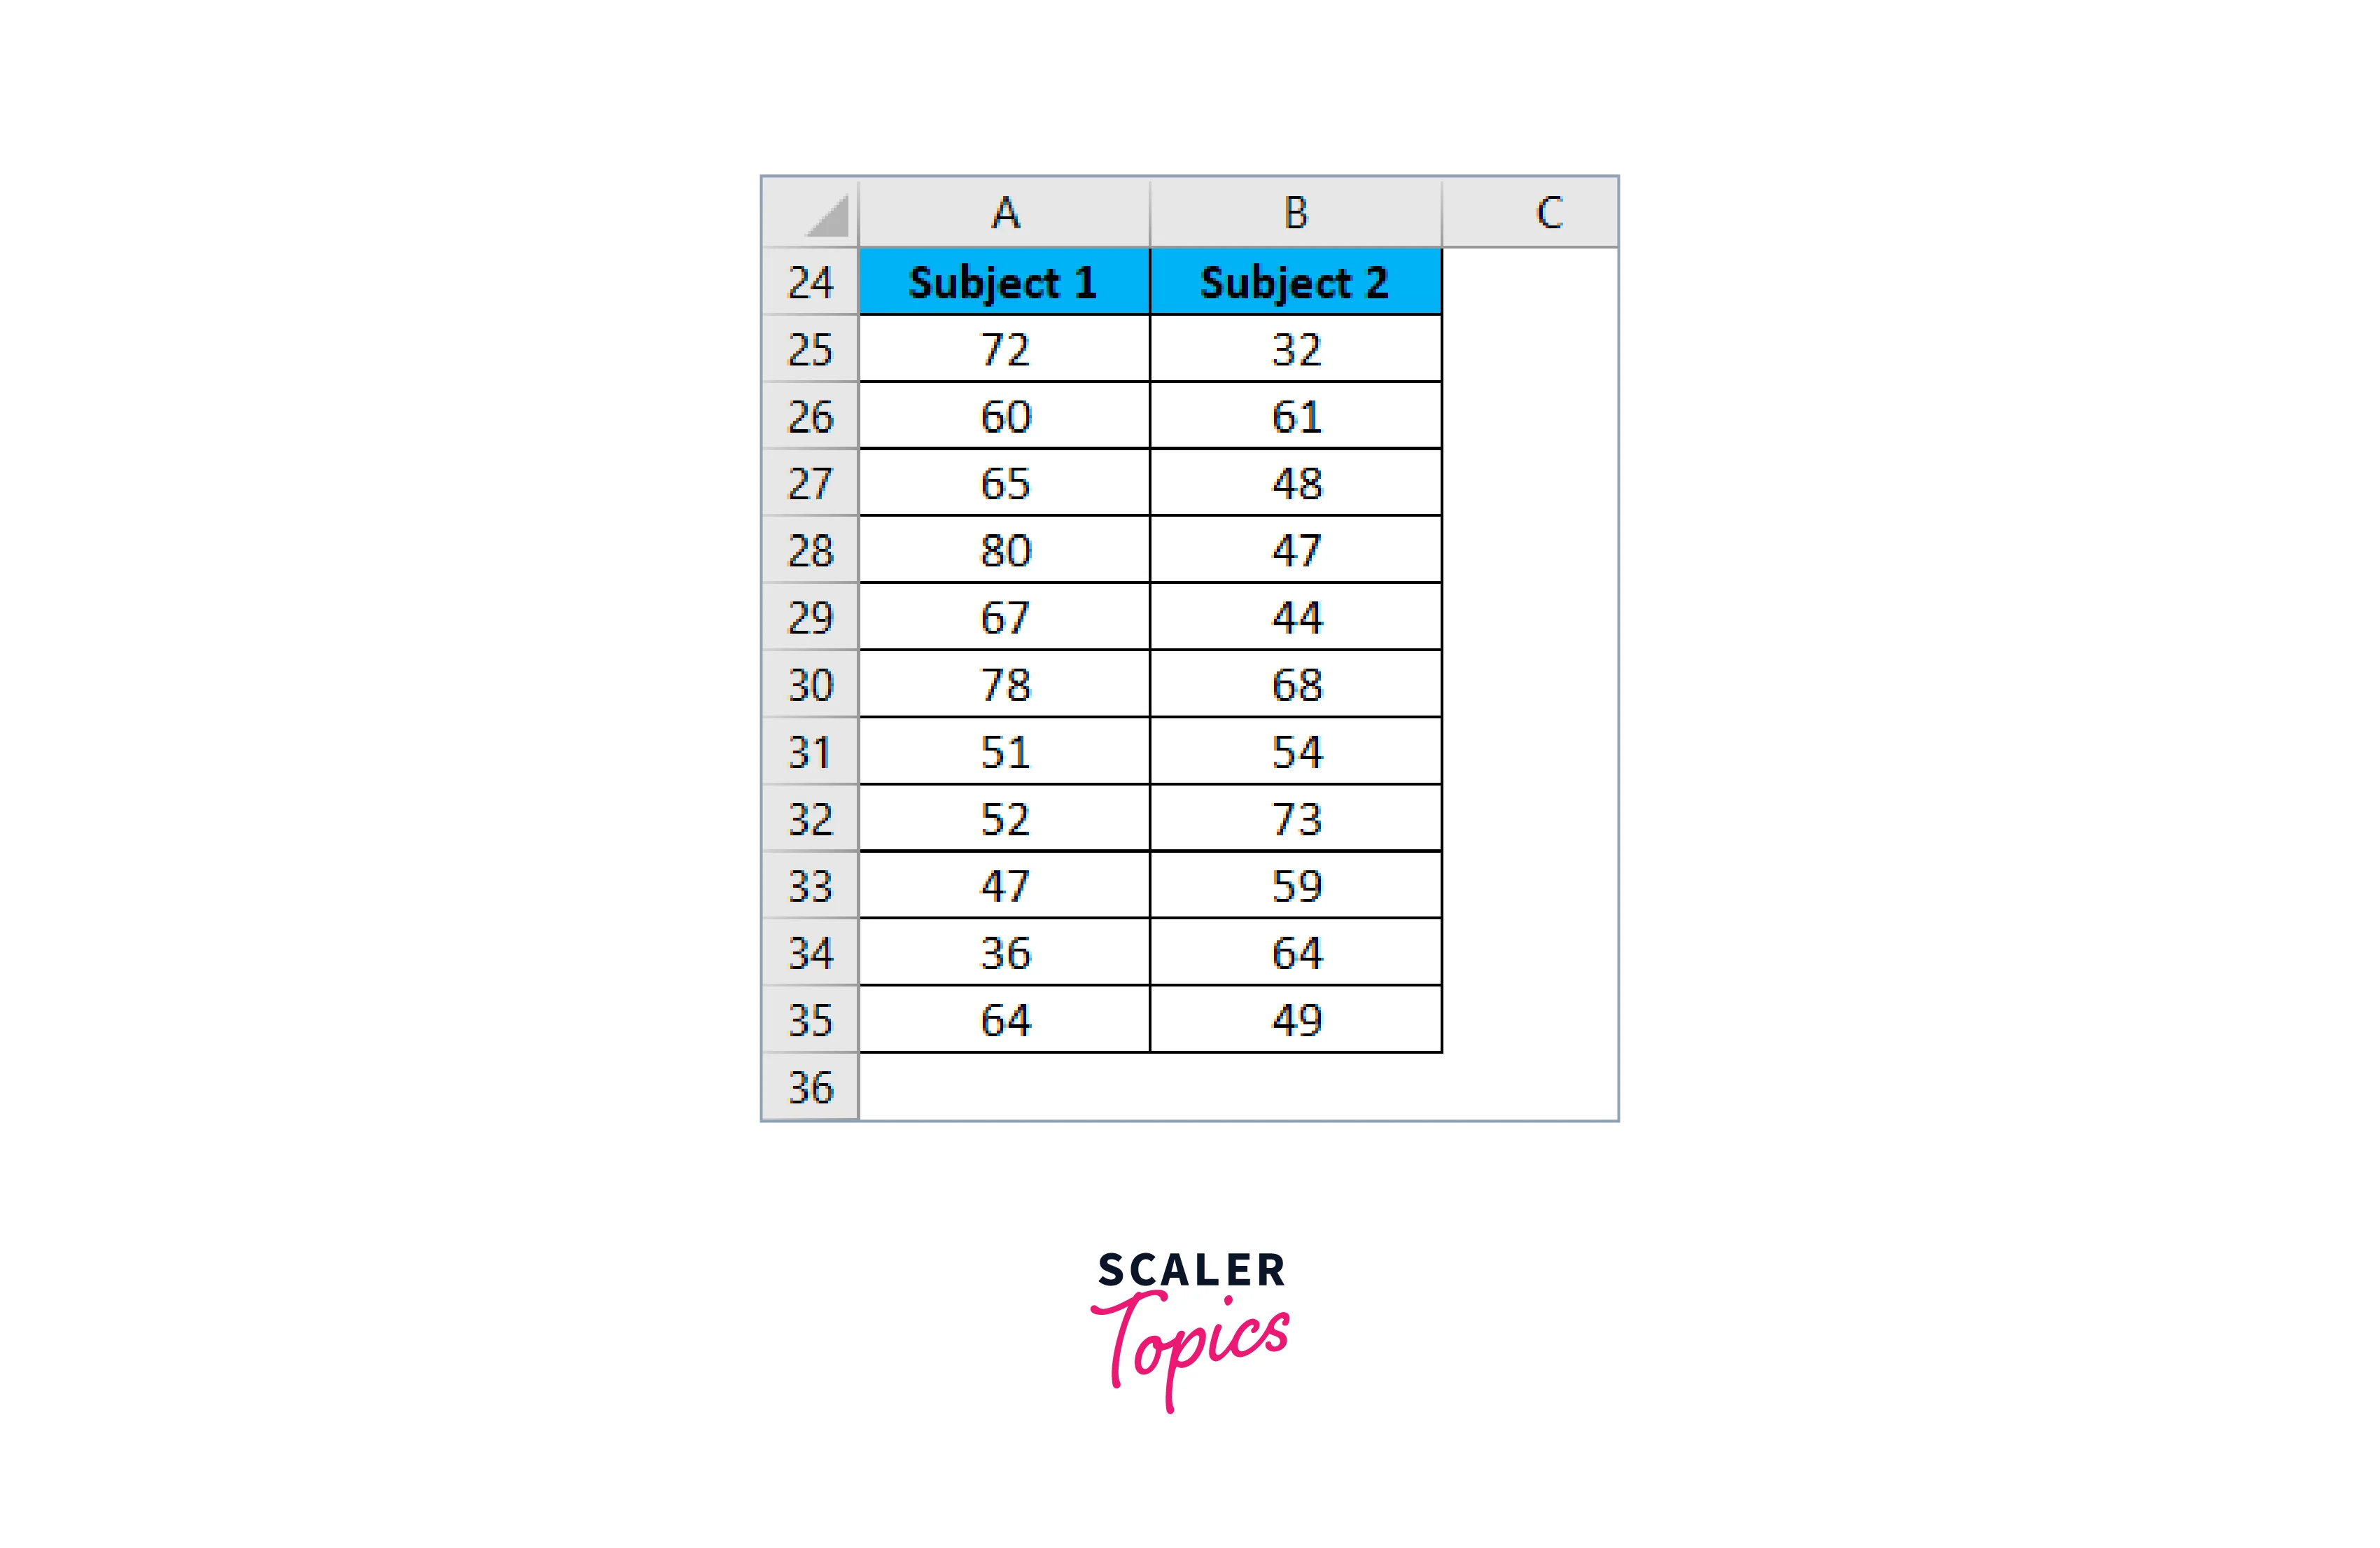
Take student grades for two different topics as an example.
-
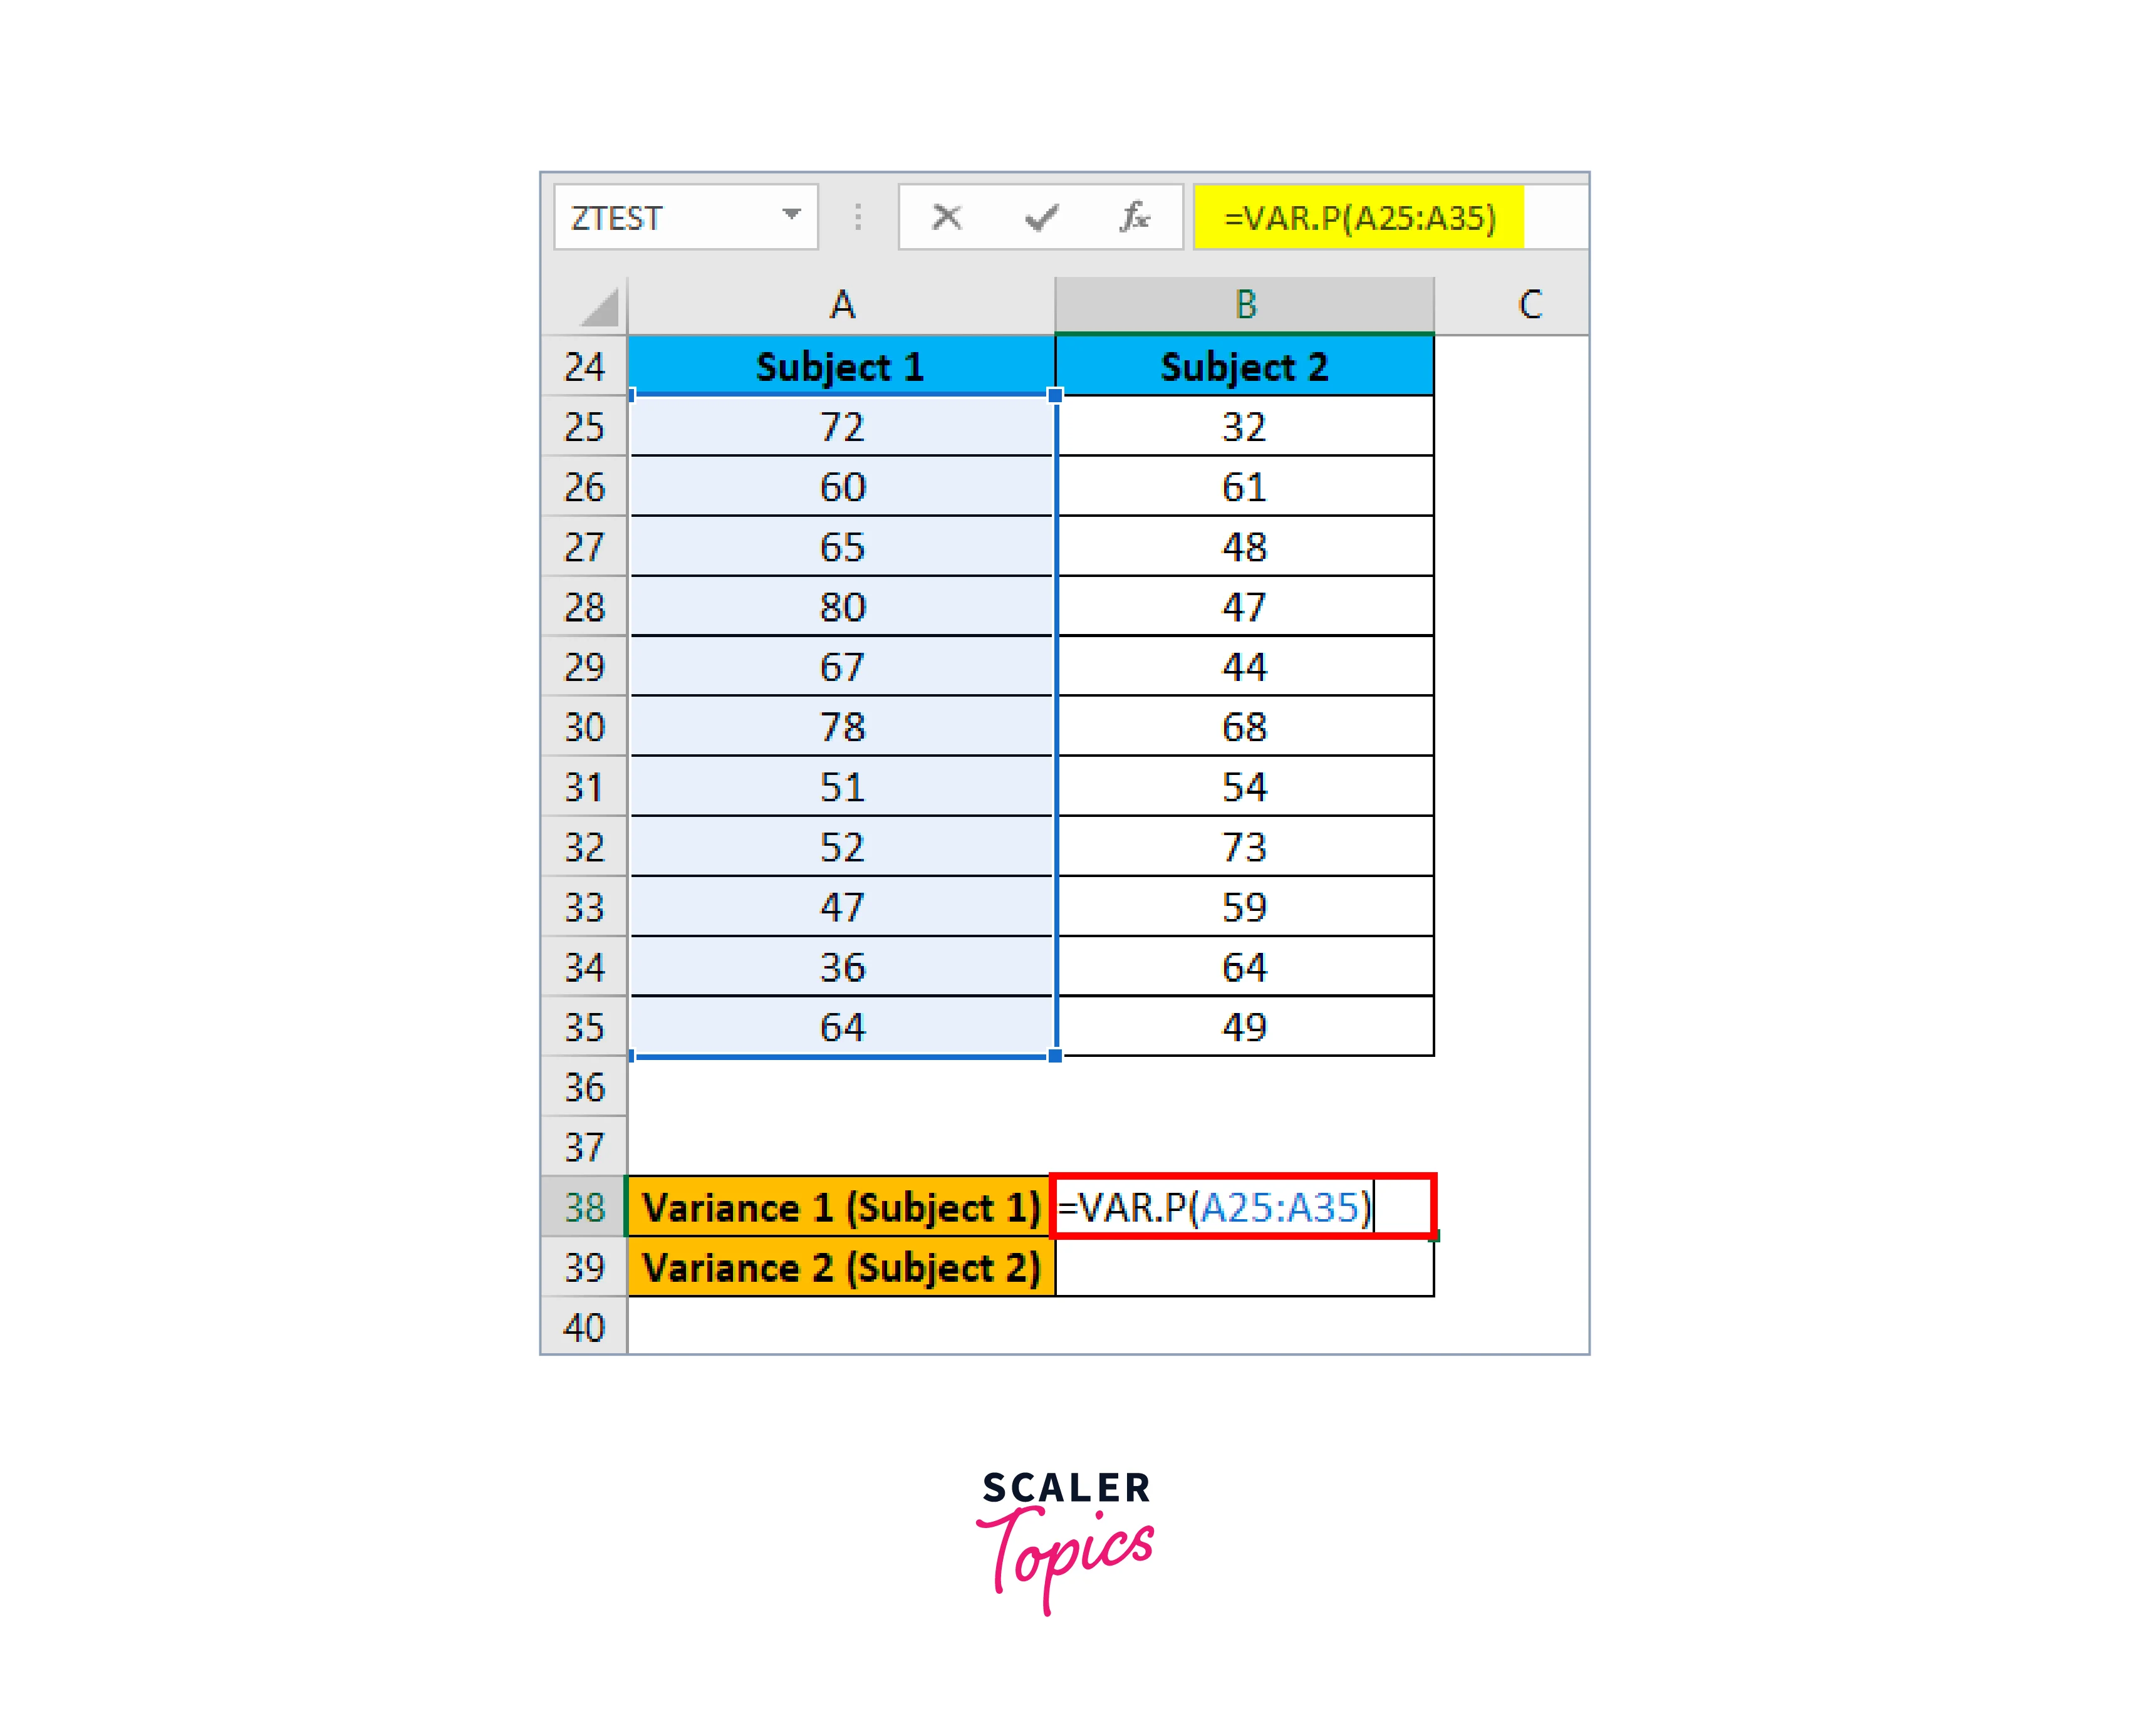
We will now use the following formula to determine the variance for both subjects:

The following formula is applicable to Variance 1 (Subject 1):
-
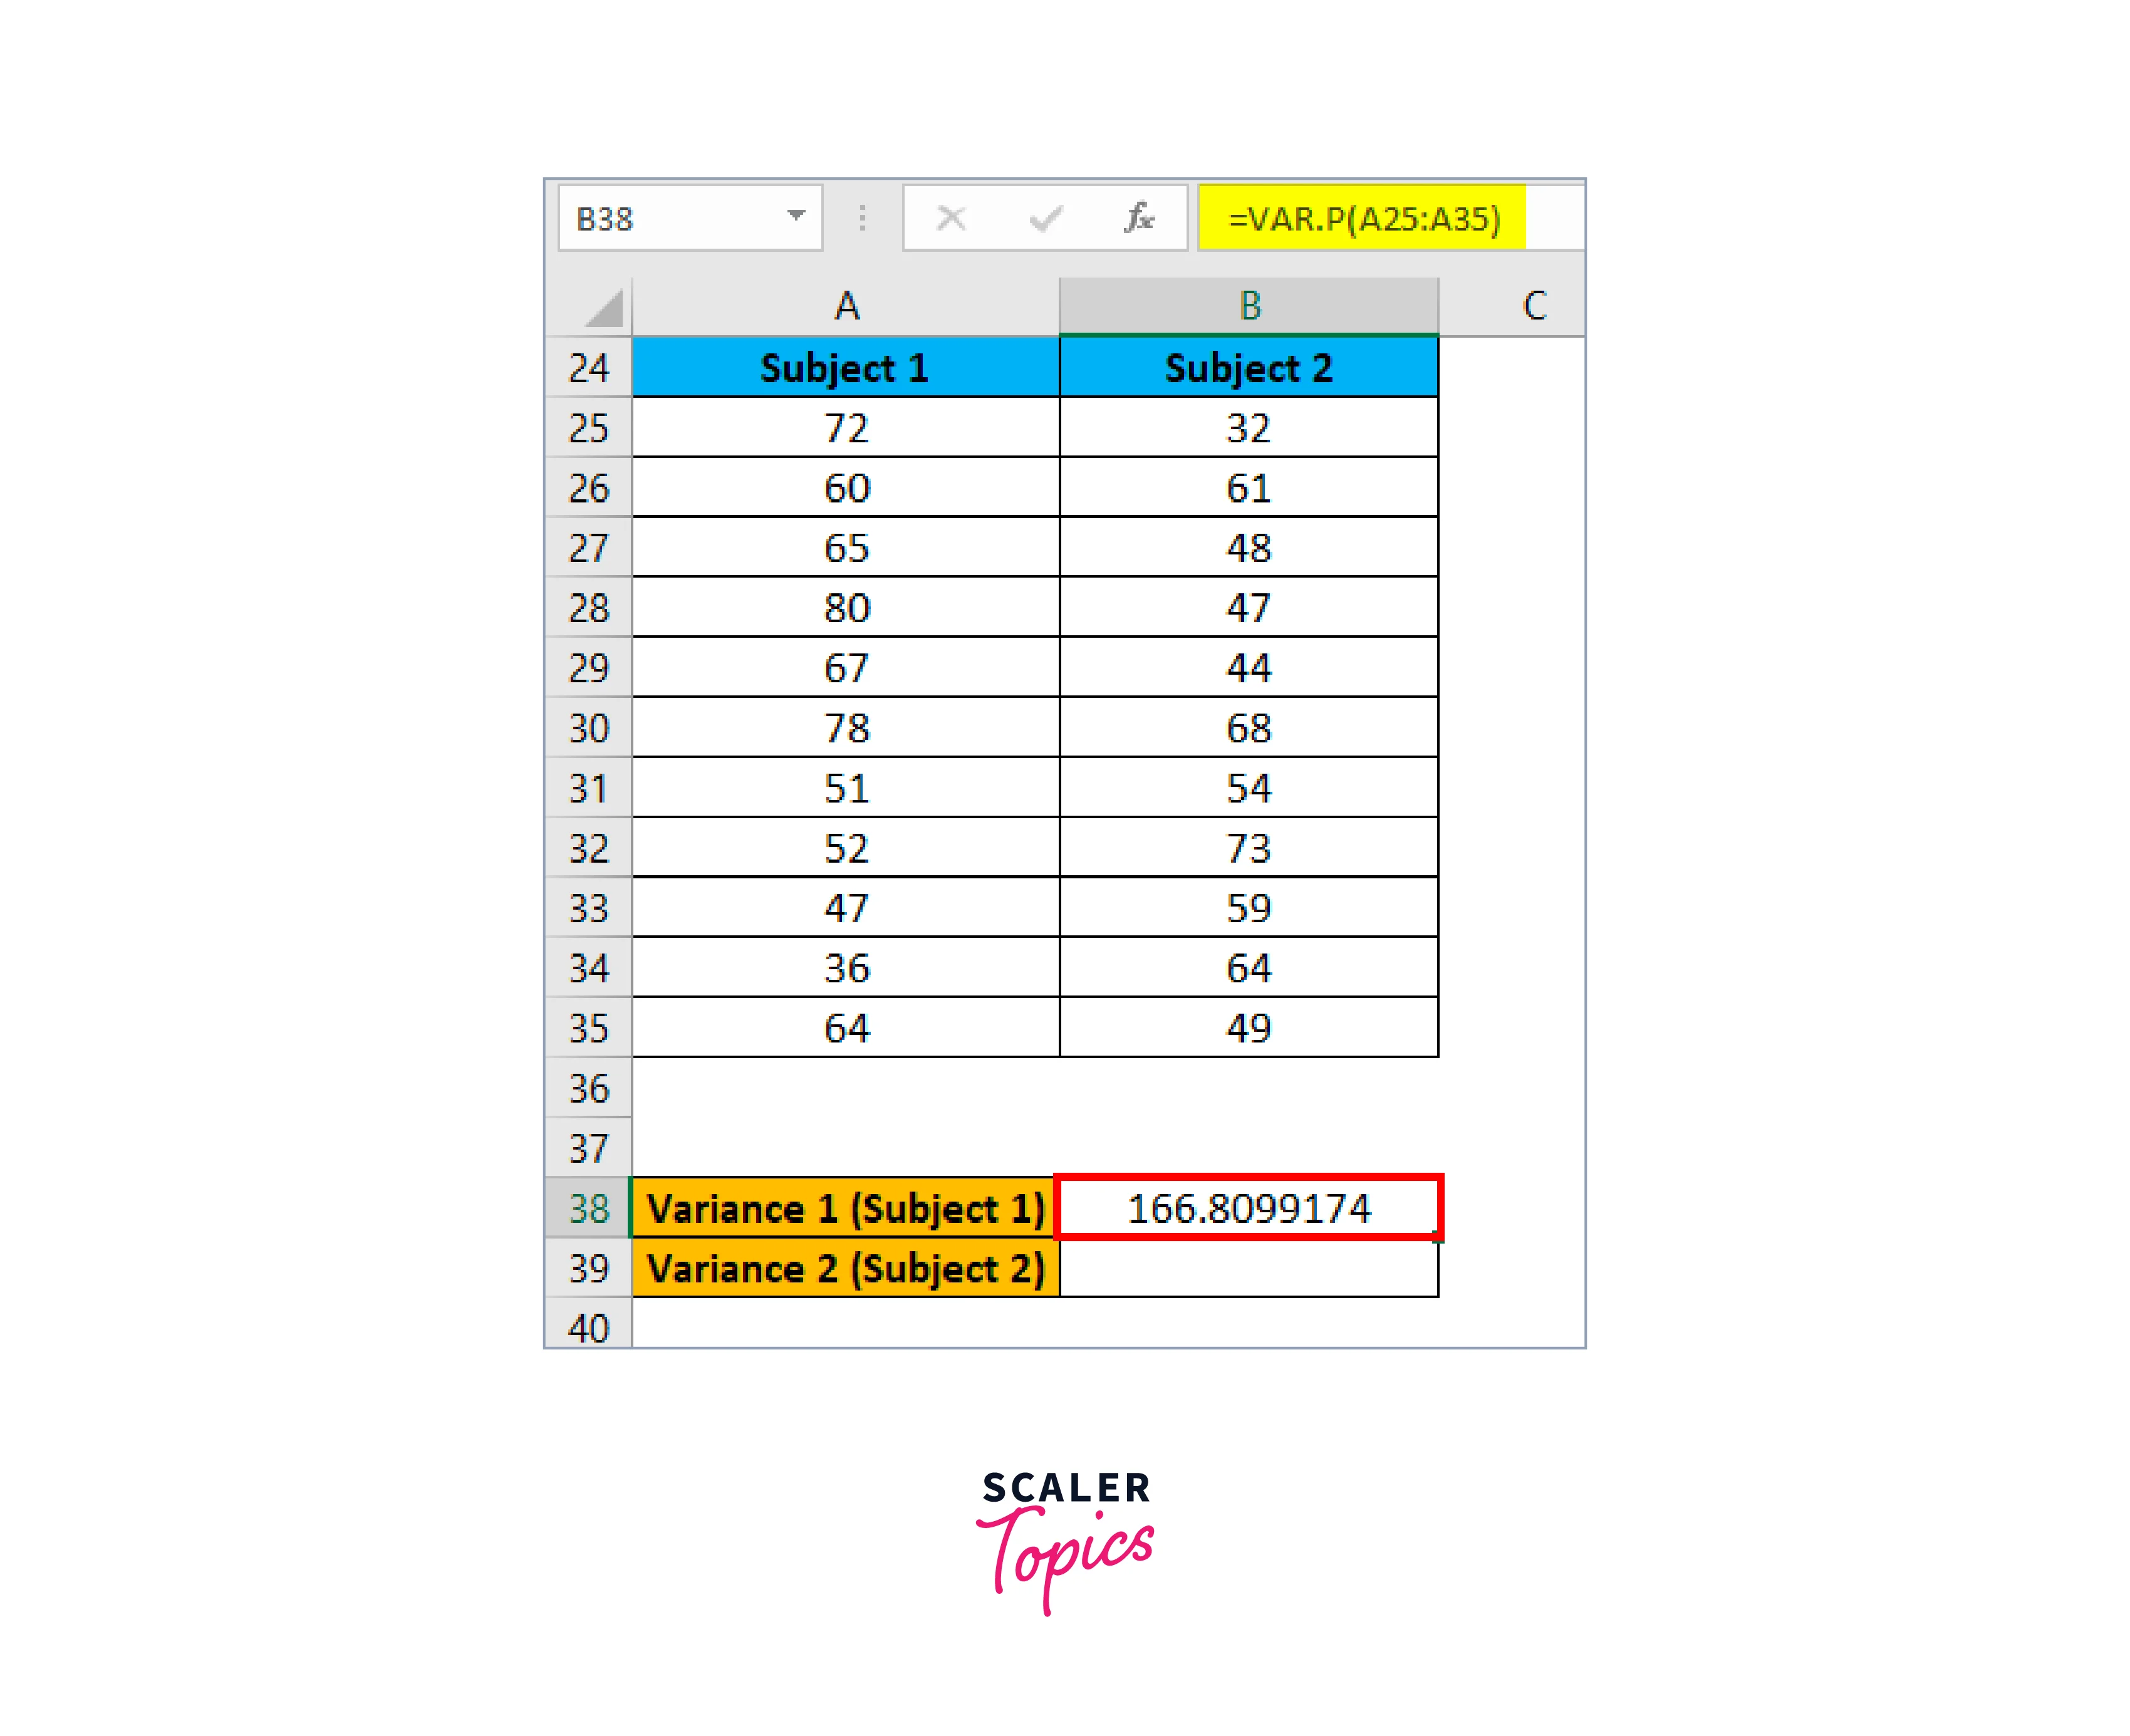
The result is shown below:
-
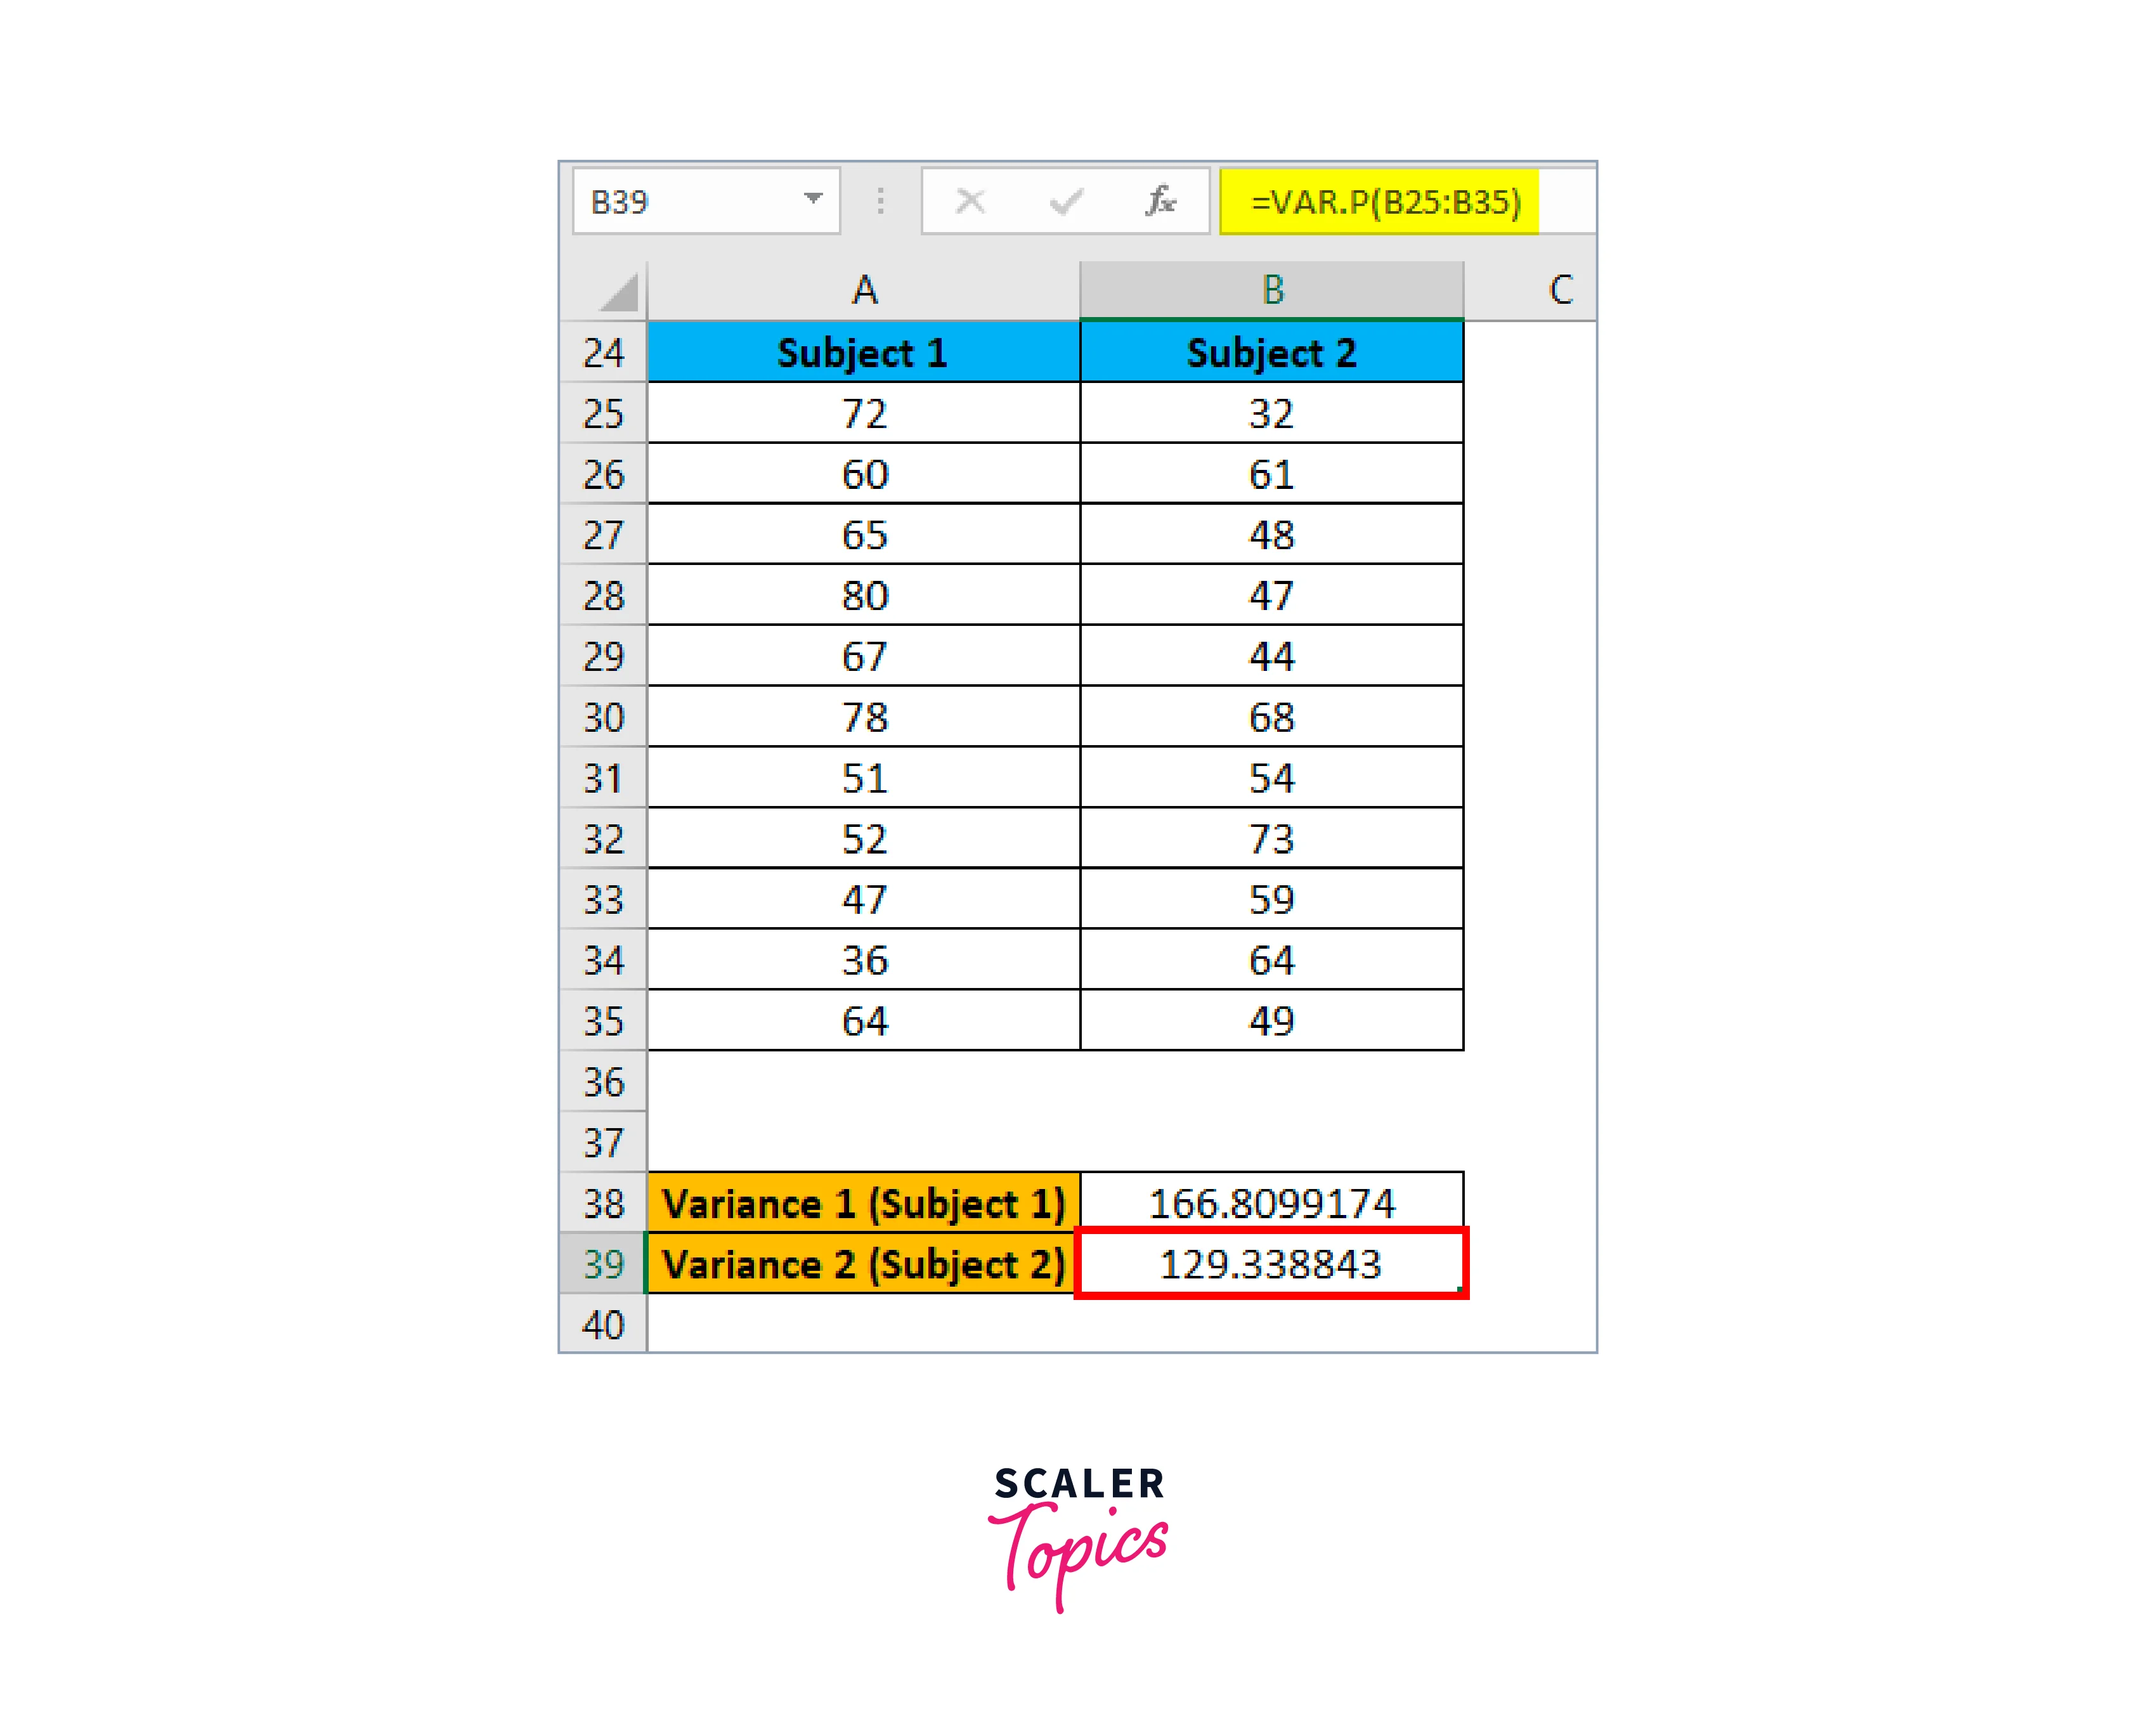
The following formula is applicable for Variance 2 (Subject 2):
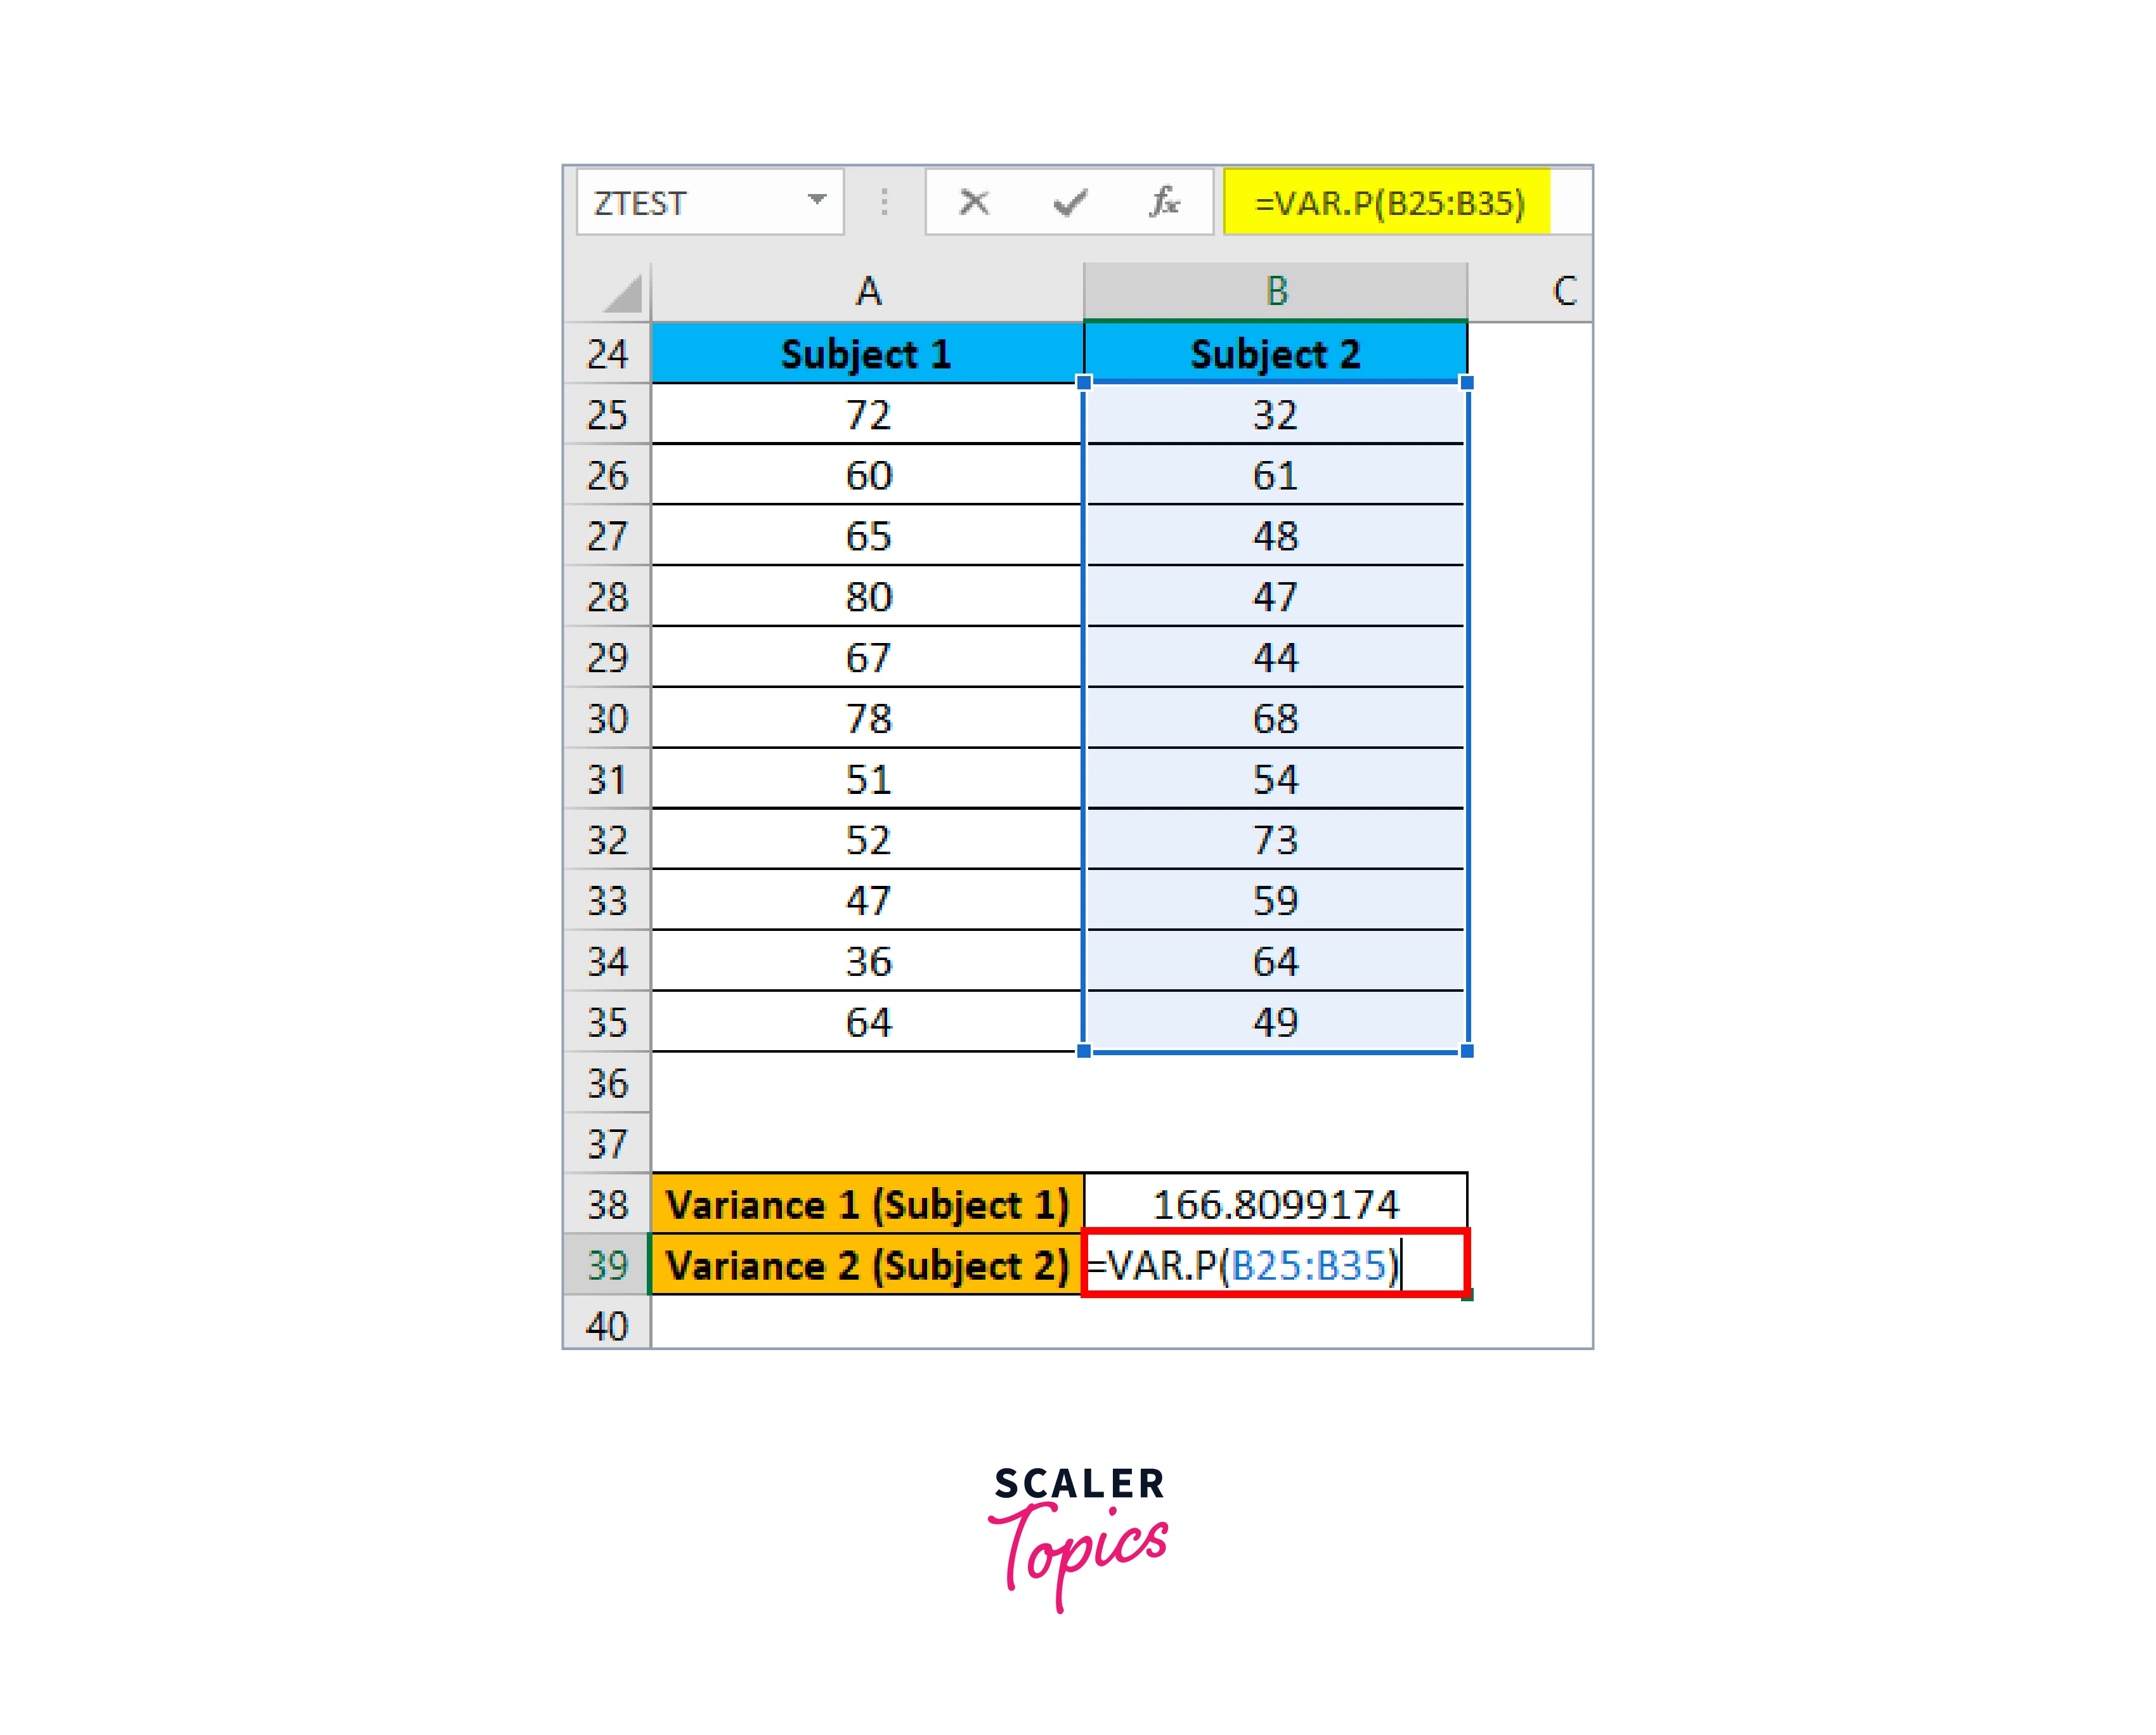
The result is given below:
-
Now, select the DATA tab and then select the Data Analysis tab, as shown in the screenshot below:
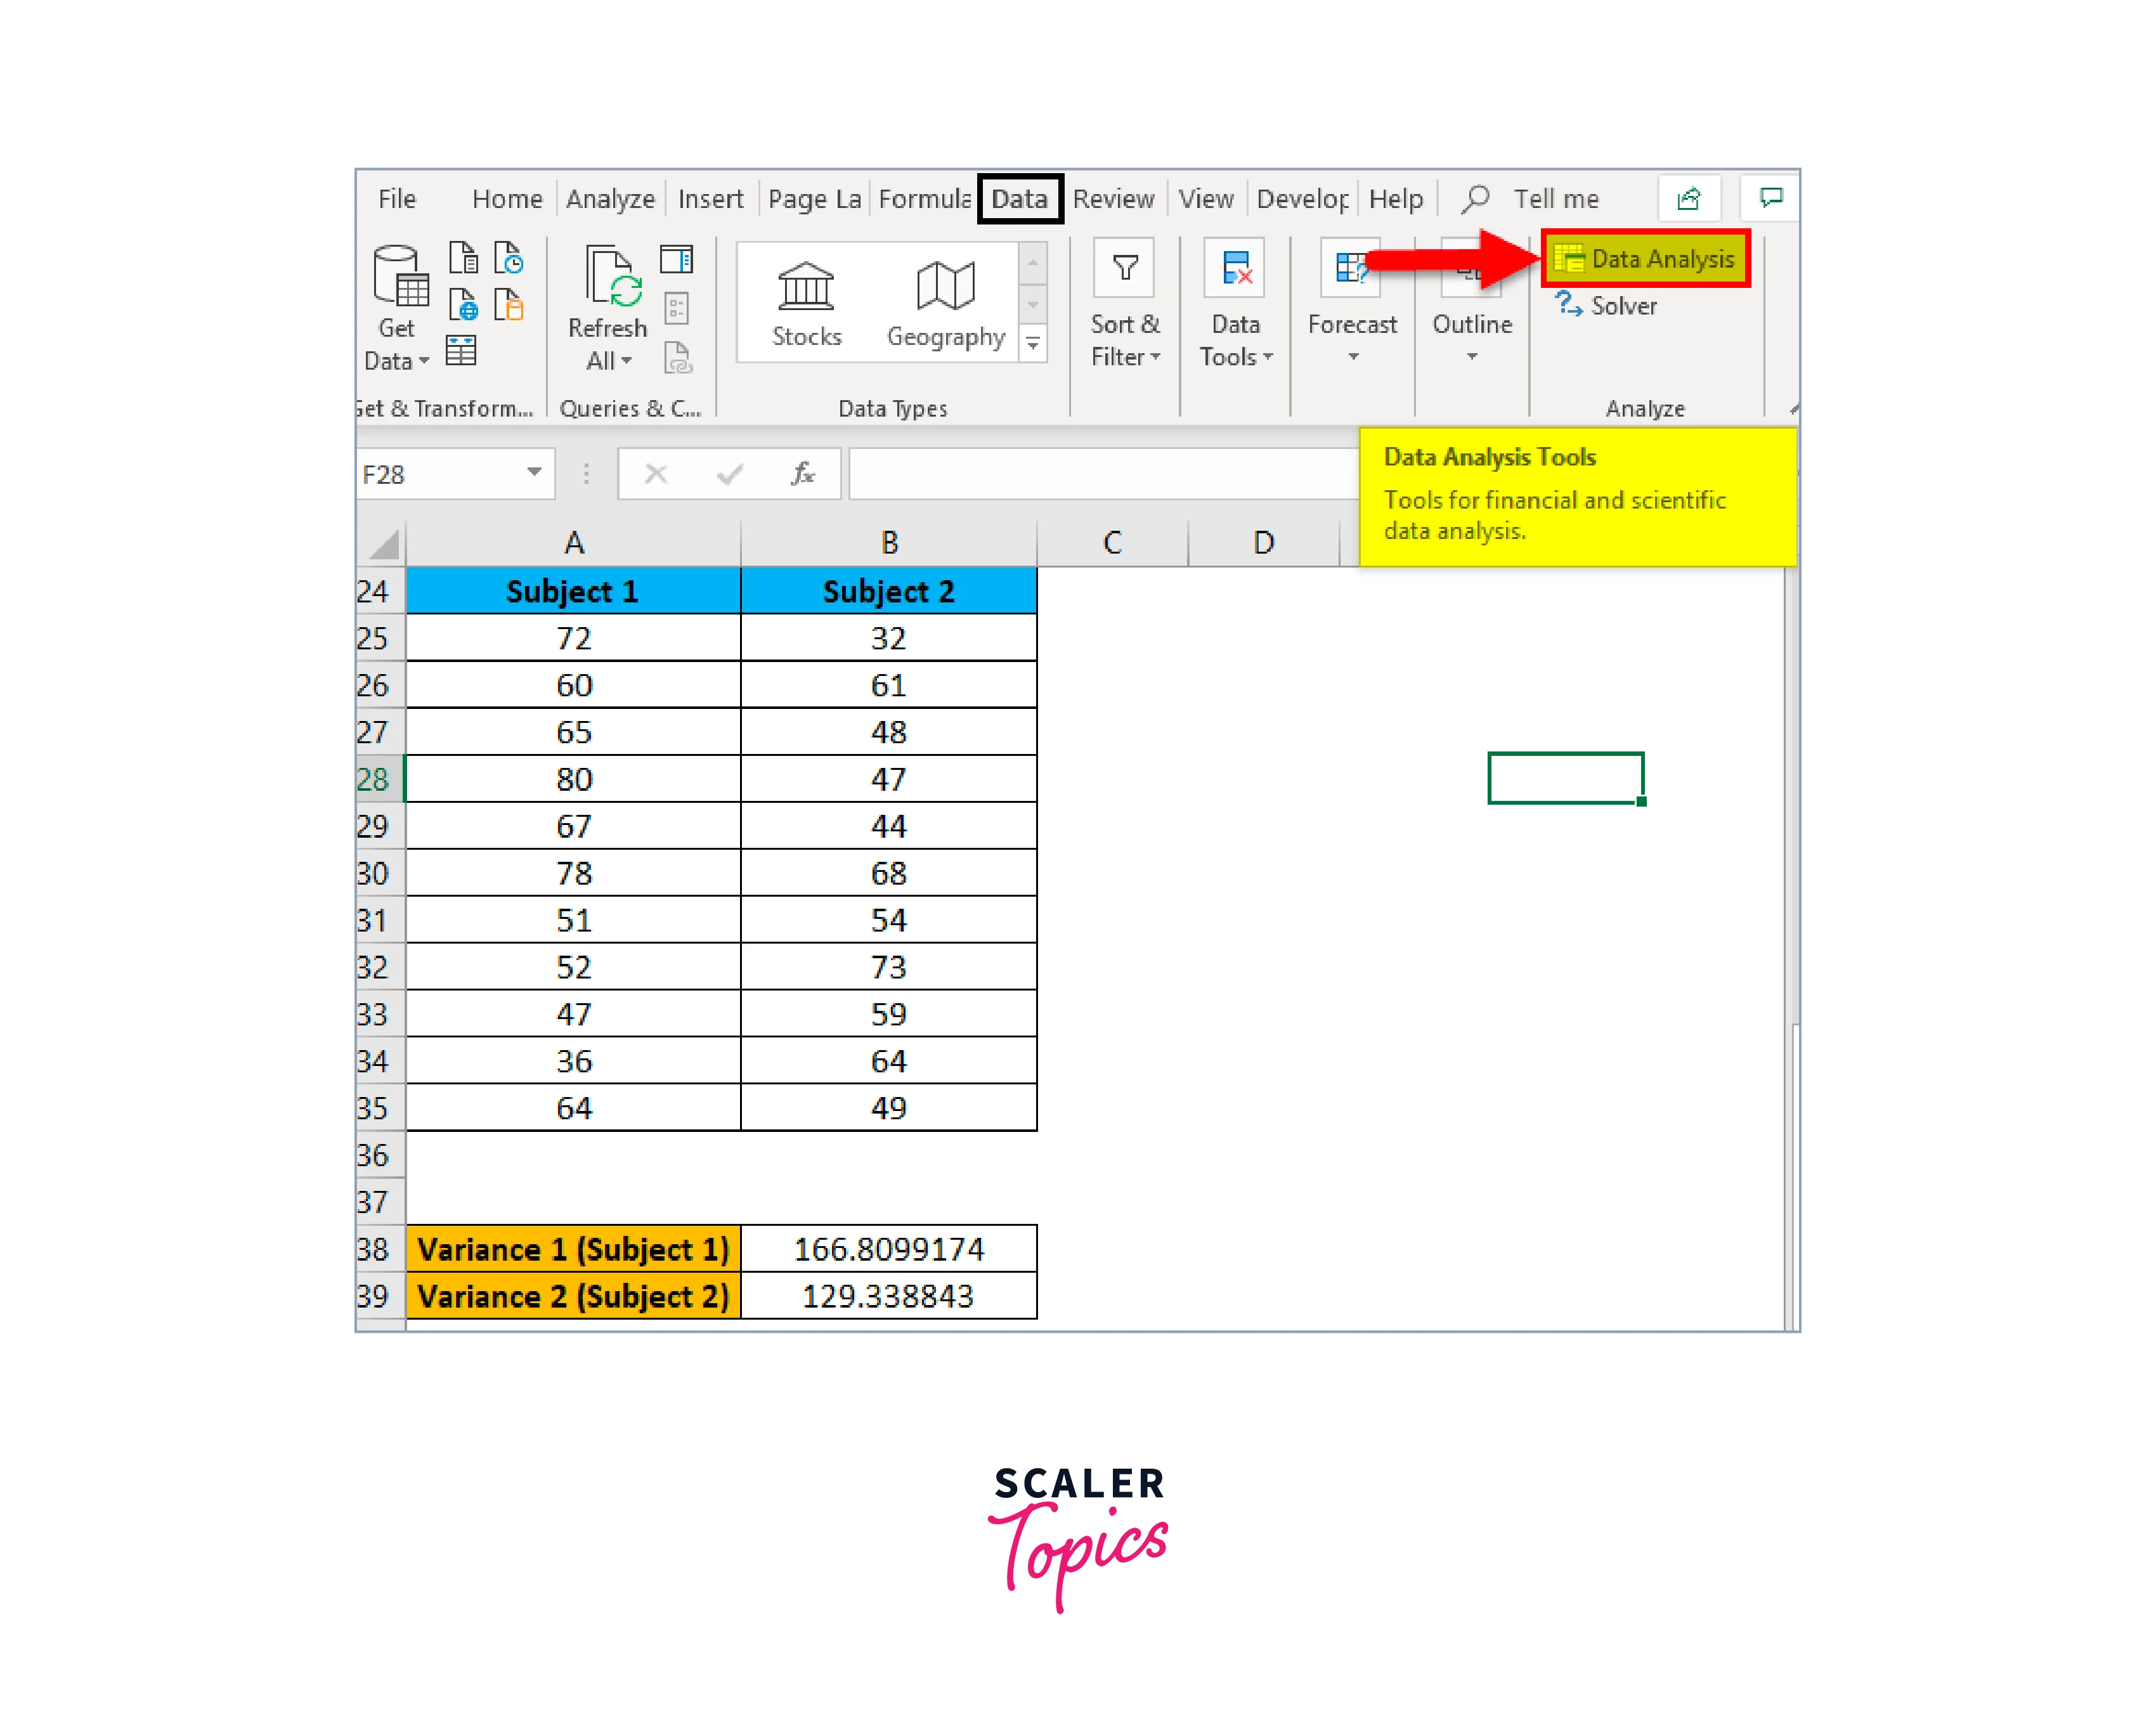
-
A Data Analysis choices dialogue box will be displayed.
-
Click OK after selecting z-Test:
Two-Sample for Means, as shown below.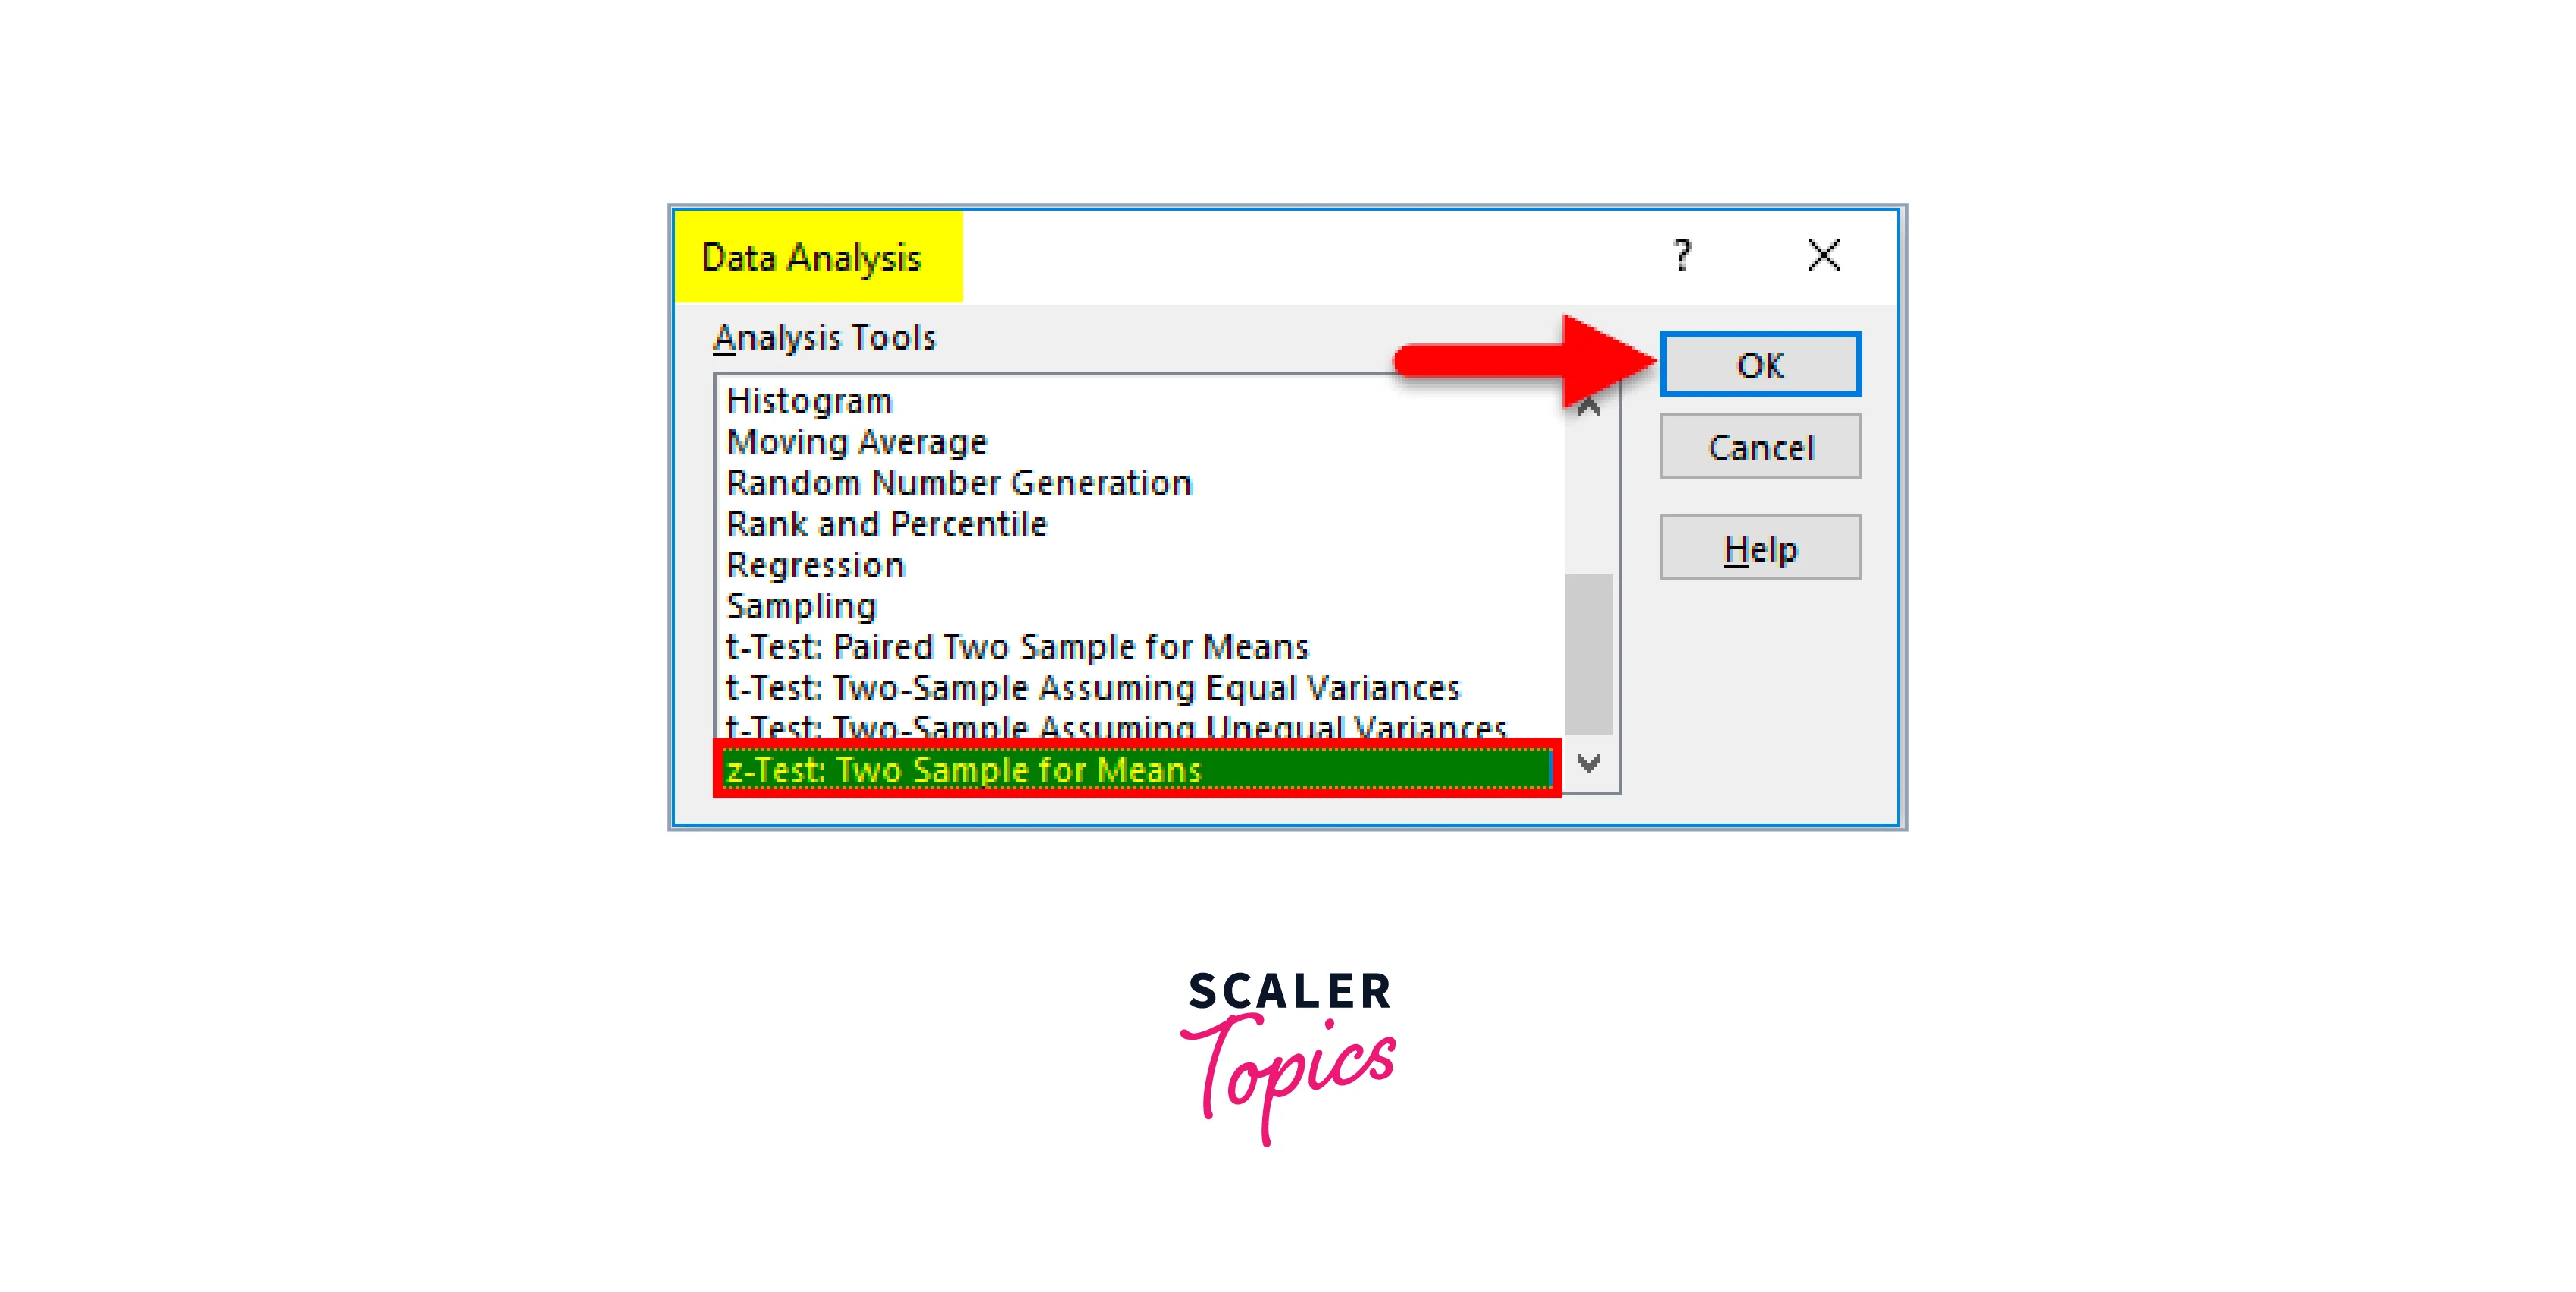
-
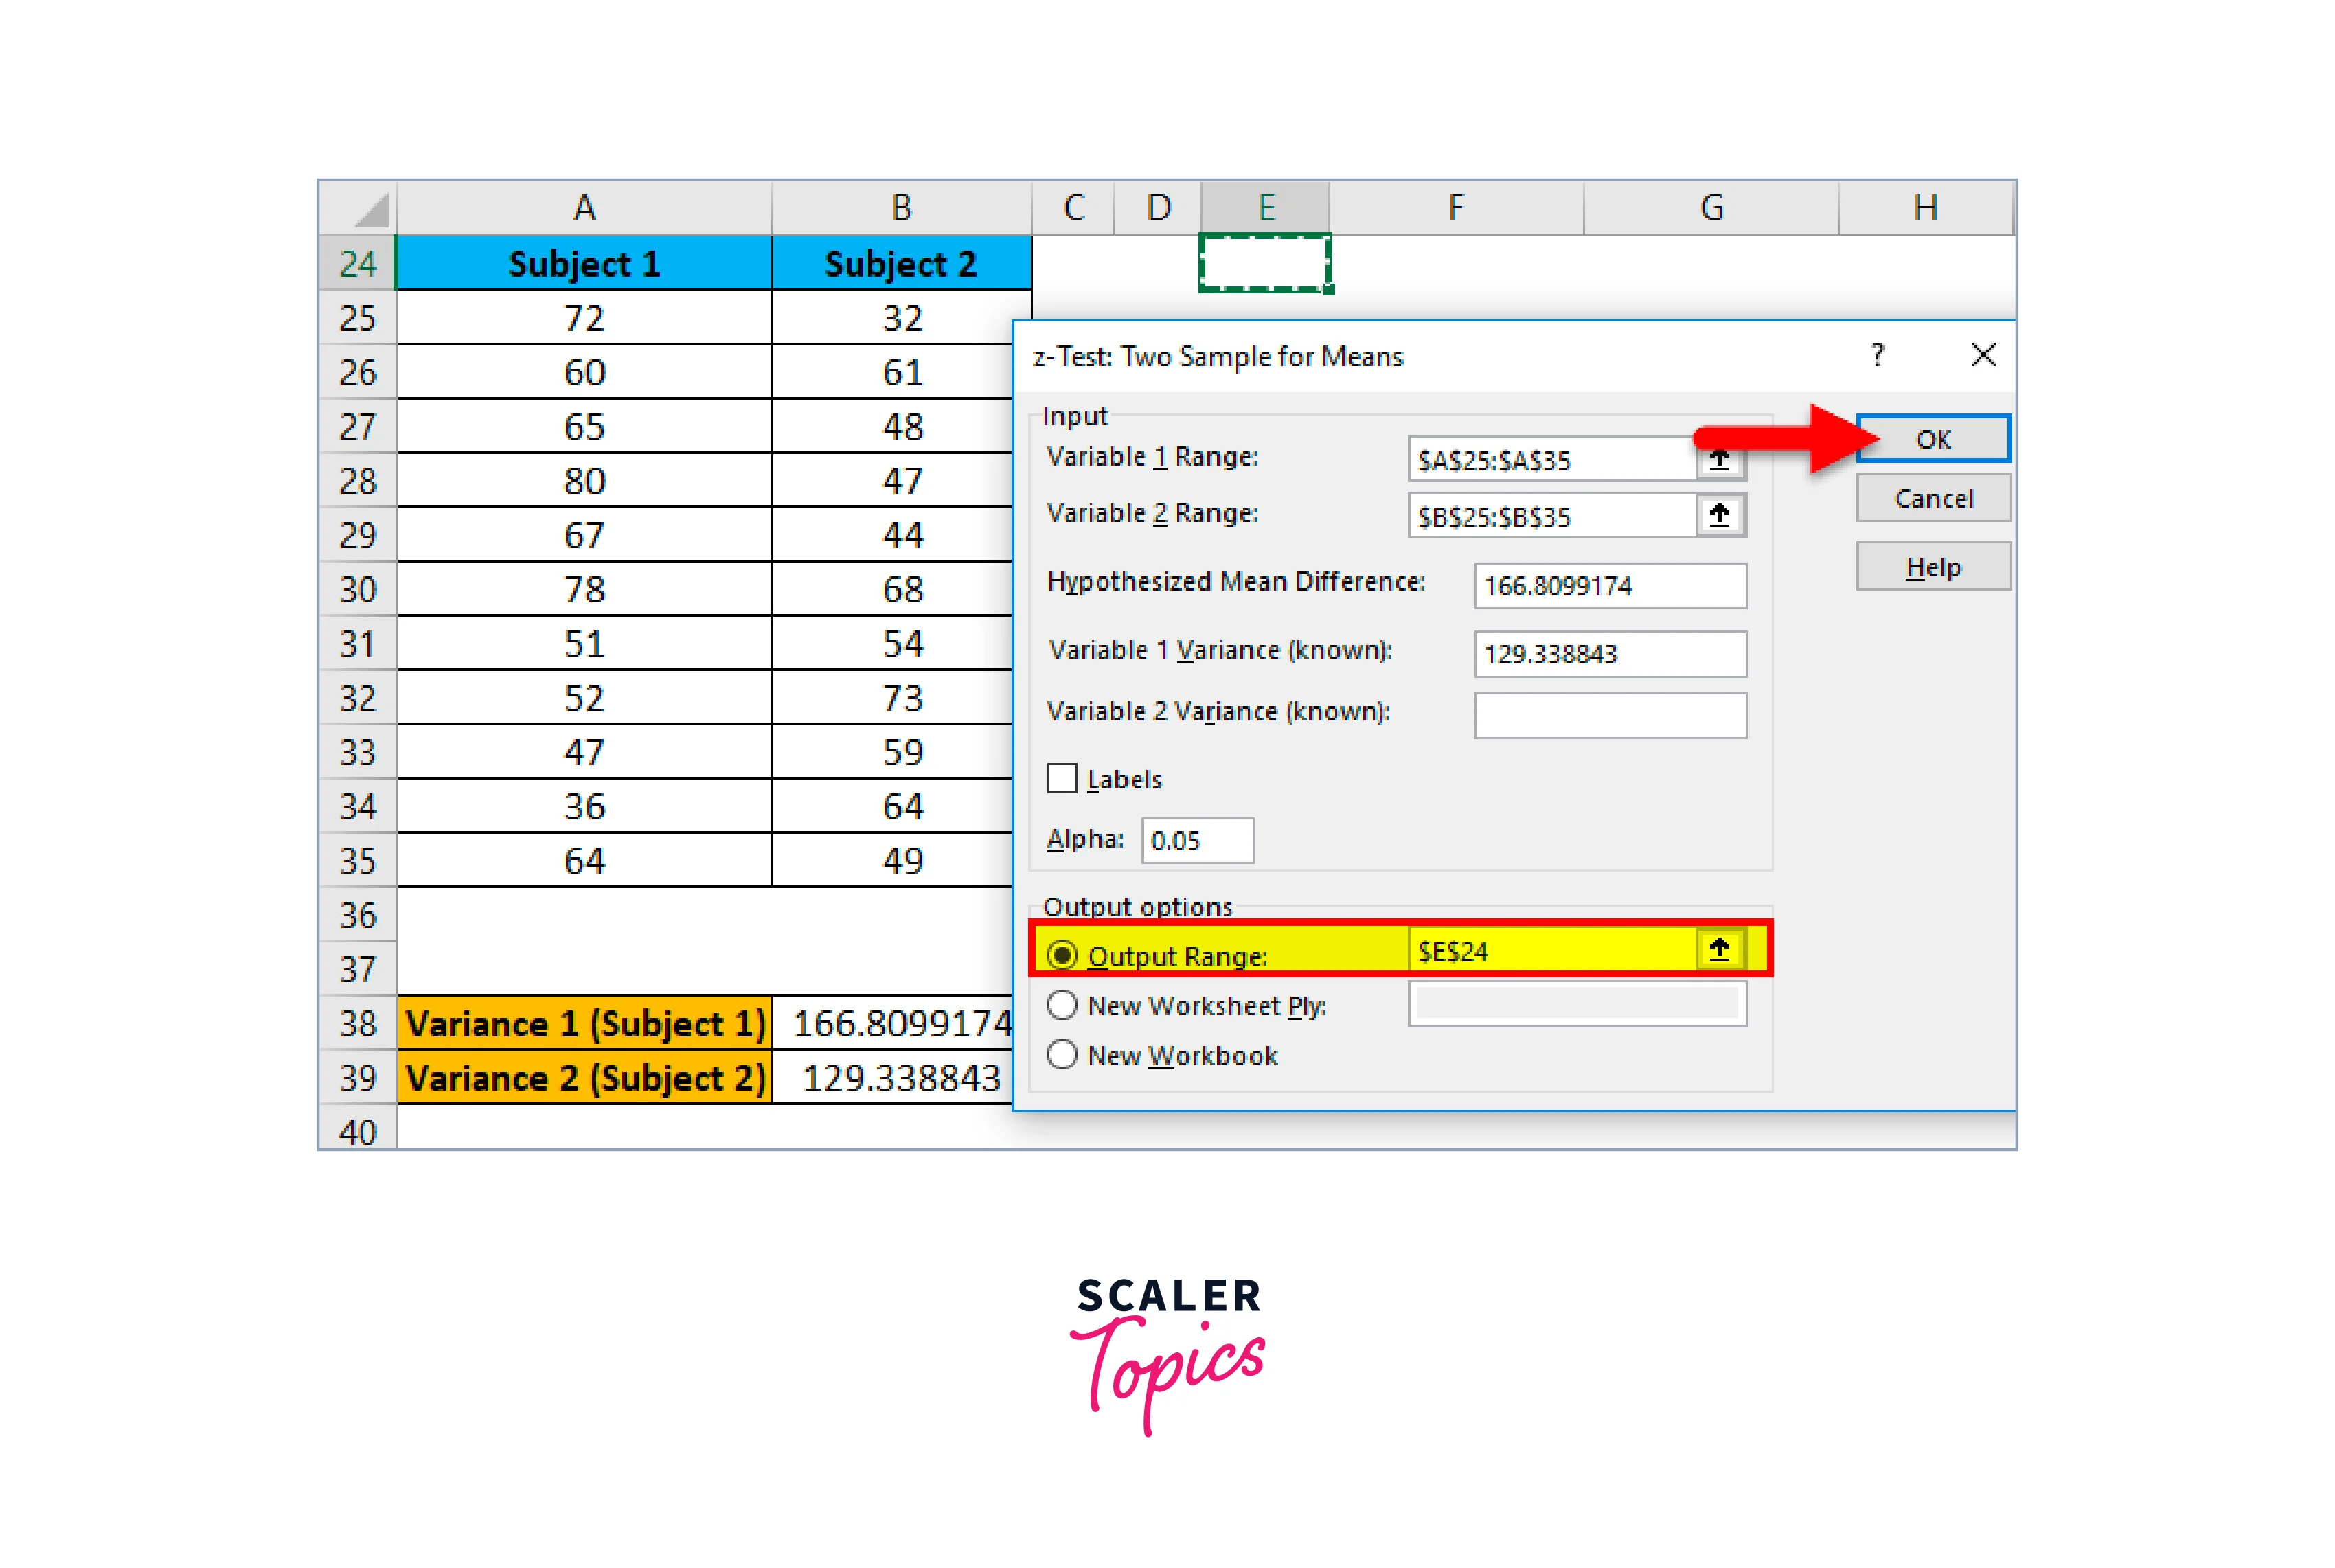
It will launch the Z-test dialogue box, as displayed below.
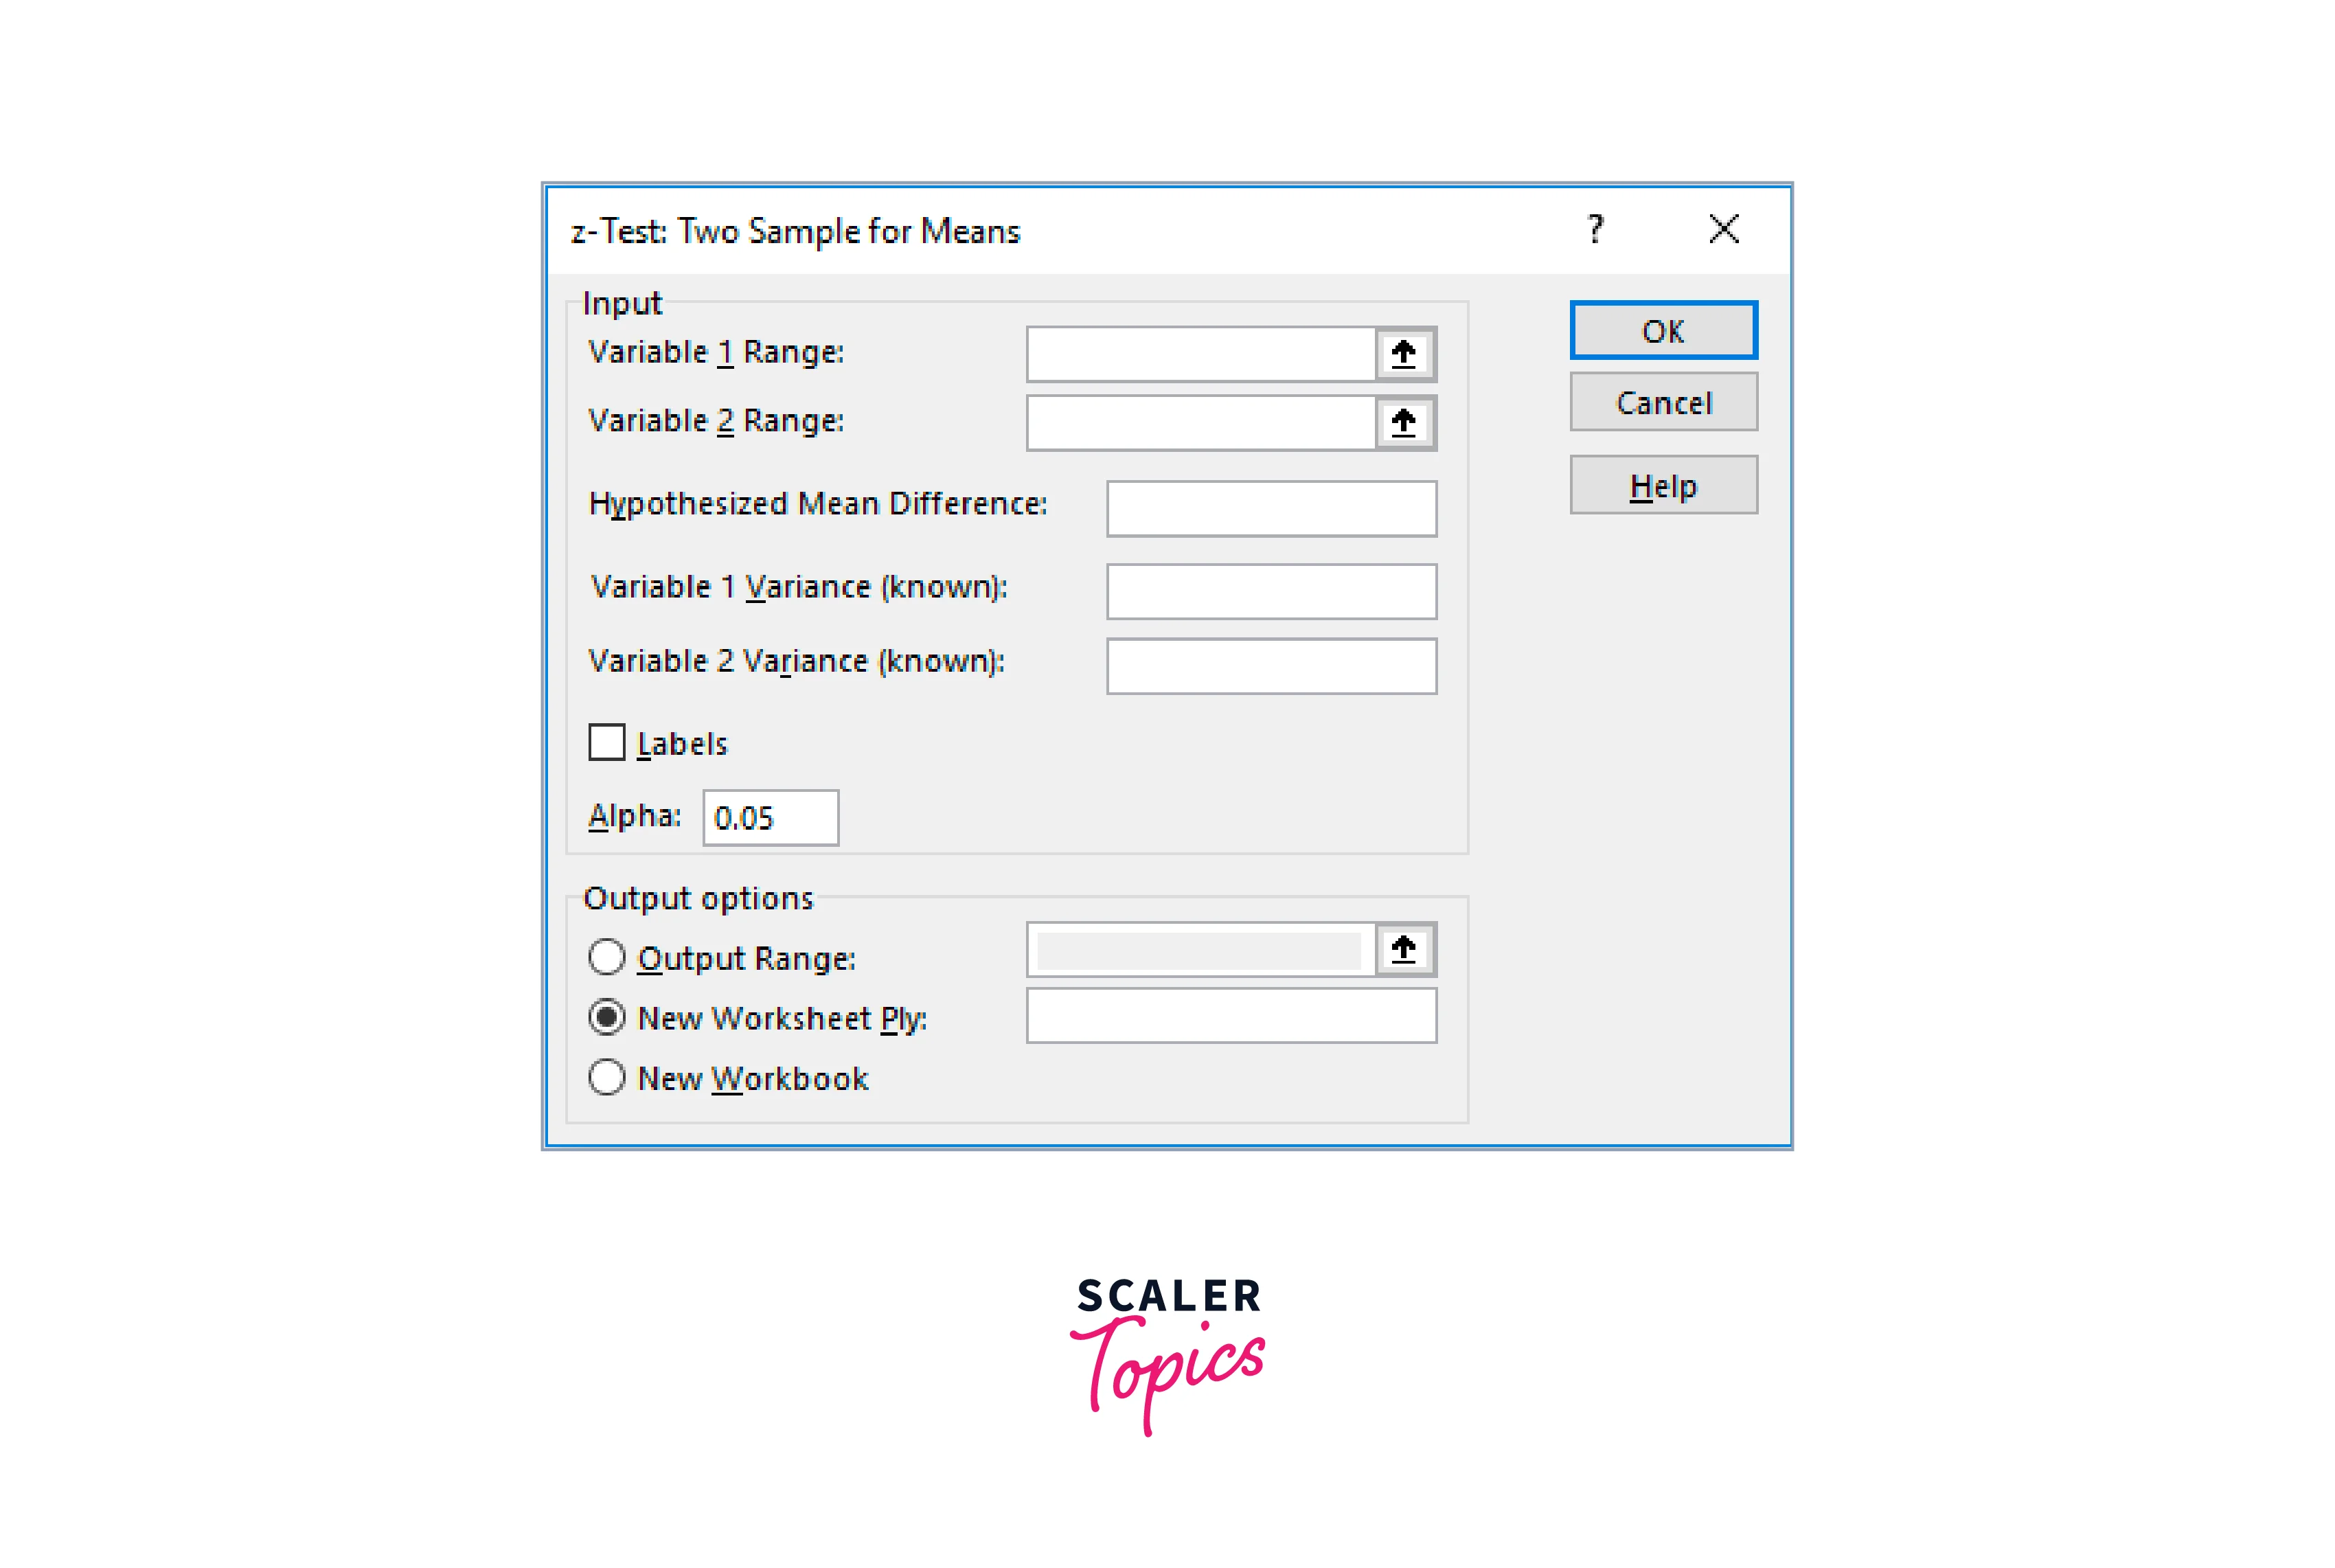
-
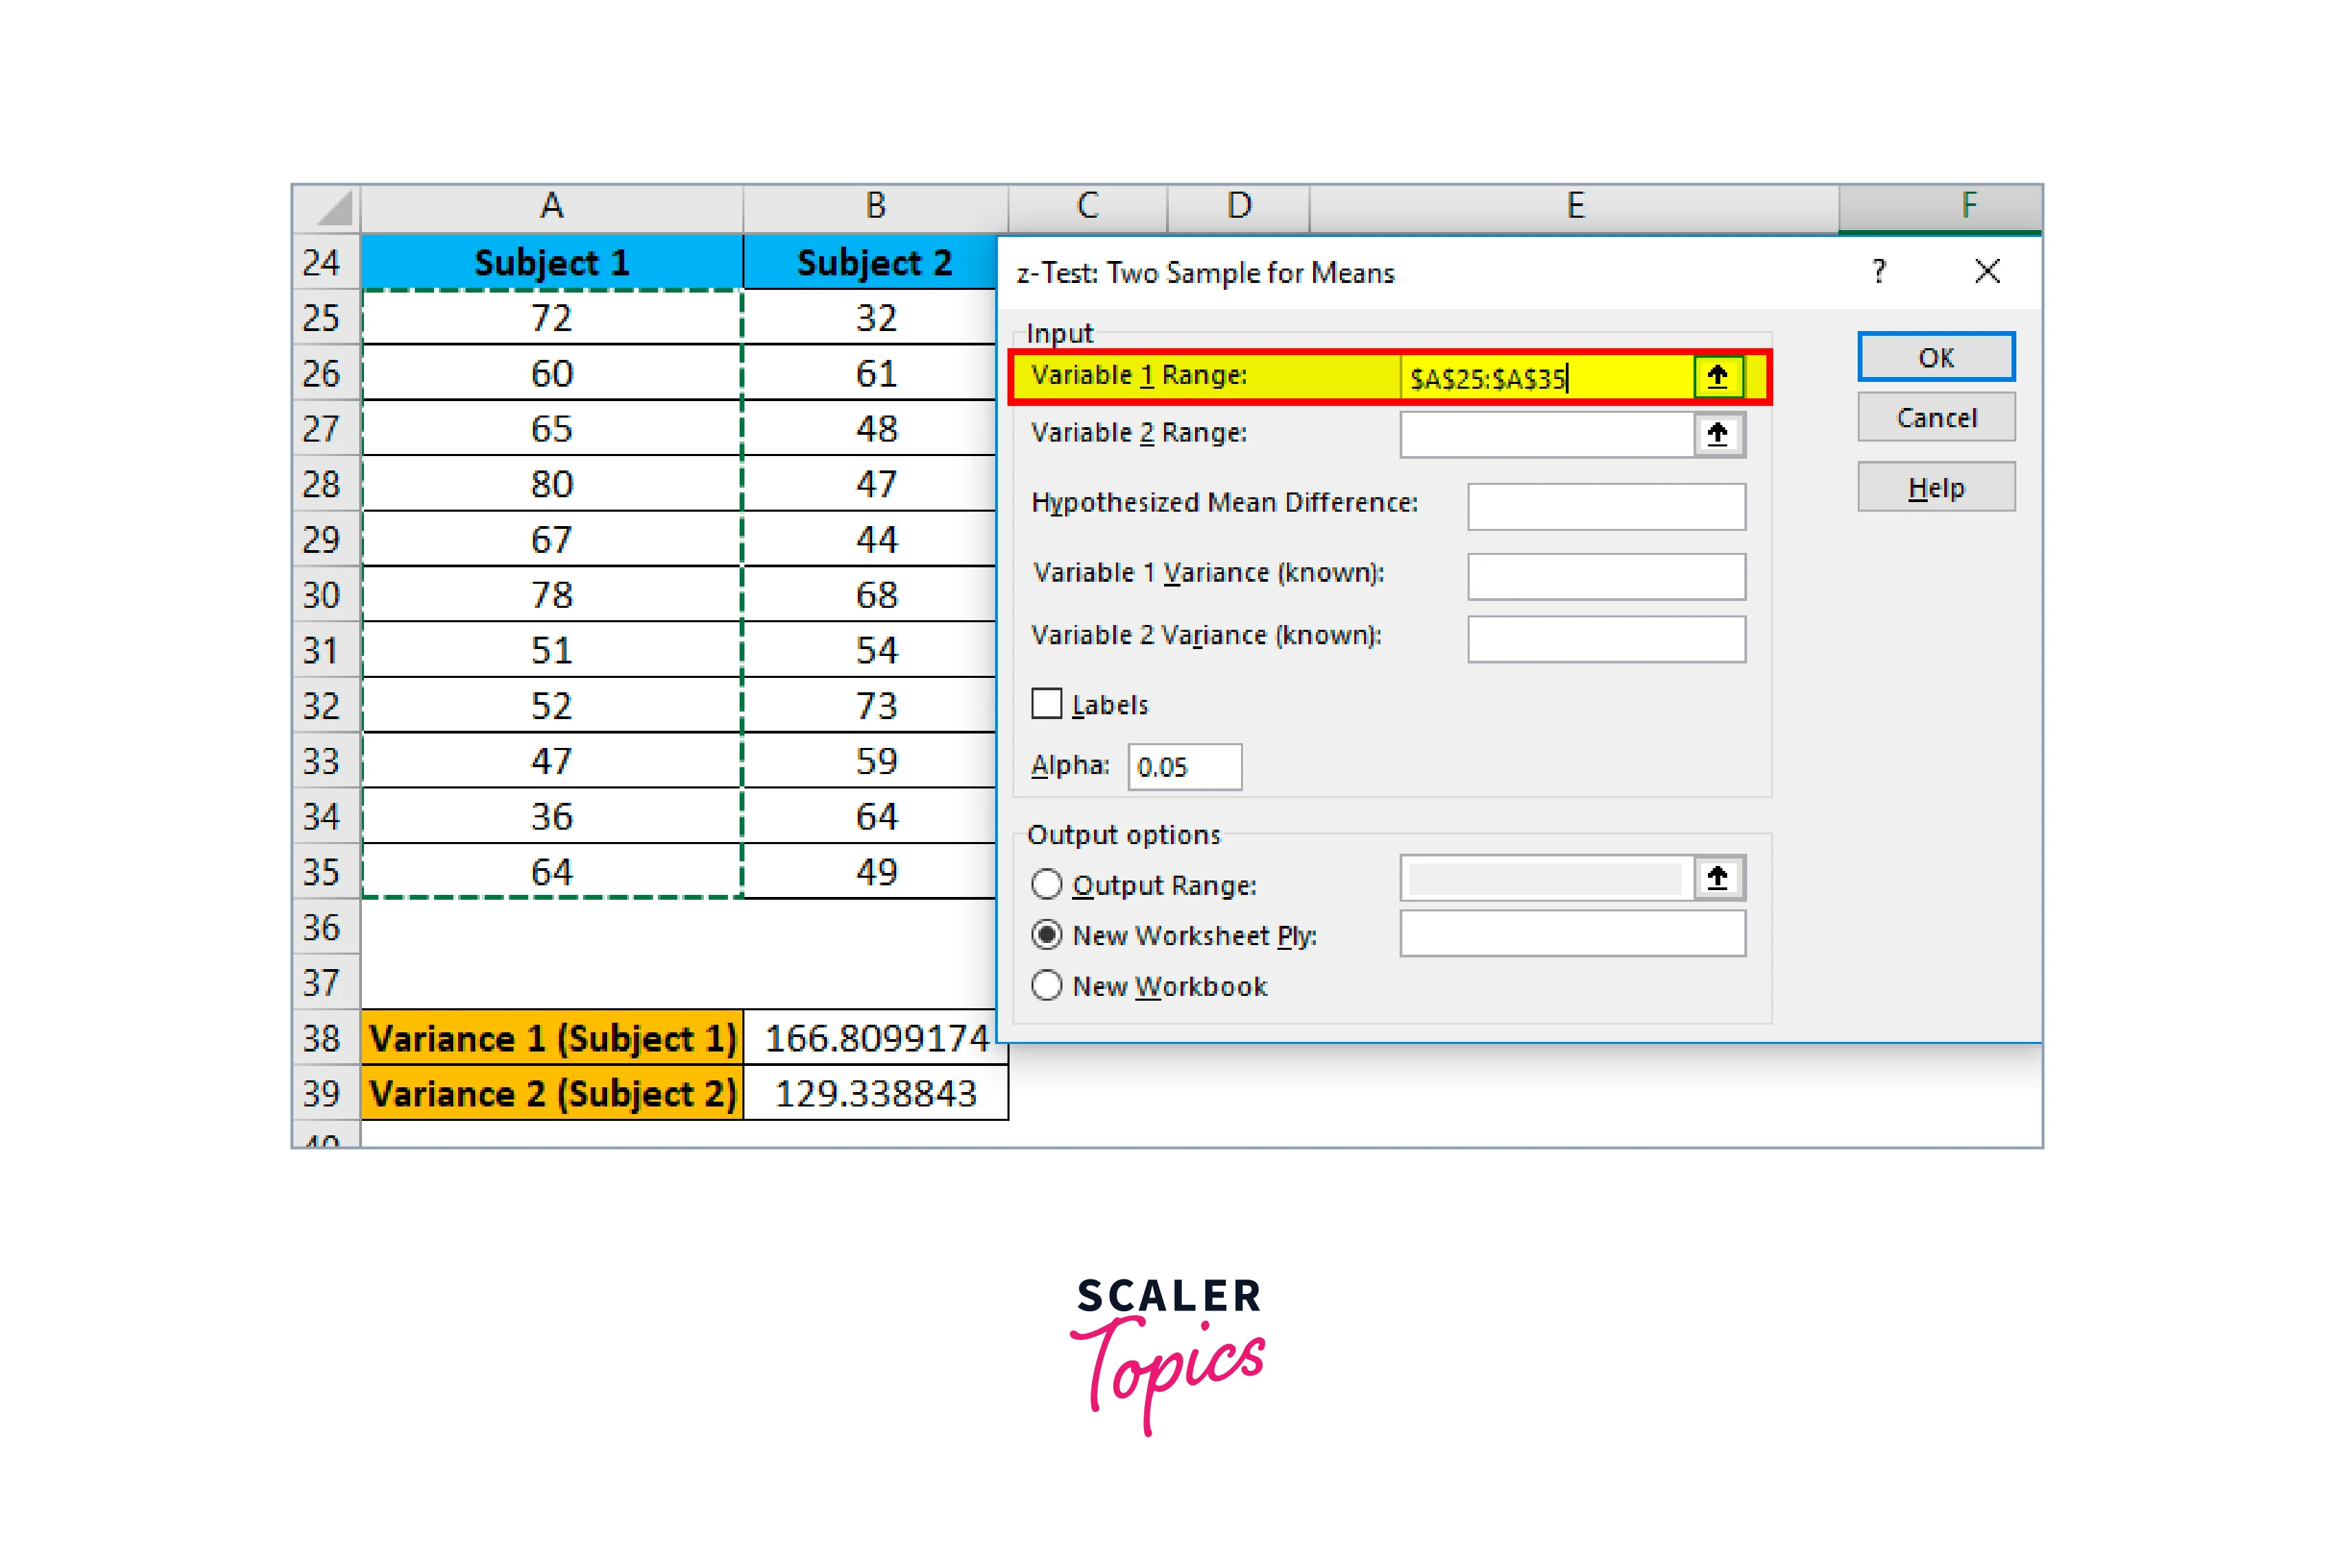
Choose subject one range from A25 to A35 in the Variable 1 range box at this point.
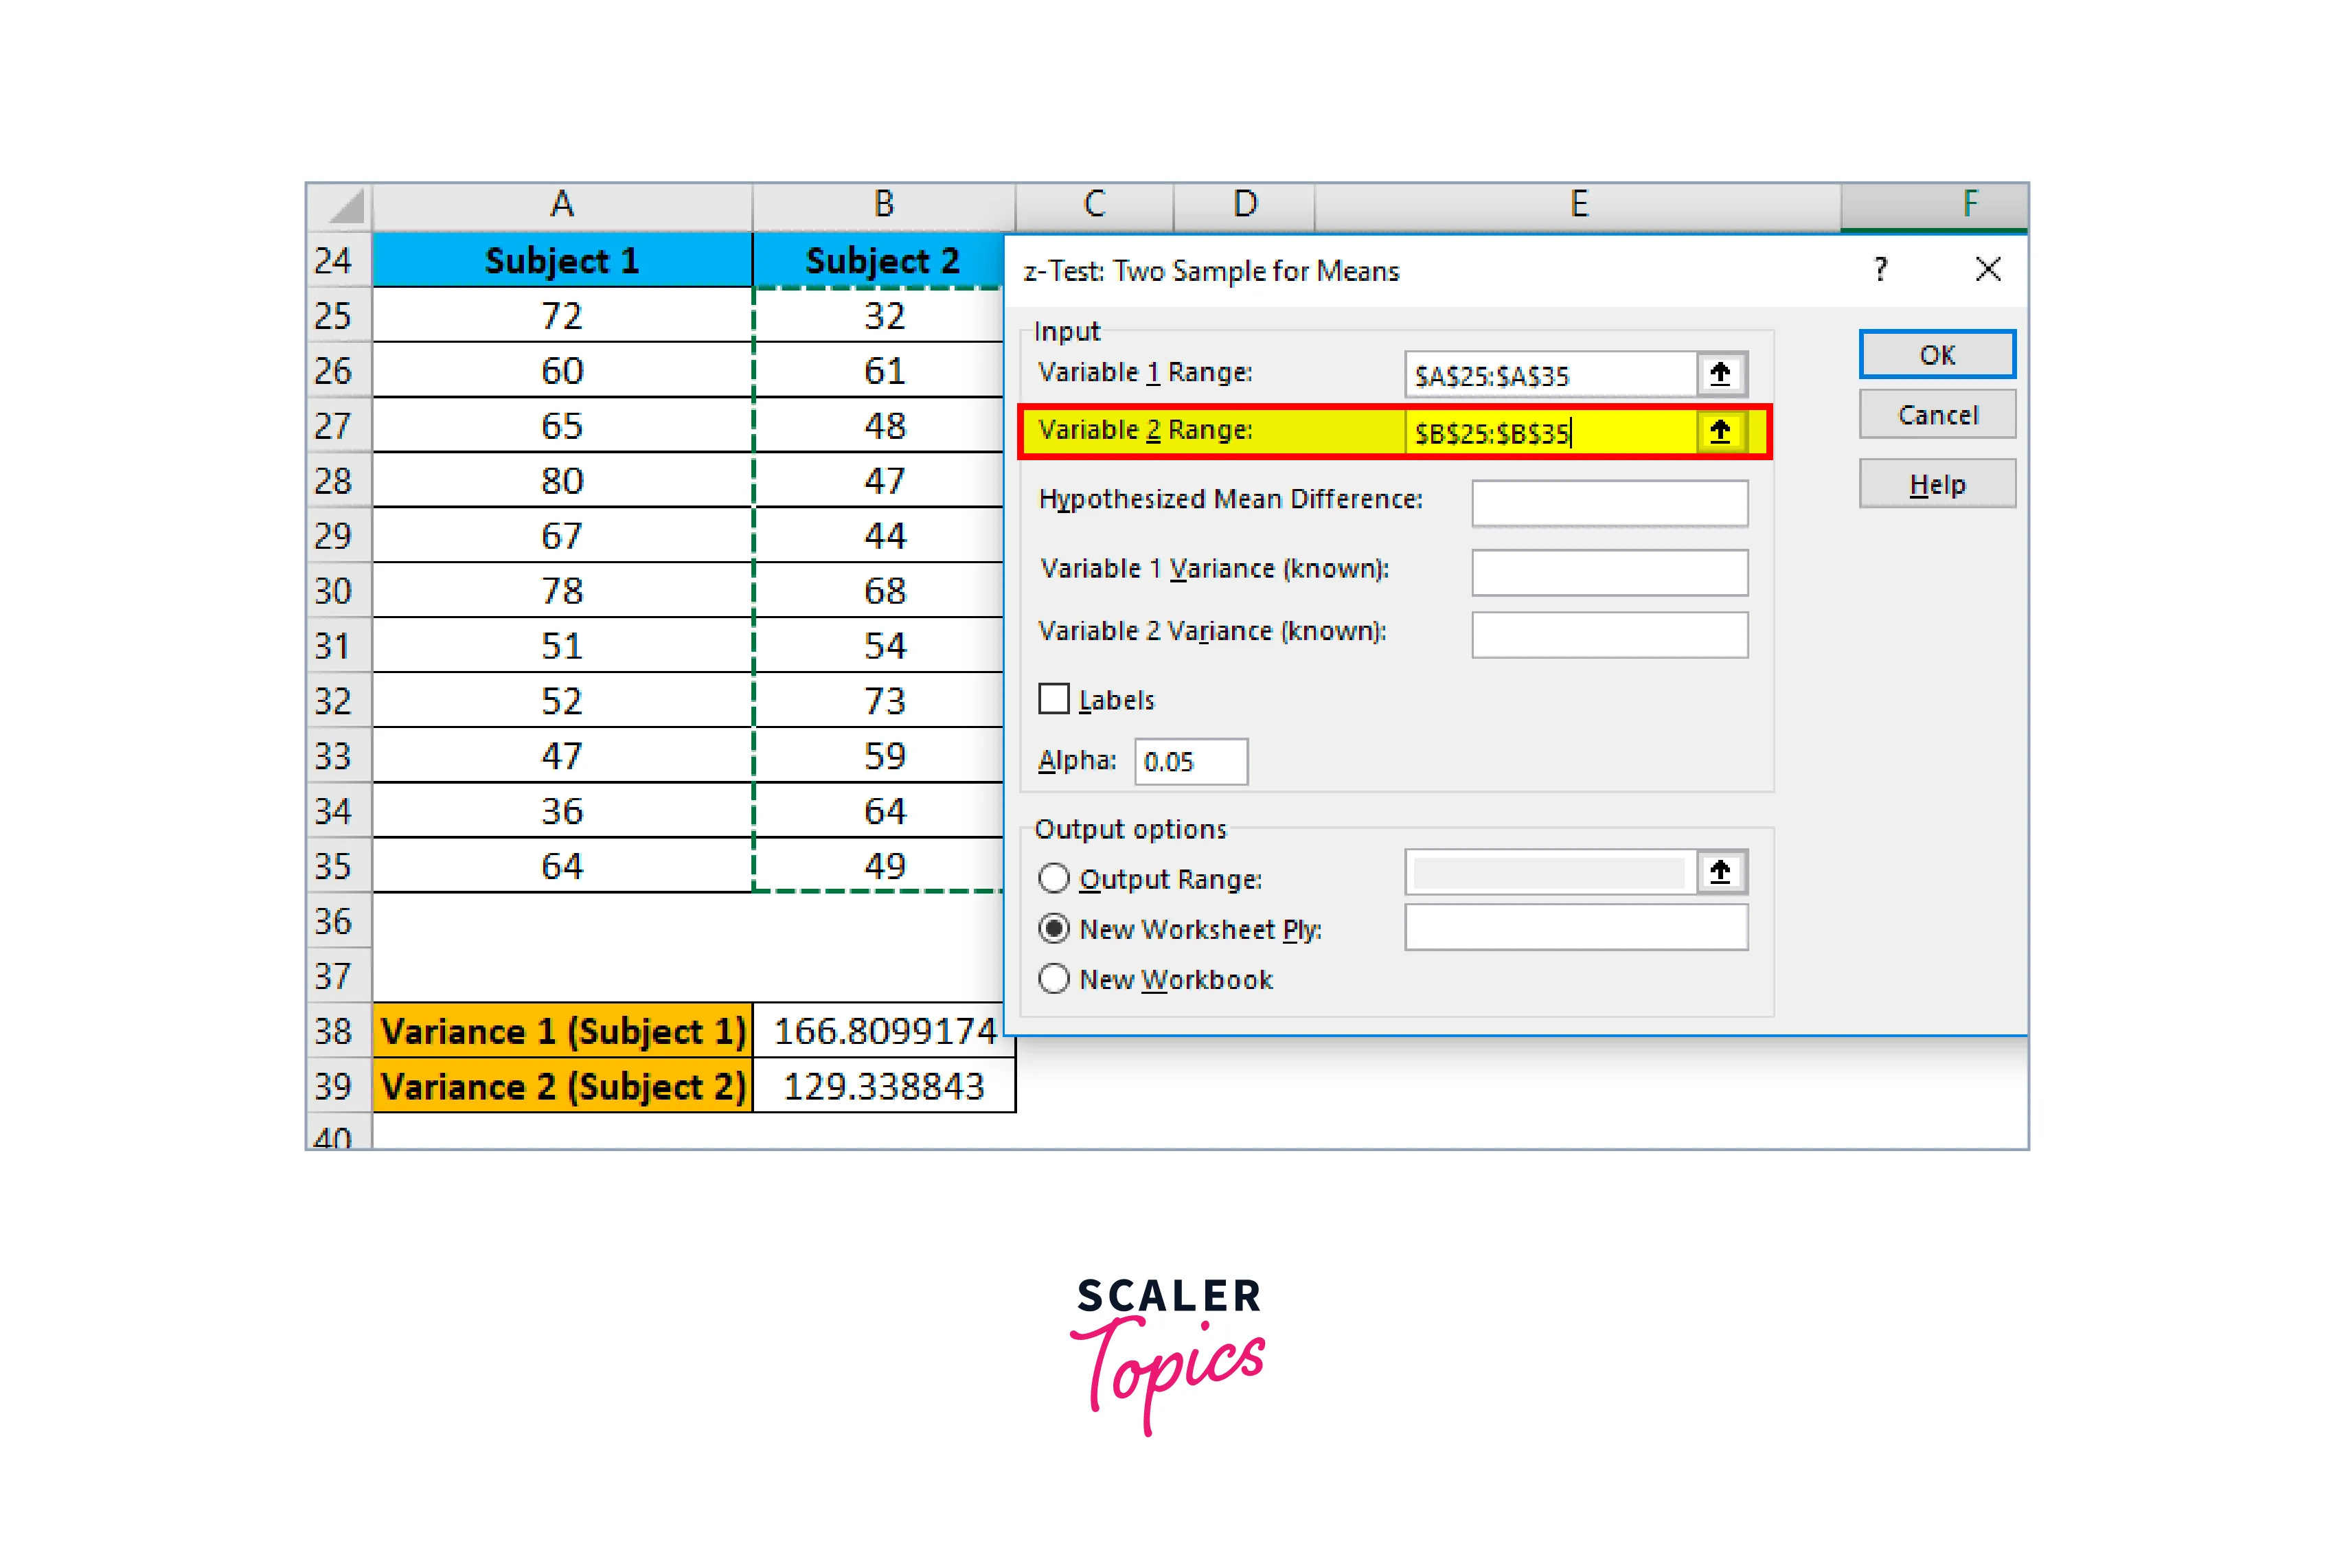
- Similarly, choose the topic 2 range (B25
) in the Variable 2 range box.
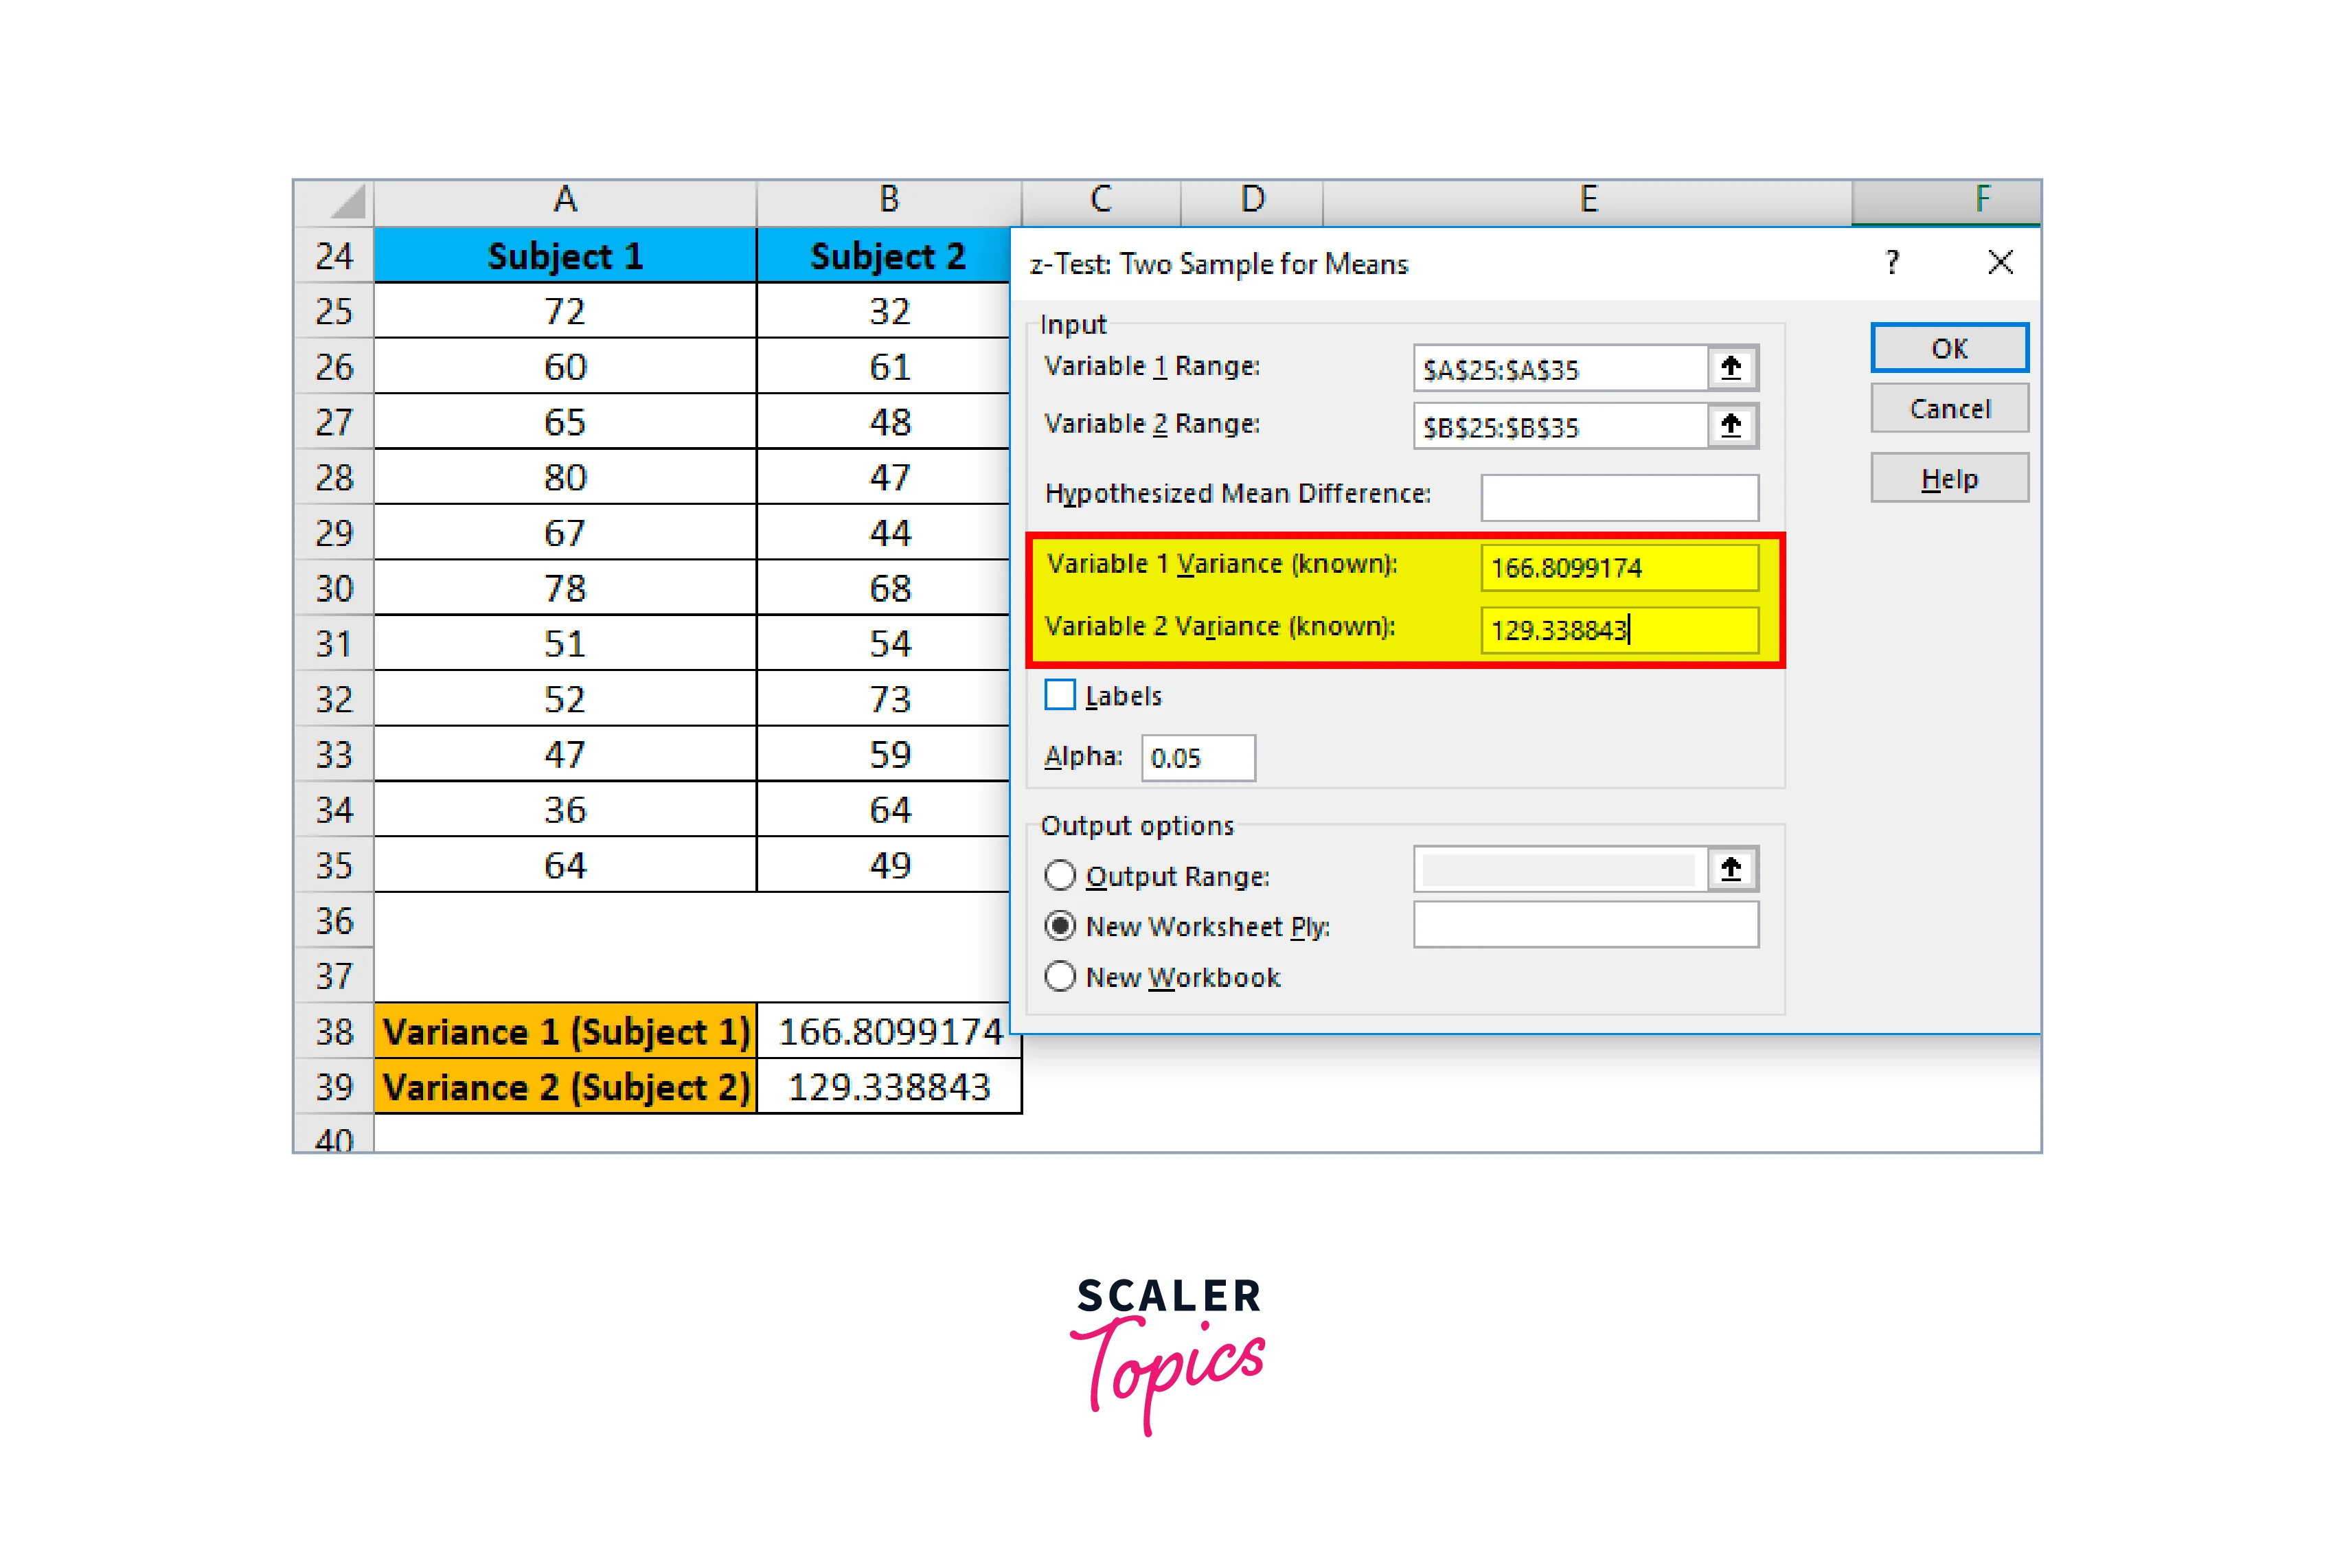
- Enter the variance value from cell B38 in the Variable 1 variance box.
- Enter the variance value for cell B39 under the Variable 2 variance box.
- Choose the cell in the output range where you wish to see the outcome. After passing cell E24 in this case, click OK.
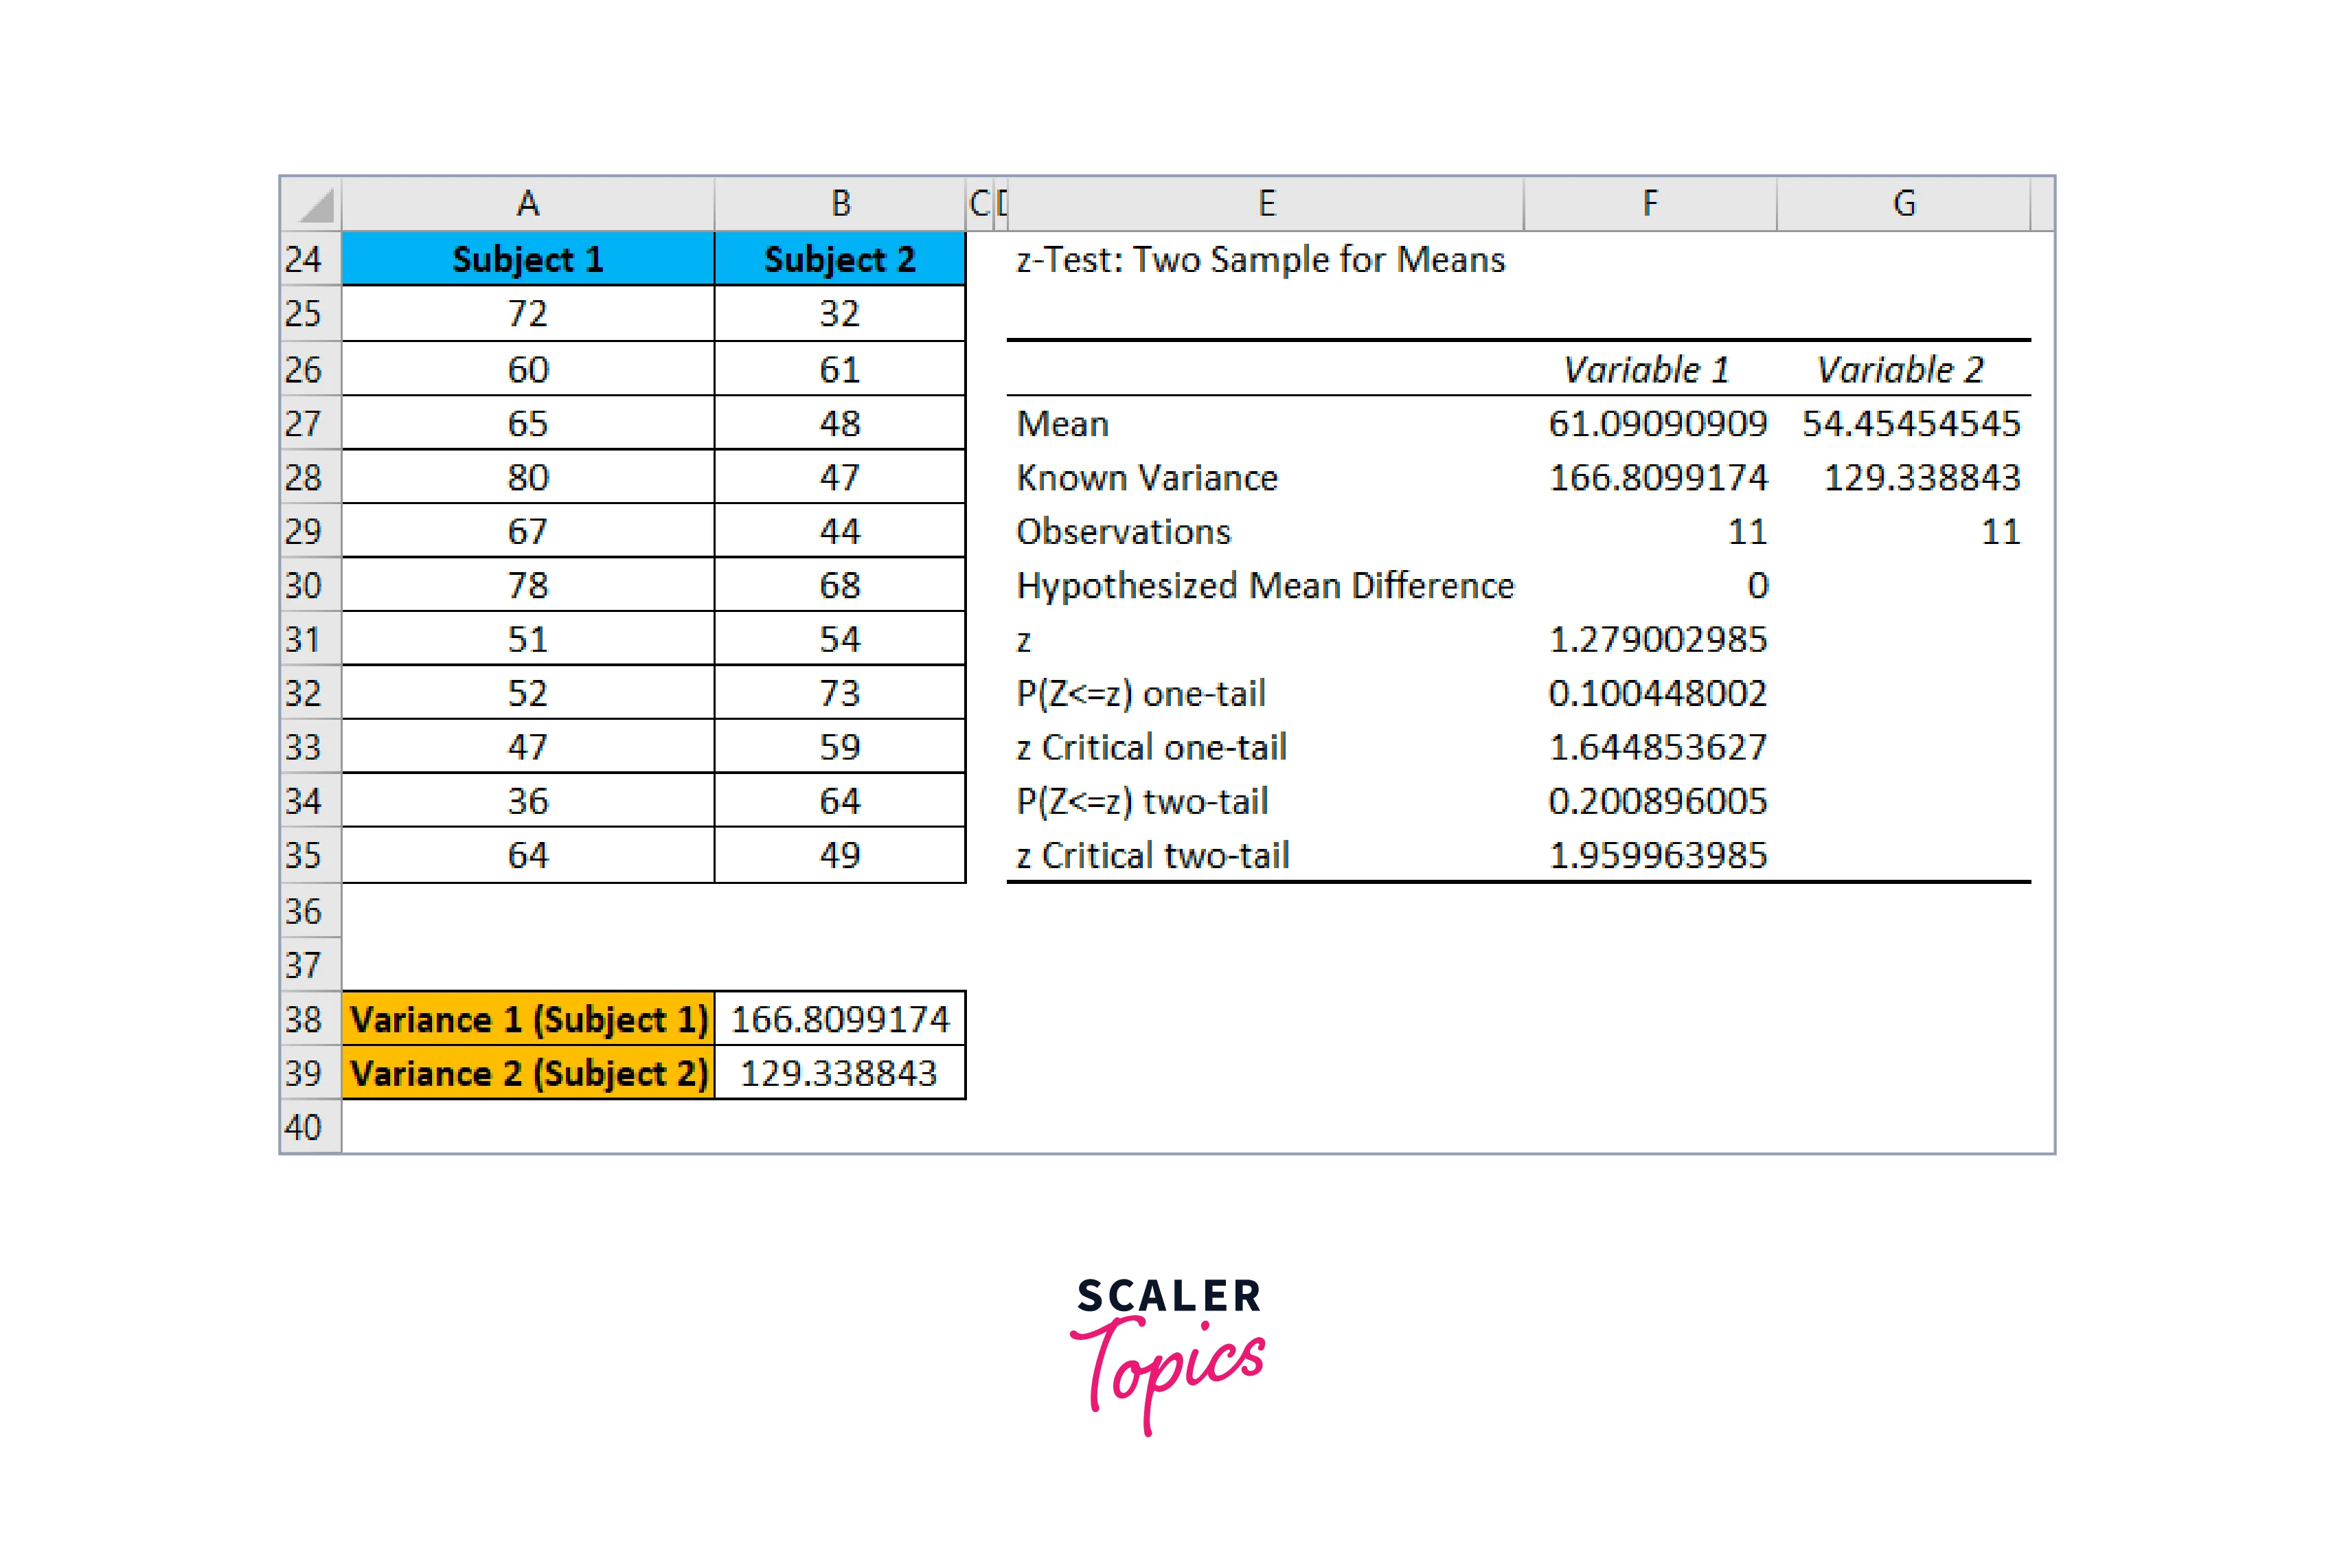
- The result is shown below:
-
We can reject the null hypothesis if z < z Critical two-tail or if z stat > z Critical two-tail. Here and , so we can't reject the null hypothesis. Consequently, there aren't many differences in the means of the two populations.
T test
The means (averages) of two samples can be compared in Excel to conclude the whole population. A t-test can determine if the difference between the two means is due to chance alone or statistical significance. When an event (result) can be linked to a particular cause rather than coincidence, it is considered statistically significant (or chance). Such outcomes are trustworthy and give rise to confidence in judgment.
Confidence Intervals
In statistics, a confidence interval describes the likelihood that a population parameter would fall between a set of values for a given percentage of the time. Analysts frequently use confidence ranges that include or of anticipated observations. So, there is a probability that the true value falls within that range if a point estimate of is produced using a statistical model with a 95% confidence interval of .
Statisticians use confidence intervals to evaluate the degree of uncertainty in a sample variable. For instance, to determine how each sample might accurately reflect the true value of the population variable, a researcher chooses many samples at random from the same population and computes a confidence interval for each sample. All of the generated datasets are unique; some intervals contain the real population parameter, while others do not.
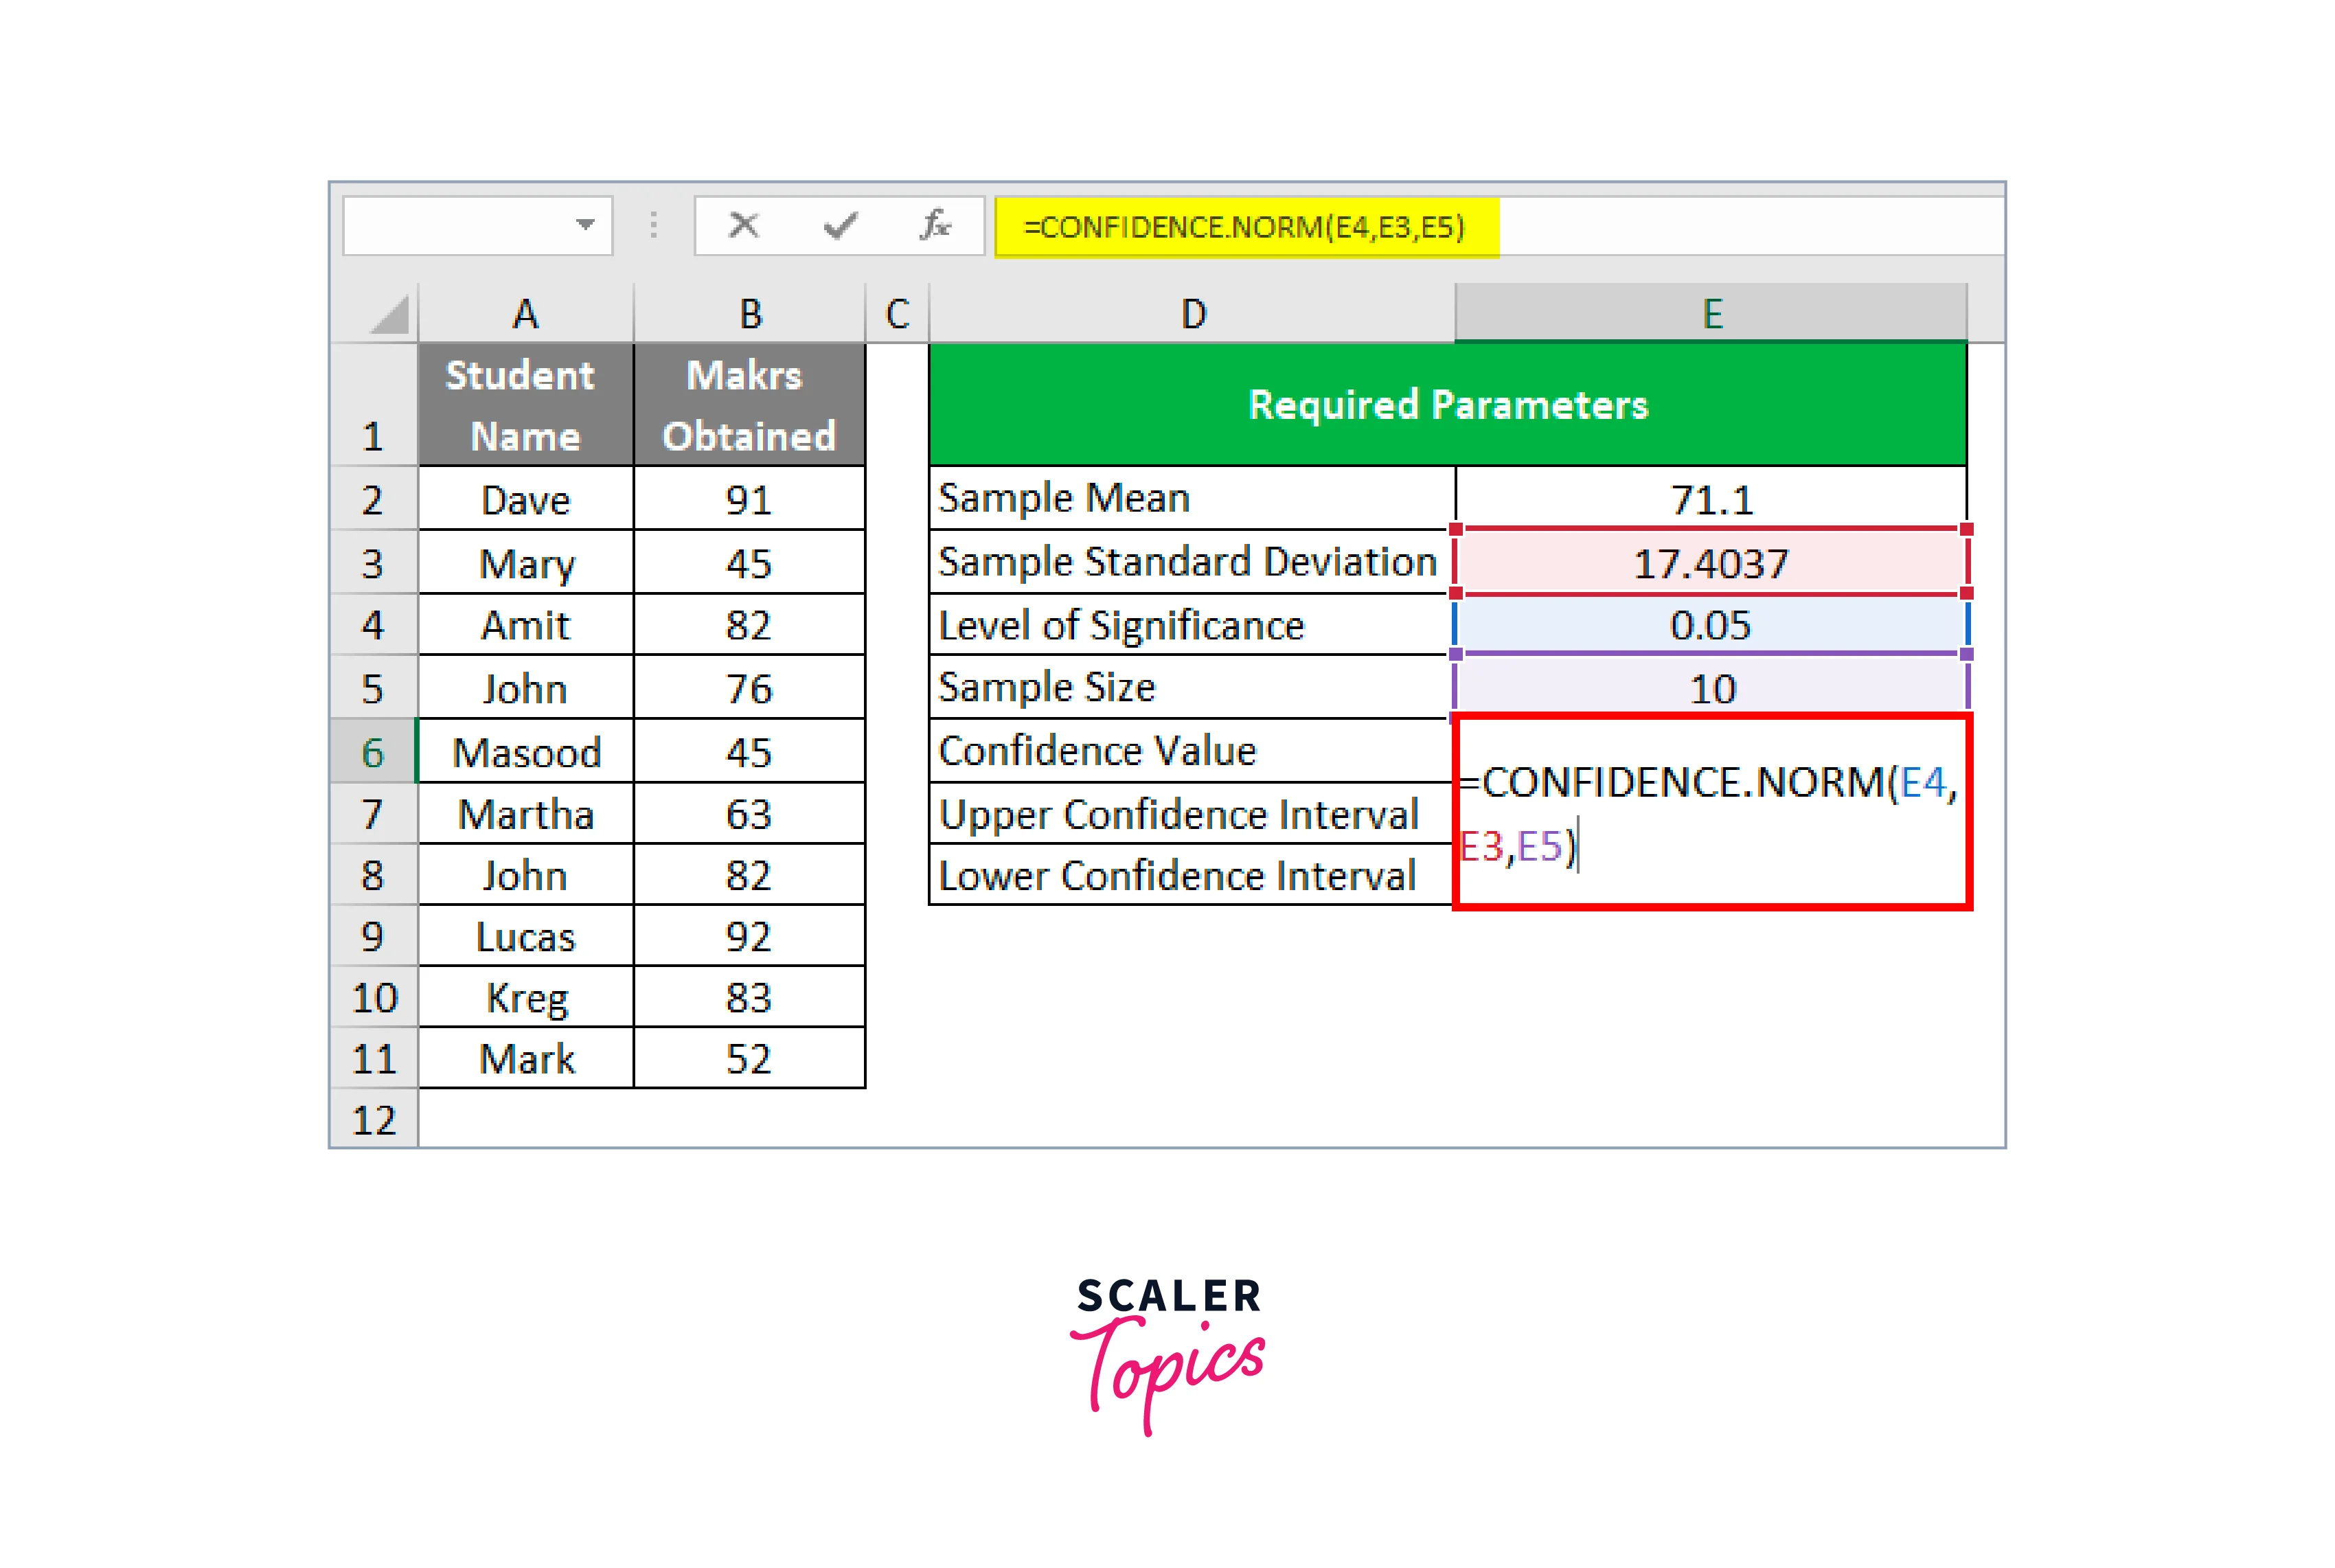
You can enter a formula to get a numerical number that you can use to create a confidence interval for the mean of a data set in Excel's confidence function. The confidence interval represents a range of data points that are centered on a sample mean. Excel provides you with a number when you use the confidence function that you may use to determine the confidence interval for the data you're analyzing.
Excel's formula for confidence intervals is written as =CONFIDENCE(alpha, standard dev,n), where n is the sample size, and alpha denotes the degree of significance, which ranges from zero to one. The function also applies the sample mean's standard deviation. Apply Excel's confidence value to the data set to obtain the confidence interval. This double-value finding illustrates how far your data may vary in either way from the mean without changing the null hypothesis.
Utilizing Excel's =CONFIDENCE() function in both of its formats, perform the following steps to determine the confidence interval: Find the sample mean. For example:
- On your spreadsheet, arrange your data in ascending order.
- Estimate the sample's mean using the =AVERAGE() method.
- Consider how your data would be organized in column A of your spreadsheet.
- The first value in your data would begin in cell A2 if you used the first row to name your columns. The final value in your set will be in cell A40 if your data has values up to row 40.
- Use cell C2 in column C to record the sample size of 38 in a different column. For each value you calculate in column C, label the appropriate cells in column B.
- To match the number in cell C2, you have the label "sample size" in cell B2. Label cell B3 as "mean" next, then in cell C3 enter the formula =AVERAGE(A2:A40). Suppose that the sample's mean value is 44.55.
-
Calculate the standard deviation
Calculate the standard deviation of your data using the =STDEV.P() method. Under your "mean," in column B, indicate another cell as the "standard deviation." After that, enter =STDEV.P(A2:A40) in cell C4 to use the standard deviation command for the example data set in column A. Assuming that given the above data set, the software outputs a standard deviation of 14.
-
Type the alpha value in
The probability value alpha calculates the statistical significance factor, which is expressed as a percentage. This shows the likelihood that the null hypothesis is false. As high degrees of confidence in data linkages are the goal of inferential statistics, the alpha value is normally between zero and one, where 0 alpha value 1.
The alpha value you obtain when estimating a rate of confidence should be used when entering the confidence function into Excel. For instance, an alpha value of would result from a confidence level in the null hypothesis. Under the standard deviation label you have in column B, add a label for the alpha value. List the relevant cell's numeric value in column C after that.
-
Enter the confidence function's value.
Use a new cell to enter the confidence formula once you have all of the formula's values. Write "confidence value" in a new cell under "alpha value" in column B, and then enter the formula corresponding to column C. Each value is listed in a separate cell, so the formula may use the cell labels. This would read =CONFIDENCE with the sample size in cell C2, the standard deviation of in cell C4, and the alpha value of in cell C5 (C2, C4, C5). A confidence value of can be obtained by typing in the numeric values, which would read as =CONFIDENCE(0.04,14,38). -
Do the confidence interval calculation
Your calculated confidence value both increases and decreases the mean to provide you a range in which your data can be distributed while still supporting the null hypothesis. The interval can be obtained by adding and subtracting using the example confidence value of . This yields a confidence range between and of and . The spreadsheet's calculation for the confidence interval is also available as.
Conclusion
The Z-Test is only appropriate for two samples when both populations' variances are known. An error occurs when using the Z Test function below:
- Error #VALUE! if x or Sigma's value is not numeric.
- If the value of the Sigma input is 0, the #NUM! The error will occur.
- #N/A error:
If the given array or dataset's values are empty. - #DIV/0! error:
This error can appear under two circumstances: - if there is only one value in the provided array.
- The passed array's standard deviation is 0, and the sigma is not provided.