Advantages and Disadvantages of Tableau
Overview
Tableau Software is one option that definitely stands out on the market among the various data visualization options. Tableau Software is one of the business intelligence sector's most rapidly expanding data visualization technologies. It enables us to readily understand the raw data set without technical expertise or coding experience. According to Gartner's 2019 Magic Quadrant for Business Intelligence and Analytics Platforms ratings, it has been regarded as a leader for seven years consecutively. In this article we will discuss about advantages and disadvantages of tableau.
Transform Your Career
Choose from our industry-leading programs designed for career success
Modern Software and AI Engineering Program
Master full-stack development with AI integration

Modern Data Science and ML with specialisation in AI
Advanced data science techniques with AI specialization
Advanced AIML with Specialisation in Agentic AI
Deep dive into AIML with focus on Agentic systems
DevOps, Cloud & AI Platform Engineering
Build and manage AI-powered cloud infrastructure
AI Engineering Advanced Certification by IIT-Roorkee
Premier AI engineering certification from IIT-Roorkee
What is Tableau?
Professionals from many different departments work with various types of data daily. These data, including numbers, statistics, and figures, can occasionally be complicated.
According to scientific research, the human brain responds to images more than numerical statistics and data. People are more apt to comprehend and recall visually appealing and simpler data, such as that presented as a pie chart or bar graphs with different colors. And Tableau comes into play here.
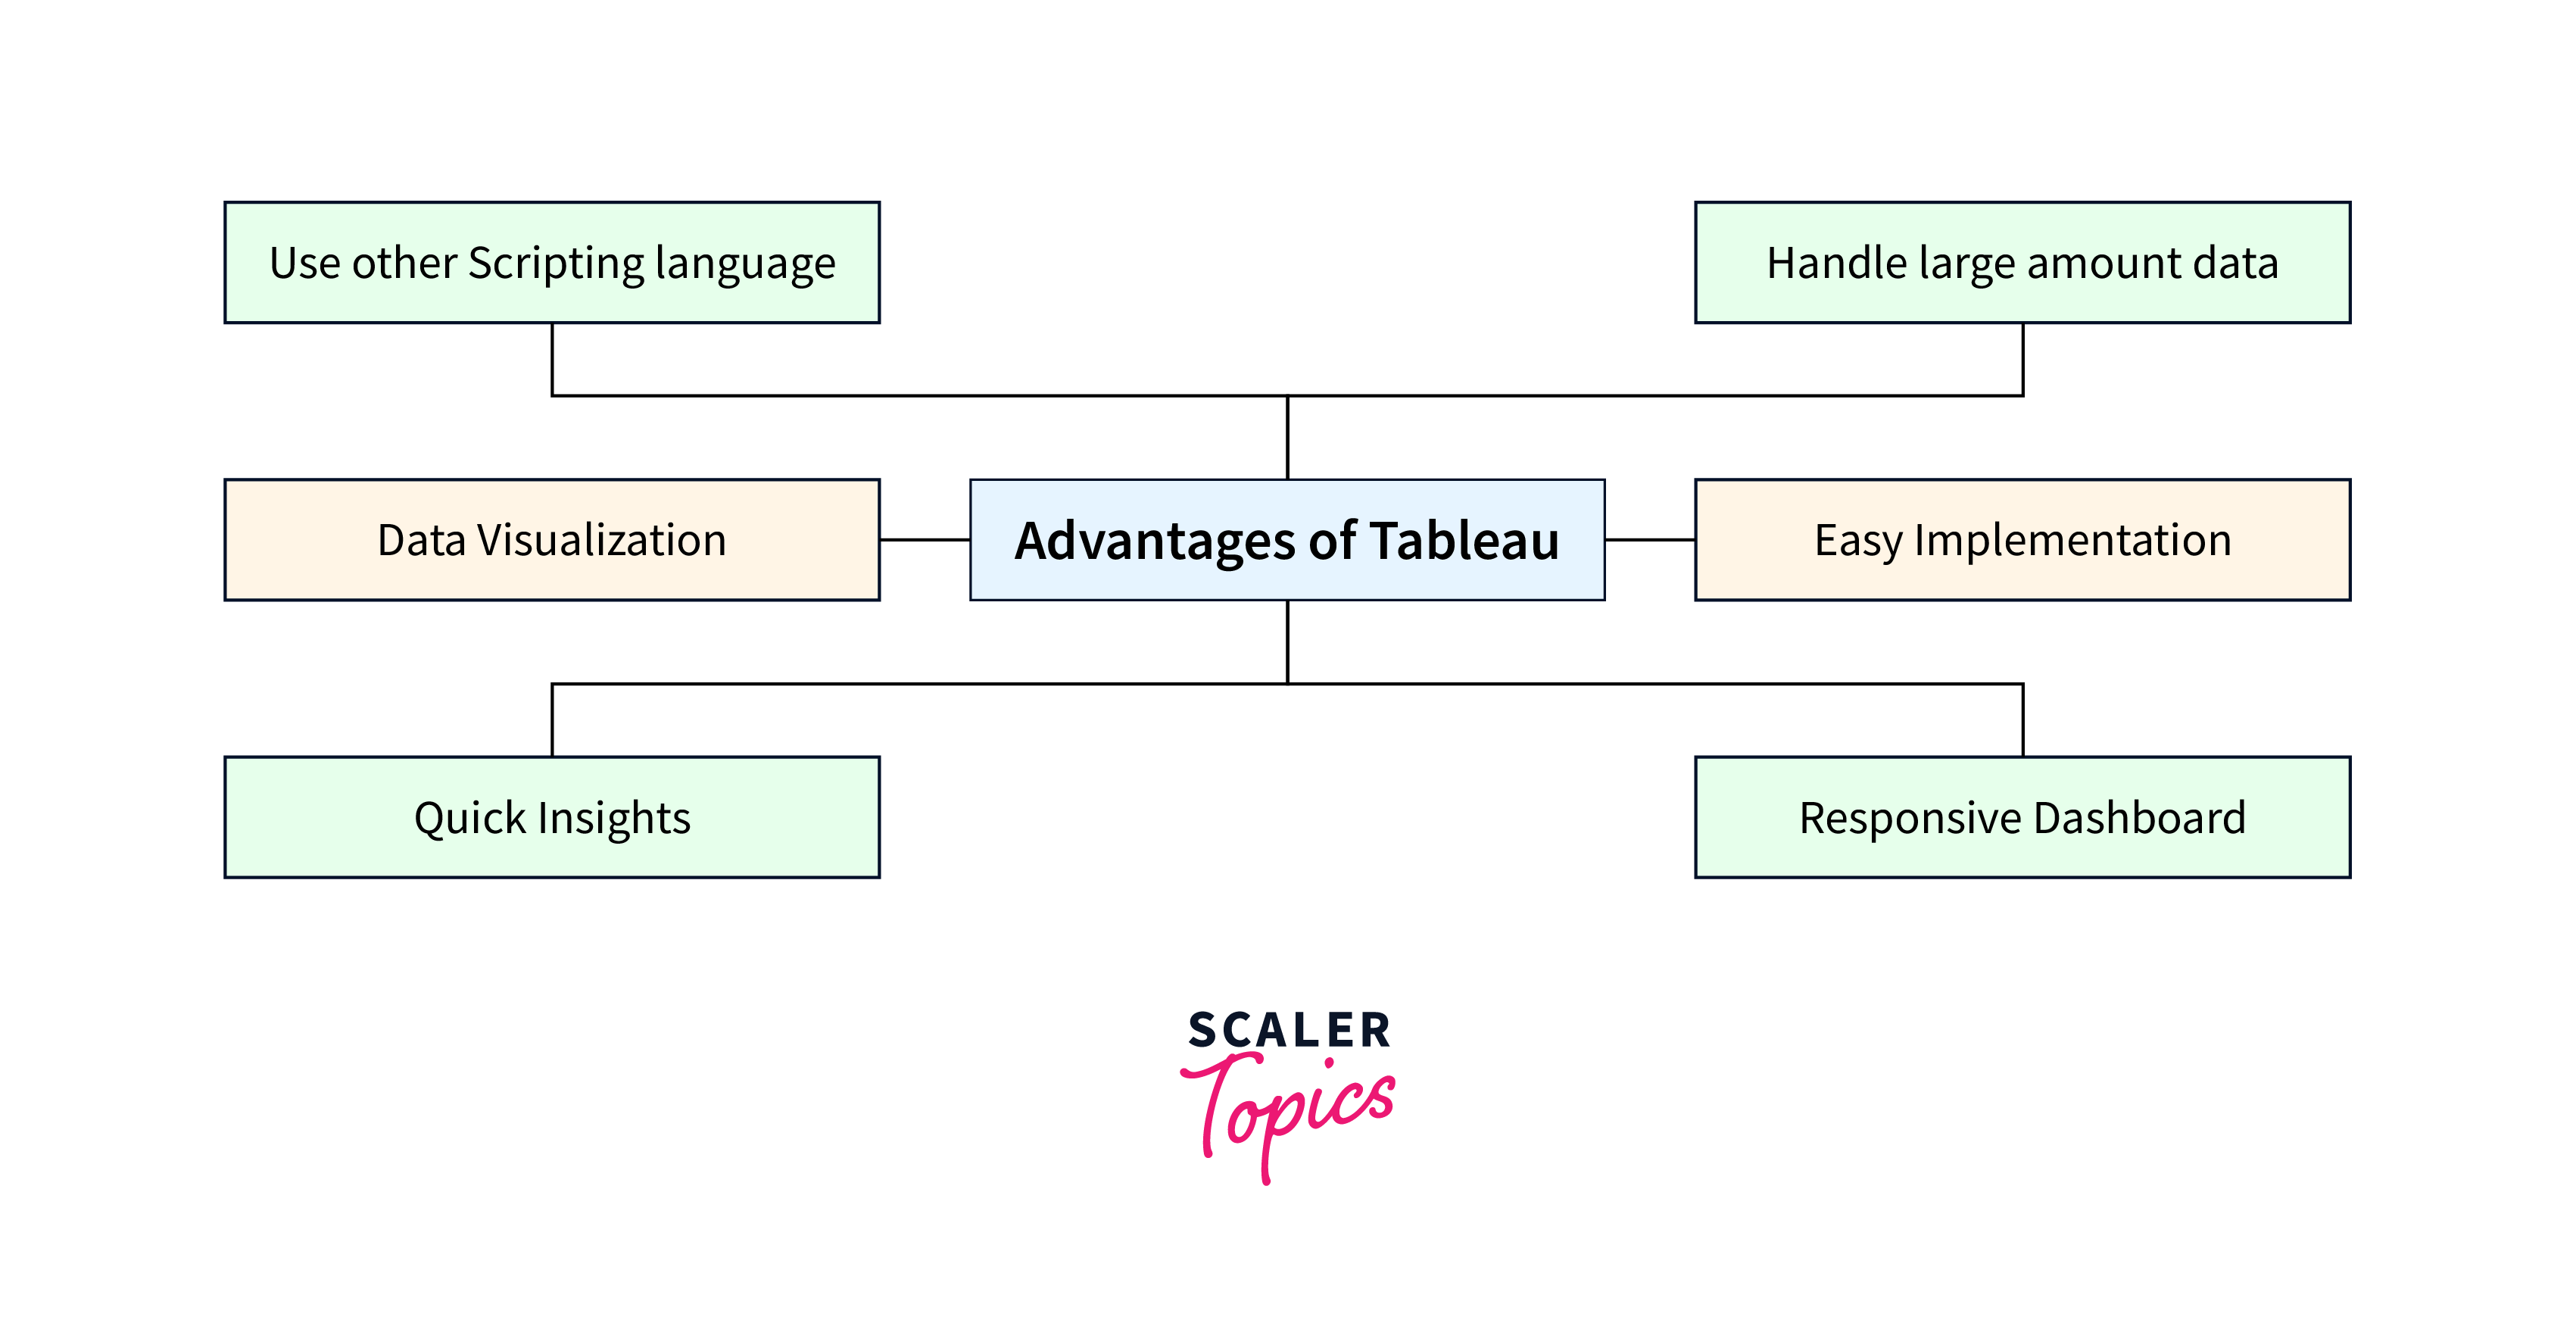
Tableau is frequently used as a data visualization tool in business intelligence and data science. It seeks to make complex data easier to perceive and comprehend.
Data is one of the most valuable assets for organizations today. Almost all firms and industries use big data analytics to make wise business decisions. After being analyzed, big data from many sources is frequently presented as statistics and numbers. This information must be presented to CEOs and stakeholders in a straightforward, visually appealing, and understandable manner.
Among Tableau's features are:
- Rapid analysis
- Data Blending
- Data Collaboration
Examples:
-
Analysis based on location A location-based analysis is an effective method for location-based data. Tableau, for instance, may be used to identify trends in your sales data by state or zip code. Based on where individuals shop, you can also visualize this data to understand what's going on at a certain store or location.
-
Combine data from many sources Tableau allows you to bring together data from several sources in one location. Your analysis can be made simpler by this potent feature, especially when combined with powerful mapping functionality.
Tableau can be used independently or together with other analytics programs like SAS or Excel. With other data sources like Microsoft Access or SQL Server databases, you may learn Tableau online.
- Displaying and visualizing data A tableau is a tool for making decisions based on data. It can also be used to visualize data by displaying it in simple charts and graphs for non-analytics or non-statistics experts. Finally, it serves as a means for conveying your analysis to others who may be working on projects that are similar to yours but have different objectives.
Let's move to advantages and disadvantages of tableau.
Advantages of Tableau
Here are few advantages of Tableau:
- Tableau is a data visualization platform: It offers sophisticated computation, data mixing, and dashboarding to create stunning data visualizations.
- Quickly Construct Interactive Visualisation: Tableau's drag-and-drop functionality allows users to construct an interactive visualization quickly. A drag-and-drop interface enables users to analyze and explore huge and complicated datasets without the need for coding or programming knowledge. Line charts, bar charts, maps, scatter plots, and many other chart kinds and visualization options are available in Tableau.
- Implementation is easy: Tableau offers a wide range of visualization options, which improves the user experience. Compared to Python, Tableau is much simpler to understand. They can also quickly learn Tableau even if they have no experience with coding.
- Tableau Can handle Large Amounts of Data: Tableau can easily manage data sets with millions of rows. Different visualization styles can be produced from large data without impairing the dashboards' performance. Additionally, Tableau has a feature allowing users to 'live' connect to various data sources, including SQL. To improve the performance of dashboard, Reduce the number of fields and Switch to extract connection from the live connection as live connections can be resource-intensive.
- Tableau can use various scripting languages: Users can incorporate Python or R to get around performance problems and do complicated table calculations in Tableau. Using packages to do data purification activities, a user can reduce the strain on the software using Python script. However, Tableau does not accept Python as a native scripting language. Consequently, you can import a few of the packages or visuals.
- Tableau Dashboard features: A great monitoring function that enables you to customize the dashboard specifically for devices like mobile or laptops. It also has a responsive dashboard that is mobile-friendly. Tableau makes modifications to ensure that an accurate report is sent to the appropriate device based on the device the user is using to view the report.
Scaler Placement Report and Statistics
Scaler learners achieved 2.5x salary growth with average post-Scaler CTC reaching ₹23L.
Disadvantages of Tableau

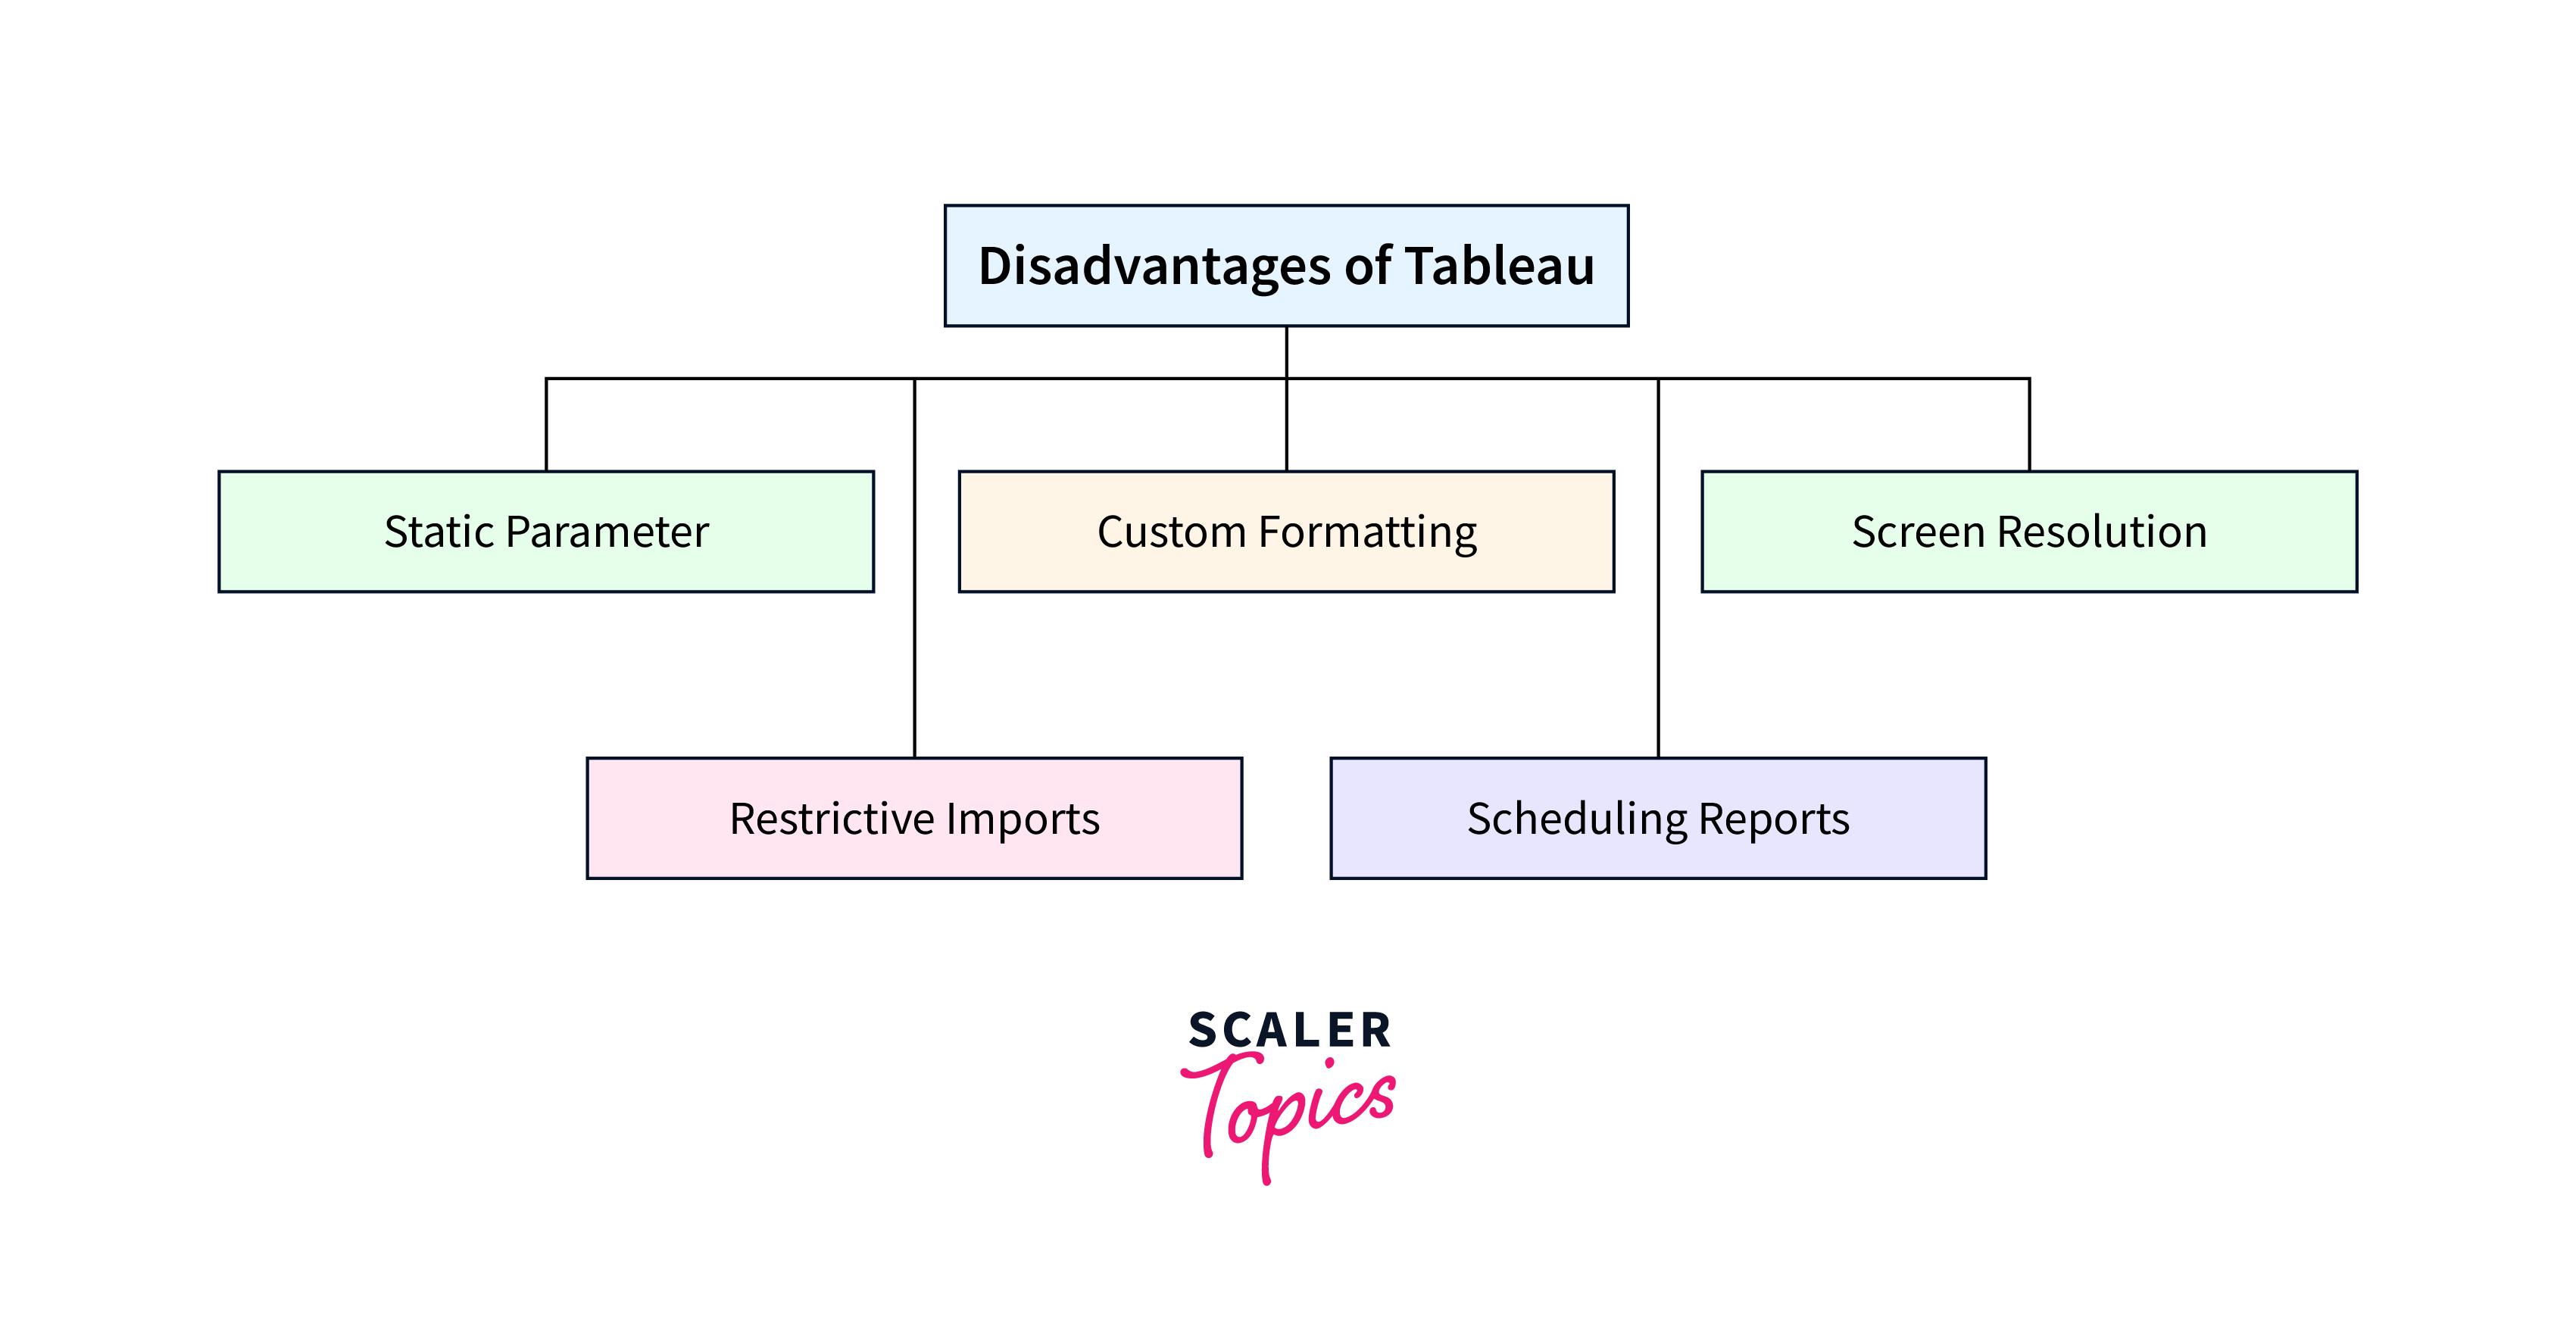
Here are few disadvantages of Tableau:
- Report scheduling: Tableau does not offer automatic report scheduling. Because of this, updating the data in the back end requires some manual work from the user.
- No Custom Visual Imports: In contrast to other tools like Power BI, Tableau does not provide the creation of custom visuals that can be quickly imported. As a result, any new visuals can be created before being imported.
- Custom formatting in Tableau: Tableau's conditional formatting and 16-column table could be easier for users. The user can also not directly adopt the same format across all fields, making it impossible. Users must perform that manually for each, which takes time.
- Tableau's parameters: These static and always choose a single value, making them single-value parameters. These parameters must also be manually updated each time the data is altered. Users need to be able to automate parameter updating.
- Tableau dashboards' screen resolution: The dashboard layout is dispersed if the user's screen resolution differs from the Tableau developer's screen resolution. Example: If a dashboard is designed for a 1920 x 1080 screen resolution and is seen at 2560 x 1440, the layout will be slightly distorted, and the dashboard will not respond. As a result, a dashboard must be designed differently for desktop and mobile.
Conclusion
- According to Gartner's Magic Quadrant, Tableau is an analytics and business intelligence leader. Tableau is a popular data visualization application for corporate intelligence and data analysis.
- Using Tableau to generate dashboards, even non-technical people can quickly produce dynamic, real-time graphics. With just a few clicks, they may integrate data sources, apply filters, and drill down into certain pieces of information.
- Tableau assists many organizations by enabling them to access and record attractive dashboards, charts, and other visuals based on the various domains they are dealing with.
- Tableau includes more than 24 different graphical views to exhibit data, making it a very powerful tool for graphical representation.
- Despite the complexity or size of the dataset, tableau allows us to quickly and easily construct dashboards.
I hope this article helped you understand advantages and disadvantages of tableau.