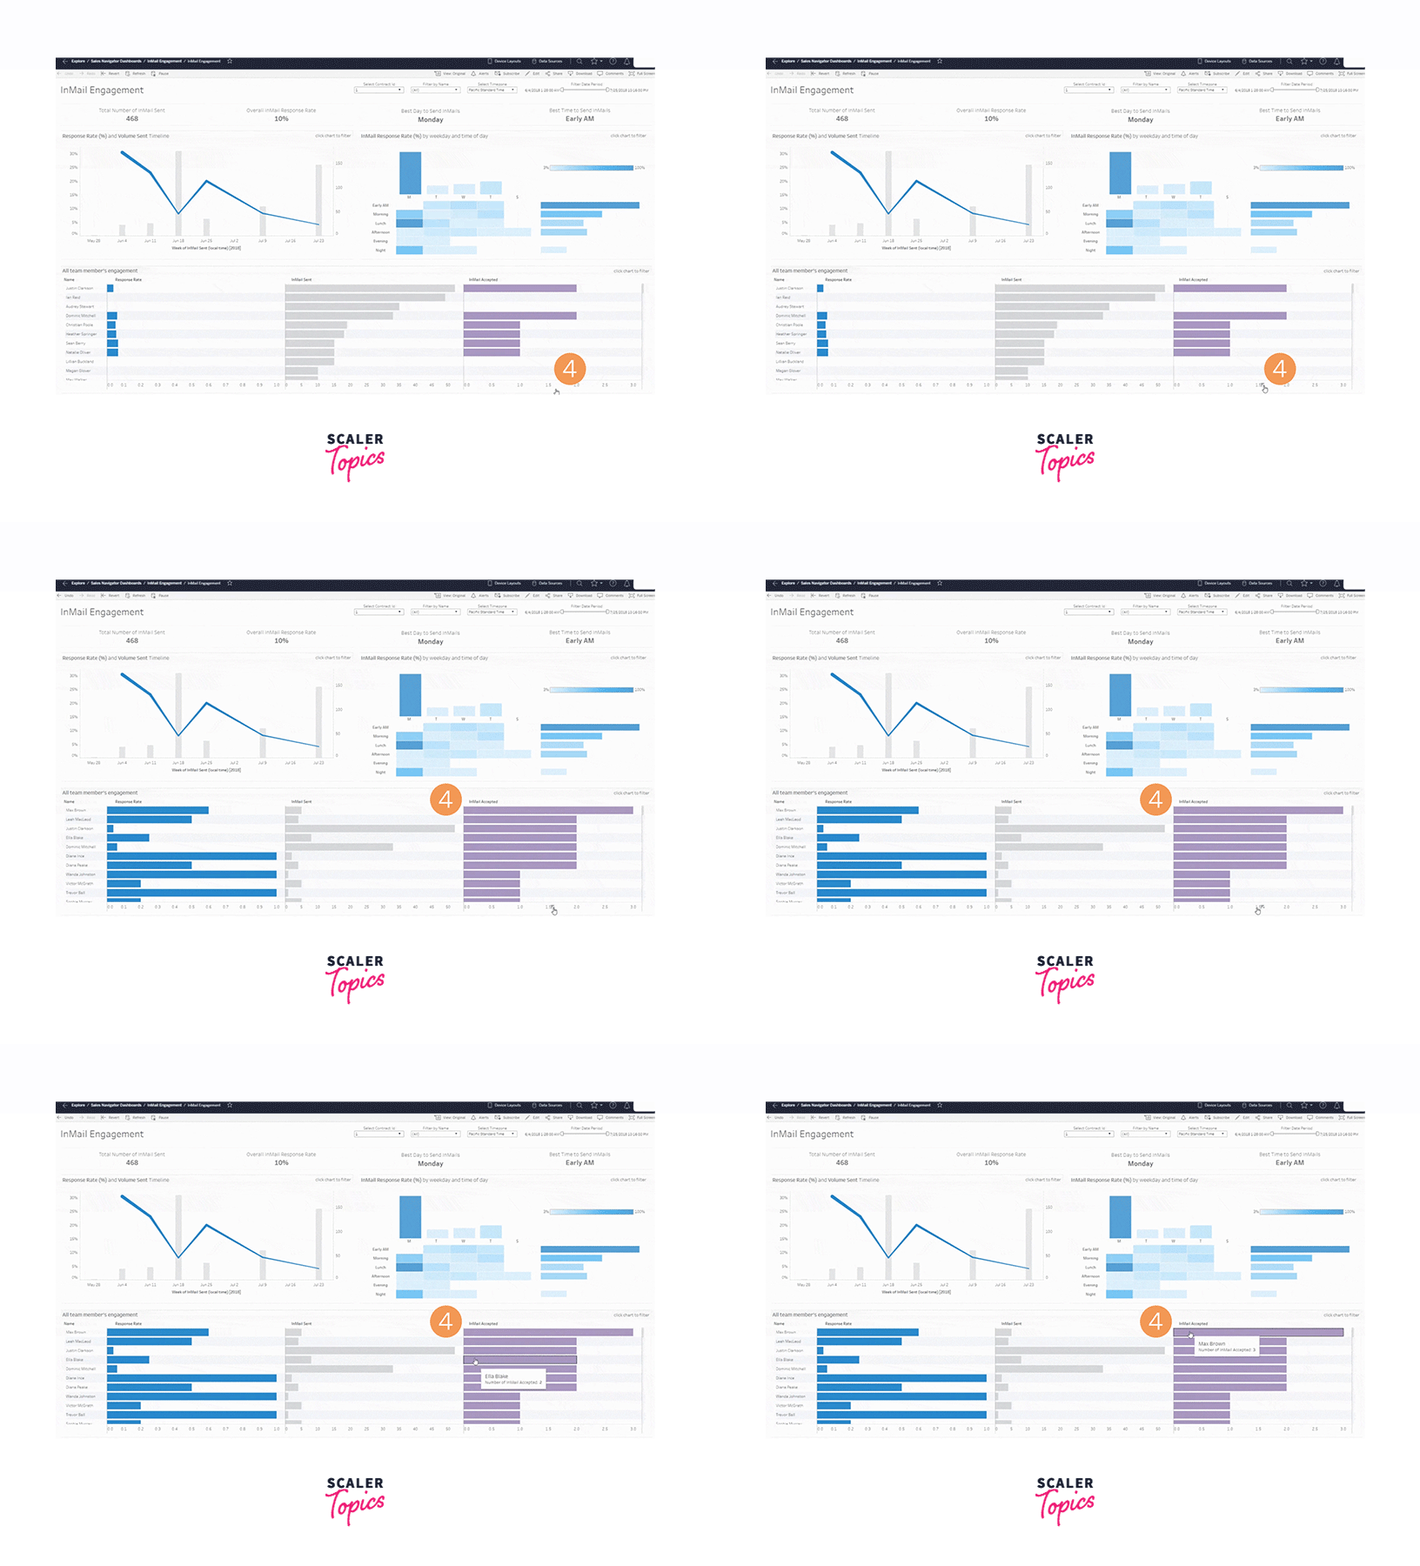
Sales Dashboard in Tableau
Overview
A Sales Dashboard in Tableau is a powerful data visualization tool that provides a concise overview of sales performance. It consolidates sales data from various sources into interactive charts, graphs, and tables, allowing users to analyze key metrics such as revenue, profit margins, and sales trends. With its user-friendly interface and real-time data updates, Tableau's Sales Dashboard empowers businesses to make data-driven decisions, track their goals, identify opportunities, and address challenges swiftly. This dynamic tool enhances sales teams' ability to monitor their progress, optimize strategies, and ultimately improve their bottom line.
What are we building?
A Sales Dashboard in Tableau is a dynamic data visualization tool that provides a comprehensive snapshot of an organization's sales performance. Through interactive charts, graphs, and reports, it offers real-time insights into critical metrics like revenue, sales growth, and customer trends. With its intuitive interface, users can effortlessly navigate through data, identify patterns, and make informed decisions to boost sales strategies. Tableau's Sales Dashboard not only streamlines data analysis but also helps businesses monitor their goals, detect opportunities, and address challenges, facilitating more effective sales management and driving revenue growth.
Description of problem statement
Sales Dashboards in Tableau are pivotal in empowering businesses to efficiently monitor and enhance their sales performance. These dashboards boast a range of essential features, including real-time data updates, customizable visualizations, and drill-down capabilities. They are indispensable for organizations seeking to track revenue, analyze sales trends, and identify growth opportunities. With the ability to centralize and visualize complex sales data, Tableau Sales Dashboards streamline decision-making, improve collaboration among sales teams, and enable businesses to respond swiftly to market changes. In today's data-driven landscape, Sales Dashboards in Tableau are not just a convenience; they are a necessity for driving sales success and achieving sustainable growth
Pre-requisites
Before creating a Sales Dashboard in Tableau, there are several prerequisites to consider to ensure a successful implementation:
- Data Source: Ensure you have access to a reliable and well-structured data source that contains your sales data. This source could be a database, spreadsheet, CRM system, or any other data repository that holds relevant sales information.
- Data Cleaning and Preparation: Data quality is crucial. Clean and prepare your sales data by addressing issues such as missing values, duplicates, and inconsistencies. Ensure that data fields are correctly formatted for analysis.
- Tableau Software: Install Tableau Desktop, which is the authoring and development tool for creating dashboards. Depending on your organization's needs, you may also require Tableau Server or Tableau Online for sharing and collaborating on dashboards.
- Data Connection: Establish a connection between Tableau and your data source. Tableau supports a wide range of data connectors, so ensure you choose the appropriate one for your data source.
- Data Schema Understanding: Have a clear understanding of your data schema, including the tables, fields, and relationships within your sales data. This knowledge is essential for creating meaningful visualizations.
- Key Metrics Identification: Determine the key sales metrics and KPIs (Key Performance Indicators) that you want to track on your dashboard. Common metrics include revenue, profit margins, sales growth, and customer acquisition.
- Dashboard Objectives: Clearly define the objectives of your Sales Dashboard. Understand what insights or decisions you intend to derive from the dashboard, as this will guide the design and layout.
- User Requirements: Identify the end-users of the dashboard and gather their requirements and preferences. Consider what information and visualizations will be most useful for them.
- Design Plan: Create a design plan or wireframe for your dashboard. Decide on the layout, the placement of charts, filters, and interactivity elements. Ensure that the dashboard design aligns with your objectives and user requirements.
- Security and Permissions: If you plan to share the dashboard with a team or organization, set up appropriate security and permissions to control who can access and edit the dashboard.
- Training and Skillset: Ensure that the individuals responsible for creating and maintaining the dashboard have the necessary Tableau skills and knowledge of data visualization best practices.
- Regular Data Updates: Establish a process for regular data updates, as dashboards are most valuable when they reflect current sales information.
By addressing these prerequisites, you'll be better prepared to create a Sales Dashboard in Tableau that effectively meets your business goals and provides actionable insights for improving sales performance.
How are we going to build this?
- Data Gathering and Preparation:
- Collect and organize your sales data from various sources into a structured format.
- Clean and preprocess the data, addressing issues like missing values, duplicates, and inconsistencies.
- Ensure that the data is suitable for analysis in Tableau.
- Data Connection:
- Establish a connection between Tableau and your prepared data source.
- Configure data source settings and establish data relationships if working with multiple data tables.
- Data Exploration and Analysis:
- Use Tableau's drag-and-drop interface to explore your data visually.
- Create calculated fields and aggregations to derive relevant metrics.
- Identify key sales KPIs and metrics that you want to include in your dashboard.
- Dashboard Design:
- Plan the layout and design of your Sales Dashboard.
- Add sheets (visualizations) to the dashboard canvas.
- Customize the appearance, including colors, fonts, and labels.
- Include interactive elements like filters, parameters, and actions for user interactivity.
- Visualization Creation:
- Create various visualizations such as bar charts, line charts, pie charts, and maps to represent sales data.
- Use appropriate chart types based on the nature of the data and the insights you want to convey.
- Ensure that visualizations are clear, concise, and informative.
- Interactivity and Navigation:
- Implement interactive features like filters and highlight actions to enable users to explore the data.
- Add tooltips and actions to provide context and allow users to drill down into specific data points.
- Performance Optimization:
- Optimize the dashboard's performance by aggregating data at the appropriate level.
- Limit the use of live connections if working with large datasets.
- Use data extracts to improve query performance.
- Testing and Validation:
- Thoroughly test the dashboard to ensure that all visualizations and interactivity features work as intended.
- Verify that the calculated metrics align with your business requirements.
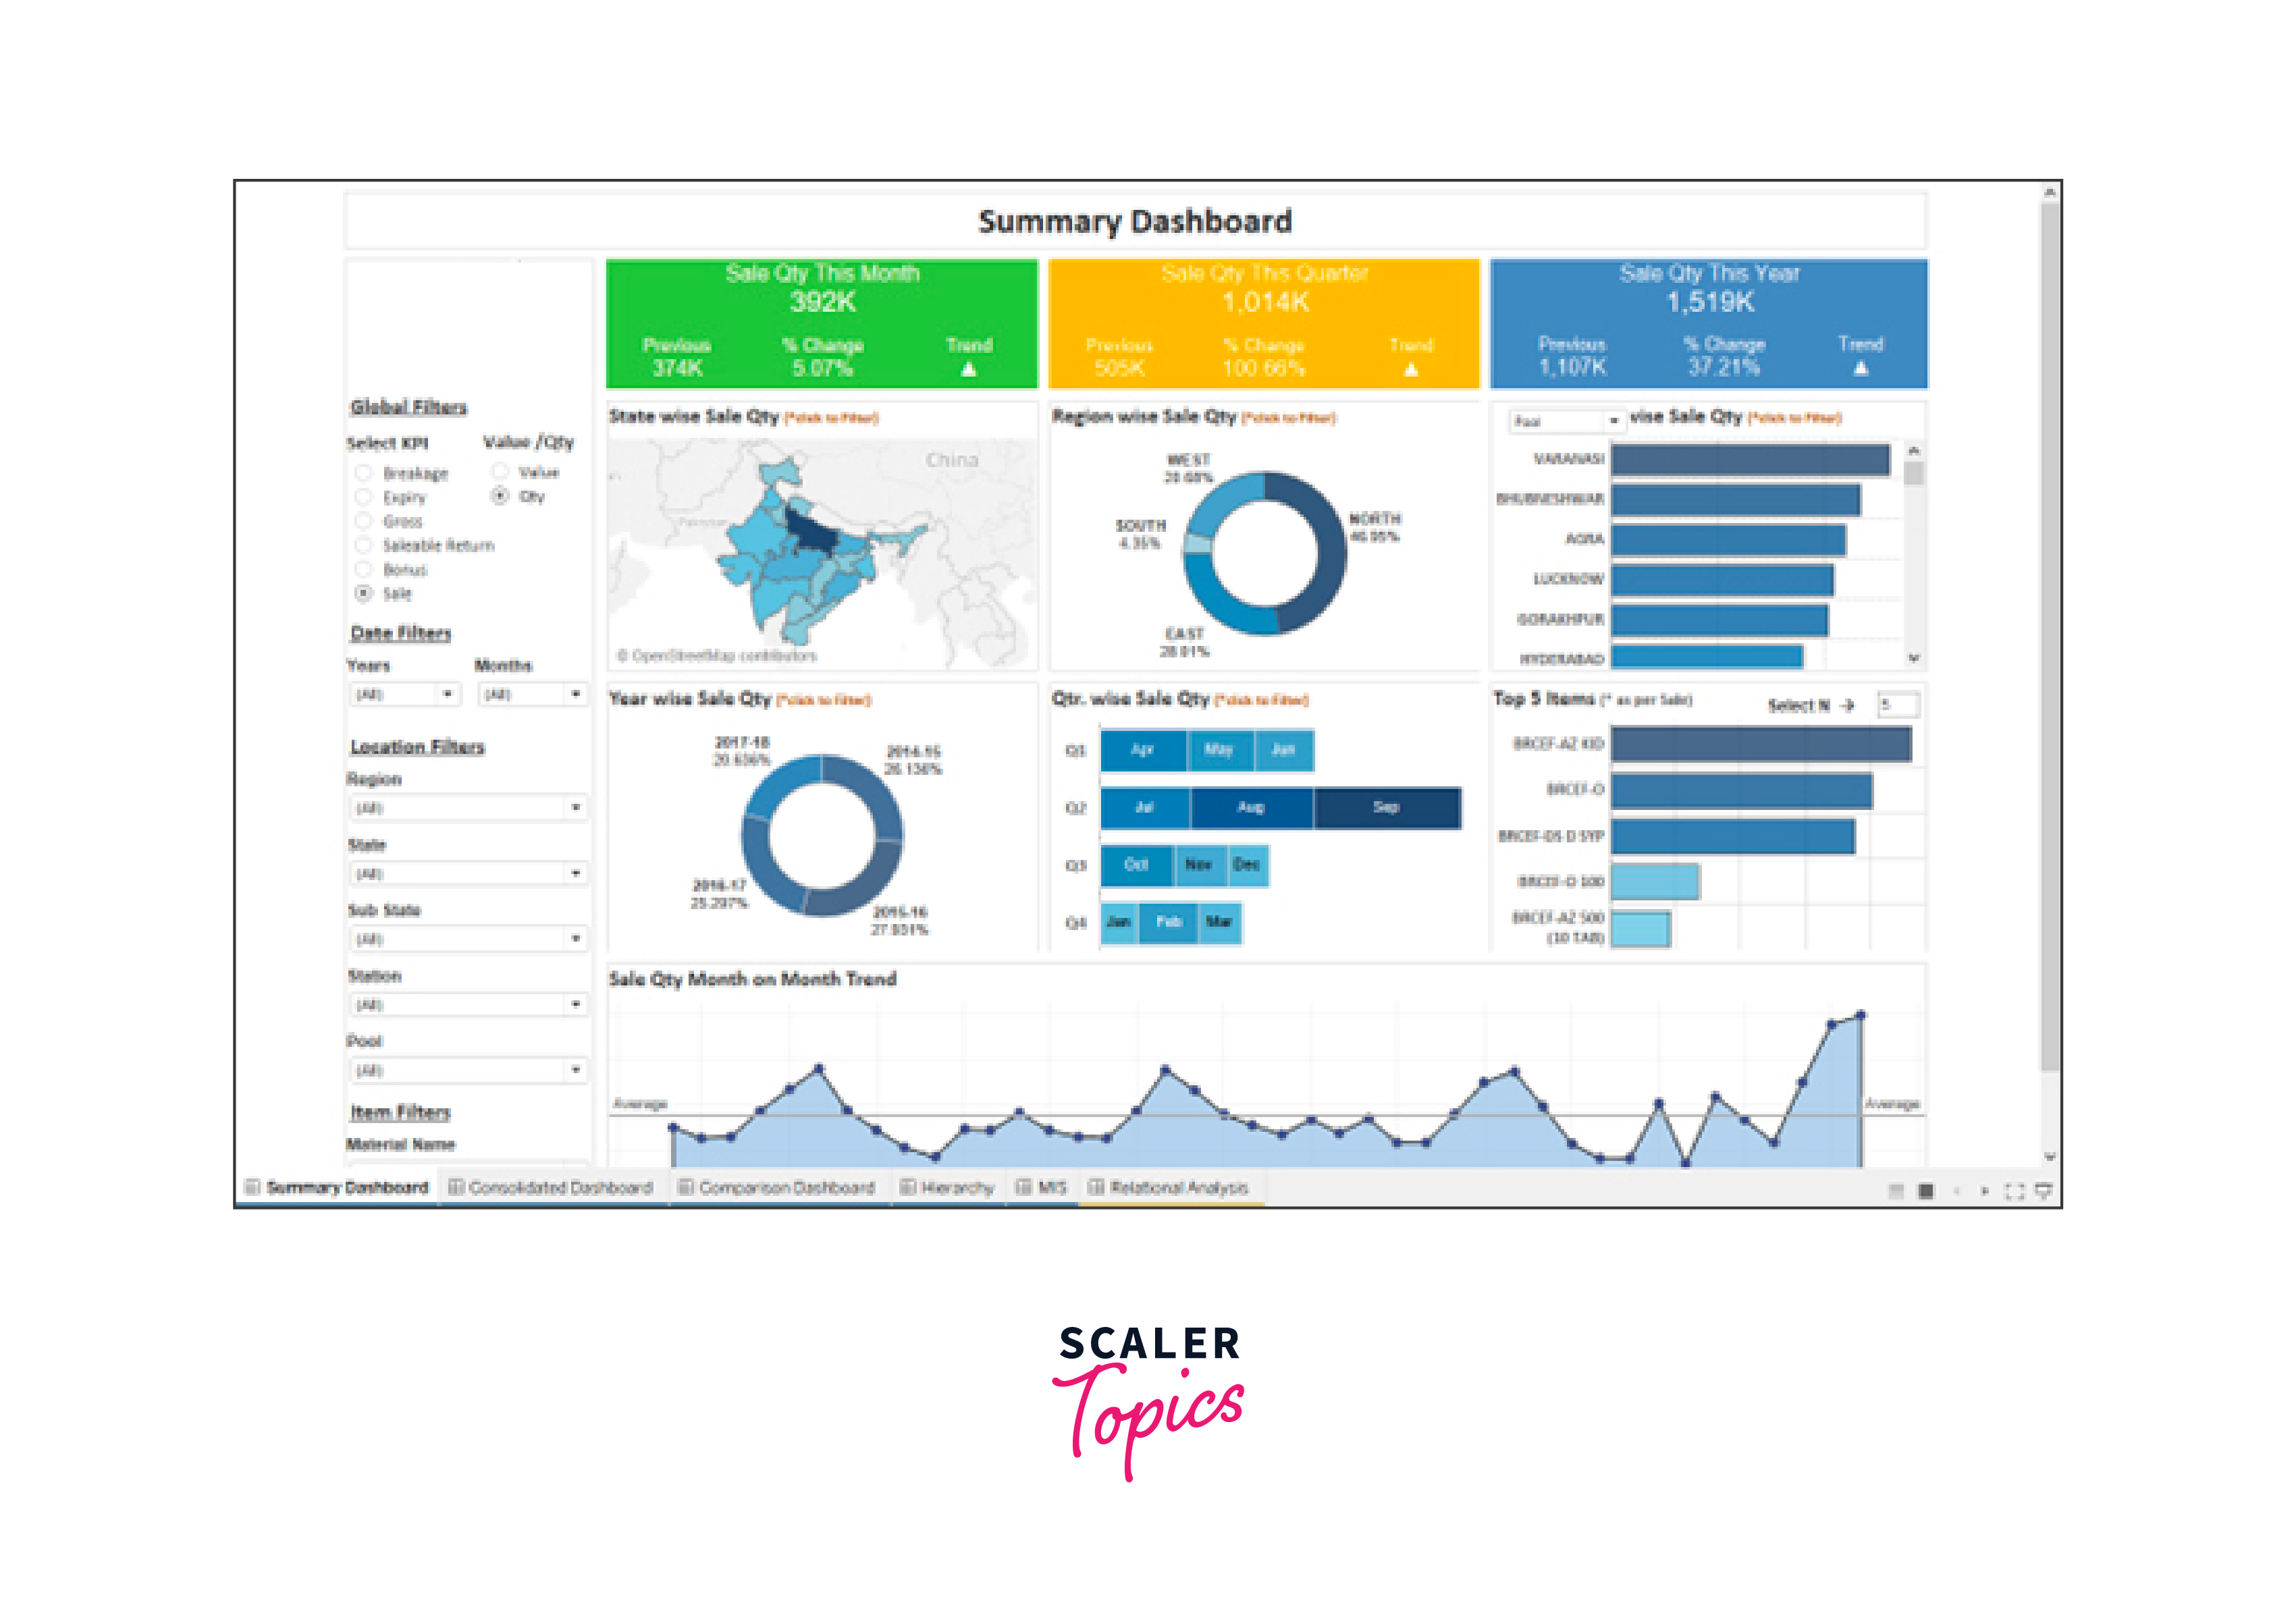
Final Output
Requirements
There are some prerequisites and requirements you should consider:
- Tableau Software: You need Tableau Desktop, which is the primary tool for creating and designing dashboards. Depending on your organization's needs, you might also require Tableau Server or Tableau Online for sharing and collaboration.
- Data Source: Access to a reliable data source that contains your sales data, which could be a database, spreadsheet, CRM system, or other data repository.
- Cleaned and Prepared Data: Ensure that your sales data is cleaned and prepared for analysis within Tableau. This includes addressing missing values, duplicates, and data quality issues.
- Data Connection: Establish a connection between Tableau and your data source. Tableau supports various data connectors, so ensure you have the appropriate one for your data.
- Hardware Requirements: Ensure that the computer running Tableau Desktop meets the hardware requirements specified by Tableau. This includes considerations for processor, memory (RAM), and disk space.
- User Requirements: Gather user requirements and understand the specific metrics, KPIs, and data visualizations needed for your Sales Dashboard.
- Design Plan: Create a design plan or wireframe for your dashboard to outline its layout, visualizations, and interactivity.
- Access and Permissions: Define access levels and permissions for users who will interact with the dashboard, especially if you are using Tableau Server or Tableau Online.
- Documentation: Develop documentation for the dashboard, including explanations of metrics, filters, and how to use the dashboard effectively.
- Training: Provide training to end-users on how to navigate and utilize the Sales Dashboard effectively.
- Regular Data Updates: Establish a process for regular data updates to keep the dashboard current.
- Optional: Data Extracts and Data Blending: Depending on your data source and performance requirements, you might consider using Tableau data extracts or data blending techniques to optimize data retrieval and analysis.
- Optional: Tableau Extensions: If your project requires custom functionality beyond Tableau's standard features, you can explore Tableau Extensions or integrate with external web applications.
Building Sales Dashboard with Tableau
Data Connection Creating a sales dashboard in Tableau involves connecting to your sales data source and designing visualizations to present the information effectively. Here's a step-by-step guide on how to establish a data connection in Tableau for building a sales dashboard:
- Install and Launch Tableau:
- If you haven't already, download and install Tableau Desktop. Once installed, launch the application.
- Connect to Your Data Source:
- Click on "Connect to Data" on the Tableau start page.
- Choose your data source. Common data sources for sales data might include Excel spreadsheets, CSV files, databases (e.g., SQL Server, MySQL), or web services.
- Depending on your data source, you may need to provide login credentials or specify the file path.
- Data Preparation:
- Once connected, you'll see the Data Source tab where you can prepare your data.
- Clean and transform your data as needed. This may involve renaming columns, aggregating data, creating calculated fields, or handling missing values.
- Data Joins and Blending:
- If your sales data is stored in multiple tables, you may need to perform data joins or data blending to combine them.
- Tableau provides a user-friendly interface for performing joins and blending.
- Data Exploration:
- Use the "Data Source" tab to explore your data and verify that it's correctly structured for your dashboard needs.
- Look for any anomalies or issues that need to be addressed.
- Create Visualizations:
- Go to the "Worksheet" tab to start designing your visualizations.
- Drag and drop dimensions and measures onto the Rows and Columns shelves to create charts, graphs, and tables.
- Customize the appearance of your visualizations by adjusting colors, formatting, and labels.
- Dashboard Creation:
- After creating individual visualizations, go to the "Dashboard" tab to combine them into a dashboard.
- Drag and drop sheets onto the dashboard canvas to arrange them as desired.
- Add filters, parameters, and other dashboard elements to allow for interactivity.
- Interactivity and Filtering:
- Make use of filters, actions, and parameters to allow users to interact with your dashboard dynamically.
- Create filter actions to update multiple sheets based on user selections.
- Design and Layout:
- Pay attention to the design and layout of your dashboard to make it visually appealing and easy to understand.
- Use formatting options to control font sizes, colors, and alignment.
- Publish and Share:
- Once your dashboard is complete, you can publish it to Tableau Server, Tableau Online, or Tableau Public, depending on your needs.
- Share the dashboard with stakeholders or embed it on a website.
- Regular Updates:
- If your sales data is regularly updated, consider setting up data refresh schedules to keep your dashboard up-to-date automatically.
- Documentation and Training:
- Document your dashboard's data sources, calculations, and design decisions.
- Provide training or documentation for users who will be interacting with the dashboard.
Data Model Creation
Here's a step-by-step guide on how to create a data model for your sales dashboard:
- Data Sources:
- Start by connecting Tableau to your data sources. Typically, your sales data may reside in one or more databases, spreadsheets, or other data repositories. Import or connect to these sources within Tableau.
- Data Preparation:
- Clean and prepare your data. This step involves handling missing values, correcting data types, and resolving any data quality issues.
- Data Integration:
- If your sales data is spread across multiple sources or tables, you'll need to join or blend the data together to create a unified dataset for your dashboard. Common keys for integration could be customer IDs, product IDs, or date/time fields.
- Date Hierarchies:
- If your sales data includes date/time information (e.g., order dates, transaction timestamps), create date hierarchies in Tableau. This allows you to easily aggregate and drill down into time-based data.
- Dimensions and Measures:
- Define dimensions and measures in Tableau. Dimensions are categorical variables like product categories, regions, or sales representatives. Measures are numerical values like sales revenue, profit, or quantities sold.
- Calculated Fields:
- Create calculated fields for any derived metrics or custom calculations you need for your dashboard. This can include metrics like profit margin (calculated as profit divided by revenue) or year-over-year growth.
- Groups and Sets:
- Use groups and sets to organize and categorize your data further. Groups can be used to group similar items together (e.g., product categories), and sets allow you to create subsets of data based on specific conditions.
- Data Aggregation:
- Depending on the complexity of your data, you may need to perform data aggregation. Aggregation involves summarizing data at various levels, such as total sales by region or average sales by product category.
- Parameters:
- Parameters allow you to create dynamic inputs that can be adjusted by users of the dashboard. You can use parameters for selecting date ranges, filtering data, or choosing specific metrics to display.
- Filters:
- Implement filters to allow users to interactively explore the data. Common filters include date filters, category filters, and geographic filters.
- Dashboard Layout:
- Design the layout of your dashboard. This includes arranging sheets, charts, and filters to create an intuitive and visually appealing dashboard.
- Interactivity:
- Add interactivity to your dashboard. Use actions, highlight actions, and URL actions to allow users to click on charts or data points to see more detailed information or navigate to external resources.
- Testing and Validation:
- Test your dashboard thoroughly to ensure that it displays the correct information and responds to user interactions as expected.
- Publish and Share:
- Publish your dashboard to Tableau Server or Tableau Online, making it accessible to your intended audience. Set permissions and access controls as needed.
- Regular Updates:
- Maintain your dashboard by updating the data source as new sales data becomes available. Ensure that your calculated fields and visualizations continue to reflect the latest information.
Creating Visualizations Below are steps to help you create visualizations for a sales dashboard using Tableau:
- Install Tableau
- If you haven't already, download and install Tableau Desktop or Tableau Public (if you want to share your dashboard online).
- Connect to Your Data Source
- Launch Tableau and connect to your data source. You can connect to various data sources like Excel, databases, cloud services, etc.
- Import your sales data into Tableau.
- Explore Your Data
- After importing the data, explore it in the Data Source tab to understand its structure.
- Clean and prepare the data as needed by handling missing values, outliers, and formatting issues.
- Create Worksheets
- Go to the "Worksheet" tab to start building individual visualizations.
- Drag and drop dimensions and measures from the Data pane onto Rows and Columns shelves to create visualizations.
- Choose the appropriate chart types for your data (e.g., bar charts, line charts, pie charts, etc.).
- Customize the visualizations by adding labels, colors, tooltips, and filters.
- Build a Dashboard
- Go to the "Dashboard" tab to create the overall sales dashboard.
- Drag individual worksheets or objects (e.g., text, images) onto the dashboard canvas.
- Arrange and resize objects to create an appealing layout.
- Add titles, captions, and explanatory text to provide context.
- Add Interactivity
- Make your dashboard interactive by adding actions, filters, and parameters.
- Actions allow users to click on one visualization and have it affect others, creating a dynamic experience.
- Filters help users narrow down the data they want to see.
- Format and Style
- Format your dashboard to make it visually appealing and consistent.
- Use color schemes, fonts, and styles that align with your organization's branding or the dashboard's purpose.
- Pay attention to alignment and spacing to create a polished look.
- Test and Refine
- Test your dashboard to ensure that all elements function correctly.
- Verify that the visualizations accurately represent your data.
- Seek feedback from colleagues or users and make improvements accordingly.
- Publish and Share
- Save your Tableau workbook.
- If you're using Tableau Public, publish your dashboard online, and share the link.
- For Tableau Desktop, you can save the workbook as a Tableau packaged workbook (.twbx) to share with others who have Tableau installed.
- Maintain and Update
- Periodically update your dashboard with new data. Monitor usage and gather feedback to make continuous improvements.
Dashboard Reporting
Below are steps and tips for dashboard reporting in Tableau:
- Define Your Dashboard Goals:
- Determine the purpose of your sales dashboard. What insights do you want to convey to your audience? Common goals include tracking sales performance, analyzing trends, and monitoring KPIs.
- Organize Your Dashboard:
- Plan the layout of your dashboard. Decide how you want to arrange your visualizations, titles, and filters. Consider the logical flow of information.
- Use containers and layout objects to structure your dashboard neatly.
- Choose the Right Visualizations:
- Select visualizations that effectively represent your data and convey your message. Common choices include:
- Line charts for trend analysis.
- Bar charts for comparing categories or time periods.
- Pie charts for showing proportions.
- Maps for geographical data.
- Tables for displaying detailed data.
- Use Tableau's Show Me feature to explore recommended visualization types based on your data.
- Highlight Key Metrics:
- Emphasize the most important metrics and KPIs prominently on your dashboard. These could include total sales, revenue, conversion rates, or any other critical indicators.
- Use large, clear text and color to draw attention to key numbers.
- Add Interactivity:
- Make your dashboard interactive by adding filters, parameters, and actions.
- Filters allow users to select specific data points or time frames.
- Actions enable users to click on one chart to filter or highlight related charts, providing deeper insights.
- Provide Context:
- Add titles, subtitles, and captions to provide context for your visualizations.
- Include a brief description of what the dashboard is showing and any relevant information about the data source or timeframe.
- Create Drill-Downs:
- Implement drill-down functionality to allow users to explore data at different levels of detail. For example, users can click on a bar chart to see a breakdown by region or product category.
- Use Color Wisely:
- Use color strategically to convey meaning and highlight data points. For example, use green for positive trends and red for negative trends.
- Be mindful of color accessibility for all users.
- Add Reference Lines and Annotations:
- Include reference lines, reference bands, and annotations to provide additional context to your charts.
- Annotations can be used to highlight specific data points or events.
- Test and Iterate:
- Test your dashboard with real users to gather feedback on usability and clarity.
- Continuously iterate and refine your dashboard based on user feedback and changing business needs.
- Publish and Share:
- Publish your Tableau dashboard to Tableau Server, Tableau Online, or Tableau Public, depending on your organization's infrastructure and requirements.
- Share the dashboard with relevant stakeholders and ensure that it's accessible to the intended audience.
- Maintain and Update:
- Regularly update your sales dashboard to ensure it reflects the latest data.
- Keep an eye on data quality and data source changes.
What’s next
- Trend Analysis:
- Implement trend lines or forecasting models to visualize sales trends over time.
- Add a time series decomposition to show seasonality and long-term trends separately.
- Geographic Analysis:
- Use maps to visualize sales geographically. Plot sales data on a map to show regional variations.
- Implement drill-down maps to allow users to explore sales by country, state, or city.
- Top Performers and Bottom Performers:
- Create visualizations to highlight top-performing products, salespeople, or regions.
- Use parameters or filters to allow users to switch between different performance metrics (e.g., revenue, profit, growth rate).
- Sales Funnel Analysis:
- Visualize the sales funnel to track the progression of leads from initial contact to conversion.
- Use bar charts or Sankey diagrams to show the conversion rates at each stage.
- Customer Segmentation:
- Segment customers based on various criteria such as demographics, behavior, or purchase history.
- Create dynamic filters to allow users to select specific customer segments and see how they impact sales.
- Drill-Through Functionality:
- Enable drill-through functionality so users can click on a data point to access more detailed information.
- For example, clicking on a product could reveal a detailed product profile with historical sales data.
- Alerts and Notifications:
- Implement alerts or threshold indicators to notify users when certain KPIs or metrics exceed or fall below predefined thresholds.
- Use calculated fields to set up conditional formatting based on alert conditions.
- Parameterized Reports:
- Create parameterized reports that allow users to customize the dashboard's view based on their preferences.
- Parameters can control things like date ranges, filters, and chart types.
Tableau Sales Dashboards Examples
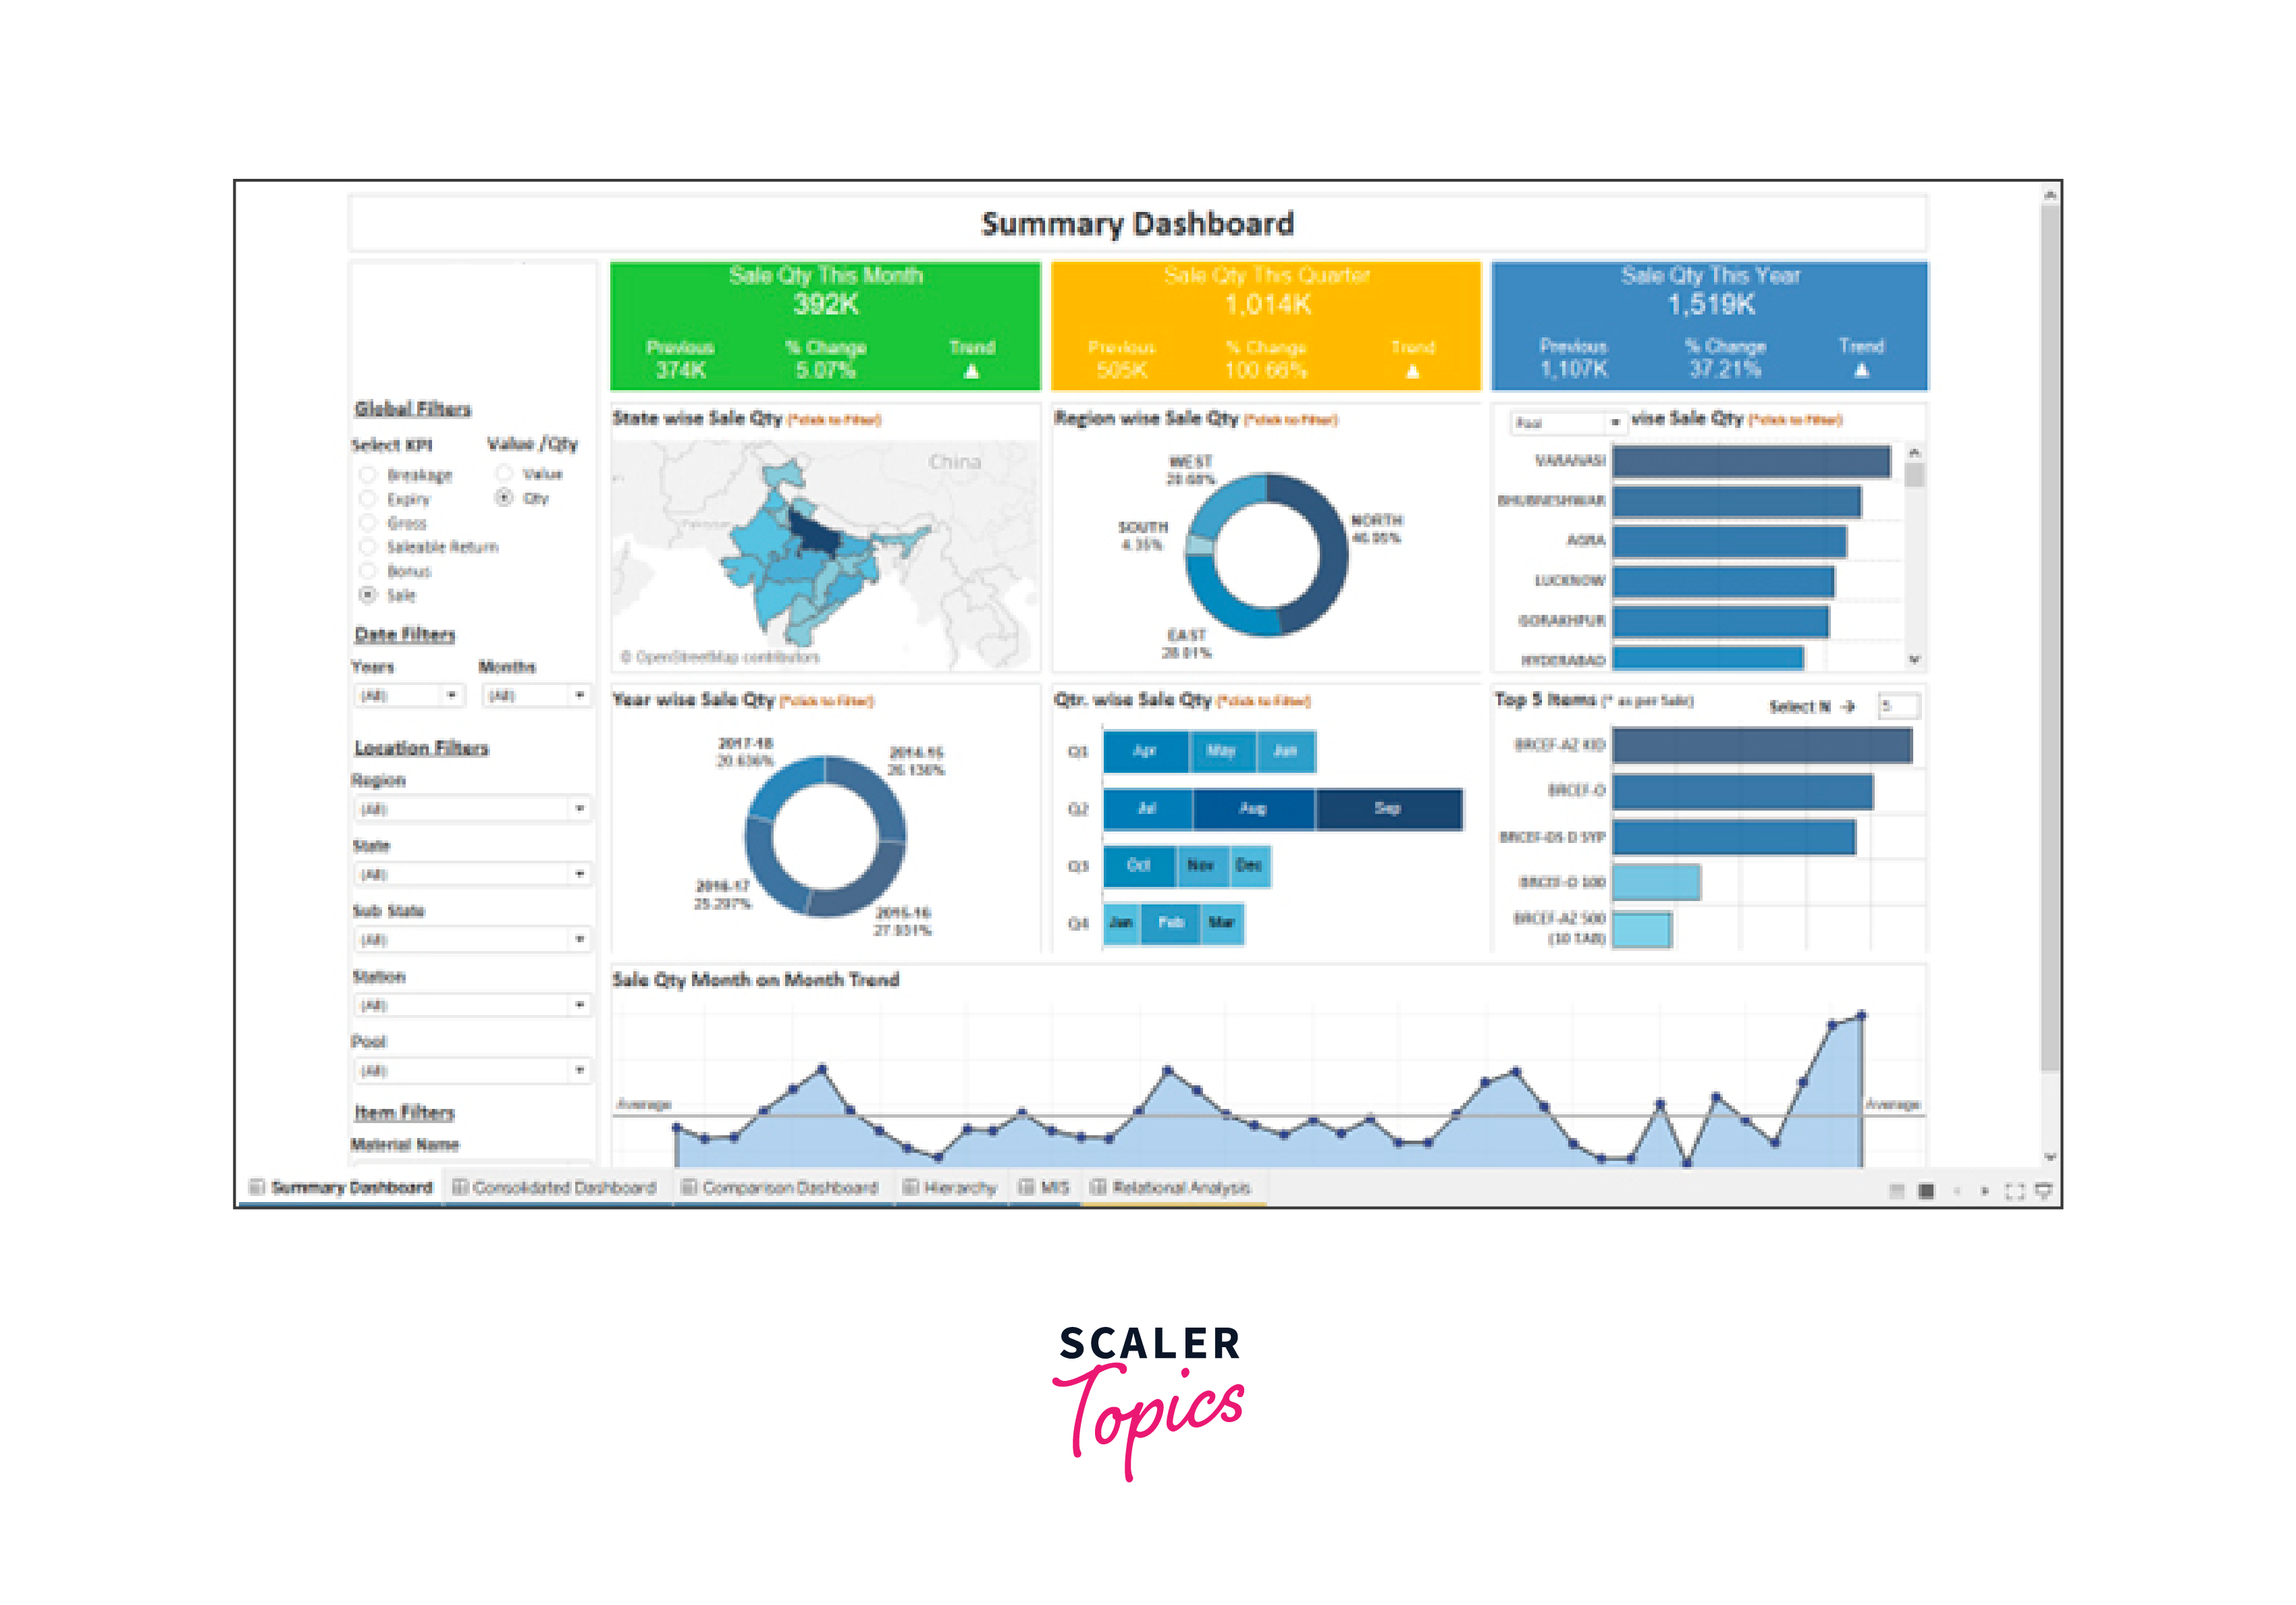
Summary Dashboard
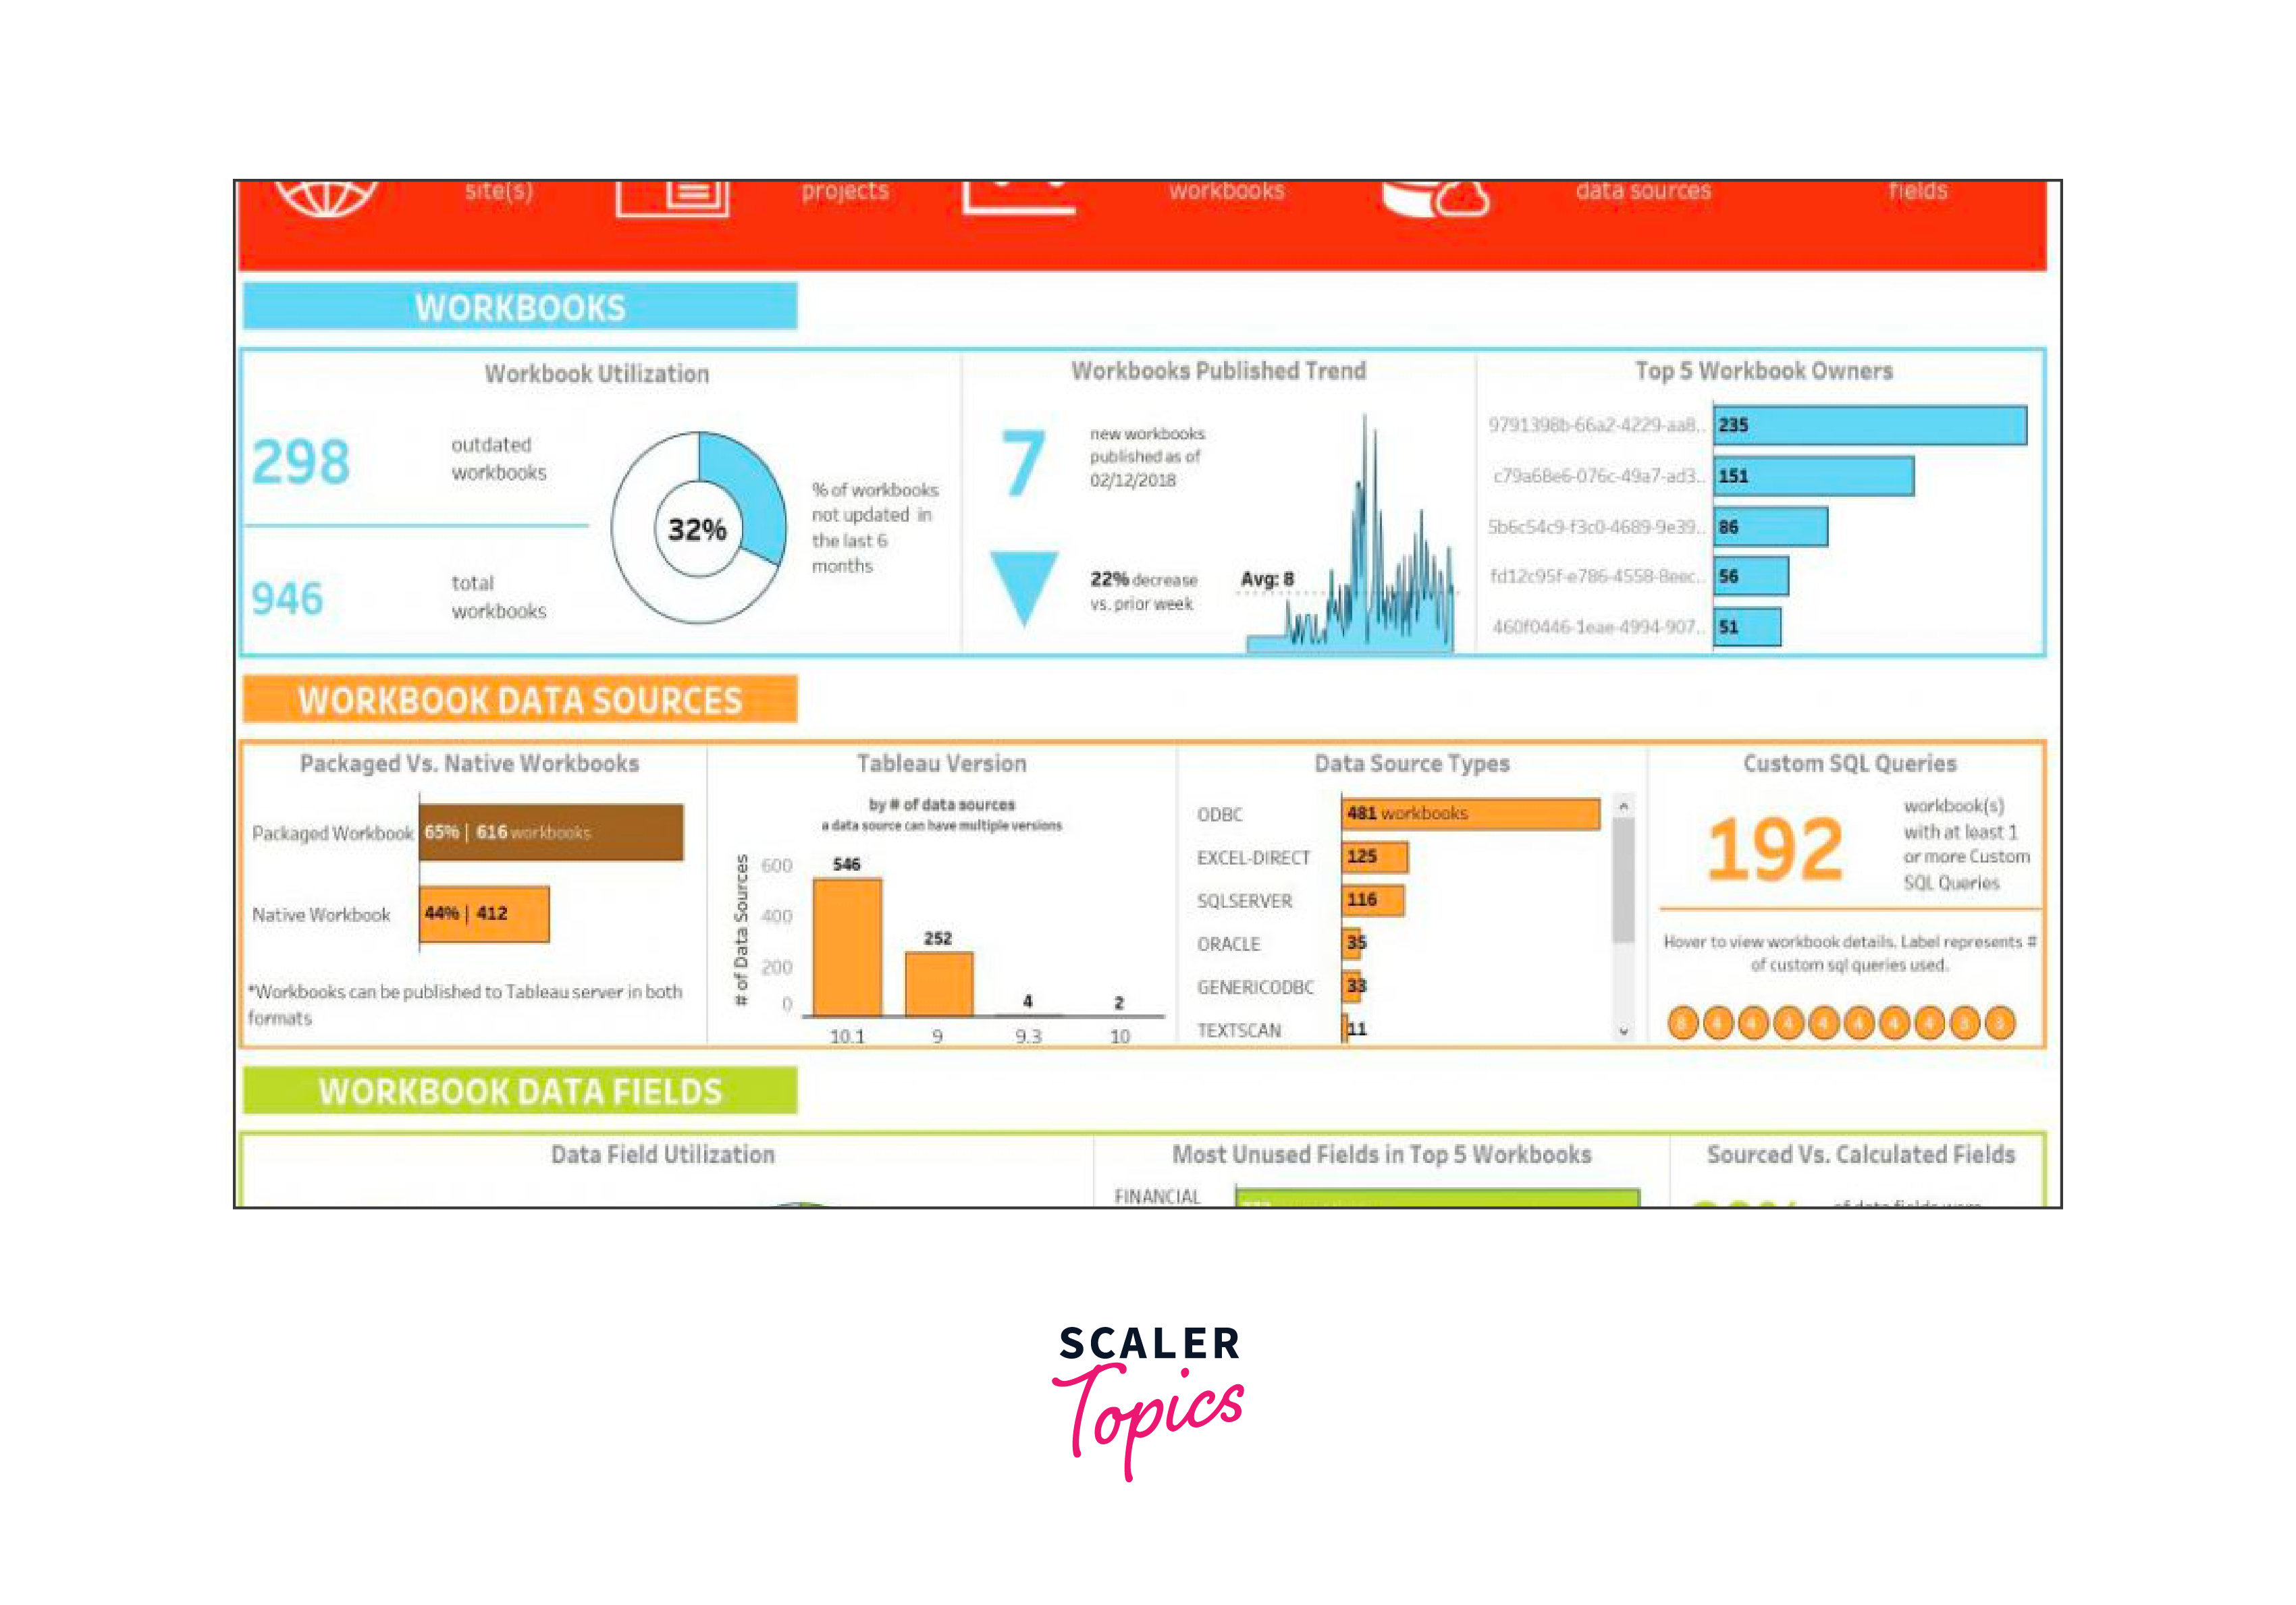
Consolidated Dashboard
Comparison Dashboard
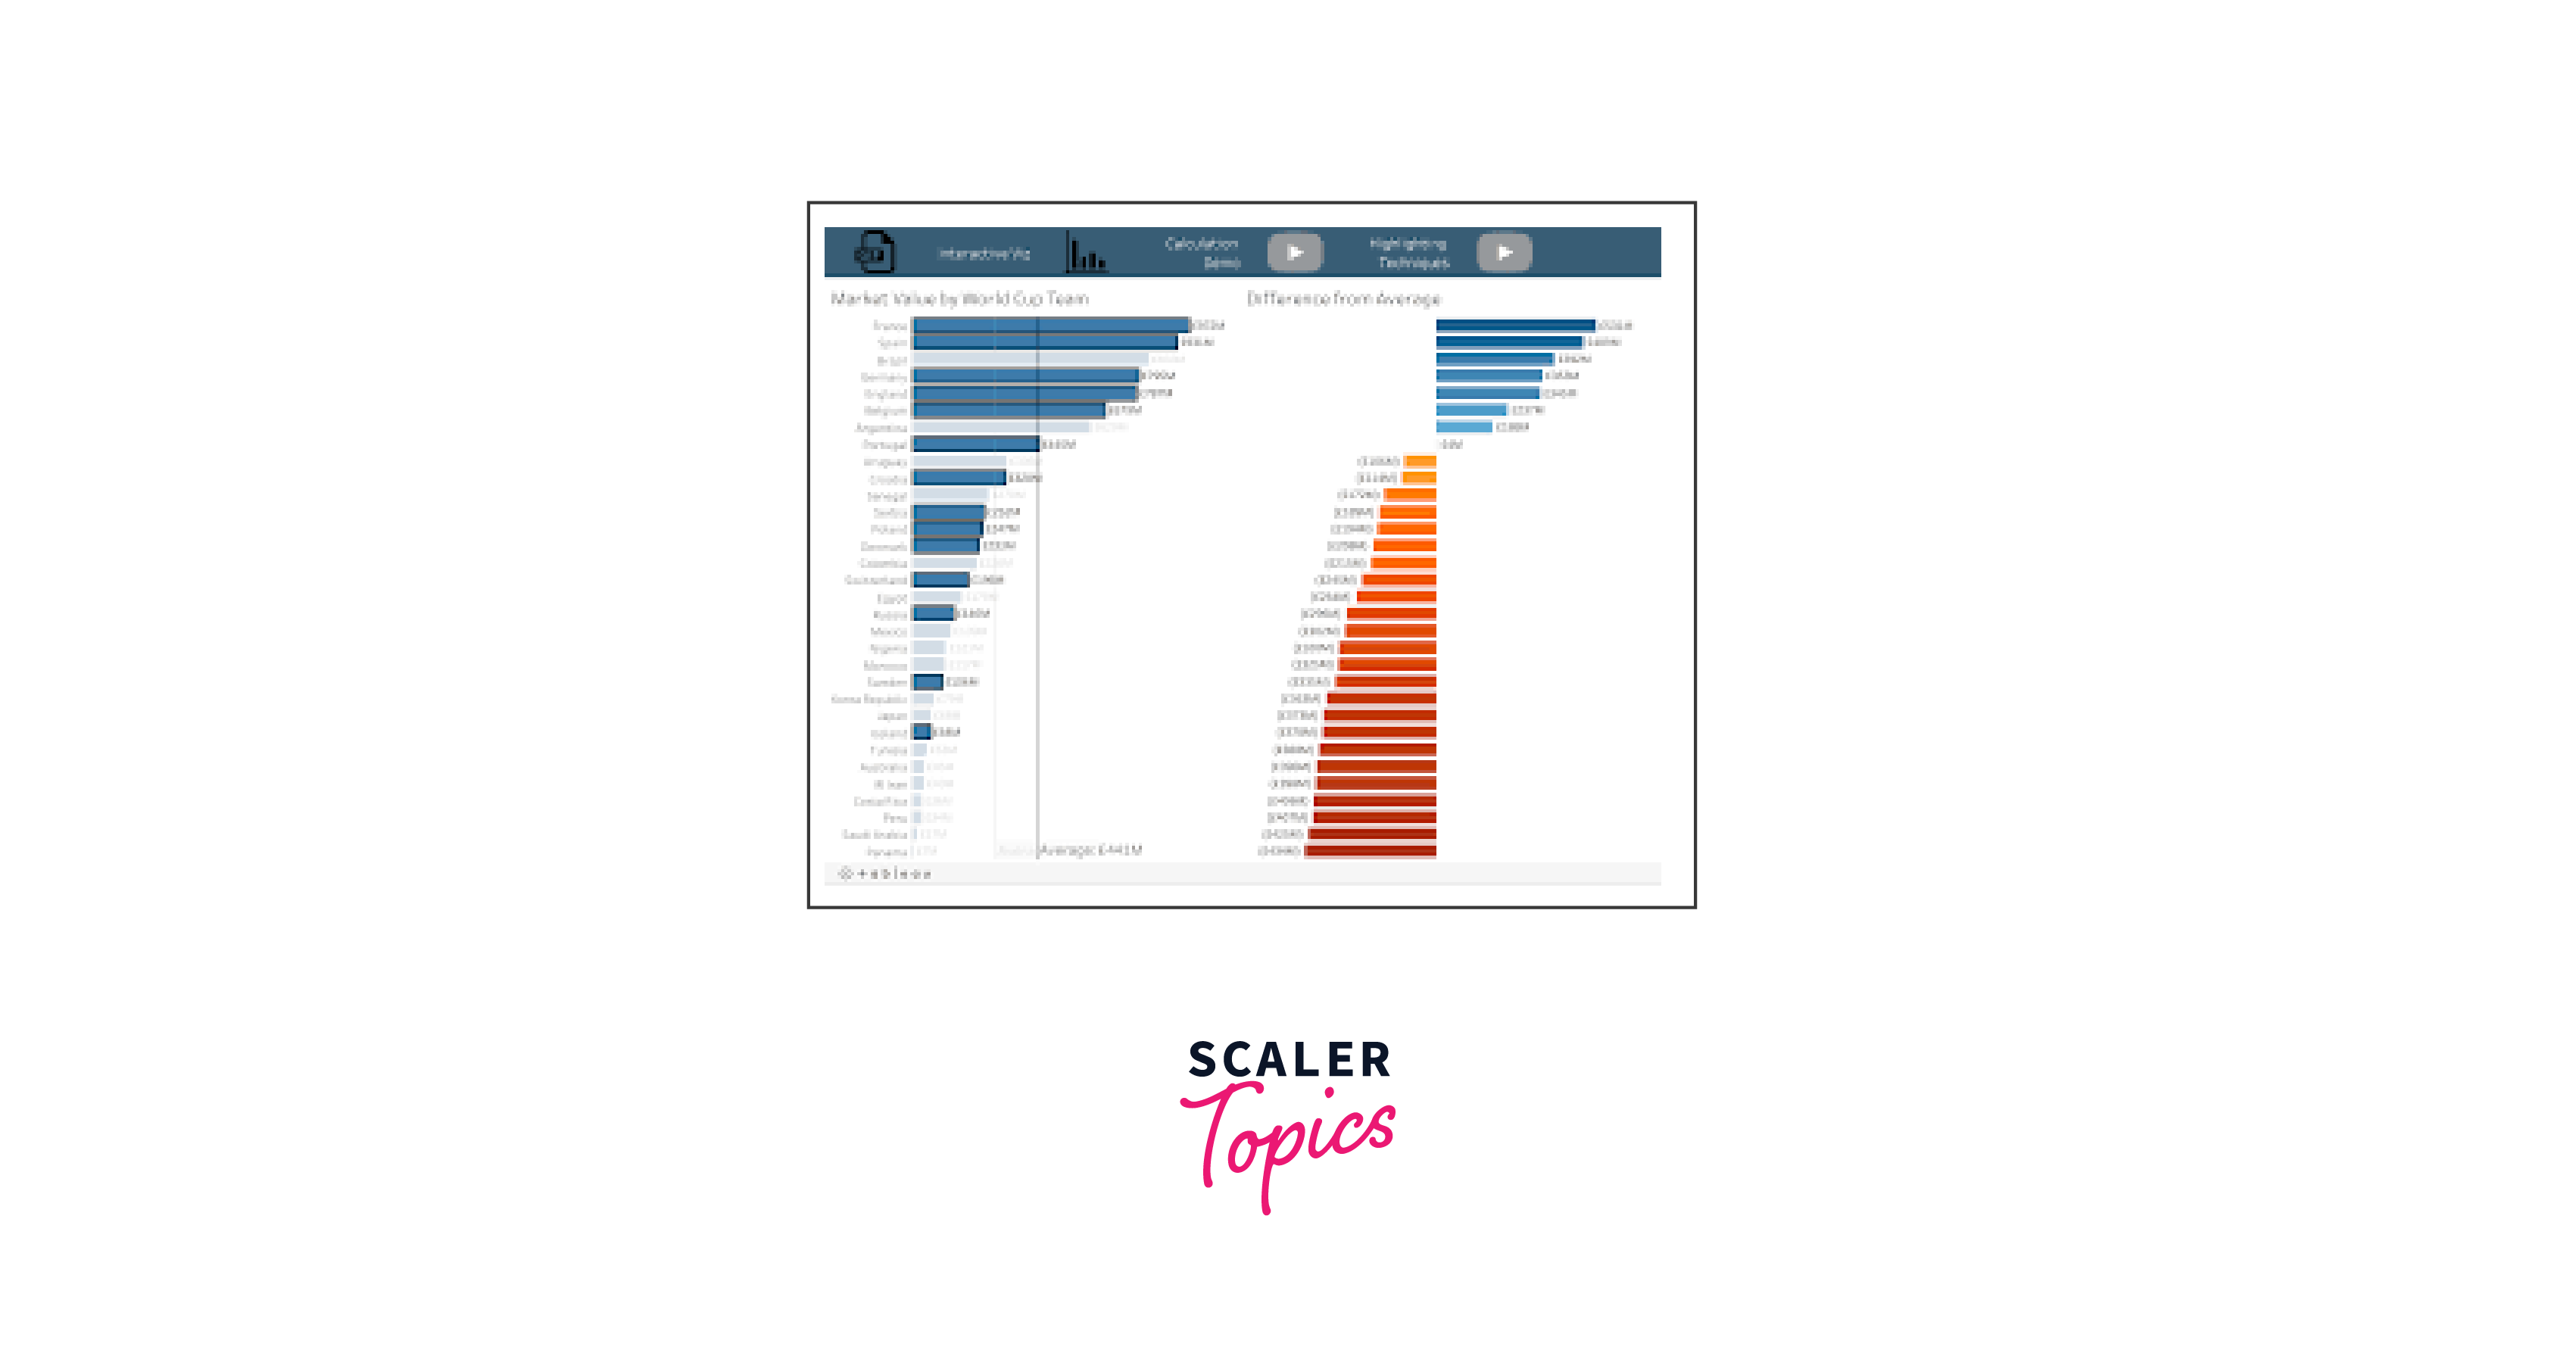
Sales Opportunity Analysis
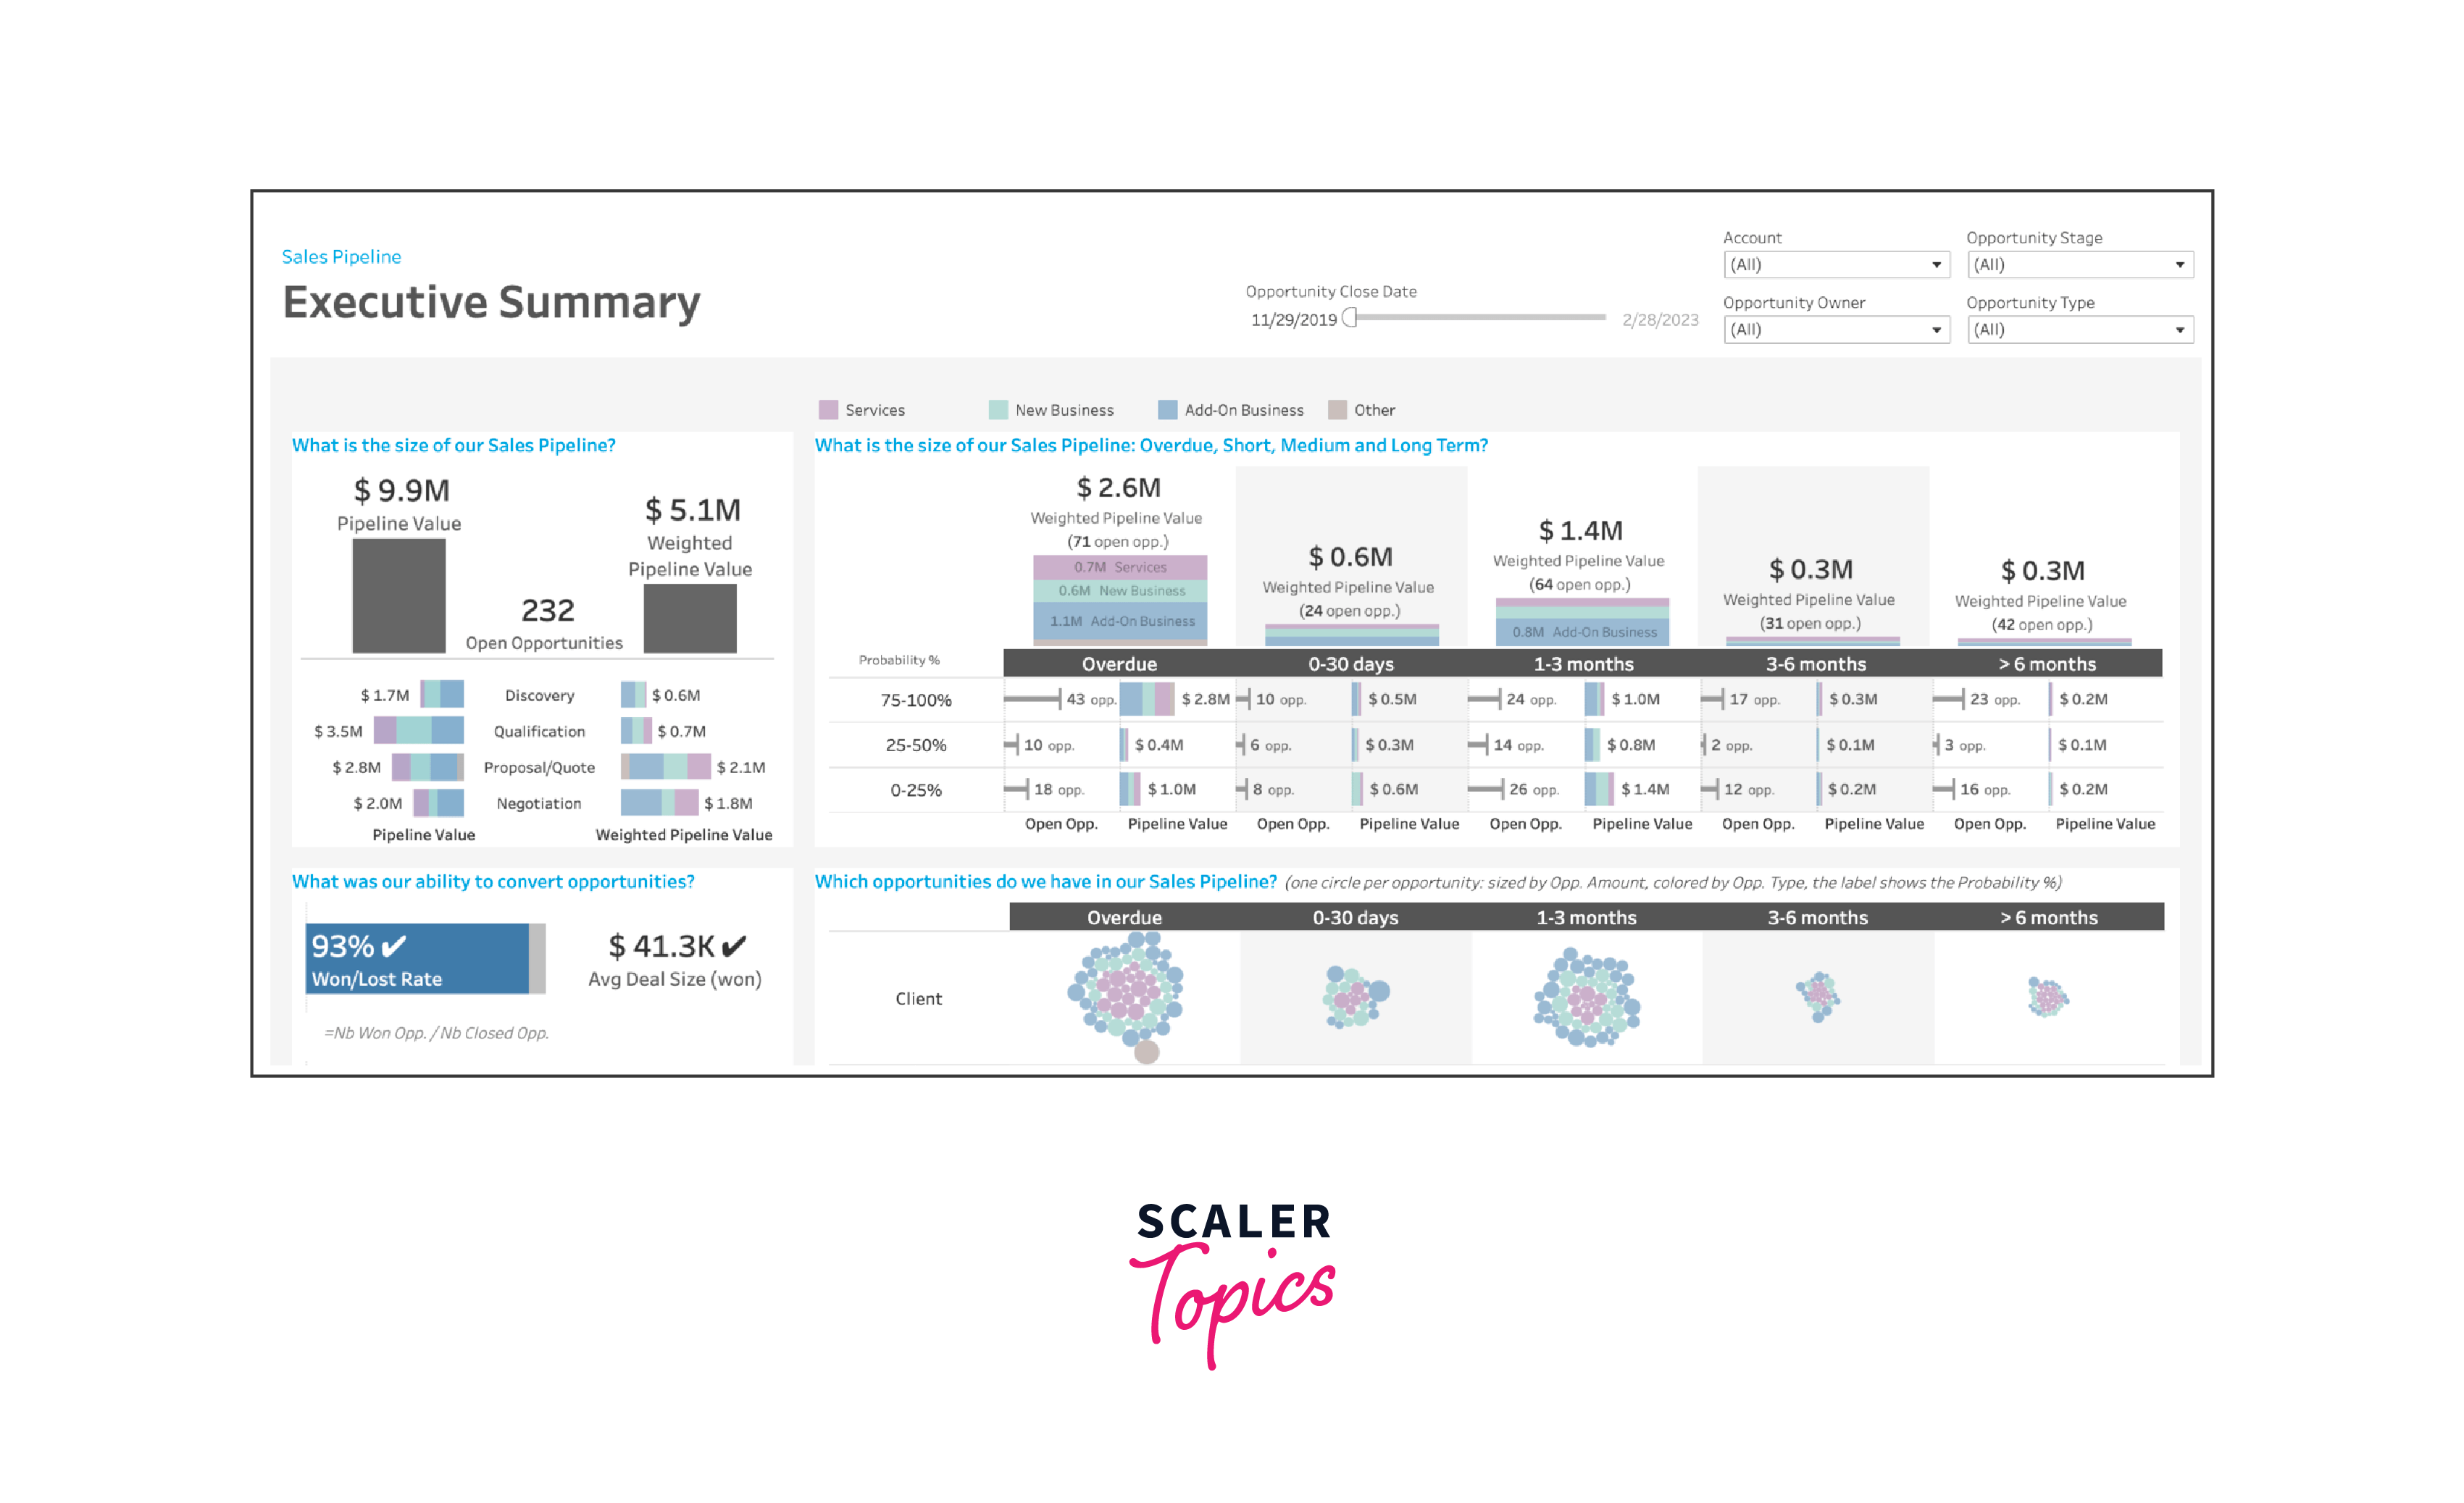
Revenue Comparison
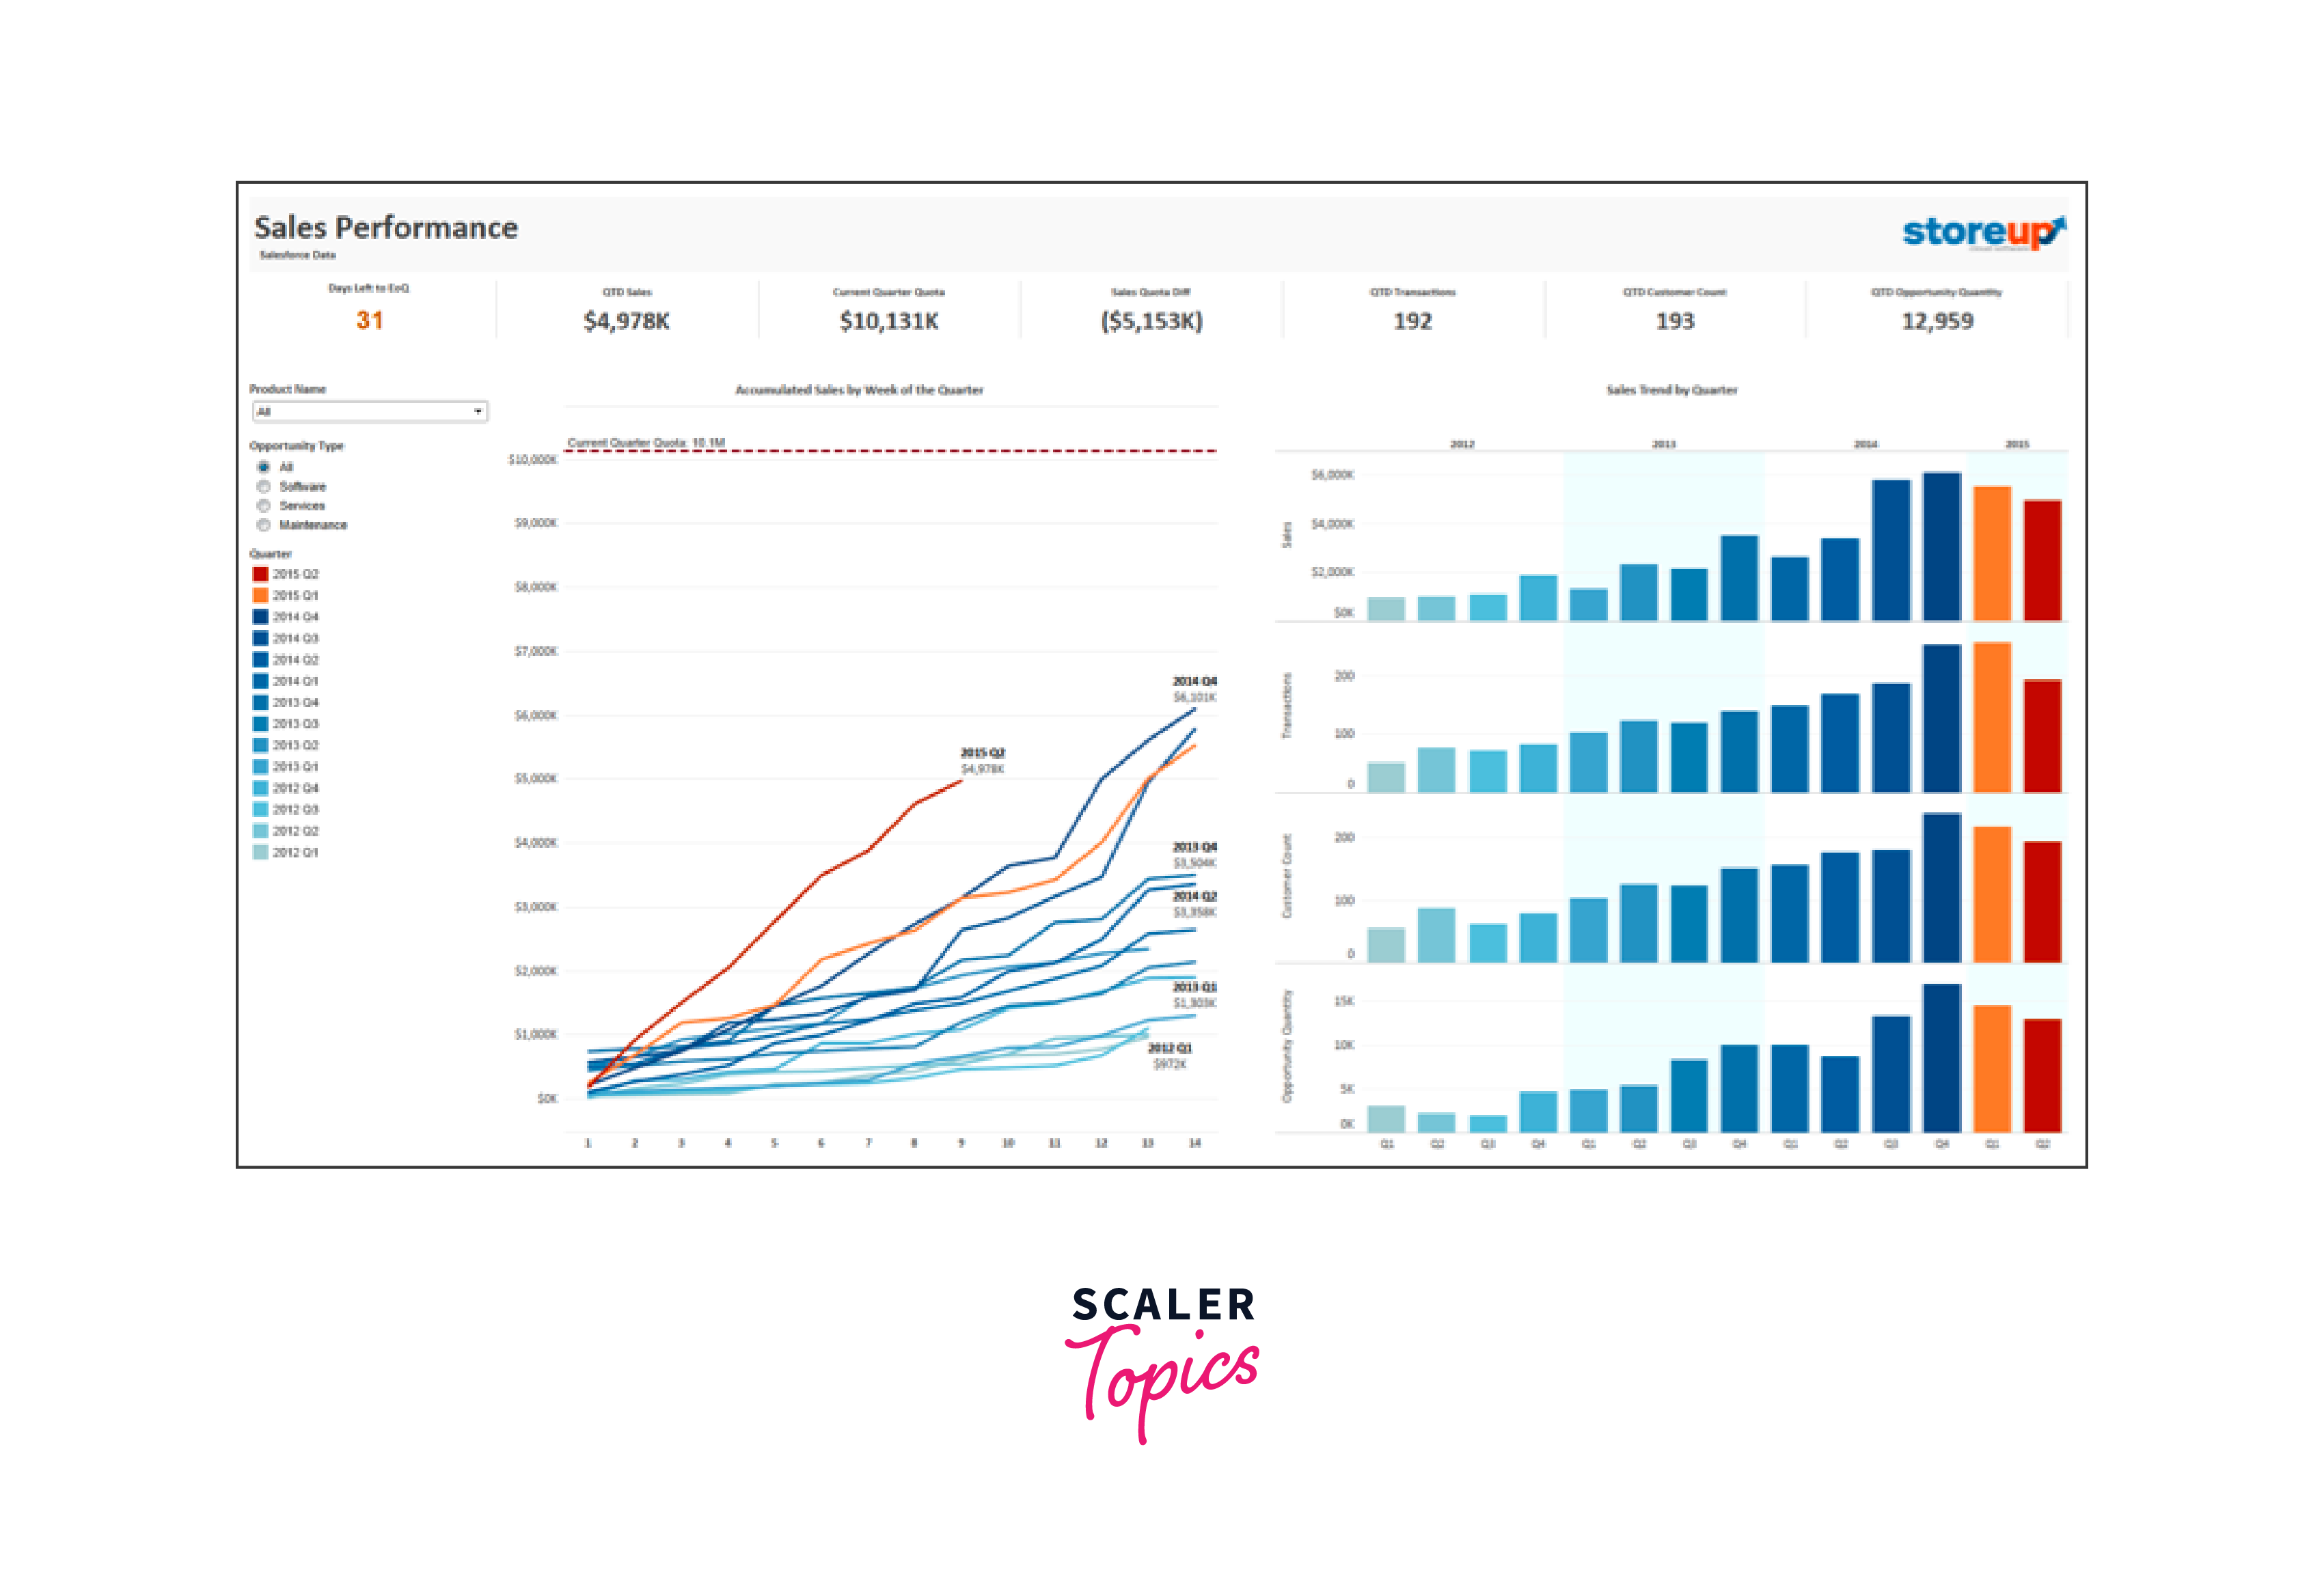
Sales Order Analysis
Conclusion
- Clearly defined objectives are essential for dashboard design.
- Select appropriate visualizations to effectively convey data insights.
- Prioritize and prominently display key metrics and KPIs.
- Enhance user engagement with interactive elements like filters and drill-downs.
- Contextual information through titles and explanations adds clarity.
- Continuously iterate and update the dashboard to stay relevant and informative.
- Color usage should be strategic and consider accessibility.
- Consider the needs and feedback of your dashboard's users during development.
- Regular maintenance ensures accurate and up-to-date data representation.
- Sharing the dashboard on relevant platforms ensures accessibility for stakeholders.

