Tableau Platform Architecture
Overview
Tableau can be defined as a visual analytics platform that provides its users the flexibility to transform the way in which the data can be visualized. Tableau is used to solve problems that help organizations and users to make the most out of the data. It offers two prime components named Tableau Server and Tableau Desktop. With Tableau Server, users can connect with various data tiers, where multiple users can connect to clients from mobile, web, and Desktop. The Tableau Desktop is a widely popular and powerful data visualization tool offering reliability and security.
Introduction
If you are looking for a platform where you can quickly and easily create dashboards and collaborate with various users, the Tableau platform is at your help. The Tableau tool can be defined as a visual analytics platform that provides its users the flexibility to transform the way in which the data can be visualized. Tableau is used to solve problems that help organizations and users to make the most out of data. You do not need to explicitly employ the IT or data engineering for calculating any new fields and fetching insights from it.
Below is the illustration of how the Tableau architecture looks like:
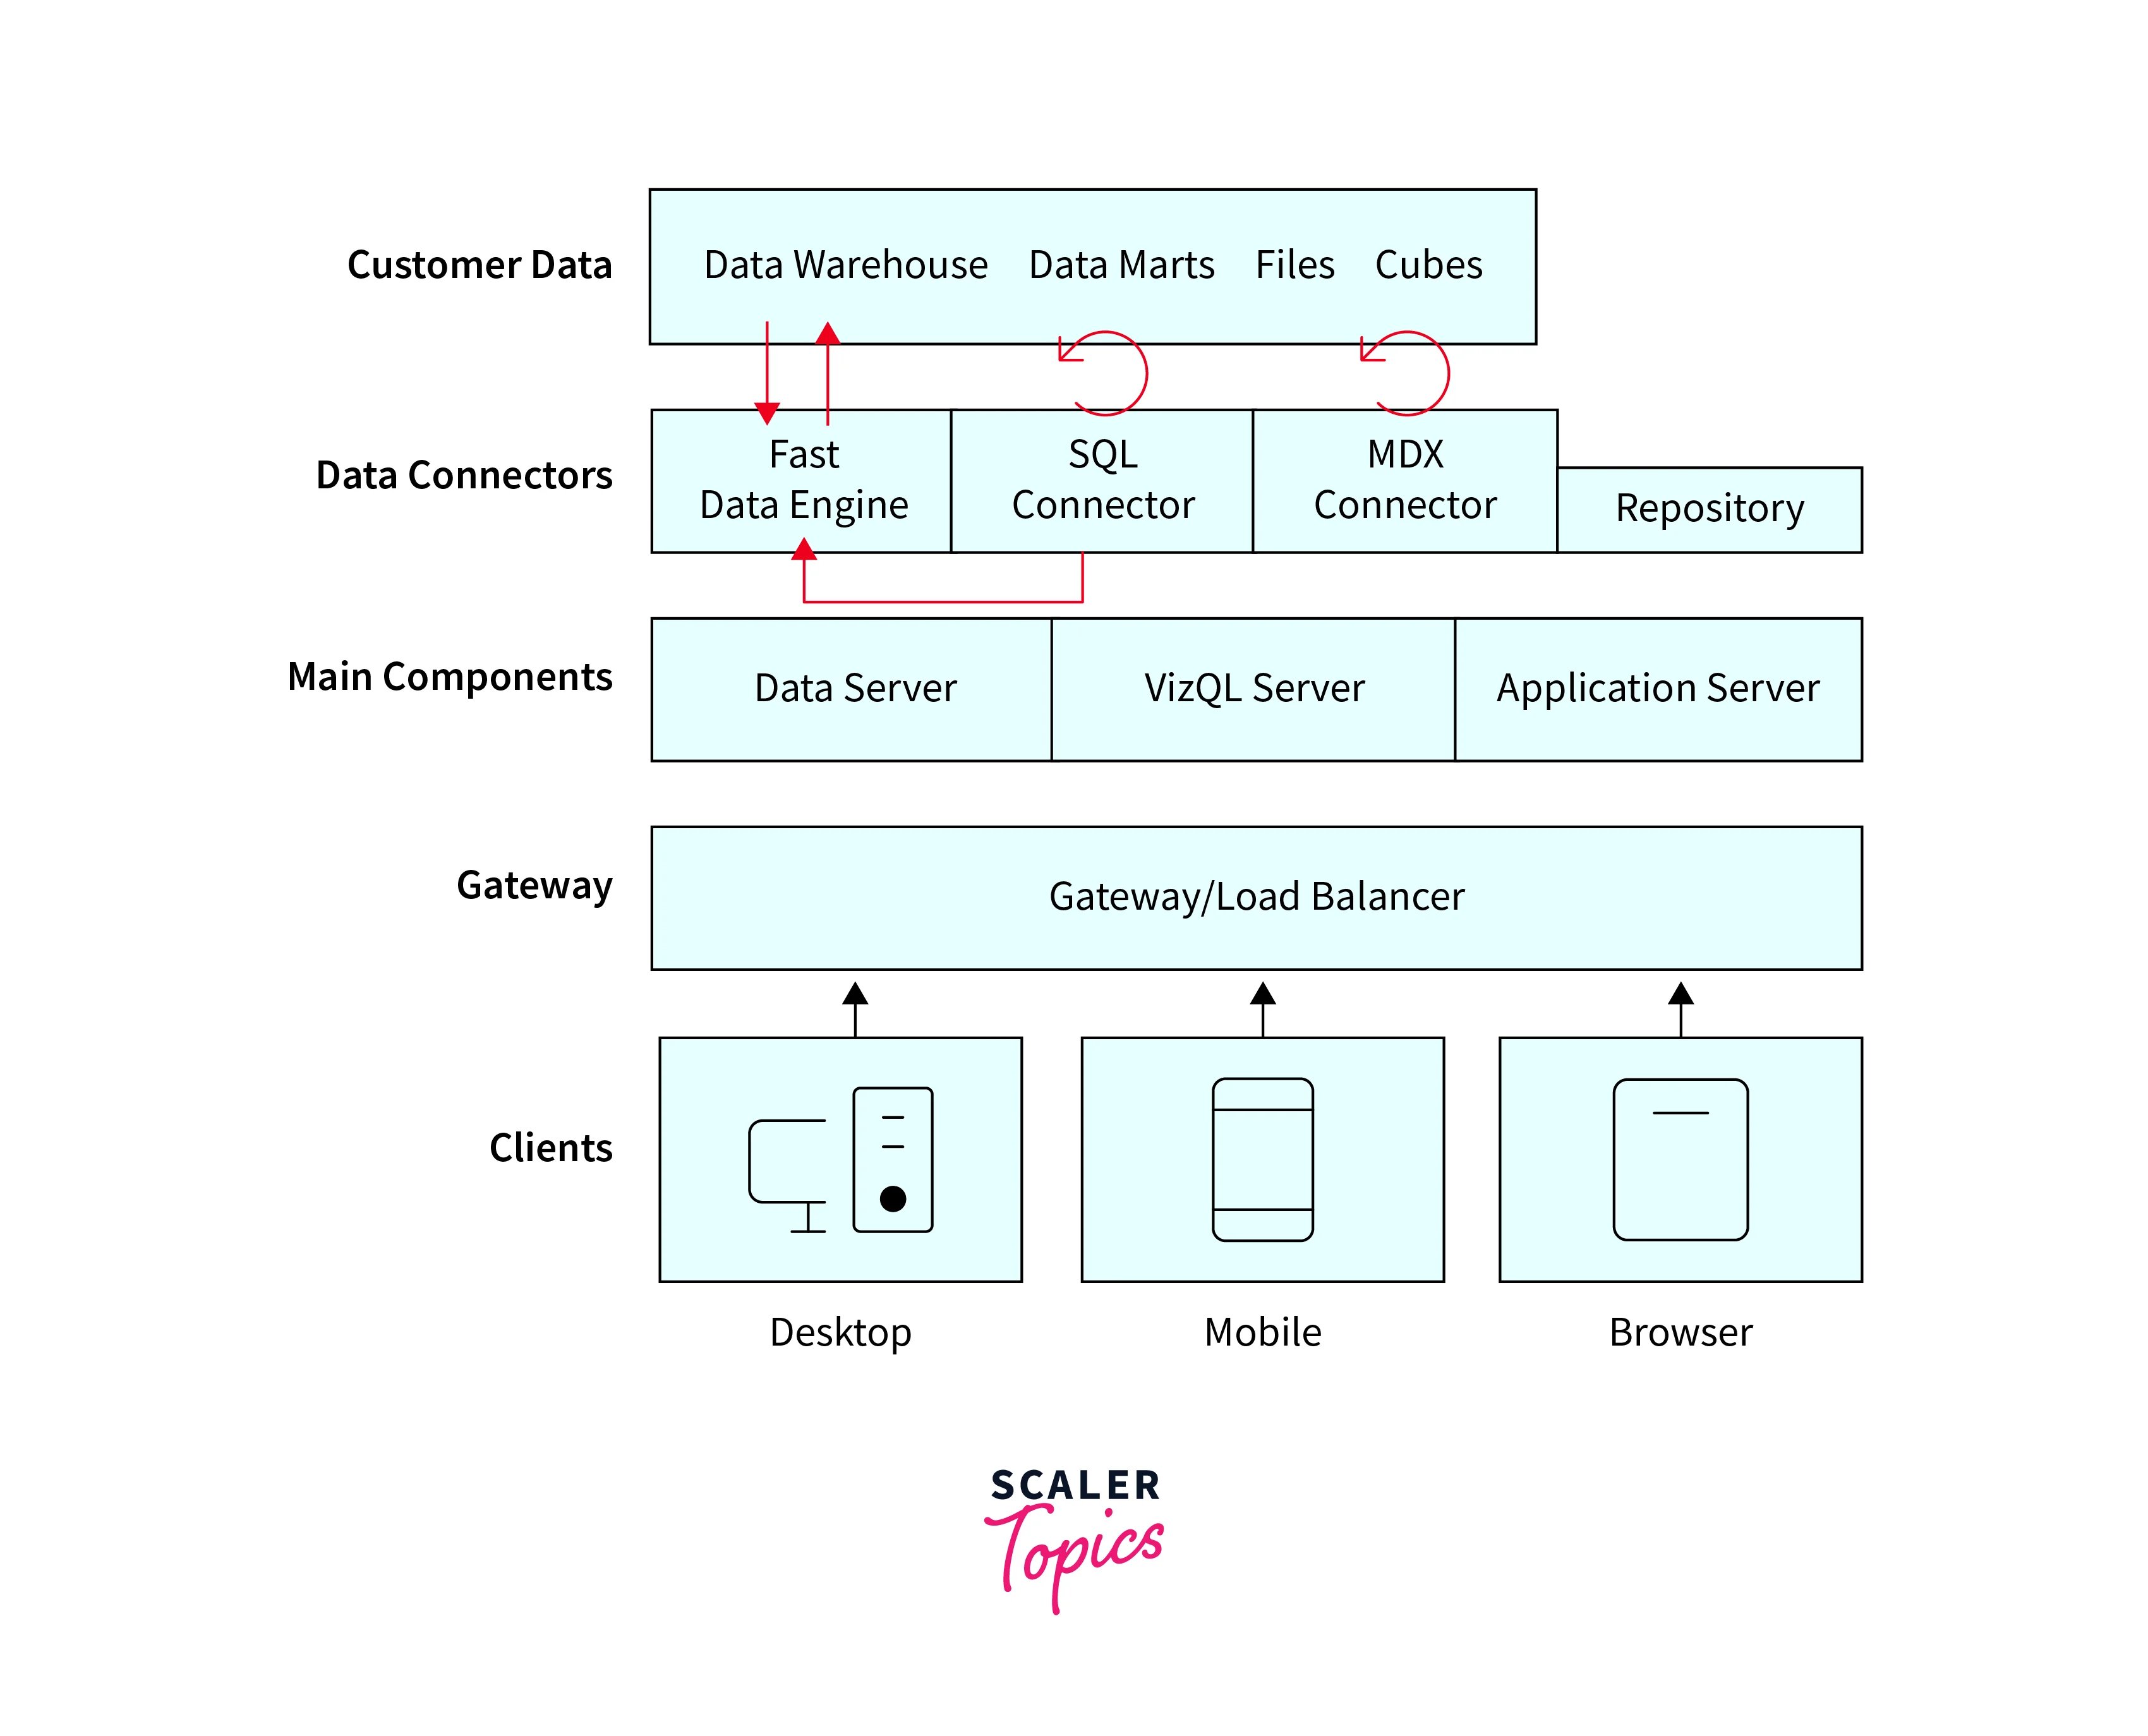
With the Tableau Server users can connect with various data tiers, where multiple users can connect to clients from Mobile, Web, and Desktop. The Tableau Desktop is a widely popular and powerful data visualization tool offering reliability and security. It can work on both physical and virtual machines offering multi-process, multi-user, and multi-threaded systems. The Tableau architecture offers n-tier client-server architecture which serves as the mobile clients, web clients, as well as desktop-installed software. With the Tableau Desktop, users can not only create but also collaborate with other users to author and publish views over the Tableau Server.
The interactive and sharable dashboard can be created by Tableau which depicts trends, and variations in data via graphs as well as charts. Real-time data analysis is the key distinguishing factor offered by the Tableau Desktop.
Tableau Server
To understand the Tableau Server in detail, let's have a glimpse of what Tableau Desktop is.
- We can define the Tableau Desktop as a platform where a user can direct the system to perform as per its requirements. Based on what a user's requirements interpret, all the mandatory architectural components are assigned. Now with this Tableau Desktop, users can use it as an authoring tool where visualizations can be created, workbooks can be established, and dashboards can be made for utilizing the data from the various data source in Tableau.
- The users also get the flexibility to share these visualizations in multiple ways. Now to define a Tableau Server, we can understand it as an enterprise-class business analytics platform where various clients can easily level up. The Tableau Server offers a powerful mobile as well as a browser-based analytics platform to serve the requirements as per the data and security strategy. With Tableau Server, various elements can be integrated with the IT infrastructure and this offers a strong architecture.
- With the Tableau Server, a dynamic user base is served where the website and mobile customers are interacting with the data over the various Tableau platforms. Visualizations can be shared with static users on websites or with mobile clients. These packages can be shared with Tableau Reader. Here, other users can also collaborate, edit and view the visualizations.
- This visualization can then be published into the Tableau Server. Many components are working together to manage the process a Tableau Server performs. There are components in charge of the data and users' security, a repository for storing the visualizations which are published to the Server, a cache for performance improvement, automation for managing the data workloads as well as scheduled updates, and the presentation layer that is entirely responsible for visualization related activities.
- With the Tableau Server, various data tiers can be connected like mobiles, desktops, and websites. While Tableau Desktop can seamlessly run over both virtual and physical machines, the Tableau Server can be installed over platforms like Google Cloud Platform, Amazon EC2, Alibaba Cloud, and MS Azure.
Tableau Cloud
For serving thousands of websites across thousands of distributed users all around the globe, Tableau launched its Tableau Cloud. Tableau Cloud is a software-as-a-service (SaaS) deployment that is built to scale for offering a seamless experience to its users within a multi-tenant or shared computing environment. With Tableau Cloud, the advantage of high availability is seen in the product as well as the best practices for the cloud architecture. It is a hybrid architecture where networks like the on-premises, private and public cloud can be seen. The below illustration is a high-level overview of Tableau Cloud depicting Tableau’s deployment methods from the inside:
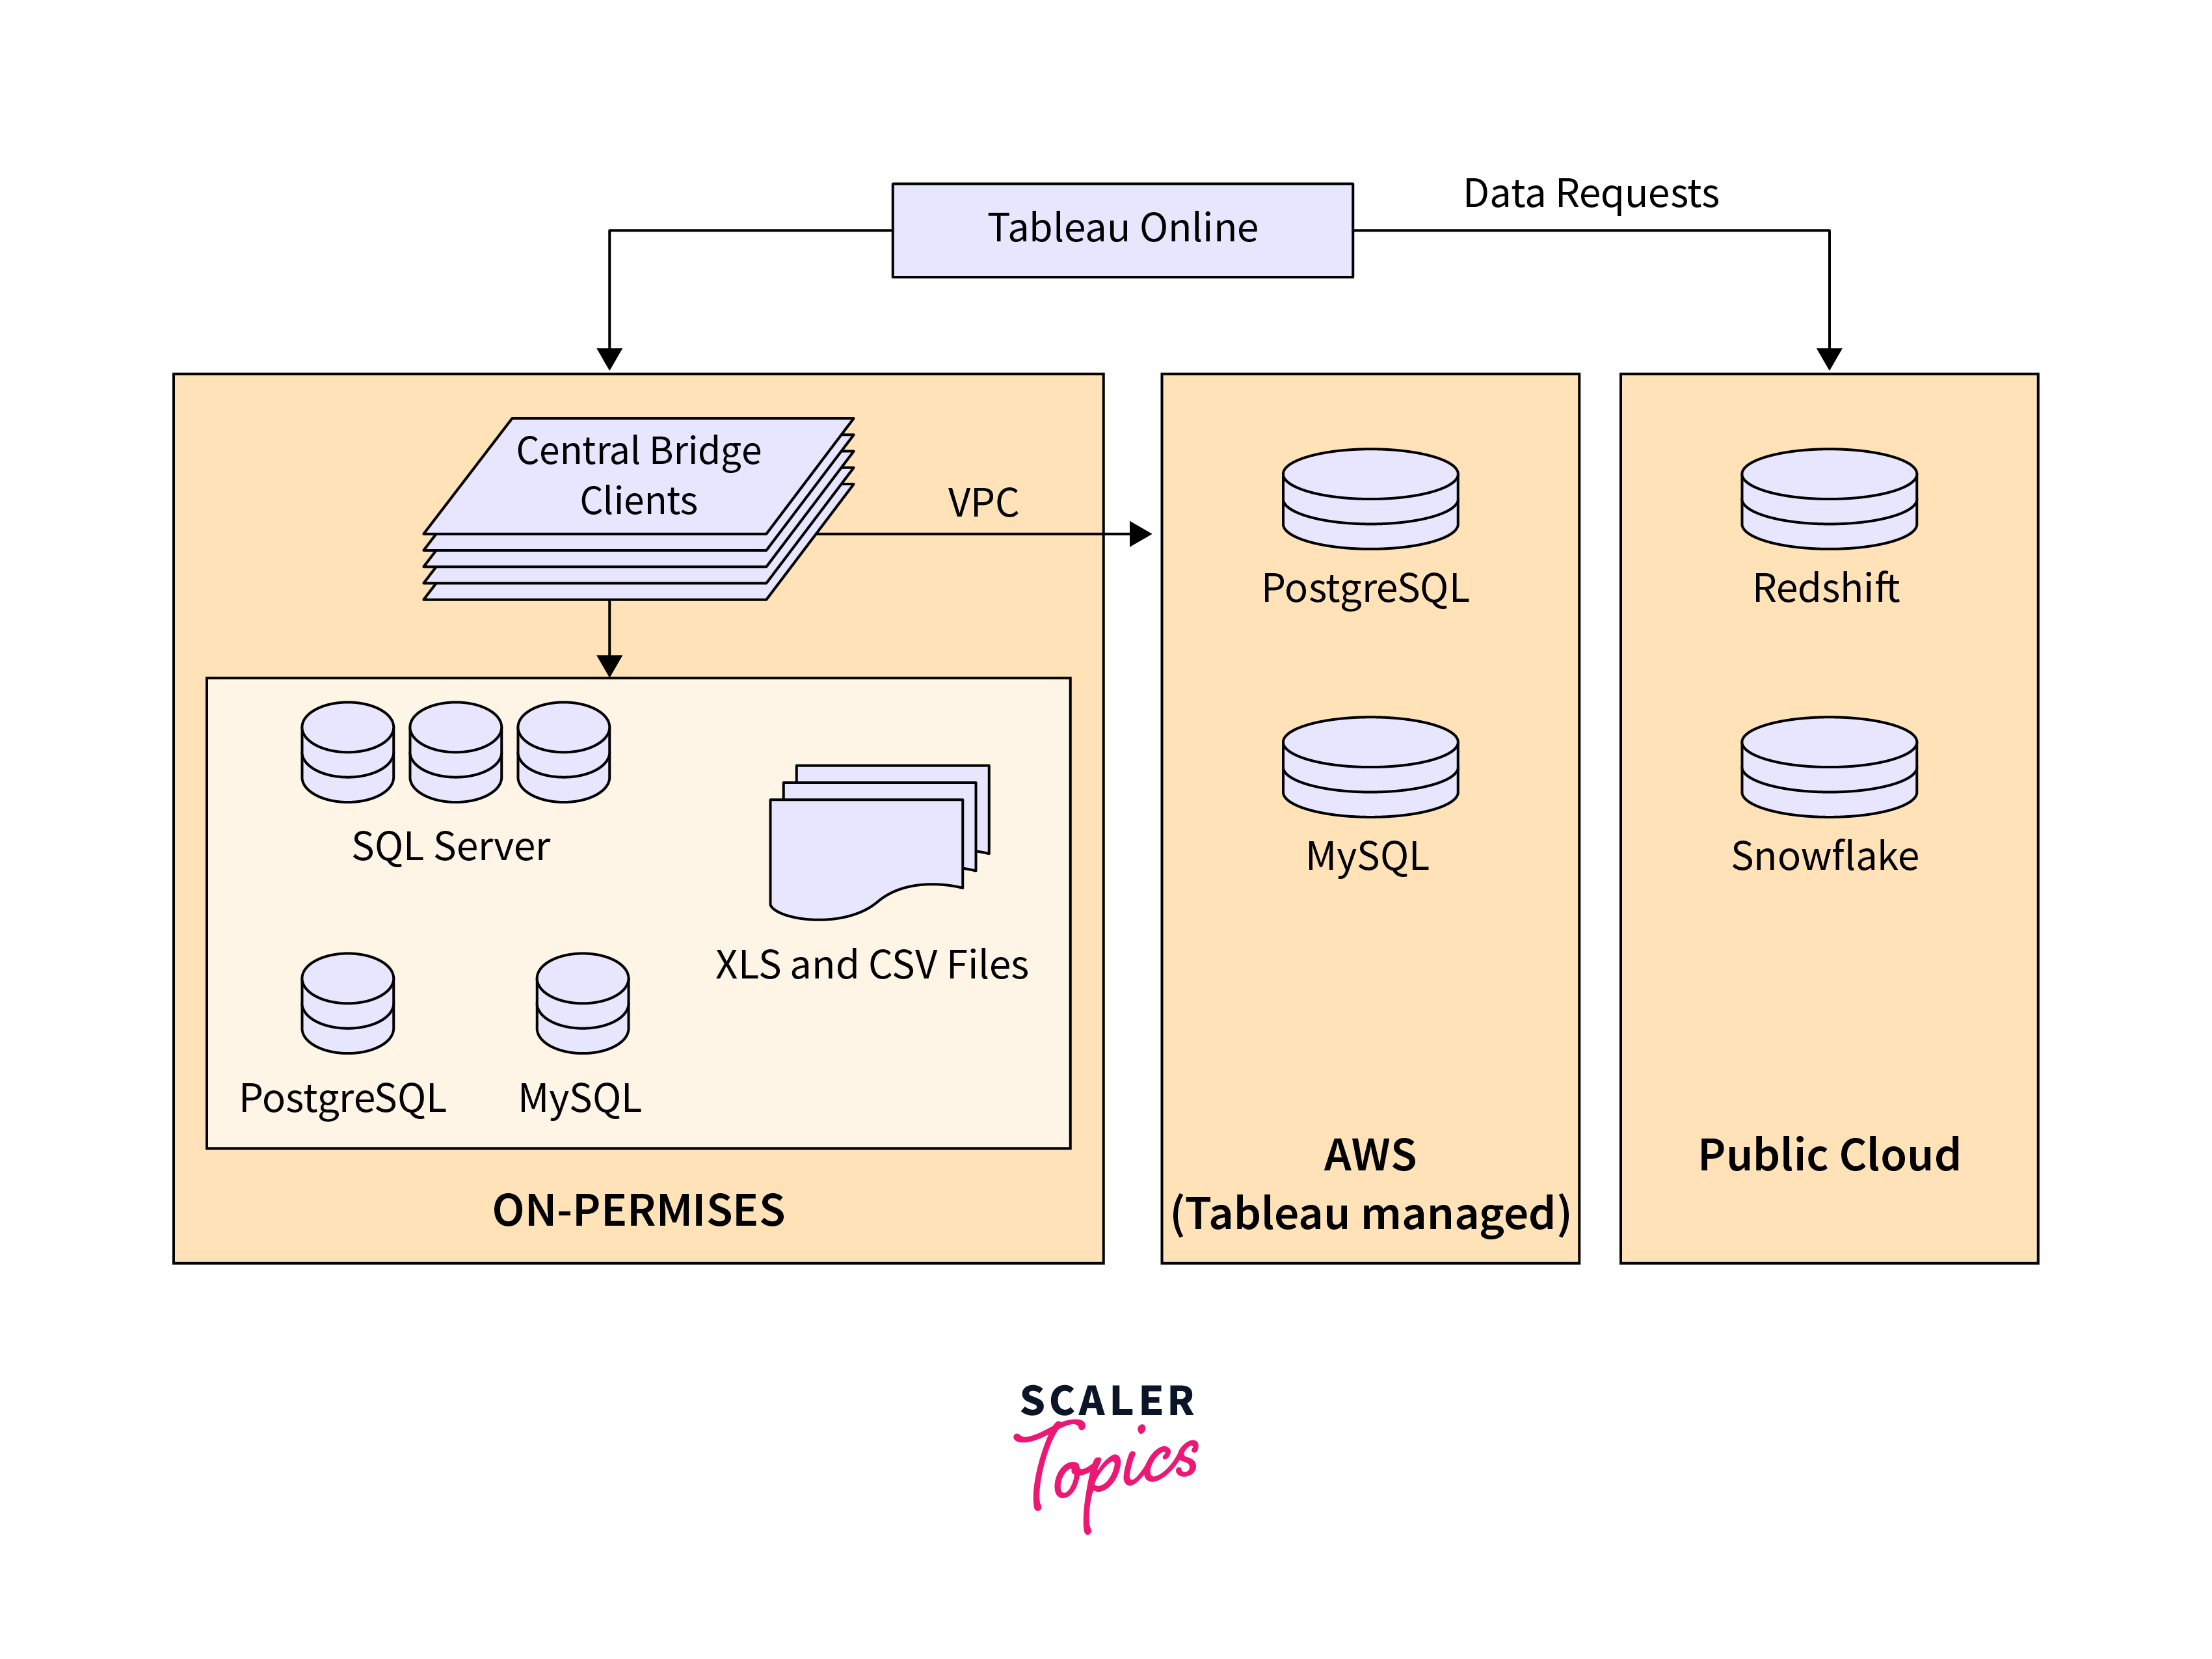
Various data sources such as SQL Server, PostgreSQL, MySQL, Redshift, Snowflake, Google Big Query, and flat files are managed across multiple networks. The data connections for the Public Cloud are made directly while for private connections, the pool for Tableau Bridge services is facilitated. This is done for live or on-premises or VPC database query capabilities, along with the scheduled extract refreshes.
The Different Components of the Tableau Architecture
As already covered, it is the Tableau Server that plays a vital role in the entire Tableau architecture. Tableau server was thoughtfully designed for managing as well as executing any key process. Now to leverage the benefits offered by the Tableau Server, it is crucial to understand each of the components that make it up. This will help us learn more about Tableau architecture.
Below is an illustration of the different components of Tableau architecture. Let us deep dive into these components offered by Tableau Server and understand their working.
Data server
The starting part of the Tableau Architecture is the Data Server. It is this section of the architecture where a user is able to extract the data from various data sources such as SAP, Oracle, Salesforce, Excel file, MySQL, Teradata, etc. To establish a data connection, the user can utilize any one of the two ways:
Live connection:
This connection helps to send instant queries to the data source, and the users can get the results instantly
Local copy:
Here, users can utilize either a live connection or extract the data directly into both Tableau Desktop and Tableau Server. A local copy can be stored as the temporary database for the data extracted from any data source.
Data Connector
With the help of the data connectors, users can connect external data sources with Tableau Data Server. The data connector offers an interface for establishing the connections. An in-built ODBC/SQL connector is present in Tableau. Without implementing the original connectors, users can connect the ODBC connector with all their required databases. With Tableau Desktop, users get a choice to select either live or extract data sources. The users can easily switch between the extract and the live data as well.
-
Real-time data or live connection
With the Real-time Data or Live Connection, users can connect Tableau directly with the database for extracting real-time data. The available database is queried using dynamic SQL statements as well as multidimensional expressions (MDX). This can be used as a live connection with Tableau for use cases such as importing data. -
Extracted or in-memory data
For extracted or in-memory data, Tableau has proven to be the best choice for extracting data from specific data sources. In various organizations, the size of the database is large and it gets updated regularly. A local copy of this data can be built in the form of a Tableau extract file. The storage that the data engine of Tableau utilizes is Cache, ROM, and RAM for storing and processing the data. Tableau can extract records by applying filters from the larger dataset. This improves performance while working with Big Data.
Components of Tableau Server
The Tableau server has three major components:
- Application Server
- VizQL Server
- Data Server
Let us deep dive into each one by one.
-
Application server
To offer proper authorization and authentication, users can utilize the application server. Both the administration and the permission for web and mobile interfaces are handled by the application server. The session ID generated for each session is recorded for security on the Tableau Server. The default timeout could also be set by the administrator on the server. Once the client's request passes the gateway, it collaborates with the application server. Here, processes such as login, authentication of the domain, data authorization, permission management for groups, content searches, etc are done. The application server works with the repository of the server and effectively handles the access for data operations. It also helps to deliver the processes that deal with the user interface. This user interface can be defined as the window that shows the overview of the workbooks as well as projects to the users for which they have been authenticated. -
VizQL server
The VizQL server is an abbreviation for Visual Query Language. For conversion of the queries into visualizations, users can implement the VizQL server. Queries are obtained from multiple data sources. These are sent via a request from the client to the VizQL process. The information is retrieved as images. It is this visualization that is presented to the user.
To reduce the load time while presenting the dashboard to the users, the Tableau server creates a cache of visualization. With this cache, users who have permission to view the visualization can have a look at this visualization when shared. This caching property also helps in improving performance and editing tasks.
The process starts with a user making a request for creating a visualization or sometimes updating the existing one. Once the request is received by VizQL, it is converted as an SQL statement, which is then sent to the various data sources from its corresponding data source drivers. Then, the data which was requested for visualization is sent back to the VizQL server. Here, it is further processed for some concluding remarks and sent back to the user. For new visualization, caching is done in VizQL for future use. -
Data server
For managing and storing the data from any external sources, users can implement the data server. Data servers are referred to as the centralized and managed system for data. Significant details of the various datasets like calculated fields, parameters, metadata, sets, and groups can be found. Data server offers data storage, metadata management, extract management, data connection, data security, as well as driver deployment. The data server also assigns access control as well as acts as a proxy for the data origins. With the data server, users can avoid directly contacting the data source, as instead, it hosts the user queries.
Gateway
With the gateway, the user requests are directed to the defined Tableau components. To handle the requests well, specific load balances are used when the request is being passed. The gateway acts as the distributor of the procedures for its definite components. When the external load balancer is absent, the gateway acts as the load balancer. One primary server or gateway handles the entire process for any single-server configurations. The most widely used gateway server in Tableau is Apache Tomcat. For multiple server configurations, the primary server is one physical system, and others are implemented as worker servers.
Clients
Clients who want to view and edit the dashboard as per their requirements can use the Tableau Server. The visualizations and dashboards can be interactively built in the Tableau Server. A few examples of clients are Tableau Desktop, web browsers, and mobile applications.
The end users of Tableau are termed as the clients who can view the dashboards via the web or mobile applications, over the cloud, on-premise, or even from the command-line interface for their use case-specific development. These end-users interact mainly with Tableau Server for accessing workbooks or visualizations. The components of the server work as per the request made from the client's side.
-
Web Browser
Tableau Server is supported by various web browsers such as Google Chrome, Safari, and Firefox. The interactive visualization as well as the contents in the dashboard can be easily edited via any of these web browsers. -
Mobile Application
Users can also view the dashboard in the mobile application. The mobile application and browser can be used to interactively visualize the dashboard from the server. The mobile application can also be used to view the contents of the Tableau workbook. -
Tableau Desktop
Tableau Desktop can be viewed as a business analytics tool. With Tableau Desktop, users can view, create, as well as publish the dashboard on the Tableau Server. Multiple data sources can be accessed by the users and visualization can be created on the Tableau Desktop.
Advantages of Tableau Server
Listed below are the advantages offered by the Tableau architecture:
- Metadata management along with security permissions is available at any level.
- Users can easily scale up and scale out the Tableau architecture as it is multi-threaded and has multi-process enabled in it.
- Offers integrated clustering which enables high availability.
- Ability to run on virtual as well as physical machines.
- Tableau architecture is secure.
- External databases can be utilized for visualizations with the Tableau architecture with streaming live data.
- Interactive dashboards can be created and shared between users.
- With the Real-time Data or Live Connection, users can connect Tableau directly with the database for extracting real-time data. The available database is queried using dynamic SQL statements as well as multidimensional expressions (MDX).
- The data visualizations can be viewed from Tableau Mobile, Desktop, or even the Web.
- Tableau Server can translate data queries into visualizations.
Conclusion
- The Tableau tool can be defined as a visual analytics platform that provides its users the flexibility to transform the way in which data can be visualized.
- Clients who want to view and edit the dashboard as per their requirements can use the Tableau server. The visualizations and dashboards can be interactively built in the Tableau server.
- The various components in the Tableau architecture are Gateway, Application Server, VizQL Server, Data server, Data connectors, Repository, and Clients.
- With the Real-time Data or Live Connection, users can connect Tableau directly with a database for extracting real-time data. This makes it an optimized and fast system.
- Interactive and sharable dashboard can be created by Tableau which depicts trends, and variations in data via graphs as well as charts. Real-time data analysis is the key distinguishing factor offered by Tableau Desktop.