Data Model in Tableau
Overview
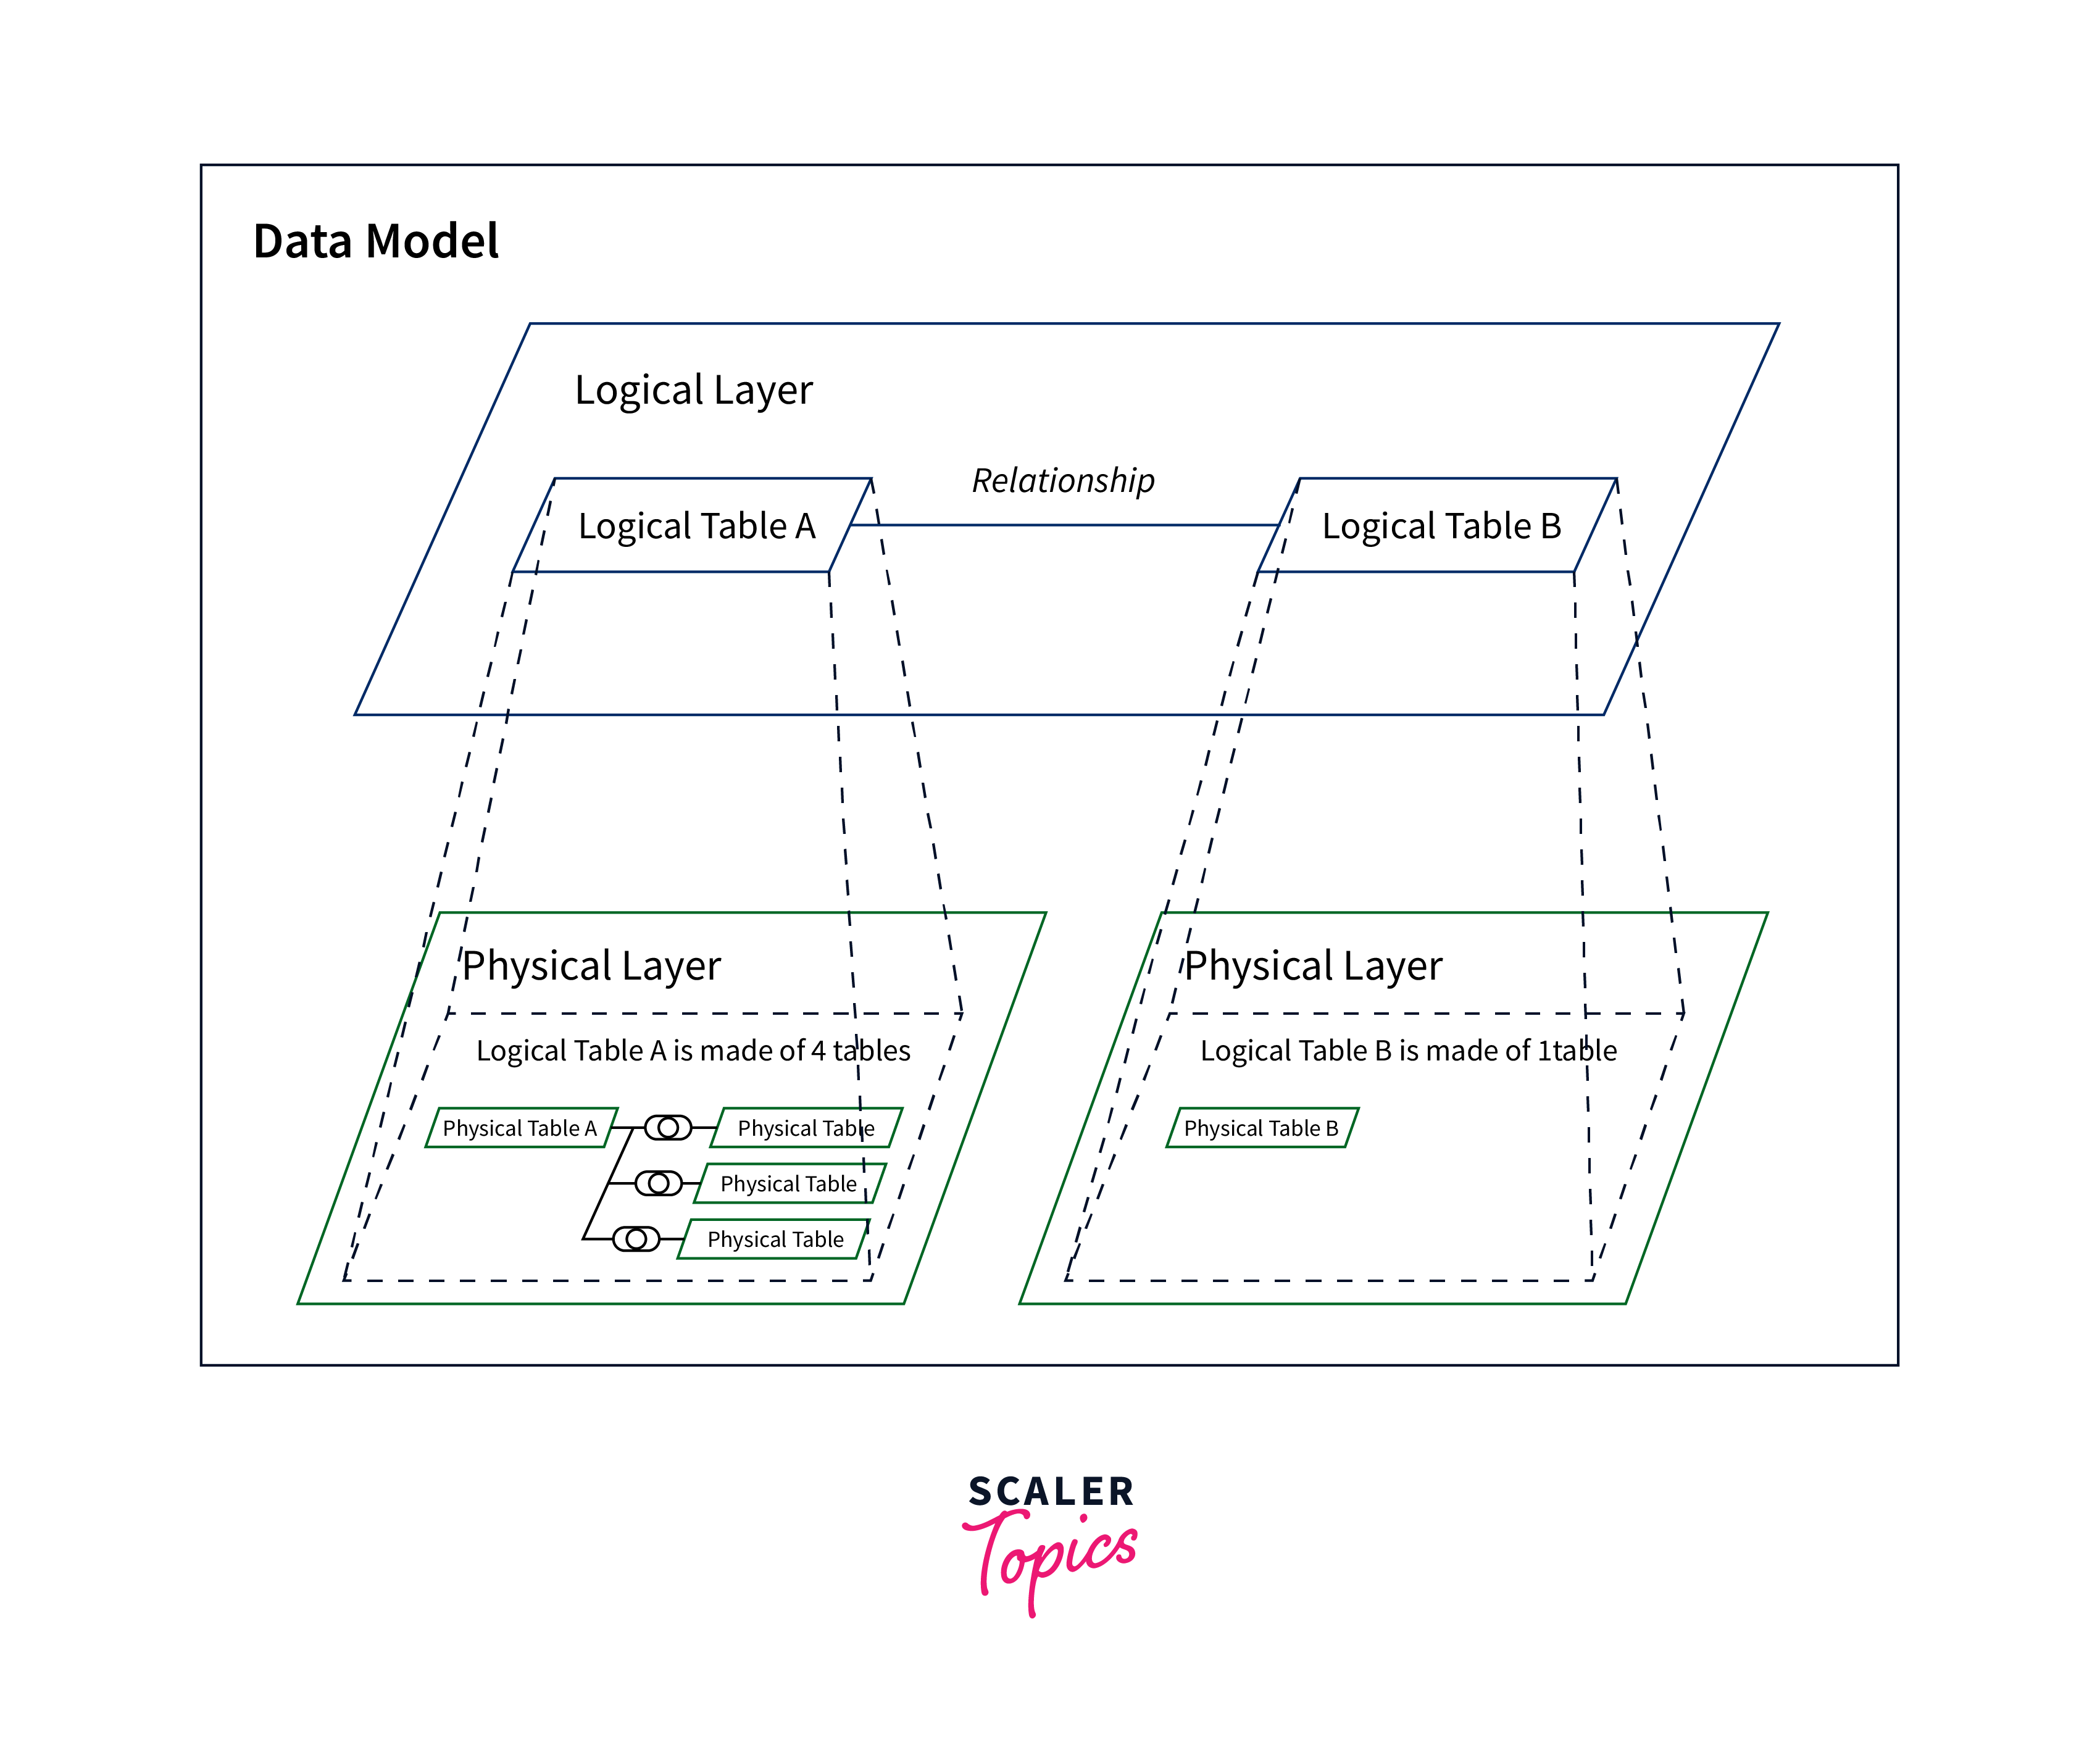
A data model in Tableau is a structured representation of how data is organized, connected, and related within a dataset. It defines how tables, fields, and their relationships interact, forming the foundation for creating insightful visualizations. Tableau's data model accommodates various data sources, including databases, spreadsheets, and cloud-based platforms. By defining relationships between tables, users can seamlessly join, blend, and transform data to create meaningful insights. The data model supports hierarchical, categorical, and numerical data, enabling users to create dynamic dashboards and visualizations that reveal patterns and trends. A well-designed data model ensures accuracy, consistency, and optimal performance in data analysis, helping users derive actionable insights from complex datasets.
Data Sources and Connections in Tableau
Data sources and connections are fundamental components of Tableau that enable users to access and analyze diverse datasets, fueling insightful visualizations and reports. Here's a comprehensive overview of data sources and connections in Tableau:
Data Sources:
Data sources are the origin points of information that Tableau taps into for analysis. These sources can range from databases (SQL, NoSQL), spreadsheets (Excel, Google Sheets), cloud platforms (Amazon Redshift, Google BigQuery), web services, and more. Tableau's compatibility with a wide array of data sources ensures flexibility in handling different types of information.
Data Connections:
Data connections, on the other hand, are the bridges that link Tableau to these data sources. They establish a secure and dynamic link, allowing Tableau to retrieve, process, and visualize data in real-time. Tableau provides several ways to establish connections:
-
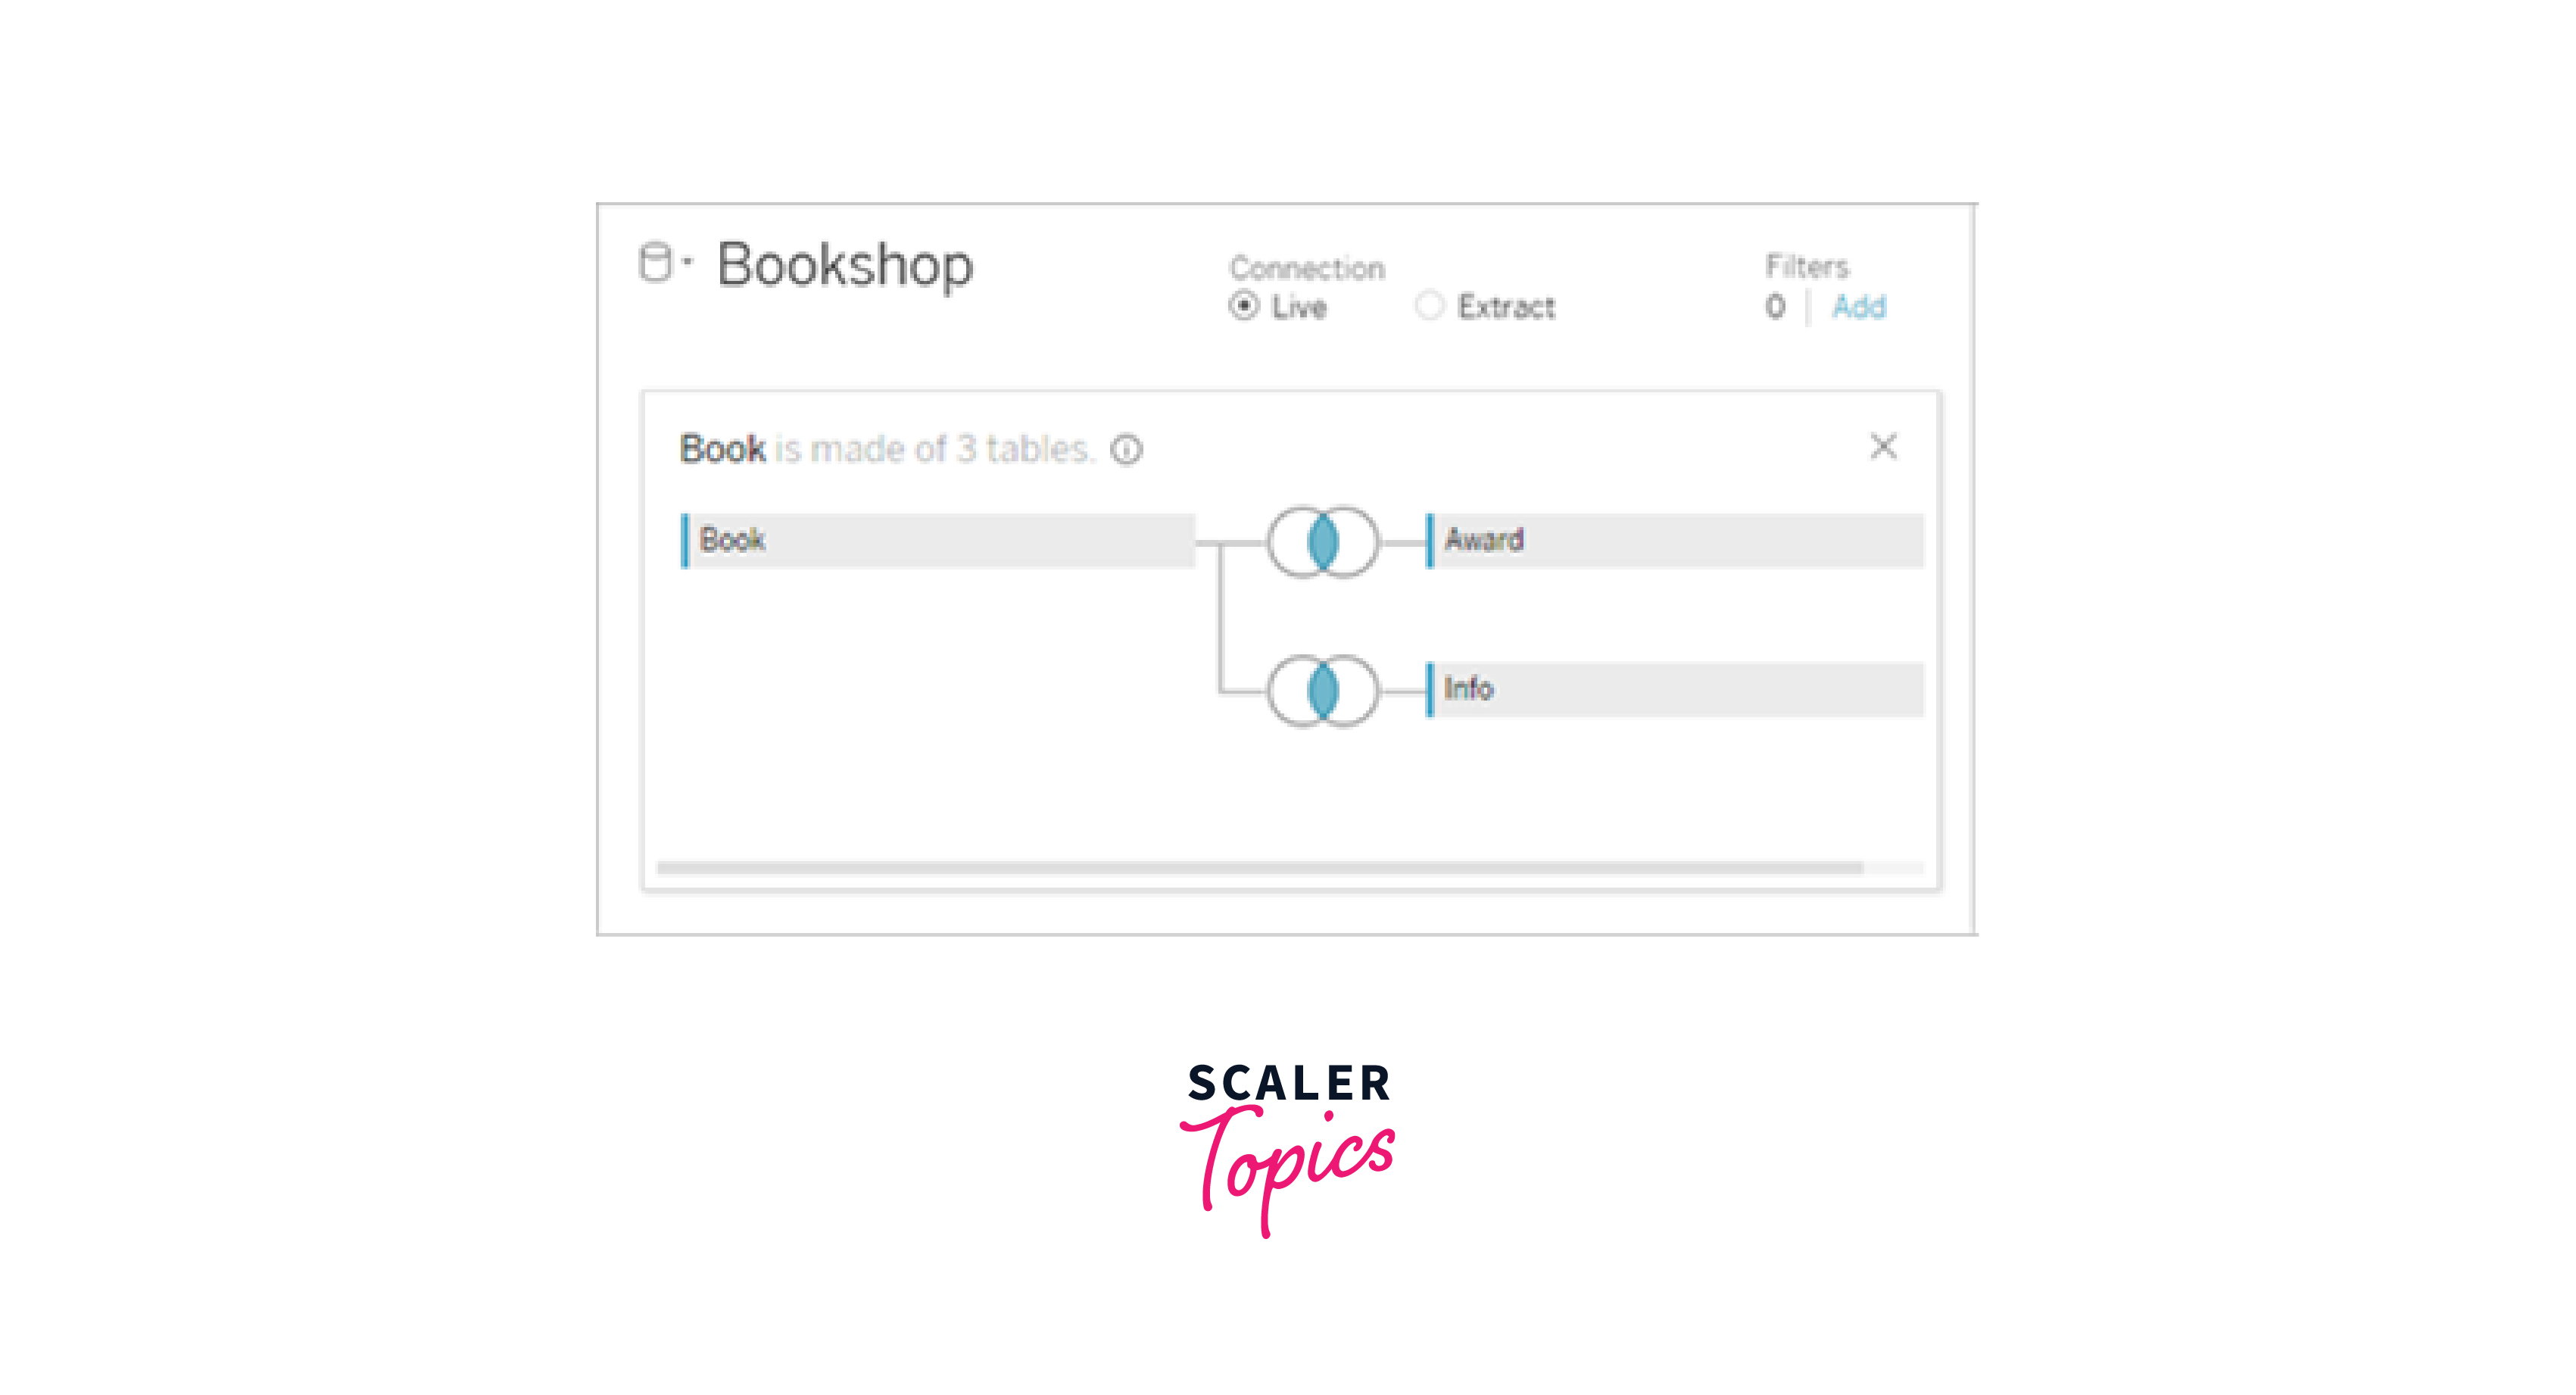
Live Connection:
Tableau connects directly to the data source, enabling real-time analysis. It's suitable when data freshness is crucial, but it may require robust server and network performance.
-
Extract Connection:
Tableau creates a static snapshot (extract) of the data, which is optimized for faster performance. Extracts can be scheduled for refresh, providing a balance between performance and real-time data.
Key Aspects:
-
Schema Mapping:
Tableau automatically detects and maps data source schema, simplifying the process of creating visualizations.
-
Data Preparation:
Users can cleanse, reshape, and transform data within Tableau using calculated fields, calculated tables, and other features.
-
Data Blending:
Tableau can blend data from multiple sources, allowing for holistic analysis and correlation.
-
Join and Relationship:
Tables from the same or different data sources can be joined or related based on common fields to create cohesive datasets.
-
Custom SQL:
Advanced users can use Custom SQL to create tailored queries to retrieve specific data.
-
Performance Optimization:
Tableau's "Data Engine" accelerates query execution, enhancing performance even with large datasets.
Data Preparation and Cleaning
Transforming Data for Analysis
Transforming data for analysis in Tableau is a pivotal step that ensures your data is clean, structured, and ready to reveal meaningful insights. Here's a comprehensive guide on how to transform data effectively within Tableau:
-
Connect to Data Source:
Begin by connecting to your data source in Tableau Desktop, whether it's a database, spreadsheet, or cloud-based repository.
-
Data Profiling:
Use the data profiling feature to gain an initial understanding of your data's characteristics, such as data types, null values, and unique values.
-
Data Cleansing:
Address inconsistencies, errors, and missing values in your dataset. Utilize tools like calculated fields and data cleaning functions to clean and standardize your data.
-
Data Reshaping:
Pivot and unpivot data as needed to reshape it into a format suitable for analysis. This is particularly useful for time-series data and comparison analysis.
-
Data Aggregation:
Aggregate data to higher levels (sum, average, count) for summary analysis. Tableau's aggregation functions facilitate this process.
-
Creating Calculated Fields:
Craft calculated fields to derive new insights from existing data. You can perform calculations, apply logic, and generate new metrics based on your requirements.
-
Creating Parameters:
Parameters allow you to introduce dynamic elements to your analysis. Users can adjust parameters to view different scenarios or compare variables.
-
Data Blending:
If working with multiple data sources, use data blending to combine datasets and discover relationships that might not be apparent in individual sources.
-
Data Grouping and Binning:
Group categorical data into logical clusters or create bins to categorize numerical data, enhancing visualization and analysis.
-
Hierarchies and Drill-Downs:
Establish hierarchies to enable users to drill down from high-level summaries to granular details, enhancing interactivity.
-
Filters and Sets:
Apply filters and sets to focus on specific data subsets. This enhances visualization clarity and supports targeted analysis.
-
Time-Series Analysis:
Leverage Tableau's date functions to analyze time-series data, detect trends, and identify seasonality patterns.
-
Data Aggregations:
Utilize data aggregation functions like SUM, AVG, MAX, and MIN to calculate metrics based on your analysis goals.
Handling Missing Values and Data Quality Issues
Handling missing values and data quality issues within a data model in Tableau is crucial to ensure accurate insights and meaningful analysis. Here's how to address these challenges effectively:
-
Identify Missing Values:
Start by identifying columns with missing values. Tableau's data profiling features can help you understand the extent of missing data in your dataset.
-
Understand Causes:
Determine why values are missing. Is it due to data entry errors, system issues, or other factors? This insight will guide your approach to handling missing values.
-
Imputation Strategies:
Depending on the situation, consider imputing missing values. Common imputation methods include replacing missing values with averages, medians, or using predictive modeling.
-
Visual Inspection:
Visualize your data to spot patterns of missing values. This could reveal insights into why certain data points are missing and suggest appropriate remedies.
-
Create Indicator Columns:
For categorical variables, consider creating binary indicator columns that denote whether a value is missing or not. This can help preserve the information that a value was originally missing.
-
Data Validation Rules:
Implement validation rules to catch data quality issues during data entry or import. This prevents the introduction of incorrect or missing values.
-
Data Profiling Tools:
Leverage Tableau's data profiling tools to identify data quality issues beyond missing values, such as outliers, inconsistencies, and anomalies.
-
Data Cleaning Functions:
Use calculated fields to clean data, removing leading/trailing spaces, converting text to proper case, and more.
-
Filters and Exclusions:
Apply filters to exclude records with critical missing values from your analysis, ensuring that incomplete data doesn't skew results.
-
Documentation:
Maintain documentation that outlines data quality issues, the steps taken to handle them, and the impact on analysis outcomes.
-
Data Lineage:
Establish a clear data lineage to understand the origin and transformation of data. This aids in tracing back data quality issues to their source.
-
Collaboration:
Engage with data stakeholders to ensure that your handling of missing values aligns with the context of the data and the analysis goals.
-
Iterative Process:
Addressing missing values and data quality is often an iterative process. Continuously monitor the impact of your actions on analysis results.
Filtering and Sorting Data
Filtering and sorting data within a data model in Tableau are essential techniques to refine your dataset and present insights more effectively. Here's a guide on how to perform filtering and sorting:
Filtering Data:
-
Basic Filters:
Apply basic filters to restrict data displayed in visualizations. Right-click on a field and select "Show Quick Filter" or use the filter shelf to define conditions.
-
Data Source Filters:
Set filters at the data source level to restrict data retrieval before it reaches Tableau. This enhances performance by fetching only relevant data.
-
Context Filters:
Context filters allow you to create a subset of data that other filters reference. They help you focus on specific segments of your data without affecting other visualizations.
-
Top N / Bottom N Filters:
Display only the top or bottom N values based on a selected measure, useful for focusing on high-impact data points.
-
Dimension Filters:
Filter data based on dimensions (categorical variables) to focus on specific categories or segments.
-
Measure Filters:
Filter data based on measures (numerical variables) to highlight specific ranges or thresholds.
Sorting Data:
-
Default Sorting:
Tableau typically sorts data in ascending order. Click on a column header to sort the data based on that column.
-
Custom Sorting:
For custom sorting, right-click on a dimension, choose "Sort," and select either manual sorting or sort by a field.
-
Sort by Measure:
Sort data by a measure (numerical value) to prioritize items based on their significance.
-
Descending Sorting:
To sort data in descending order, click on a column header a second time or choose the descending sort option.
-
Sort by Formula:
Create calculated fields to define custom sorting logic based on your analysis needs.
-
Sort by Dimension Values:
For specific visualizations, you can sort data based on the values in a different dimension.
Data Joins and Blending
Joining Tables in Tableau
Joining tables in Tableau is a fundamental process that allows you to combine data from multiple tables based on shared fields. This enables you to create comprehensive datasets for analysis and visualization. Here's a step-by-step guide on how to join tables in Tableau:
-
Connect to Data Source:
Start by connecting to your data source(s) in Tableau Desktop.
-
Drag and Drop Tables:
Drag the tables you want to join from the "Connections" pane onto the canvas area in the main window.
-
Identify Key Fields:
Identify the common fields (keys) between the tables that you'll use to join them. These fields should have similar data types and values.
-
Add Join Clause:
Click and drag one of the common fields from one table to the corresponding field in the other table. A "Join" dialog box will appear.
-
Select Join Type:
Choose the appropriate join type:
- Inner Join: Returns only matching rows from both tables.
- Left Join: Returns all rows from the left table and matching rows from the right table.
- Right Join: Returns all rows from the right table and matching rows from the left table.
- Full Outer Join: Returns all rows from both tables, including unmatched rows.
-
Specify Additional Join Conditions:
If necessary, you can add more conditions to refine the join, such as non-equality comparisons.
-
Preview and Adjust:
Preview the results of the join to ensure it's correct. Adjust join conditions or types if needed.
-
Join More Tables:
If you need to join more tables, repeat the process, ensuring you connect the appropriate fields.
-
Blend Data:
If you're working with data from different data sources, use data blending to combine data from separate connections.
-
Create Visualizations:
Once tables are joined, you can start creating visualizations and analysis using the combined dataset.
-
Maintain Hierarchy:
If joining hierarchical data, ensure that your join logic maintains the desired hierarchy.
Blending Data from Multiple Sources
Blending data from multiple sources in Tableau is a powerful technique that enables you to combine data from different databases, spreadsheets, or even cloud-based platforms to create unified visualizations and insights. Here's a step-by-step guide on how to blend data in Tableau:
-
Connect to Data Sources:
Start by connecting to your primary data source in Tableau Desktop, as you normally would.
-
Add Secondary Data Source: After connecting to the primary source, click on the "Add" button in the "Connections" pane to connect to your secondary data source.
-
Define Common Dimensions:
Identify common dimensions (fields) that exist in both the primary and secondary data sources. These dimensions will serve as the basis for blending.
-
Create Relationship:
Drag a dimension from the primary source and drop it onto the corresponding dimension in the secondary source. This establishes a relationship for blending.
-
Configure Blending Options:
Once a relationship is created, Tableau will automatically detect the blending fields and offer options to configure how the data should be blended.
-
Join Type and Aggregation:
Specify the join type (left or inner join) and choose the aggregation method for measures from the secondary source. Common aggregation methods include SUM, AVG, MAX, MIN, etc.
-
Add to Visualization:
Create a visualization that uses data from both sources. Fields from the primary and secondary sources will be available in the "Data" pane for building visualizations.
-
Visualize and Analyze:
Use the blended data to create visualizations that showcase insights from multiple sources combined seamlessly.
-
Additional Blending:
If needed, you can blend data from multiple secondary sources by establishing relationships for each one.
-
Data Validation:
Ensure that the blended results are accurate by validating the combined data against your expectations and original sources.
-
Data Source Filters:
Apply filters to the primary and secondary data sources independently to limit data before blending. This can improve performance and data accuracy.
Resolving Data Relationship Issues
Resolving data relationship issues in Tableau is essential for accurate analysis and visualization. Here's a guide on identifying and addressing these issues:
-
Data Profiling:
Start by profiling your data to identify anomalies, missing values, and inconsistencies. This helps you understand the scope of the relationship issues.
-
Incompatible Data Types:
Ensure that fields used for relationships have compatible data types in both data sources. Convert data types if necessary.
-
Data Mismatch:
Verify that fields intended for relationships have matching values across sources. Address differences caused by case sensitivity, leading/trailing spaces, or typos.
-
Data Cleaning:
Cleanse data to remove unnecessary characters, spaces, and formatting discrepancies that could lead to relationship problems.
-
Common Fields:
Confirm that the fields you're using for relationships are indeed the ones that should be linked. Names and semantics should match.
-
Unique Values:
Ensure that fields used for relationships have unique values. Duplicate values can lead to incorrect aggregations.
-
Null Values:
Handle null values properly. Tableau treats null values as unique and may lead to unexpected results. Use ISNULL() or ZN() functions to manage nulls.
-
Data Blending:
If you're working with data from different sources, consider using data blending techniques to combine data without requiring direct relationships.
-
Aliases and Aggregations:
In cases where field names might be ambiguous or misinterpreted, use aliases to provide more descriptive names. Pay attention to how aggregations are applied.
-
Calculated Fields:
Create calculated fields to address data inconsistencies, transformation needs, or to create intermediate fields for linking.
-
Data Validation:
Regularly validate the results of relationships by cross-referencing with source data or using data validation tools.
-
Manual Review:
Review the relationship settings and results manually in your visualizations to spot any anomalies or unexpected behavior.
-
Debugging Techniques:
Use Tableau's preview and debug options to assess how relationships impact your visualizations and data blending.
-
Consult Documentation:
Refer to Tableau's official documentation, forums, and user communities for troubleshooting tips and insights from other users who might have encountered similar issues.
How to Ceate Calculated Fields and Measures ?
Introduction to Calculated Fields
Calculated Fields in Tableau are a dynamic and transformative feature that empowers users to derive new insights, perform custom calculations, and manipulate data within their visualizations. Essentially, a calculated field is a user-defined expression created using existing fields, functions, operators, and constants. This enables analysts to craft tailored formulas to meet specific analytical needs, even if the required data isn't directly available in the source.
Calculated Fields open a realm of possibilities, from aggregating data and generating new metrics to creating conditional logic and formatting. Whether it's computing percentages, applying complex mathematical operations, or creating custom categories, calculated fields empower users to mold their data to fit their analysis objectives precisely.
The flexibility of Calculated Fields is particularly beneficial when addressing unique business scenarios or working with data transformations that can't be achieved through traditional fields alone. They seamlessly integrate into visualizations, dashboards, and reports, enriching data narratives and enabling users to explore insights that extend beyond the initial dataset.
Common Calculations and Expressions
In Tableau, a plethora of common calculations and expressions empower users to manipulate, analyze, and visualize data in versatile ways. Aggregation functions, such as SUM, AVG, MIN, and MAX, facilitate the computation of summary statistics, offering insights into data trends and patterns. Mathematical operators, like +, -, *, and /, enable users to perform calculations that combine fields or constants, making it effortless to derive new metrics or ratios. Conditional expressions, including IF, CASE, and IIF, add a layer of logic, allowing analysts to create dynamic calculations based on specified conditions.
Date functions let users extract information from date fields, compute differences, and generate customized date formats, enriching temporal analysis. String functions like CONCATENATE, LEFT, RIGHT, and LEN aid in manipulating text-based data, such as creating concatenated fields or extracting substrings. Tableau's LOD (Level of Detail) expressions provide a robust way to perform calculations across different levels of granularity, addressing complex analytical scenarios.
Custom aggregations allow users to define unique summary measures, while WINDOW functions facilitate calculations over a specified range of data points, offering moving averages and ranking insights. Moreover, the inclusion of parameters, which are dynamic user inputs, adds interactivity to calculations, allowing users to adjust parameters to observe their impact on visualizations.
Aggregations and Level of Detail (LOD) Expressions
Aggregations and Level of Detail (LOD) Expressions are two powerful concepts in Tableau that enable users to perform complex calculations, providing a deeper understanding of data trends and relationships. Here's an overview of both:
-
Aggregations:
Aggregations involve summarizing data to gain insights into patterns, trends, and statistical measures. Common aggregation functions include SUM, AVG, MIN, MAX, and COUNT. These functions condense data to a higher level of granularity, such as summing sales by month or averaging profits by region. Aggregations are crucial for producing summary information for visualization and analysis.
-
Level of Detail (LOD) Expressions:
LOD Expressions extend beyond traditional aggregations by allowing users to compute values at different levels of detail within a visualization, irrespective of its view. There are three types of LOD expressions:
-
Fixed:
Computes a value based on a specified level of dimensions, regardless of the view's dimensions.
-
Include:
Computes a value by considering the dimensions specified in the expression, in addition to the dimensions in the view.
-
Exclude:
Computes a value by excluding the dimensions specified in the expression, while considering other dimensions in the view.
-
LOD Expressions:
LOD Expressions are beneficial when you need to create calculations that reference data outside the current level of detail, such as calculating a running total across a partition, regardless of the visualization's dimensions.
-
Conclusion
- The data model organizes data into tables, fields, and relationships, enhancing clarity and accessibility.
- By defining relationships, data from multiple sources can be combined seamlessly to uncover connections and correlations.
- Hierarchies within the data model allow users to navigate from broad summaries to granular details, fostering comprehensive exploration.
- Calculated fields enable custom calculations and transformations that extend beyond raw data, enriching analyses.
- The model provides a unified data source for multiple visualizations, ensuring consistency and reducing redundancy.
- The data model supports data validation, cleaning, and transformation, maintaining data accuracy and quality.
- The model can be adapted as analysis needs to evolve, accommodating changes in data sources and business requirements.