Data Transformation in Tableau
Overview
Data Transformation in Tableau involves converting and shaping raw data into a structured and usable format for analysis and visualization. With intuitive drag-and-drop functionality, Tableau enables users to clean, filter, pivot, aggregate, and join data from various sources. Transformations encompass tasks like data cleansing, creating calculated fields, applying filters, and reshaping data structures. This process enhances data quality, optimizes data for analysis, and facilitates the creation of insightful visualizations. Through its user-friendly interface, Tableau empowers users to perform these transformations effortlessly, allowing for efficient exploration and presentation of data-driven insights.
 :
:
How to connect to Data Sources in Tableau?
Importing Data from Files and Databases
In the realm of data transformation within Tableau, importing data from files and databases is a pivotal step. Tableau simplifies this process by offering seamless integration with a variety of data sources.
When importing data from files such as Excel, CSV, or JSON, Tableau's intuitive interface allows users to effortlessly select the desired file and map its contents to the appropriate fields. This dynamic mapping ensures data consistency and accuracy during the import process.
Connecting to databases is equally straightforward. Tableau supports numerous database platforms, including SQL-based systems like MySQL, PostgreSQL, and Microsoft SQL Server. Through established connectors, users can securely access data by specifying connection details and credentials. Once connected, users can visualize, clean, and transform the data directly within Tableau.
Regardless of the data source, Tableau provides data profiling tools that offer insights into the imported data's characteristics, helping users identify potential issues or inconsistencies. These tools contribute to a smoother data transformation process by enabling informed decisions on data cleaning and transformation strategies.
Overall, Tableau's capability to effortlessly import data from files and databases forms the foundation of effective data transformation. This streamlined process enables users to work with diverse datasets, ensuring that the subsequent analysis and visualization stages are based on accurate, reliable, and well-prepared data.
Connecting to Cloud-based Data Sources
In the realm of data transformation within Tableau, connecting to cloud-based data sources has become increasingly essential as organizations adopt cloud computing. Tableau offers seamless integration with various cloud platforms, simplifying the process of accessing, transforming, and analyzing data stored in cloud environments.
Cloud-based data sources encompass platforms like Amazon Web Services (AWS), Microsoft Azure, Google Cloud Platform (GCP), and others. Tableau's connectors enable users to securely connect to these sources without the need for complex configurations. Users provide authentication details and connection parameters, and Tableau handles the rest.
The process begins by selecting the appropriate cloud connector within Tableau's interface. This might involve choosing Amazon Redshift for AWS, Azure SQL Database for Microsoft Azure, or Google BigQuery for GCP. Once selected, users input their credentials and specify the desired data to import.
Tableau's cloud connectivity doesn't merely stop at importing data; it extends to data transformation as well. Users can leverage Tableau's familiar interface to clean, filter, pivot, and aggregate cloud-based data in preparation for analysis. This capability eliminates the need to export data to on-premises systems for transformation, streamlining the overall workflow.
Web Data Connectors (WDCs) are a powerful feature within Tableau that facilitate data transformation by allowing users to fetch and integrate data from web-based sources directly into their Tableau workflows. WDCs are particularly useful for connecting to APIs, online databases, and other web services that host valuable data for analysis.
Using WDCs in data transformation involves the following steps:
- Creating a Web Data Connector: Developers or users with technical knowledge can create a custom WDC using HTML, JavaScript, and Tableau's WDC API. This involves defining the URL endpoints to the web data source and specifying the data retrieval and transformation logic.
- Connecting to the WDC: In Tableau Desktop, users can connect to a WDC by selecting "Web Data Connector" as the data source. They then provide the URL of the WDC they want to connect to.
- Fetching Data: When the URL is entered, Tableau opens a browser window displaying the custom interface of the WDC. Users can interact with the WDC to retrieve specific data or configure parameters for data retrieval.
- Data Transformation: Once the data is fetched from the web data source, it's possible to perform data transformation steps directly within Tableau. This includes cleaning, filtering, joining, and creating calculated fields.
Tableau's Data Preparation Tools
Tableau offers a suite of data preparation tools designed to simplify the process of cleaning, shaping, and transforming data before analysis. These tools are instrumental in ensuring that the data used for visualization and insights is accurate, consistent, and ready for analysis. Some of Tableau's prominent data preparation tools include:
- Data Interpreter: This tool automatically detects and addresses common data quality issues such as header rows, inconsistent formatting, and extra spaces. It's especially useful when dealing with messy Excel or CSV files.
- Data Connection: Tableau's data connection interface provides a user-friendly way to establish connections to various data sources, whether they are databases, cloud-based sources, web data connectors, spreadsheets, or flat files.
- Data Source Filters: You can apply data source filters to limit the data imported into Tableau, ensuring that only relevant subsets are brought in for analysis.
- Data Joining and Blending: Tableau allows you to combine data from different sources through data joining (within the same source) or data blending (across multiple sources). This is essential for bringing together disparate datasets and deriving insights from their relationships.
- Data Transformation: Tableau's calculated fields and data transformation functions empower users to create new fields, perform calculations, and apply transformations directly within the tool. This includes aggregations, filtering, and reshaping data.
Data Cleaning and Wrangling Techniques
Handling Missing Values and Nulls
Handling missing values and nulls is a critical aspect of data transformation in Tableau. Ensuring that data is clean and complete is essential for accurate analysis and visualization. Tableau offers several tools and techniques to address missing values and nulls during the data preparation process:
- Filtering: You can filter out rows with missing values using filters. This is useful when you want to exclude incomplete records from your analysis.
- Calculated Fields: Create calculated fields to replace or handle missing values. For example, you can use the IFNULL or ISNULL functions to replace null values with a default value or perform specific actions based on the presence of nulls.
- Data Source Filters: Apply data source filters to exclude null values from being imported into Tableau. This reduces the number of null values in your dataset right from the start.
- Aggregation: When working with aggregated data, Tableau provides options to handle nulls, such as treating them as zero or excluding them from calculations.
- Imputation: Imputing missing values involves filling in missing data points with estimated values. Tableau doesn't offer imputation methods directly, but you can use calculated fields to impute values based on averages, medians, or other strategies.
Dealing with Duplicates and Data Quality Issues
Dealing with duplicates and data quality issues is crucial for accurate and reliable analysis in Tableau. Tableau provides various tools and techniques to address these challenges during the data transformation process:
- Removing Duplicates: Use Tableau's "Remove Duplicates" feature to eliminate identical rows from your dataset. This helps ensure that each record is unique and prevents data duplication from affecting your analysis.
- Data Interpreter: When importing data, Tableau's Data Interpreter can automatically detect and address common data quality issues, including duplicate rows, inconsistent formatting, and extra spaces.
- Data Cleansing Functions: Utilize calculated fields to identify and address data quality issues. For instance, the TRIM function can remove leading and trailing spaces, and UPPER/LOWER functions can standardize text case.
- Data Quality Auditing: Implement calculated fields or reference lines to compare data points and identify inconsistencies, such as discrepancies between related fields.
- Data Source Filters: Apply filters during the data import process to exclude known problematic records or rows that contain data quality issues.
- Data Validation: Leverage calculated fields to validate data against predefined rules or thresholds, flagging records that don't meet quality criteria.
Standardizing and Formatting Data
Standardizing and formatting data is a critical step in data transformation within Tableau. Ensuring consistent data formats enhances analysis accuracy and supports meaningful visualizations. Tableau offers several techniques to achieve standardization and formatting:
- Calculated Fields: Use calculated fields to transform and standardize data. Functions like UPPER, LOWER, PROPER, and CONCATENATE can modify text data to a desired format.
- Custom Hierarchies: Create custom hierarchies to structure and group data, ensuring consistency in visualizations.
- Data Parsing: Split fields containing multiple data elements into separate fields using functions like SPLIT or LEFT/RIGHT. This ensures data uniformity for further analysis.
- Data Type Conversion: Convert data types to appropriate formats (e.g., converting strings to dates or numbers) to align with your analysis requirements.
- DATEPARSE Function: Use the DATEPARSE function to convert strings into date values based on a specified format.
- Data Cleaning Tools: Utilize Tableau Prep to visually design complex data cleaning workflows, enabling you to standardize and format data at a more advanced level.
- Calendars and Formats: Configure date and number formats within Tableau to ensure consistent presentation across visualizations.
Data Aggregation and Reshaping
Data aggregation and reshaping are fundamental processes in data transformation within Tableau, enabling analysts to summarize and restructure data for more effective analysis and visualization. These operations help distill complex information into meaningful insights and present it in a way that supports decision-making.
- Data Aggregation: Aggregation involves combining and summarizing data to provide a higher-level view of the information. Tableau offers several techniques for data aggregation:
- Basic Aggregation Functions: Tableau provides common aggregation functions like SUM, AVG, MIN, MAX, and COUNT. These functions allow you to aggregate numerical data, providing insights into trends and patterns.
- Grouping: By grouping data based on one or more categorical variables, you can create summarized views of data. Tableau allows you to easily group data and calculate aggregated values for each group.
- Level of Detail (LOD) Expressions: LOD expressions enable you to perform aggregations at different levels of granularity than your visualization. This flexibility is valuable when you want to analyze data across various dimensions without altering your underlying data structure.
- Bins: Binning allows you to aggregate continuous data into discrete ranges, helping in analyzing distributions and patterns.
- Totals and Subtotals: Tableau automatically generates totals and subtotals for aggregated data, allowing you to understand the overall picture while still retaining the ability to drill down into specific details.
- Data Reshaping: Reshaping data involves restructuring the layout of data to fit specific analytical needs. Tableau provides tools to reshape data for optimal analysis and visualization.
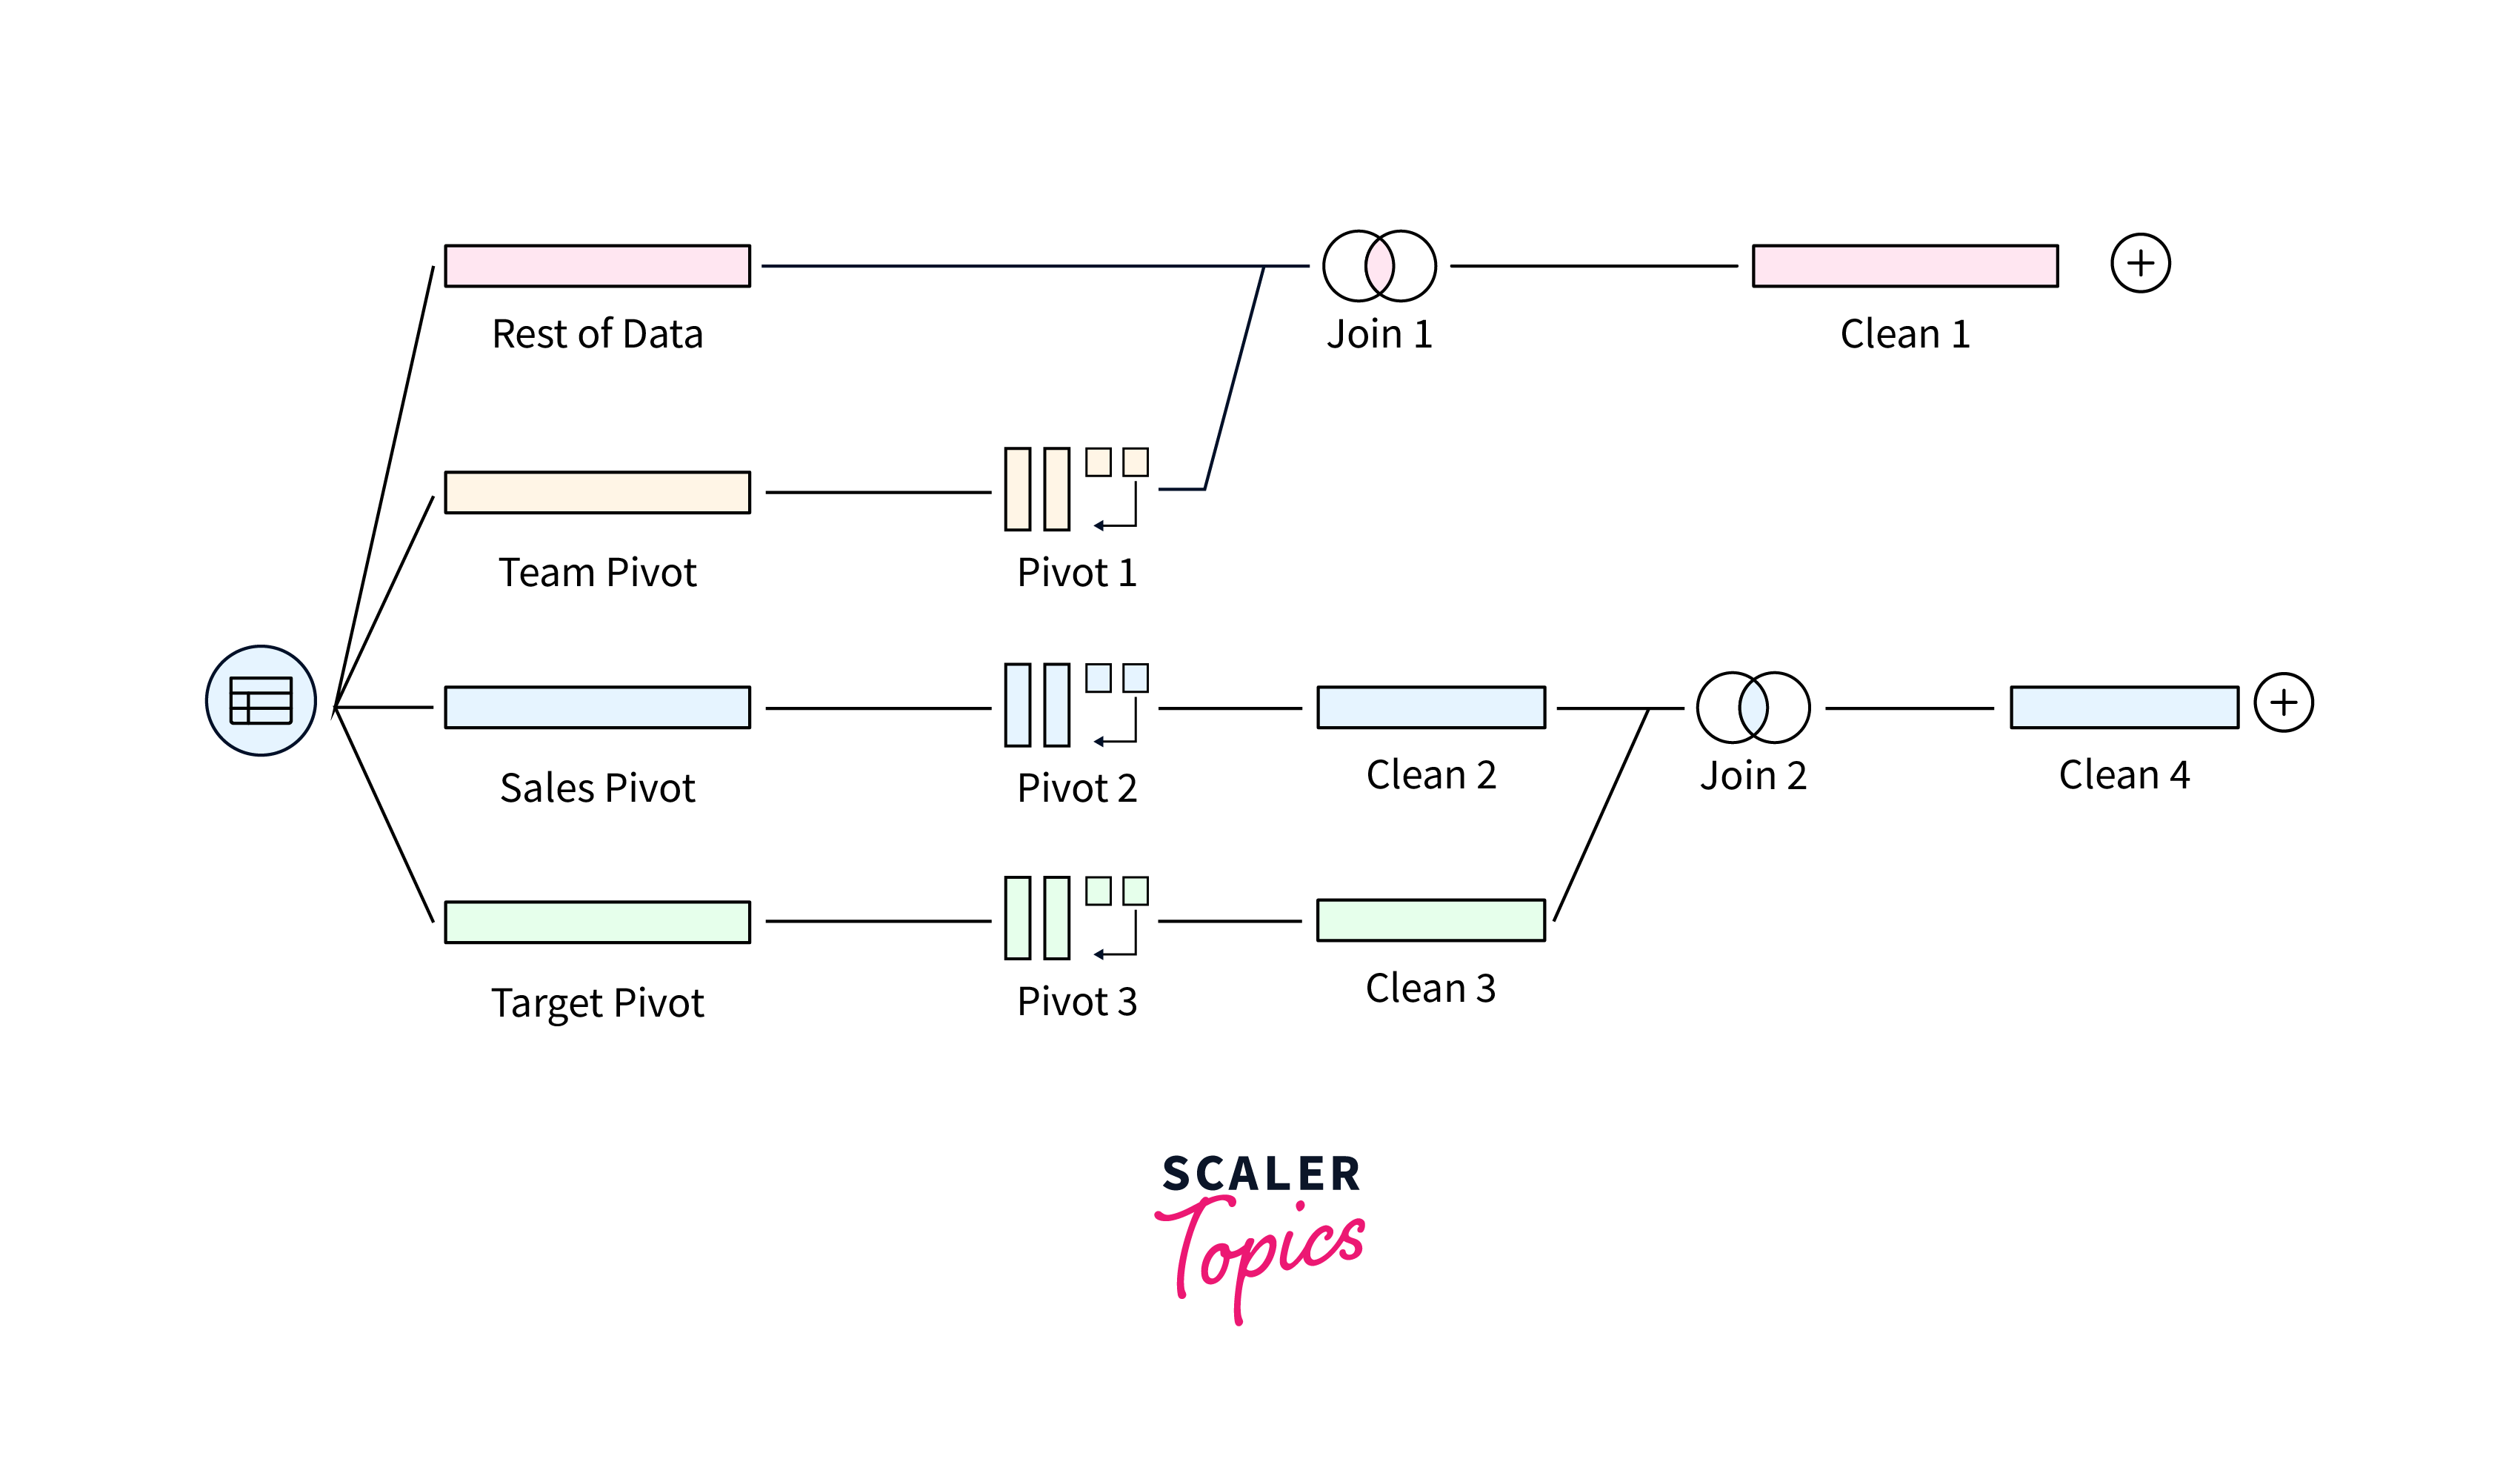
- Pivot and Split: The pivot and split functions allow you to transform a dataset from a wide format (many columns) to a tall format (fewer columns), and vice versa. This is useful when you need to reshape data to work with certain visualization types or analyses.
- UNION and Join: Combining data from multiple sources or tables using the UNION operation allows you to consolidate datasets with similar structures. Joining tables allows you to combine data with different structures based on common fields.
- Data Blending: When dealing with data from different sources, data blending enables you to combine datasets without physically merging them. This is particularly valuable when you have data residing in separate databases or spreadsheets.
- Data Scaffold: You can create a scaffold, which is a table of dates, to ensure that your analysis includes all relevant time periods even if some periods have missing data.
- Hierarchies and Aggregates: Creating hierarchies provides a way to structure data based on relationships between dimensions. This reshaping helps in creating meaningful drill-down analyses and visualizations.
- By mastering data aggregation and reshaping in Tableau, analysts can transform raw data into actionable insights. These processes enable efficient summarization, pattern recognition, and the creation of clear, informative visualizations that drive better decision-making within organizations.
Data Transformations in Tableau
Creating Calculated Fields and Expressions
Creating calculated fields and expressions is a powerful aspect of data transformation in Tableau. It allows analysts to derive new insights from existing data by performing calculations, comparisons, and logical operations. These calculated fields enhance the analysis process and enable the creation of more informative visualizations.
In Tableau, calculated fields are user-defined formulas that generate new data points based on existing data or calculated values. Expressions in calculated fields can encompass a wide range of operations, including mathematical calculations, string manipulations, conditional logic, and more. For example, you can create calculated fields to compute profit margins, percentage growth, custom categorizations, or even complex aggregations that aren't directly available in the original dataset.
The process of creating calculated fields involves using Tableau's intuitive formula editor to write expressions that define the desired operation. This editor offers access to various functions, operators, and fields from your dataset, making it easier to build complex calculations. Furthermore, Tableau's calculated fields automatically update when underlying data changes, ensuring the ongoing accuracy of analysis results. Calculated fields are especially valuable when handling data that requires transformation beyond standard aggregations or filtering. They empower analysts to tailor analysis to specific business needs without altering the original dataset, thus promoting flexibility and customization.
Using Functions for Data Manipulation
Using functions for data manipulation is a fundamental aspect of data transformation in Tableau. Functions provide a structured and efficient way to perform calculations, comparisons, conversions, and other operations on your data. Tableau offers a wide range of built-in functions that can be applied to your data during the transformation process.
Here are some common types of functions used for data manipulation in Tableau:
- Mathematical Functions: Tableau provides a variety of mathematical functions for arithmetic operations like addition, subtraction, multiplication, division, exponentiation, square root, and more. These functions enable you to perform calculations on numerical data to derive insights and metrics.
- String Functions: String functions allow you to manipulate text data. You can concatenate strings, extract substrings, change case (UPPER, LOWER, PROPER), replace characters, and more. These functions are useful for cleaning and transforming textual information.
- Date and Time Functions: Date and time functions help manipulate date and time data. You can extract components like year, month, day, hour, minute, and second, perform date arithmetic, calculate differences between dates, and format dates in various ways.
- Logical Functions: Logical functions evaluate conditions and return Boolean values (True or False). They're used for filtering data based on specific criteria or for creating conditional calculations that depend on certain conditions being met.
- Aggregation Functions: Aggregation functions allow you to summarize data within calculated fields. You can use functions like SUM, AVG, MIN, MAX, COUNT, and more to perform calculations on subsets of your data.
- Conversion Functions: Conversion functions help change data types or formats. For instance, you can convert strings to numbers, dates to strings, or perform data type checks.
- Table Calculation Functions: Tableau's table calculation functions enable you to perform calculations across rows, columns, or other dimensions within a visualization. These functions facilitate dynamic analysis and allow you to create running totals, percent of total, moving averages, and more.
Conditional Logic and IF-THEN Statements
Conditional logic and IF-THEN statements are essential tools for data transformation in Tableau, allowing you to apply dynamic rules to your data based on specific conditions. These constructs enable you to create calculated fields that perform different actions or calculations depending on the values in your data.
In Tableau, you can use IF-THEN statements to define conditional logic within calculated fields. The structure of an IF-THEN statement consists of a condition, followed by actions to be taken if the condition is met (THEN clause), and optional actions if the condition is not met (ELSE clause).
For example, consider a scenario where you want to categorize sales data as "High," "Medium," or "Low" based on certain thresholds. You could create a calculated field using IF-THEN statements:
This calculated field assigns a category based on the sales value. If the sales value is above 100,000, it's categorized as "High." If it's between 50,000 and 100,000, it's "Medium." Otherwise, it's "Low."
Conditional logic extends beyond simple IF-THEN statements. Tableau provides logical operators (AND, OR, NOT) and functions like CASE WHEN for more complex conditions. You can nest multiple IF-THEN statements or use calculated fields that involve logical comparisons between different fields.
These constructs are valuable for data cleansing, data categorization, segmentation, and more. You can clean messy data, identify outliers, create custom groupings, or apply dynamic filters based on conditions. Using conditional logic in calculated fields empowers you to transform raw data into actionable insights while maintaining the flexibility to adapt to changing business needs.
Conclusion
- Efficient Analysis: Data transformation is a crucial step that prepares raw data for analysis, making it accurate, consistent, and suited for visualization.
- Data Cleaning: Tableau offers tools like Data Interpreter and calculated fields to address data quality issues, such as duplicates, missing values, and formatting inconsistencies.
- Aggregation and Reshaping: Aggregating data using functions, grouping, and level of detail (LOD) expressions helps in summarizing trends. Reshaping tools like pivot, split, UNION, and data blending ensure data is structured optimally for analysis.
- Calculated Fields: Creating custom calculated fields using functions and conditional logic empowers users to perform complex calculations, comparisons, and transformations.
- Customization: Calculated fields allow users to tailor analysis to specific business requirements without altering the original dataset, promoting flexibility.
- Data Standardization: Functions aid in standardizing data formats, ensuring consistency and improving the accuracy of visualizations.
- Web Data Connectors: Tableau's Web Data Connectors enable seamless integration with web-based data sources, expanding the range of data available for analysis.
- Cloud-based Sources: Tableau facilitates connecting to cloud-based data sources, accommodating the shift towards cloud computing and real-time data.