Tableau Features
Overview
Tableau is a robust data visualization and analysis application that organizations of all sizes utilize. Its user-friendly interface lets users quickly construct interactive dashboards and visualizations to examine their data and acquire insights. Some of the Tableau features are strong security, mobile optimization, Natural Language Processing, trend lines and predictive analysis, and mapping capabilities. Furthermore, Tableau's drag-and-drop interface allows non-technical users to construct meaningful visuals without coding. Overall, Tableau's user-friendly interface and powerful capabilities make it an ideal tool for anyone trying to make data-driven decisions.
Introduction
Tableau is a robust and user-friendly data visualization application that enables users to create interactive dashboards and visualizations easily, without extensive programming skills. Tableau features includes the ability to link to a wide range of data sources, including spreadsheets, databases, and cloud-based platforms like Salesforce and Google Analytics, is one of its primary assets.
There are numerous Tableau features and tools to assist users in analyzing and visualizing data, such as drag-and-drop capability, interactive filters, and real-time data connections. Tableau features also include a broad collection of visualization choices, such as bar charts, line charts, scatter plots, and heat maps, allowing users to show their data visually.
Another significant characteristic of Tableau is its capacity to easily manage enormous amounts of data, making it a vital tool for enterprises and organizations that need to process and analyze complicated data sets. Tableau features also include some advanced analytics features such as predictive modeling and statistical analysis.
Overall, Tableau's user-friendly interface, large range of data connectors, and sophisticated visualization and analytics tools make it a popular choice for corporations, non-profits, and people that need to engage with their data visually.
Why Tableau?
Businesses in today's data-driven environment must make informed decisions based on precise data analysis. Tableau is a powerful data visualization platform that provides interactive and intuitive dashboards and visuals to organizations to help them make educated decisions.
There are numerous Tableau features and advantages. One of Tableau's key advantages is its ability to connect to a wide range of data sources, from spreadsheets to databases and even cloud-based platforms. This allows organizations to study data from multiple sources in a single view.
Tableau features also includes intuitive drag-and-drop interface enables users to create and customize interactive dashboards and reports without coding knowledge. In addition, it has advanced features, including data blending, forecasting, and real-time data analytics.
Another advantage of Tableau is its robust community support and extensive knowledge base. The Tableau community is quite active and offers a variety of resources, including user forums, blogs, and training courses to assist users in learning and to get the most out of the tool.
As a result, Tableau provides businesses with an easy-to-use, powerful, and adaptable data visualization solution that may assist them in making educated decisions based on accurate and fast data analysis.
The Working of Tableau
Tableau is a powerful data visualization application that enables users to connect, visualize, and share data seamlessly. Tableau's operation comprises three major components: data connection, visualization, and sharing.
- Connecting to a data source is the initial step in using Tableau. Tableau can access data from various sources, including spreadsheets, databases, and cloud-based apps. In addition, users can connect to real-time data or import it into Tableau for further analysis.
- After the data is linked, users can begin visualizing it with several charts, graphs, and maps. The drag-and-drop interface of Tableau makes it simple to create stunning visuals without requiring complicated coding or programming expertise. Users can also develop interactive dashboards to explore the data.
- Finally, Tableau features allows customers to share their data and representations with others. For example, users can share insights with colleagues or clients by publishing their workbooks to Tableau Server or Tableau Online. Tableau also allows you to embed visualizations in websites or blogs, making it simple to share data with a larger audience.
- As a result, Tableau's operation entails connecting to data, creating visuals, and sharing insights. Its simple interface and robust capabilities make it an indispensable tool for anyone who wants to study and evaluate data.
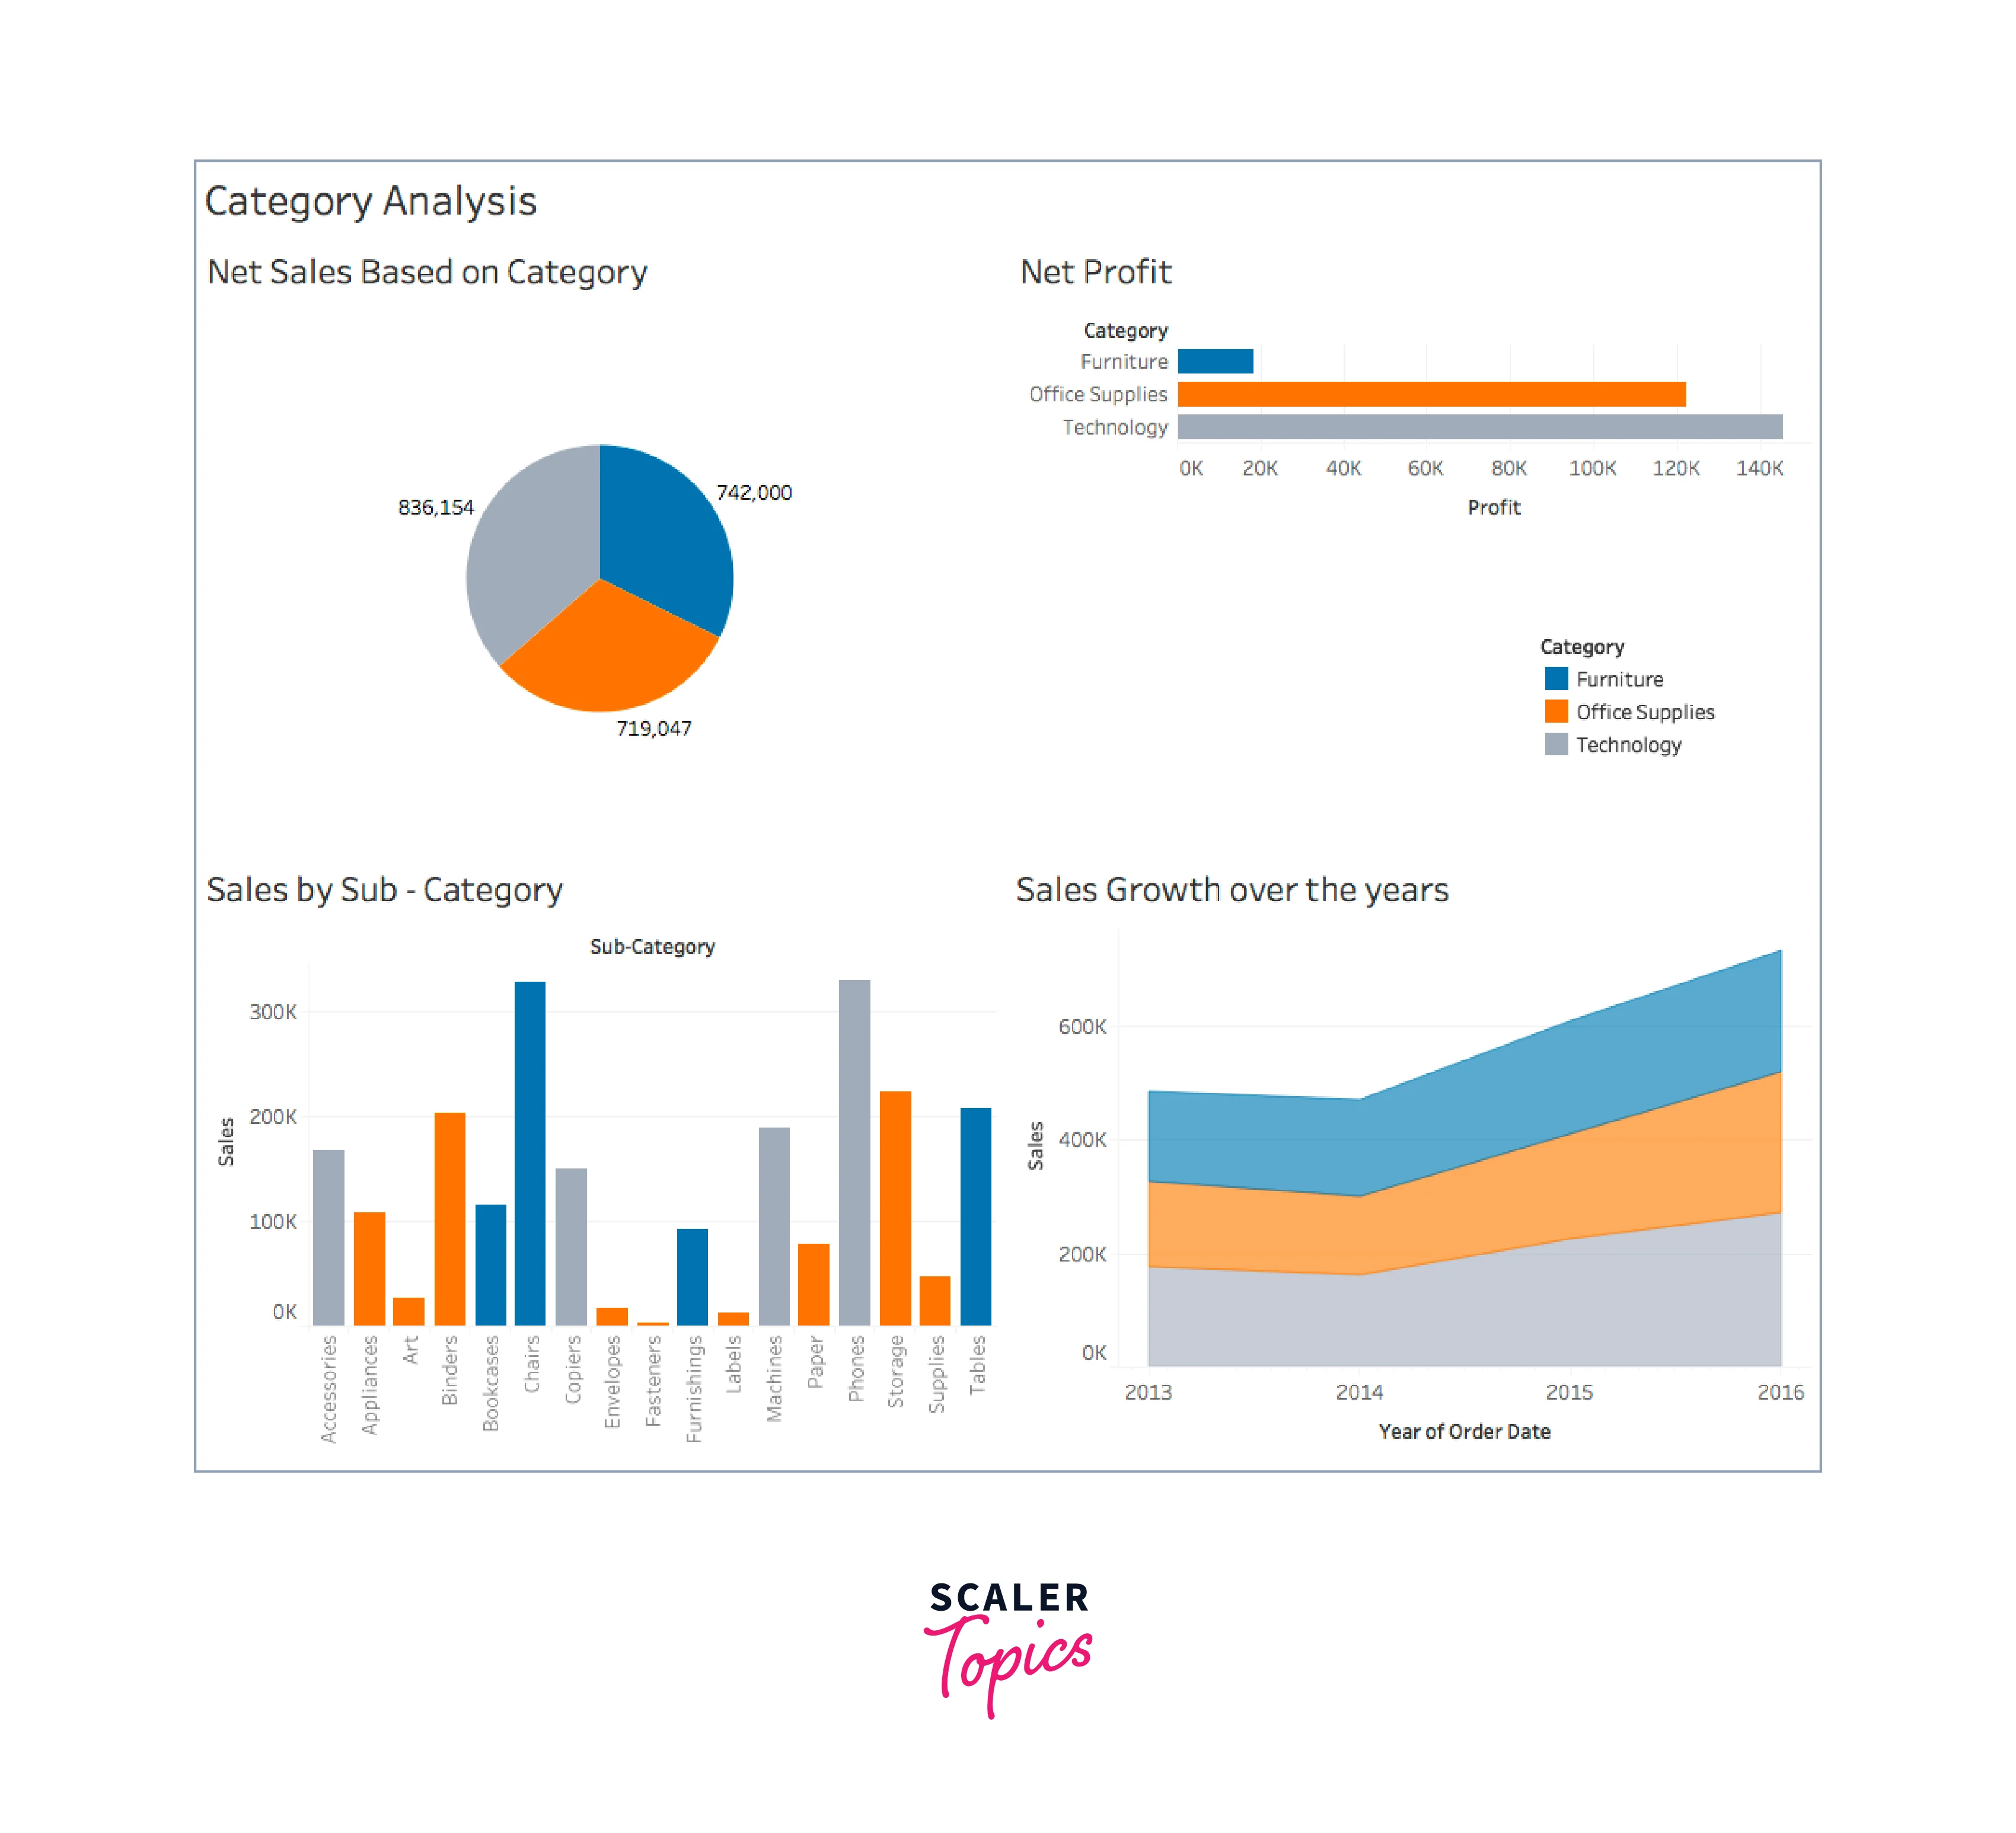
Let's have a look at a simple sales UI dasboard developed using various Tableau features. Here, we have used various types of graphs like Pie chart, Bar chart, Area chart, etc.
Features of Tableau
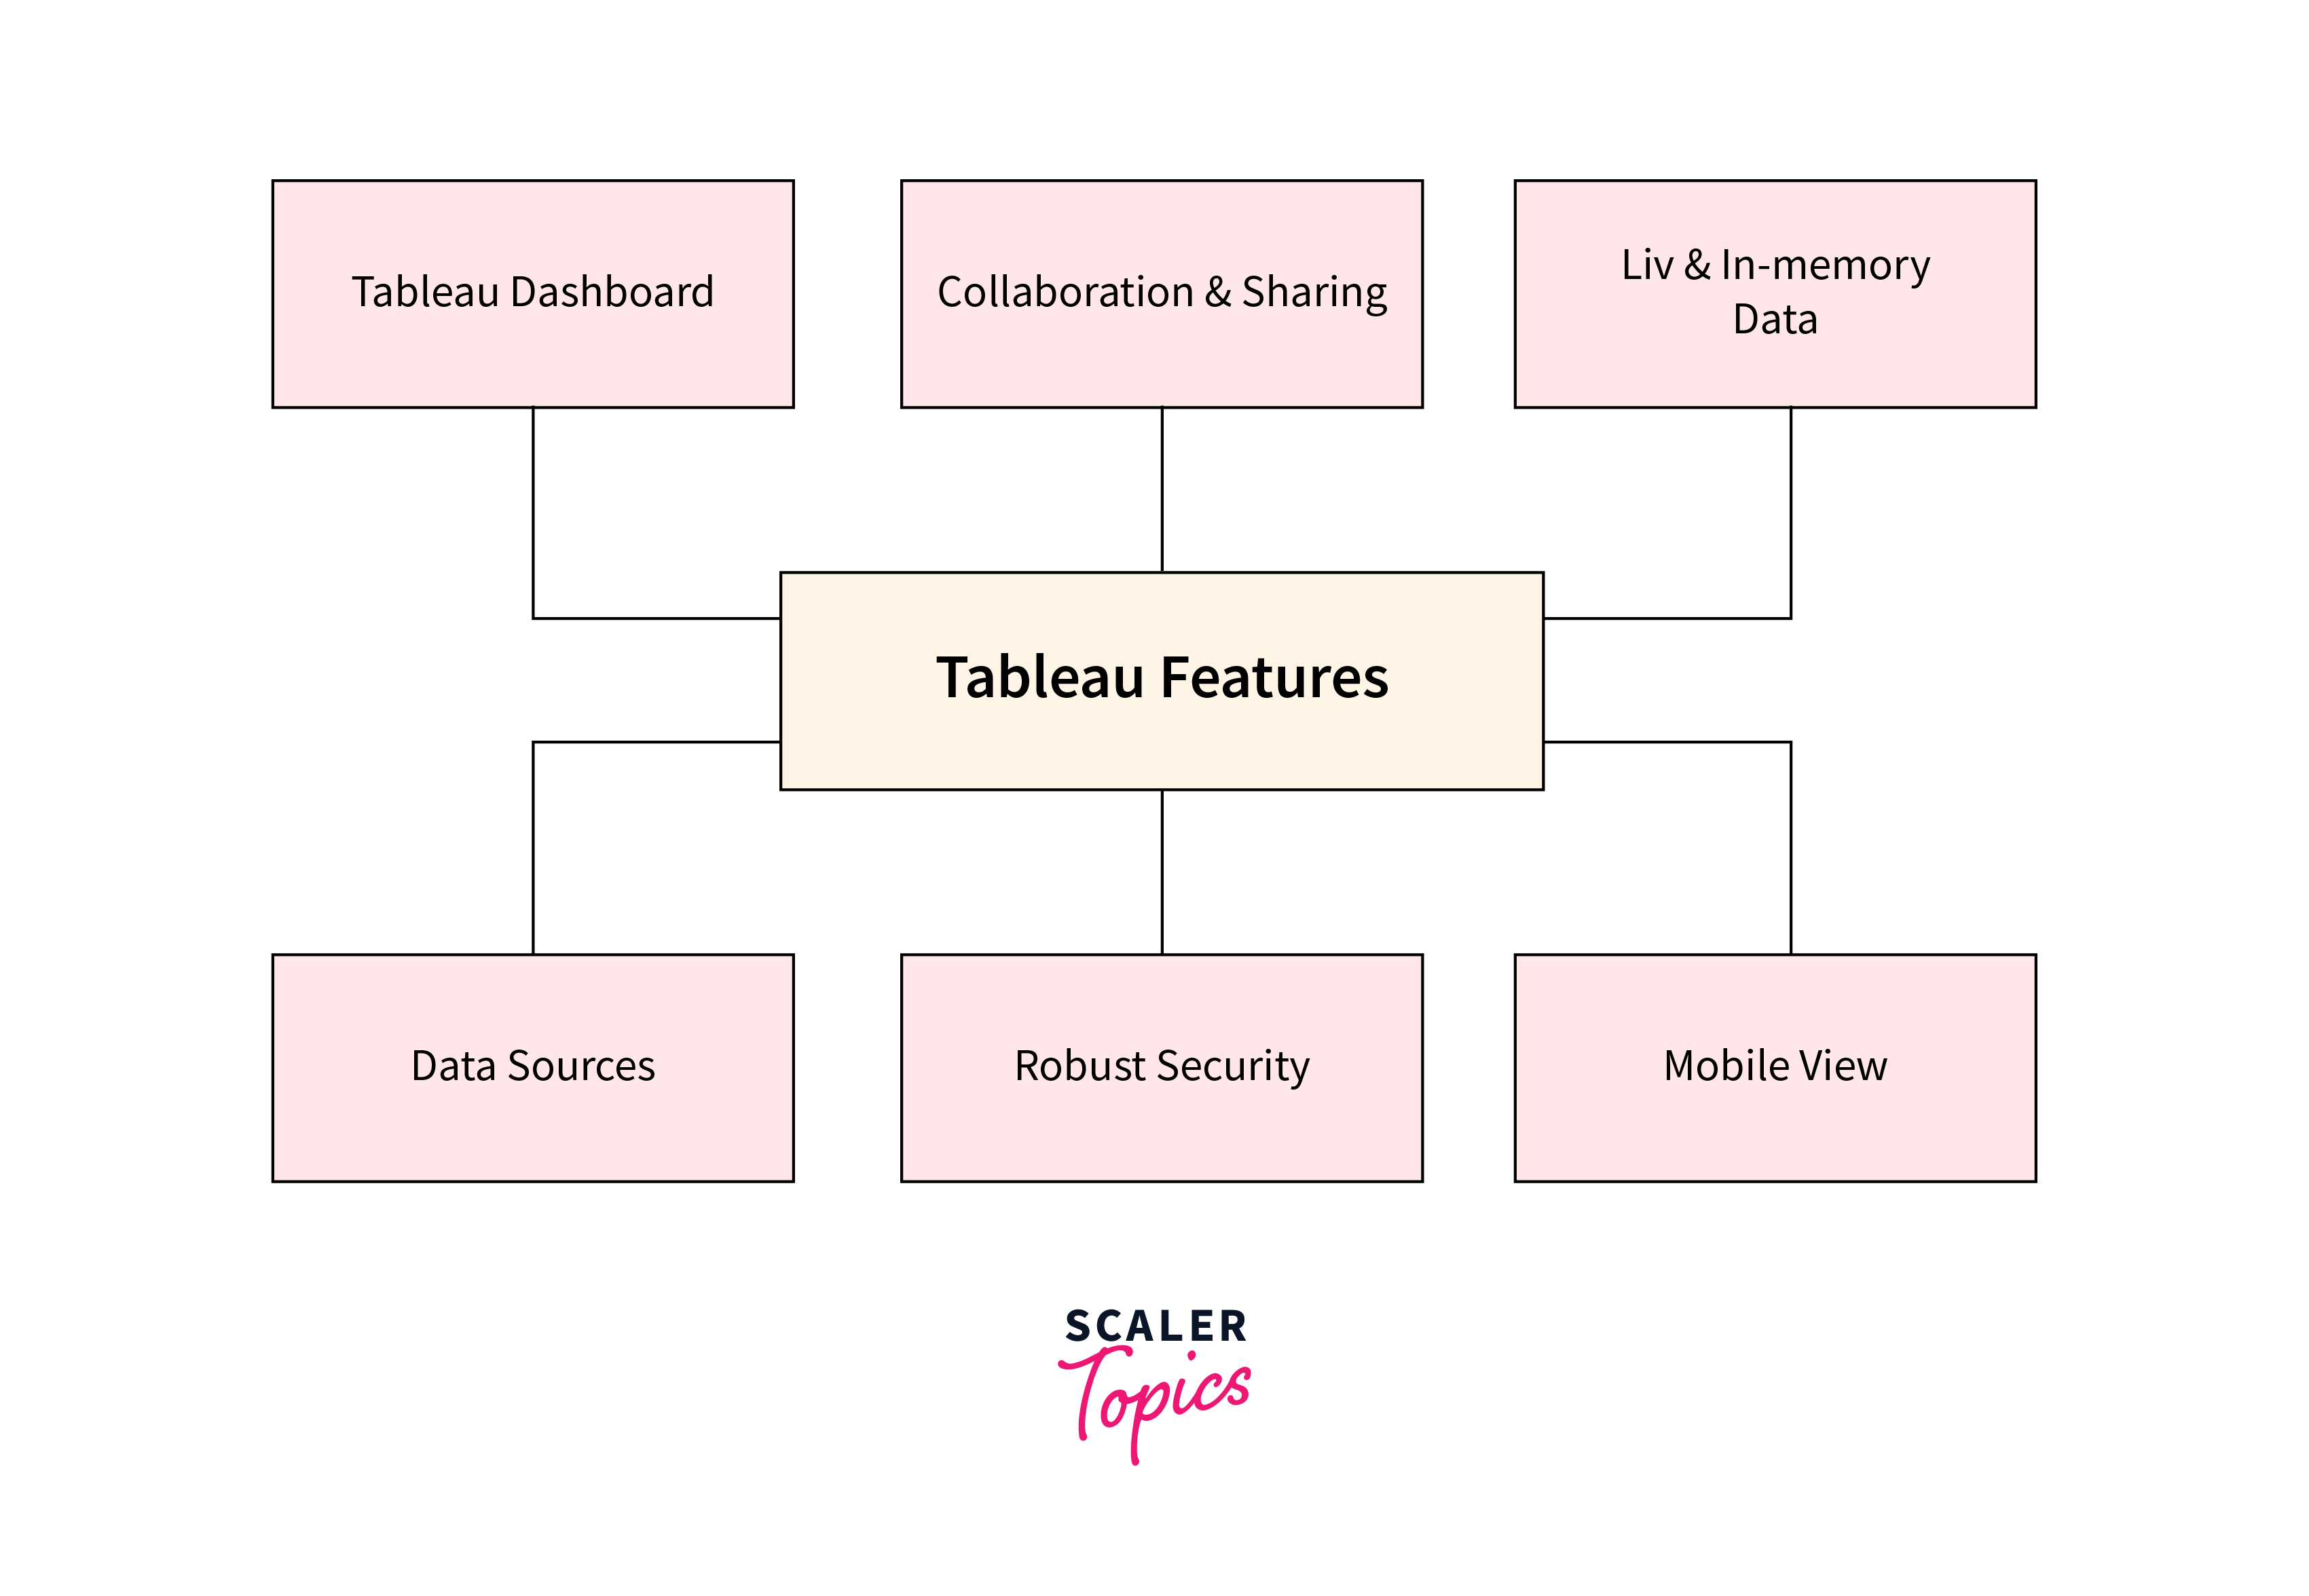
Tableau is a robust data visualization application with various tools for creating engaging and interactive visuals. Drag-and-drop flexibility, easy integration with numerous data sources, real-time collaboration, and the ability to connect to live data sources are some of its primary features. In addition, Tableau provides advanced analytics and forecasting capabilities, such as predictive modeling and Machine Learning methods. It also provides an easy-to-use interface and customizable options for generating interactive dashboards and stories. As a result, Tableau allows users to easily create visuals, gain useful insights from data, and make data-driven decisions.
1. Tableau Dashboard
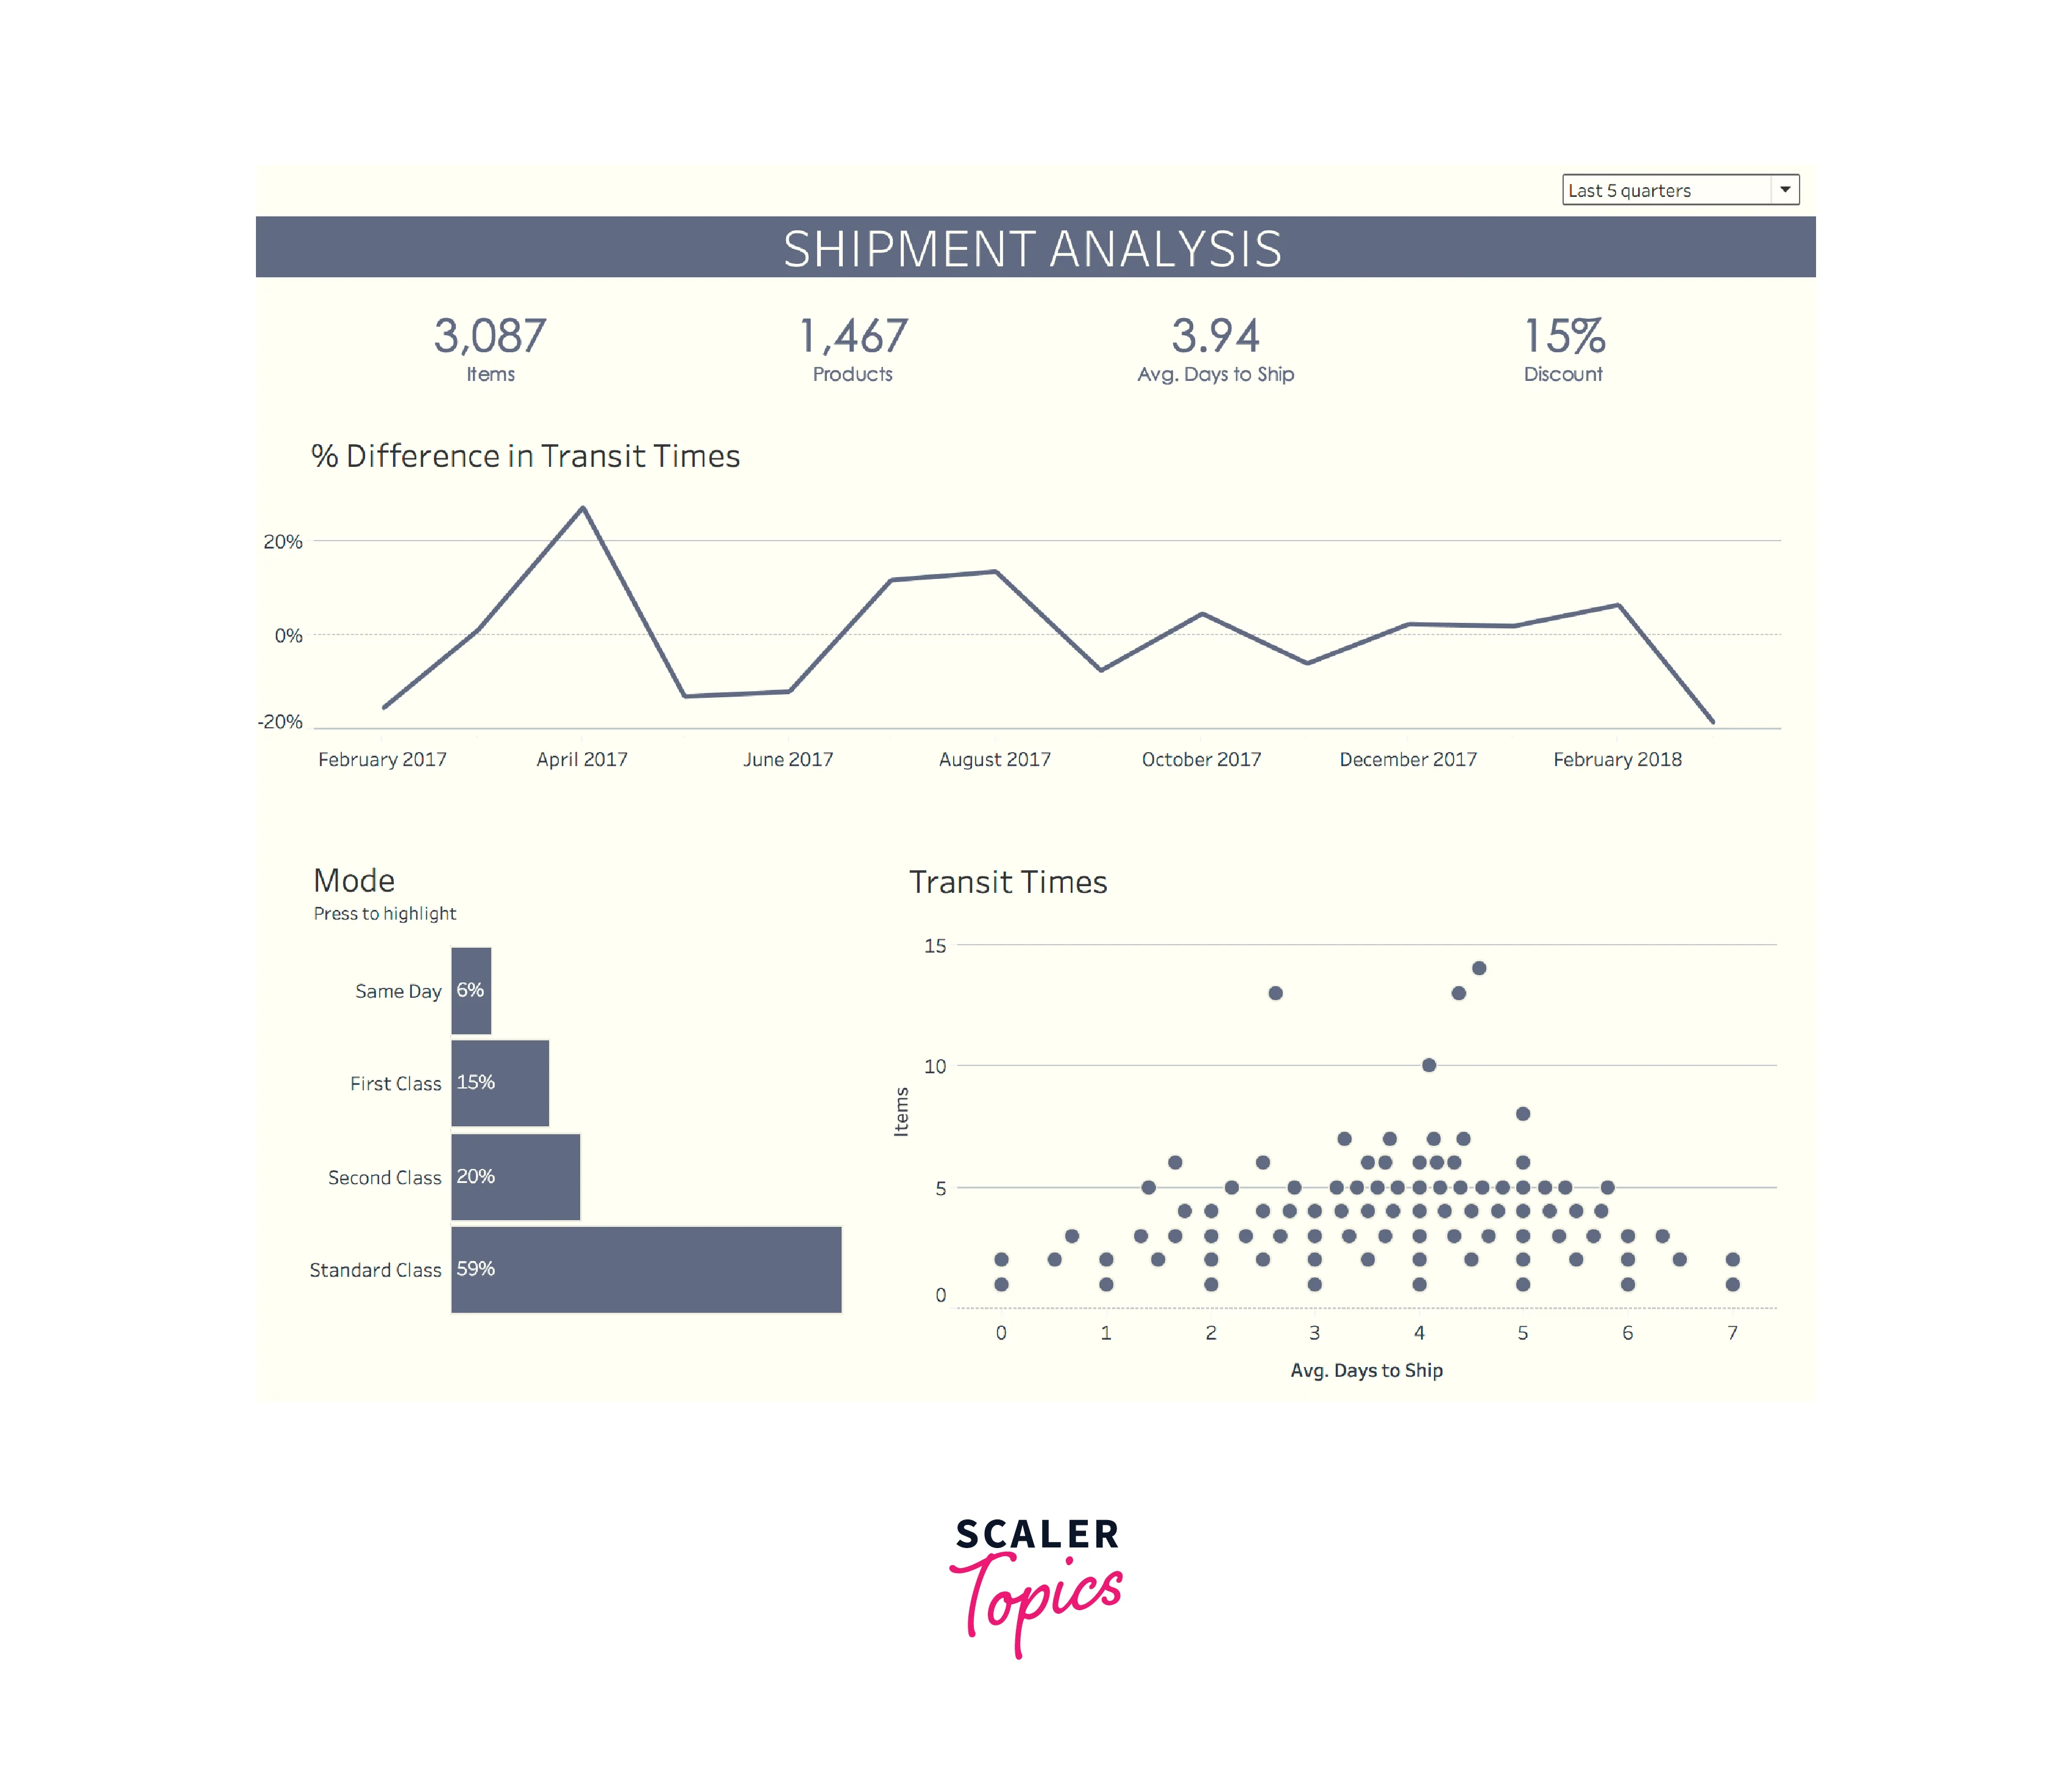
A Tableau dashboard is a single-page combination of numerous worksheets and stories providing a comprehensive data view. It enables users to generate interactive and dynamic representations by combining data from numerous sources. A dashboard can be developed to fulfill unique needs and tailored to match any device screen. Tableau's drag-and-drop capability makes it simple to create and change dashboards. Tableau features include a dashboard that delivers real-time insights to businesses, allowing them to make data-driven choices. Data analysts can quickly show complex data sets with Tableau dashboards, making them more intelligible and actionable.
Let's have a look at a simple Tableau dashboard.
2. Collaboration and Sharing
Tableau makes it simple to collaborate with people and share your visuals. You can securely share dashboards and reports with your team or with external stakeholders using Tableau Server or Tableau Online. Permissions and access restrictions can also be configured to guarantee that only authorized users can access specified data. Tableau also allows you to embed your visualizations in websites or other applications, making communicating your findings with a wider audience easier. Tableau's collaboration and sharing tools let you collaborate more efficiently and effectively with your team, customers, and partners.
3. Live and In-memory Data
Tableau features help us to create a robust data visualization solution that supports live and in-memory data. Tableau connects directly to your data source using live connections and provides real-time updates as new data becomes available. This is ideal for huge, complicated datasets with continually changing information. In contrast, in-memory data is excellent for smaller datasets where speed and performance are crucial. Tableau's in-memory technology enables lightning-fast analysis and visualizations, allowing you to explore and analyze data in real-time. In addition, Tableau provides the tools to create stunning visualizations and acquire useful insights from your data, whether dealing with live or in-memory data.
4. Data Sources in Tableau
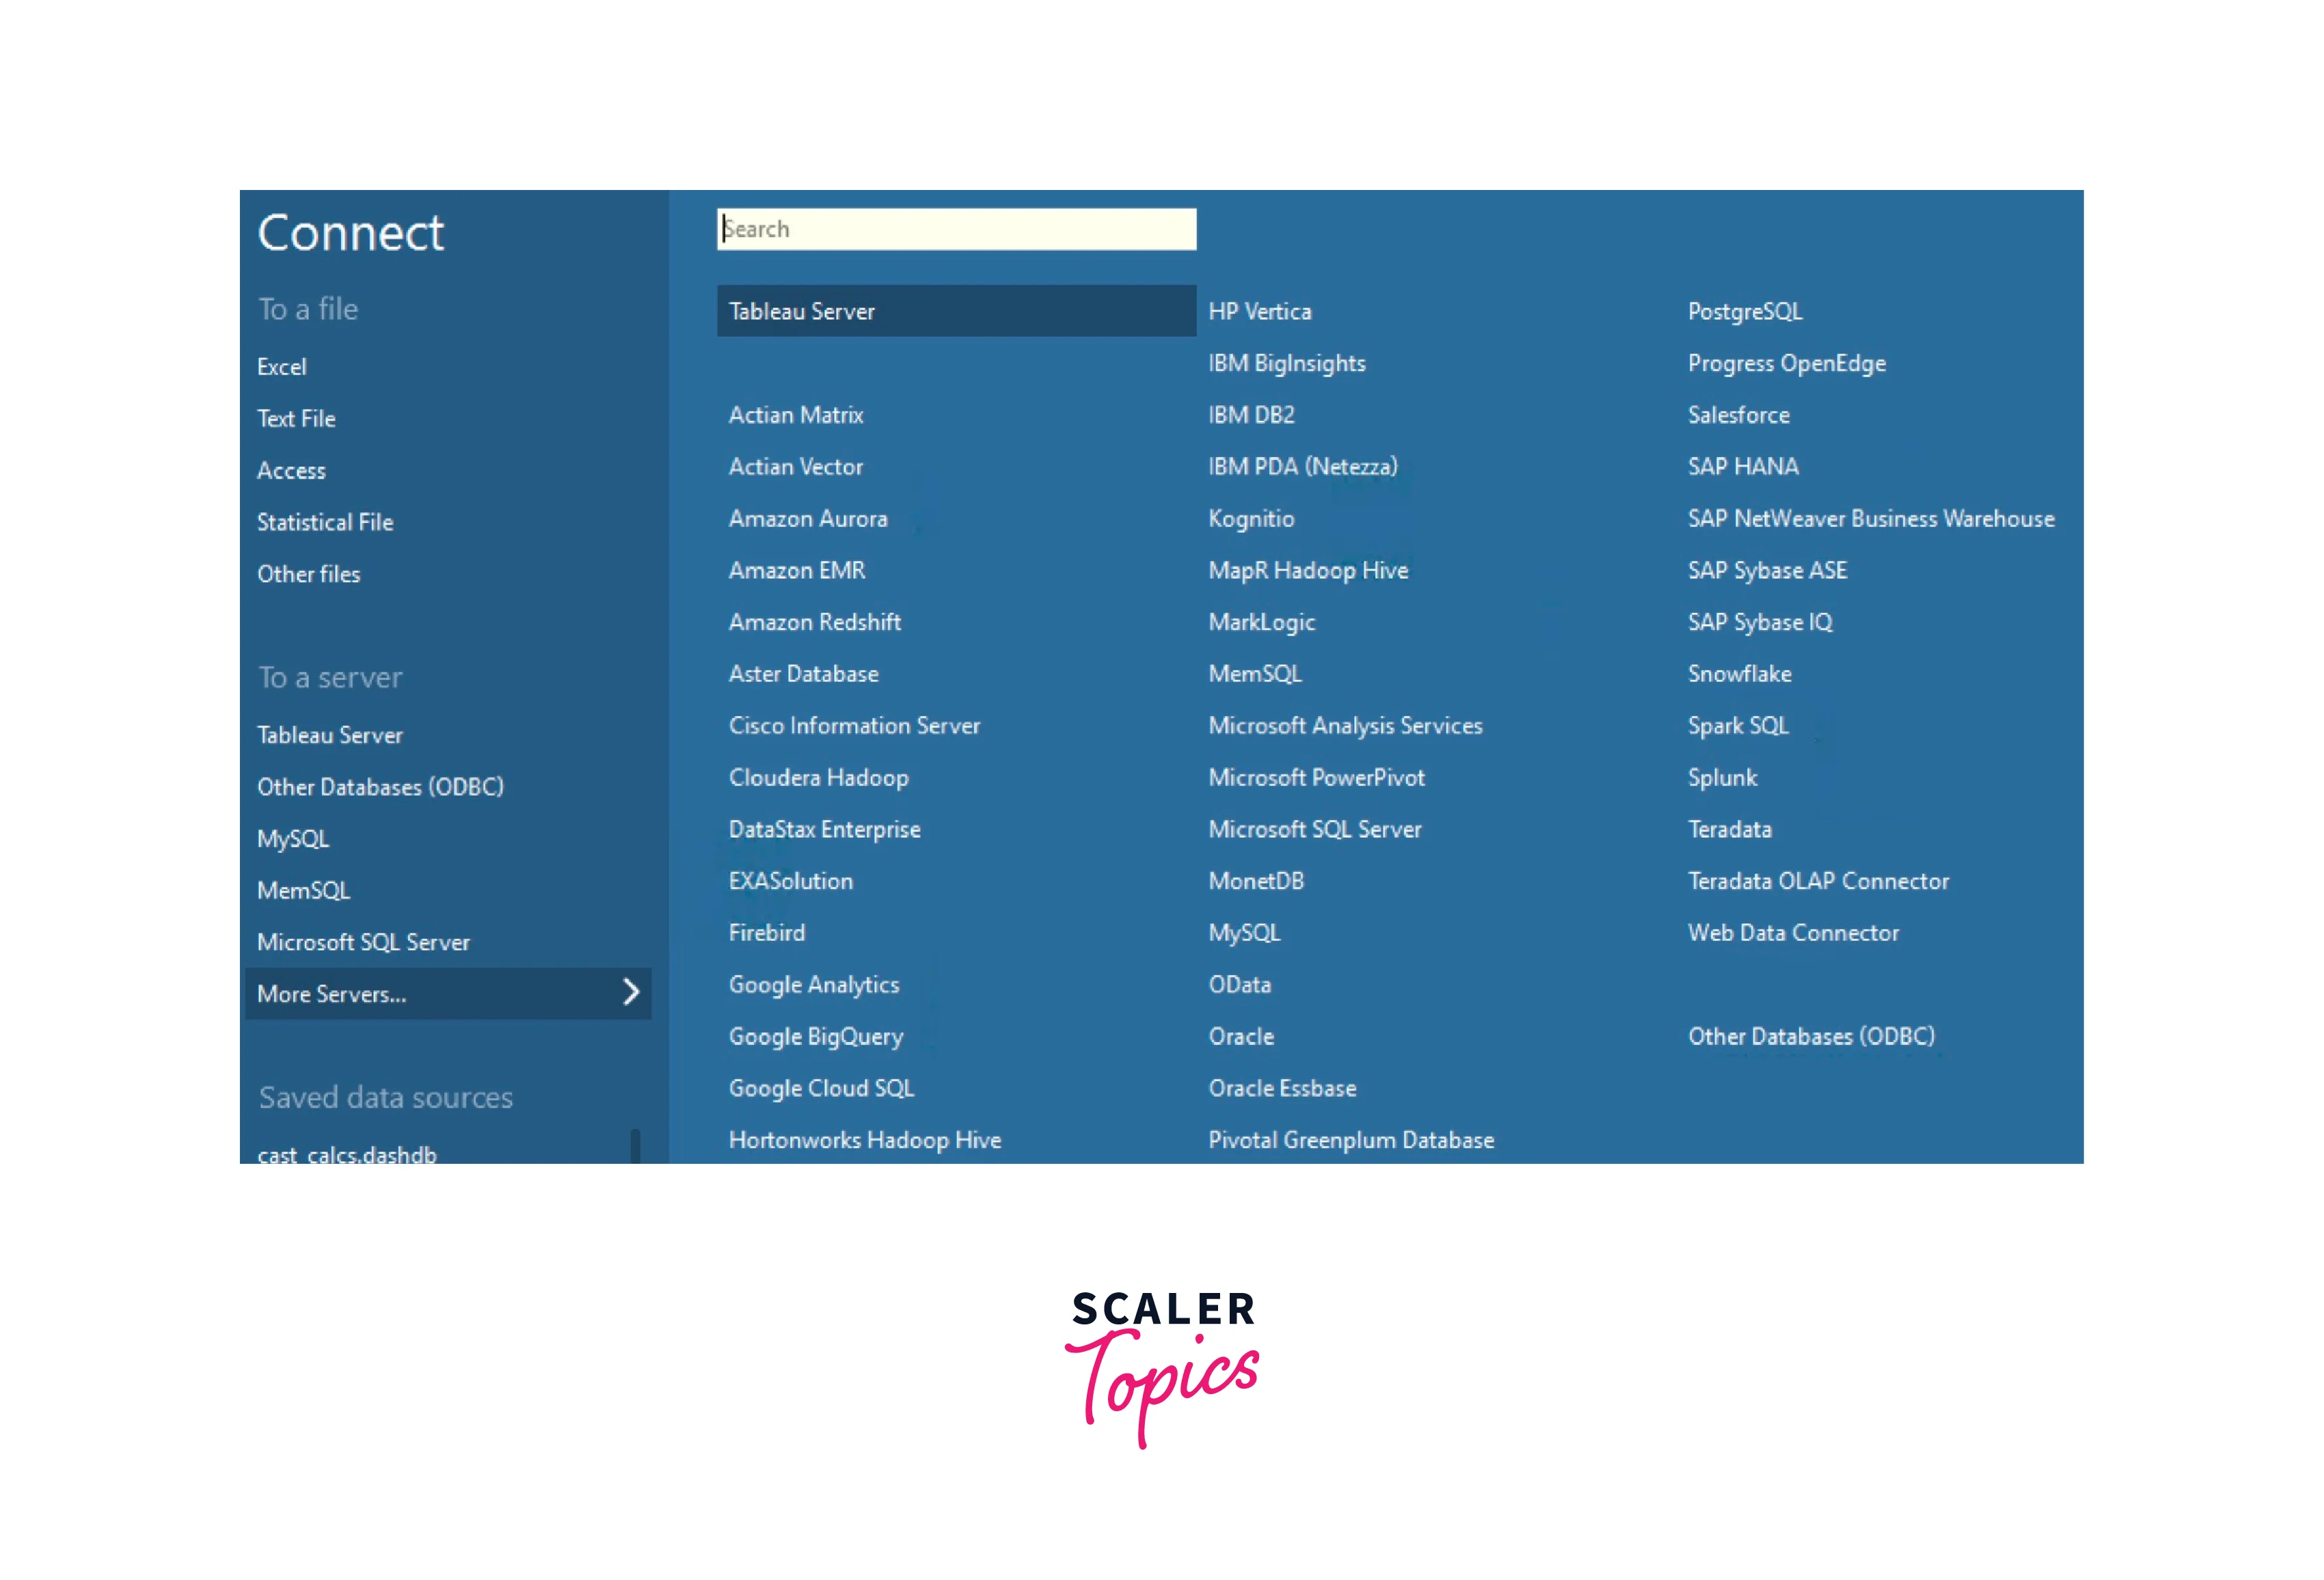
Tableau allows you to connect to data from various sources, including spreadsheets, databases, cloud services, and large data sources like Hadoop. Tableau's data connectors make it simple to connect to your data without sophisticated code or scripting. Finally, Tableau's flexible data connections make it simple to analyze and show your data in new and powerful ways, whether dealing with a small spreadsheet or a huge data warehouse. By default, three blank worksheets are provided by Tableau when you have established a connection to data source.
Let's have a look at the various types of data source connectors used in Tableau.
5. Maps
Maps are a key component of data visualization, and Tableau includes various capabilities to make mapping quicker and more engaging. For example, users can use Tableau features to create bespoke maps tailored to their specific needs, allowing them to display data more understandably. Tableau also allows users to construct maps with several layers, allowing them to compare and contrast data from various sources easily. Furthermore, Tableau includes various options for filtering and drilling down into map data, making it simple to study and examine enormous data sets. Overall, Tableau's mapping capabilities make it a terrific tool for anyone who wants to see data in a more useful manner.
6. Robust Security
Security is a major concern regarding data analysis, and Tableau takes it extremely seriously. Tableau users can be confident that their data is secure, thanks to comprehensive security features such as two-factor authentication and user-level permissions. Tableau also offers end-to-end encryption, ensuring data security in transit and at rest. Tableau also allows users to create data governance standards and monitor user activities, giving them more control over their data. Overall, Tableau's security features assure users that their data is protected.
7. Mobile View
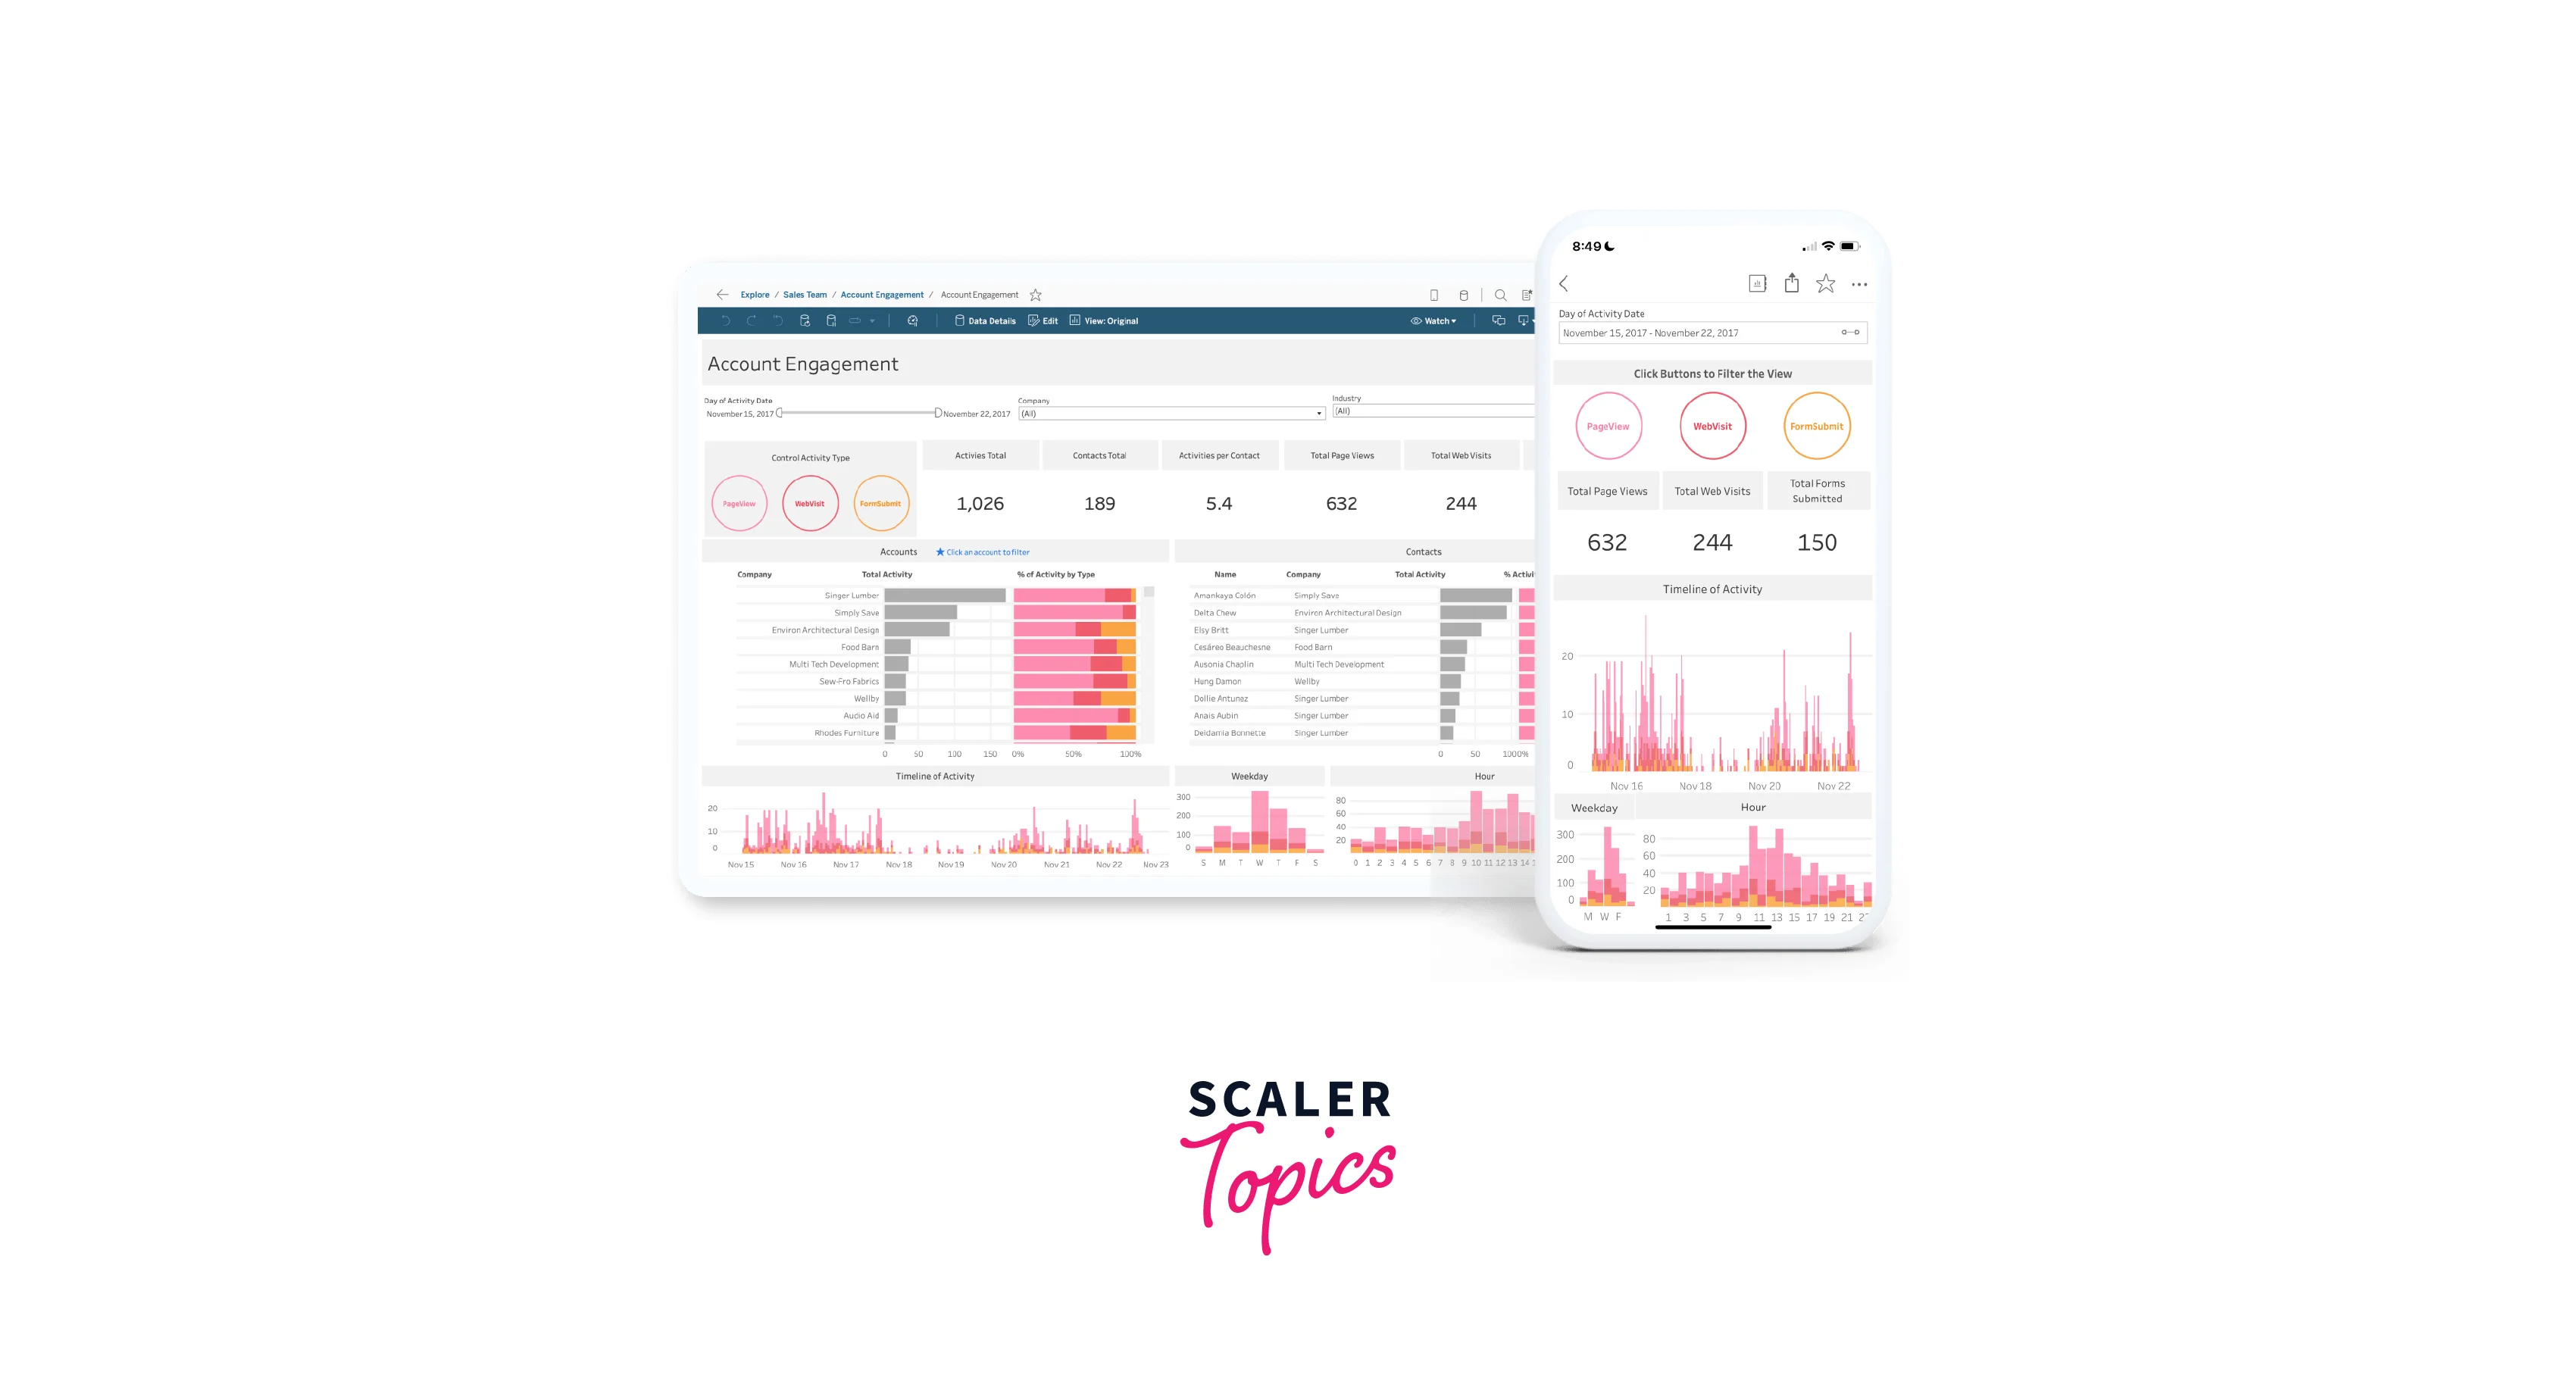
In today's fast-paced world, people need to access data on the go, and Tableau's mobile view functionality makes that possible. Using the Tableau features, users can construct mobile-optimized dashboards and visualizations, ensuring that data is easily accessible and understandable on smaller displays. Tableau's mobile view feature allows users to engage with data as they would on a desktop, with seamless filtering, sorting and digging down. Furthermore, Tableau allows users to publish and share mobile views with others, making it easier for teams to collaborate and make data-driven choices regardless of location.
Refer to the image provided below to see how a dashboard looks in mobile and web view.
8. Ask Data
Regarding data analysis, Tableau's Ask Data tool is revolutionary. With Ask Data, users can write a question about their data in plain English, and Tableau features will quickly build a visualization that answers that question. This tool uses Natural Language Processing and Machine Learning methods, allowing anybody to evaluate data easily and gain insights without needing to be an expert data analyst. Furthermore, Ask Data is connected with other Tableau capabilities, like dashboards and workbooks, making incorporating the results into current processes simple.
9. Trend Lines and Predictive Analysis
Tableau's trend lines and predictive analysis features help customers to acquire insights into their data and make data-driven decisions. Users can readily detect patterns and trends in their data over time using trend lines. Predictive analysis enables users to estimate future patterns and make predictions based on historical data. Tableau's predictive modeling features use Machine Learning algorithms, making it simple to create reliable predictive models without requiring data science expertise. Overall, trend lines and predictive analysis capabilities help customers obtain insights into their data and make informed decisions based on those findings.
Conclusion
- Tableau is a powerful data visualization application that assists businesses in making informed decisions by delivering interactive and user-friendly dashboards and visualizations.
- Some of the Tableau features are rigorous security, mobile optimization, Natural Language Processing support, trend lines, predictive analysis, and mapping capabilities.
- Tableau's operation comprises three major components: data connection, visualization, and sharing.
- Tableau provides an easy-to-use interface and allows for simple customization when generating interactive dashboards and stories.
- A Tableau dashboard is a single-page presentation of numerous worksheets and stories providing a comprehensive data view.
