Data Transpose in Tableau
Overview
Data transpose in Tableau refers to the process of reorganizing data from a vertical format (rows) to a horizontal format (columns) or vice versa. This transformation is valuable when data needs to be reshaped to better suit analysis or visualization requirements. Tableau's data transpose capability enables users to pivot data, converting fields into headers or aggregating values. By performing data transpose, users can present information in a more intuitive and meaningful manner, making it easier to compare, analyze, and draw insights. This functionality empowers users to adapt their data to varying scenarios, enhancing the flexibility and effectiveness of their analyses within the Tableau environment.
Introduction
In the realm of data analysis and visualization, the way data is structured can significantly impact the insights drawn and the effectiveness of communication. Data transpose in Tableau stands as a transformative technique that empowers users to reshape their datasets from one orientation to another, facilitating enhanced analysis and interpretation. Transposing data involves converting rows into columns or columns into rows, resulting in a reconfigured layout that suits specific analytical needs.
The process of data transpose is particularly valuable when data is received in a format that isn't immediately conducive to analysis or when the desired presentation of insights requires a different arrangement. By effortlessly reorienting data, Tableau users can tailor their visualizations to emphasize specific aspects of their data, making trends, comparisons, and patterns more apparent to both analysts and stakeholders.
Data transpose enables the reorganization of data dimensions, often referred to as "pivoting" and "unpivoting." Pivoting involves turning unique values within one column into multiple columns, whereas unpivoting transforms multiple columns into a single column with corresponding value and attribute columns.
Understanding Data Orientation in Tableau
Row-based Data Structure
A row-based data structure is a foundational concept in understanding data orientation within Tableau. It refers to a format where each individual record or observation occupies a single row, and the attributes or variables associated with that record are represented in columns. This structure is often used to store transactional or individual-level data.
In Tableau, comprehending data orientation is crucial as it determines how data is presented and analyzed. A row-based structure aligns well with the default format of many data sources and is suitable for granular analysis. Each row holds a unique set of data attributes, and columns correspond to specific dimensions or measures.
When working with row-based data, Tableau's analytical capabilities shine. Visualizations and calculations can be built upon these data structures to explore trends, relationships, and patterns across various attributes. Aggregations, calculations, and filters can be applied to perform insightful analysis.
Column-based Data Structure
A column-based data structure is a foundational aspect of understanding data orientation in Tableau. In this context, data orientation refers to the arrangement of data within a dataset – whether it's organized primarily in columns or rows. In Tableau, data orientation holds significant importance as it directly impacts how data is visualized, analyzed, and interpreted.
A column-based data structure signifies that each attribute or field is represented by a separate column in a dataset. This structure is well-suited for analytical tools like Tableau, where columns often correspond to dimensions, measures, or attributes of the data. In a column-oriented dataset, each unique data point is captured as a column entry, allowing for efficient data retrieval, aggregation, and computation.
In Tableau, understanding the column-based data structure is crucial for designing effective visualizations and crafting insightful analyses. When creating visualizations, dimensions (categorical variables) are typically placed on columns, while measures (quantitative variables) are placed on rows. This arrangement allows Tableau to apply appropriate aggregations and calculations, generating meaningful charts, graphs, and dashboards.
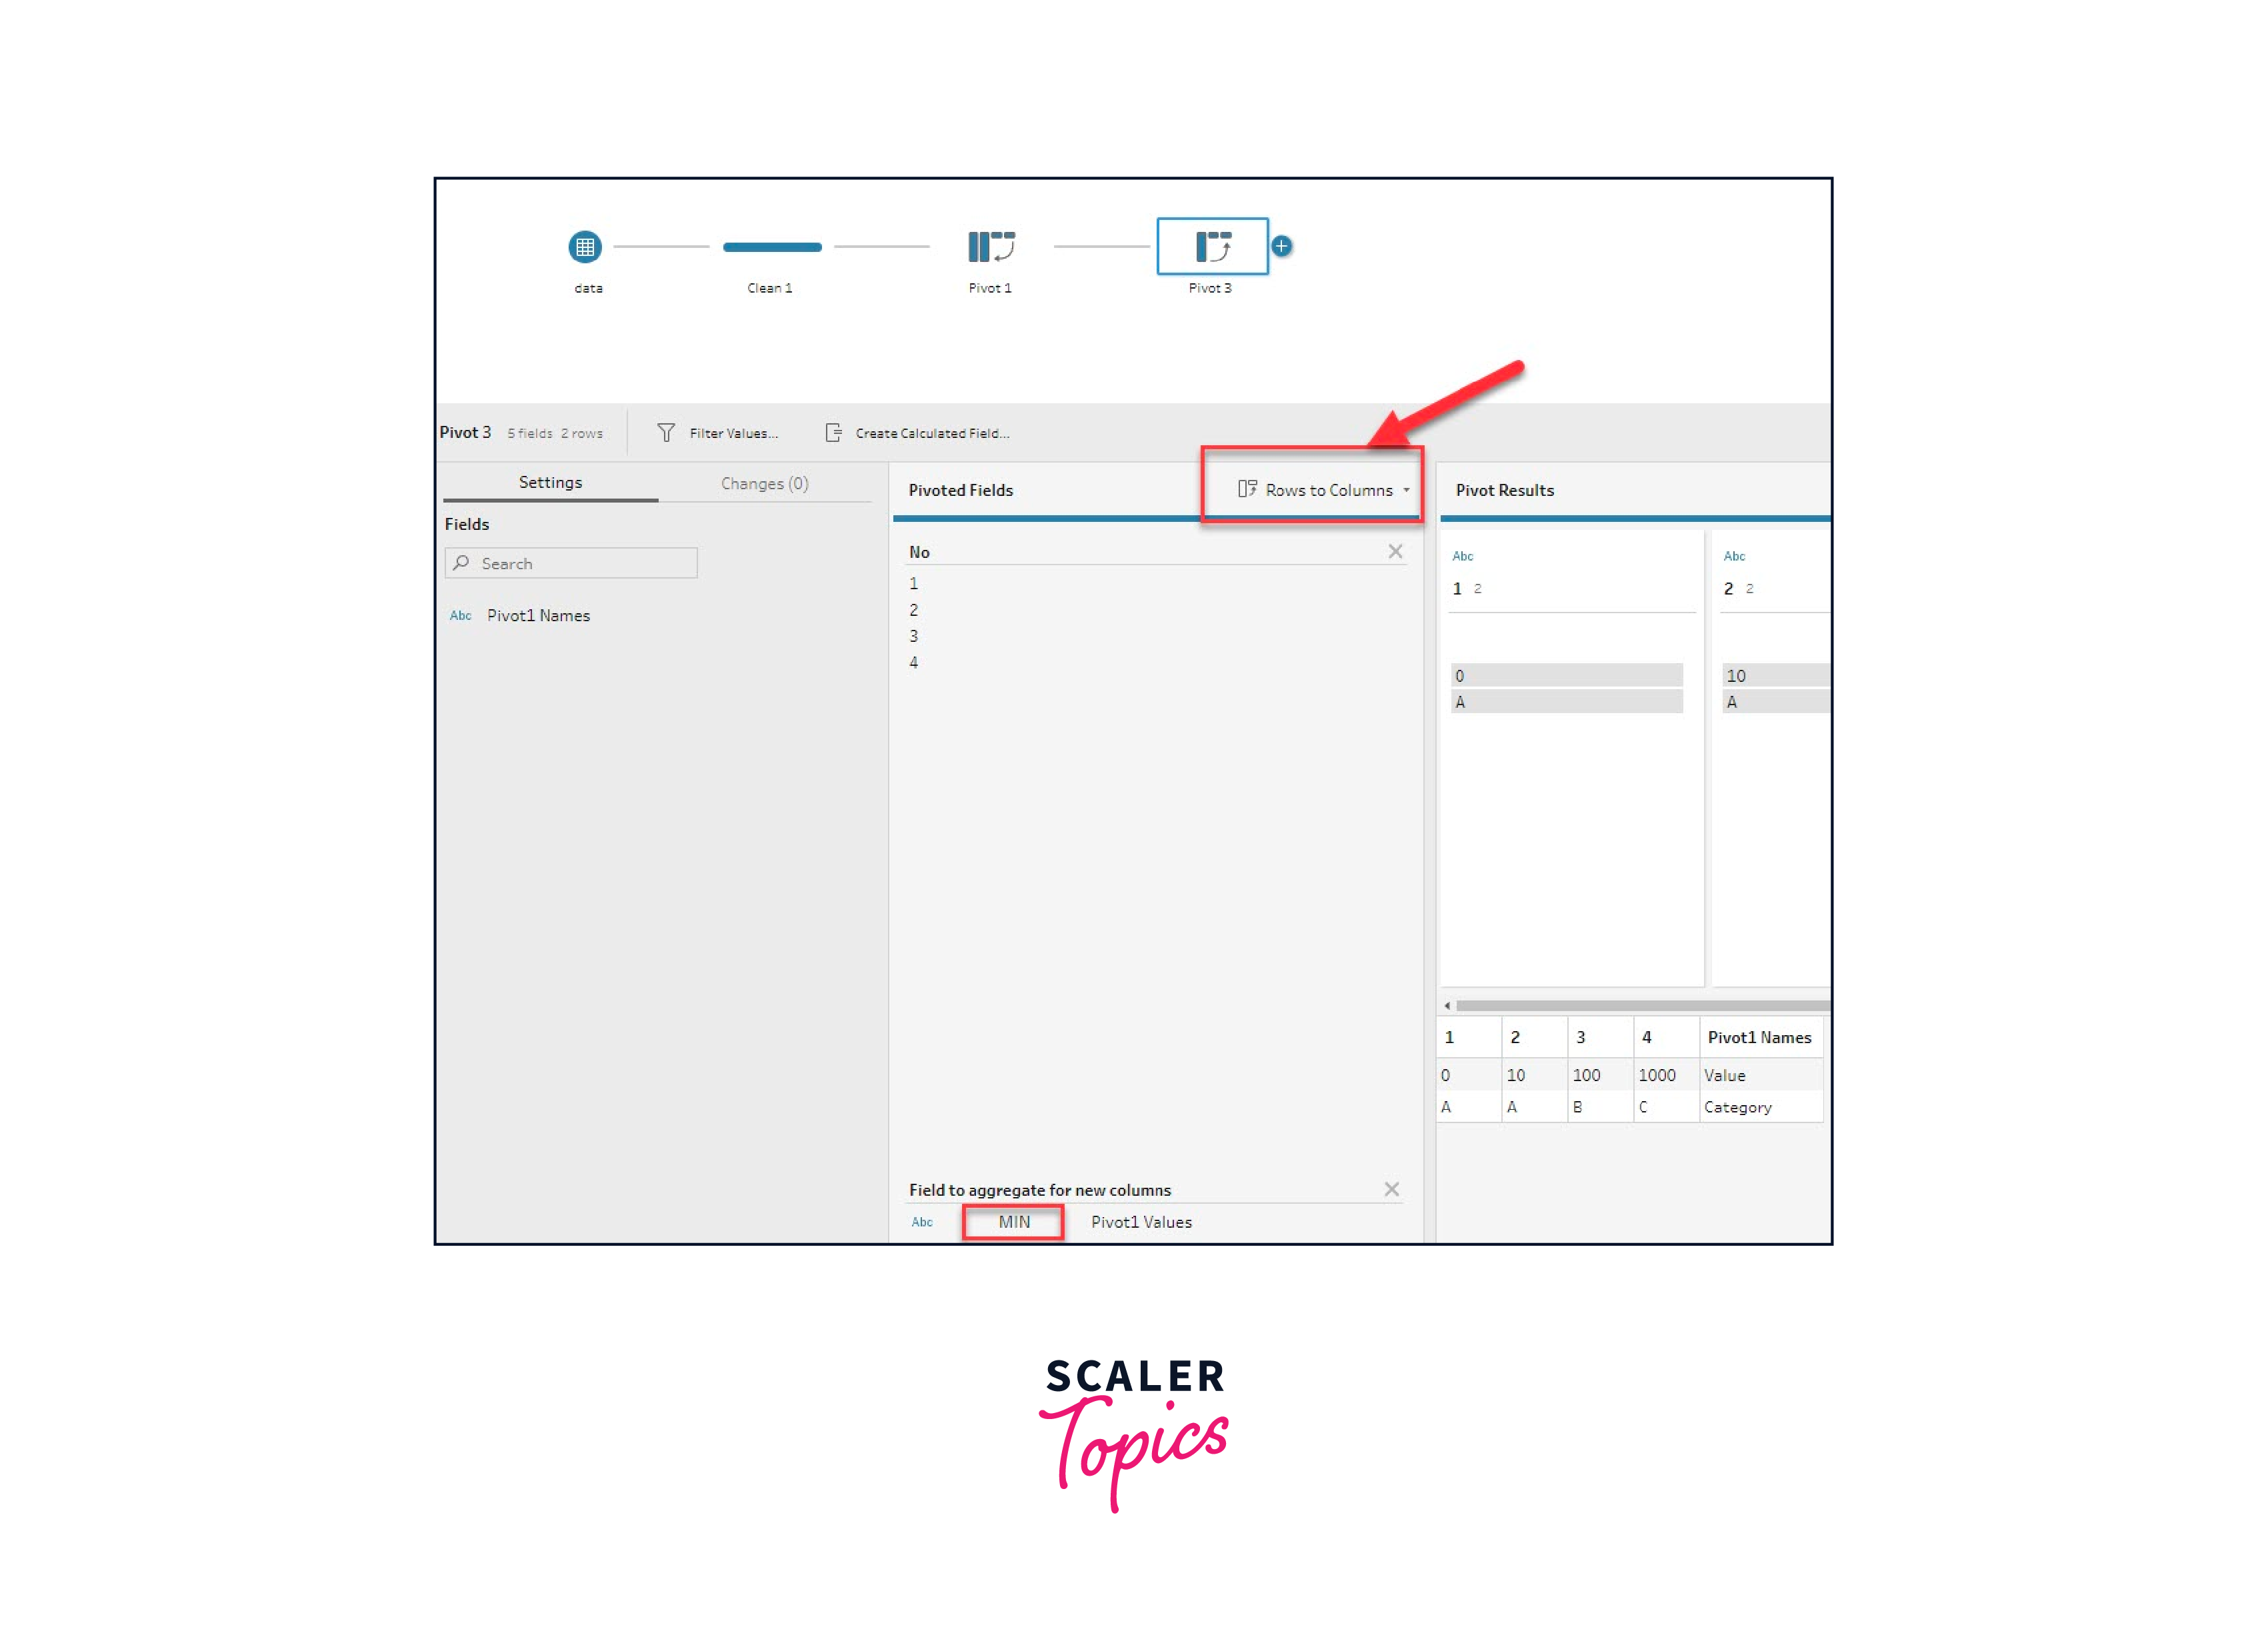
Transposing Rows to Columns
Pivot Data Transformation
Pivoting is a fundamental data transformation technique in Tableau that involves converting data from a long or narrow format into a wide format. This process is particularly useful when you have data where multiple rows represent different attributes, categories, or time periods, and you want to consolidate this information into a more structured and easily analyzable format. Pivoting simplifies data analysis, visualization, and reporting by organizing related values into columns.
Here's a step-by-step guide on how to apply the pivot operation in Tableau:
- Step 1: Load Your Data: Start by opening Tableau and loading the dataset you want to pivot. Your dataset should contain columns that you want to transform into rows.
- Step 2: Identify Columns to Pivot: Identify the columns in your dataset that you want to pivot. These columns might represent attributes, categories, or time periods that you want to consolidate into a more concise format.
- Step 3: Select Data > Pivot: With your data loaded, go to the "Data" menu at the top of the Tableau window. From the dropdown menu, select "Pivot."
- Step 4: Configure Pivot: The Pivot dialog box will appear. In the "Columns to Pivot" section, you'll see a list of columns from your dataset that you can pivot. Drag and drop the columns you want to pivot from the "Available Fields" list to the "Columns to Pivot" list.
- Step 5: Provide Names for New Columns: For each column you're pivoting, you'll need to specify names for the new columns that will be created as a result of the pivot operation. These new columns will store the values from the original columns. You can customize these new column names to accurately reflect the data.
- Step 6: Pivoting Summary: The Pivot dialog box will provide a summary of the pivot operation, including the columns that will be pivoted and the new columns that will be created. Review this summary to ensure your pivot settings are accurate.
- Step 7: Apply Pivot: Once you're satisfied with the configuration, click the "OK" button to apply the pivot operation. Tableau will execute the pivot and generate a new table with the pivoted data.
- Step 8: Utilize Pivoted Data: The pivoted data will now be available in your Tableau worksheet. You'll notice that the columns you selected for pivoting have been transformed into rows, making it easier to analyze and visualize the data. You can now create visualizations, perform calculations, and build dashboards using the pivoted data to gain insights and present information effectively.
Applying Pivot in Tableau
Pivoting is a powerful data transformation technique in Tableau that allows you to reshape your data from a wide format to a tall or long format. This process is particularly useful when dealing with datasets that have multiple columns representing different categories, time periods, or attributes. By pivoting the data, you can make it more suitable for analysis, filtering, and visualization, ultimately enhancing your ability to uncover insights.
Here's a step-by-step guide on how to apply the pivot operation in Tableau:
- Step 1: Load Your Data:
Start by loading your dataset into Tableau. This dataset should contain the columns you want to pivot. These columns could represent categories, time periods, or attributes that you want to consolidate.
- Step 2: Identify Columns to Pivot:
Identify the columns that you want to pivot. These columns will become the new rows in the pivoted dataset. For example, consider a dataset with columns "Product," "Jan Sales," "Feb Sales," "Mar Sales," and so on. You might want to pivot the sales columns.
- Step 3: Select Data > Pivot:
Once your data is loaded, go to the "Data" menu at the top and select "Pivot." This action will open the Pivot dialog box.
- Step 4: Configure Pivot:
In the Pivot dialog box, you'll see a list of available fields. Drag the columns that you want to pivot from the "Available Fields" list to the "Columns to Pivot" list. In our example, you would drag "Jan Sales," "Feb Sales," "Mar Sales," and so on to the "Columns to Pivot" list.
- Step 5: Provide Names for New Columns:
After selecting the columns to pivot, you need to provide names for the new columns that will be created during the pivot operation. These new columns will contain the data from the pivoted columns. You can customize these new column names to reflect the original data more accurately. For instance, you might name the new column "Month" to store the month names and another column "Sales" to store the corresponding sales values.
- Step 6: Pivoting Summary:
In the Pivot dialog box, you'll see a summary of the pivot operation, including the new columns that will be created and the number of rows in the pivoted dataset. Review this summary to ensure that the pivot operation will yield the desired results.
- Step 7: Apply Pivot:
Once you're satisfied with the configuration, click the "OK" button to apply the pivot operation. Tableau will perform the pivot and generate a new table with the pivoted data.
- Step 8: Use Pivoted Data:
The pivoted data will now be available in your Tableau worksheet. You'll see that the columns you selected for pivoting have been transformed into rows, making it easier to perform analysis and create visualizations. You can use the pivoted data to create charts, graphs, and dashboards that showcase insights based on the pivoted attributes.
Pivoting is a valuable data transformation technique in Tableau that allows you to reshape wide datasets into a more structured format for analysis and visualization. By following these steps, you can effectively pivot your data and unlock new insights that might have been hidden in the original format. Pivoting empowers you to explore and present your data in a way that aligns with your analytical goals.
Handling Pivot Challenges and Considerations
Handling pivot challenges and considerations in Tableau is essential to ensure accurate and meaningful analysis after transforming data. While pivoting offers numerous benefits, it can also introduce complexities that need to be managed effectively. Here's a guide to address pivot challenges and considerations:
- Data Type Consistency: Ensure that the data type of values being pivoted is consistent across the entire column. Inconsistent data types can lead to errors or unexpected results.
- Handling Null Values: Decide how to handle null values within the columns being pivoted. Consider using functions like ZN() to handle nulls appropriately.
- Multiple Aggregations: When pivoting results in multiple values for the same measure, determine how you want to aggregate them. Choose the appropriate aggregation method, such as SUM, AVG, MAX, etc.
- Data Volume: Pivoting can expand the data horizontally, potentially leading to a larger dataset. Consider the impact on performance and storage, especially when dealing with large datasets.
- Data Validation: Validate the results of the pivot transformation to ensure that the new structure aligns with your expectations and the original data.
- Data Integrity: Pivot operations might require additional data cleaning and validation to ensure that the new structure retains data integrity.
- Joining and Blending: Consider the implications of pivoting on subsequent data joins or blending, as the pivoted data might need to be incorporated into other analyses.
- Data Refresh: Be aware of the impact of pivot transformations on data refresh schedules and performance, especially in live connections.
- Calculation Adjustments: Pivoting can affect any calculations, fields, or formulas that reference the pivoted data. Ensure that these calculations remain accurate.
- Visualization Adjustments: After pivoting, adjust any visualizations or dashboards that relied on the previous data structure.
- Documentation: Maintain clear documentation of the pivot process, including the columns pivoted, the rationale behind the transformation, and its impact on analysis.
- Pivot Limitations: Be aware that not all scenarios can be effectively handled through pivoting. In some cases, data restructuring might be better achieved through other methods.
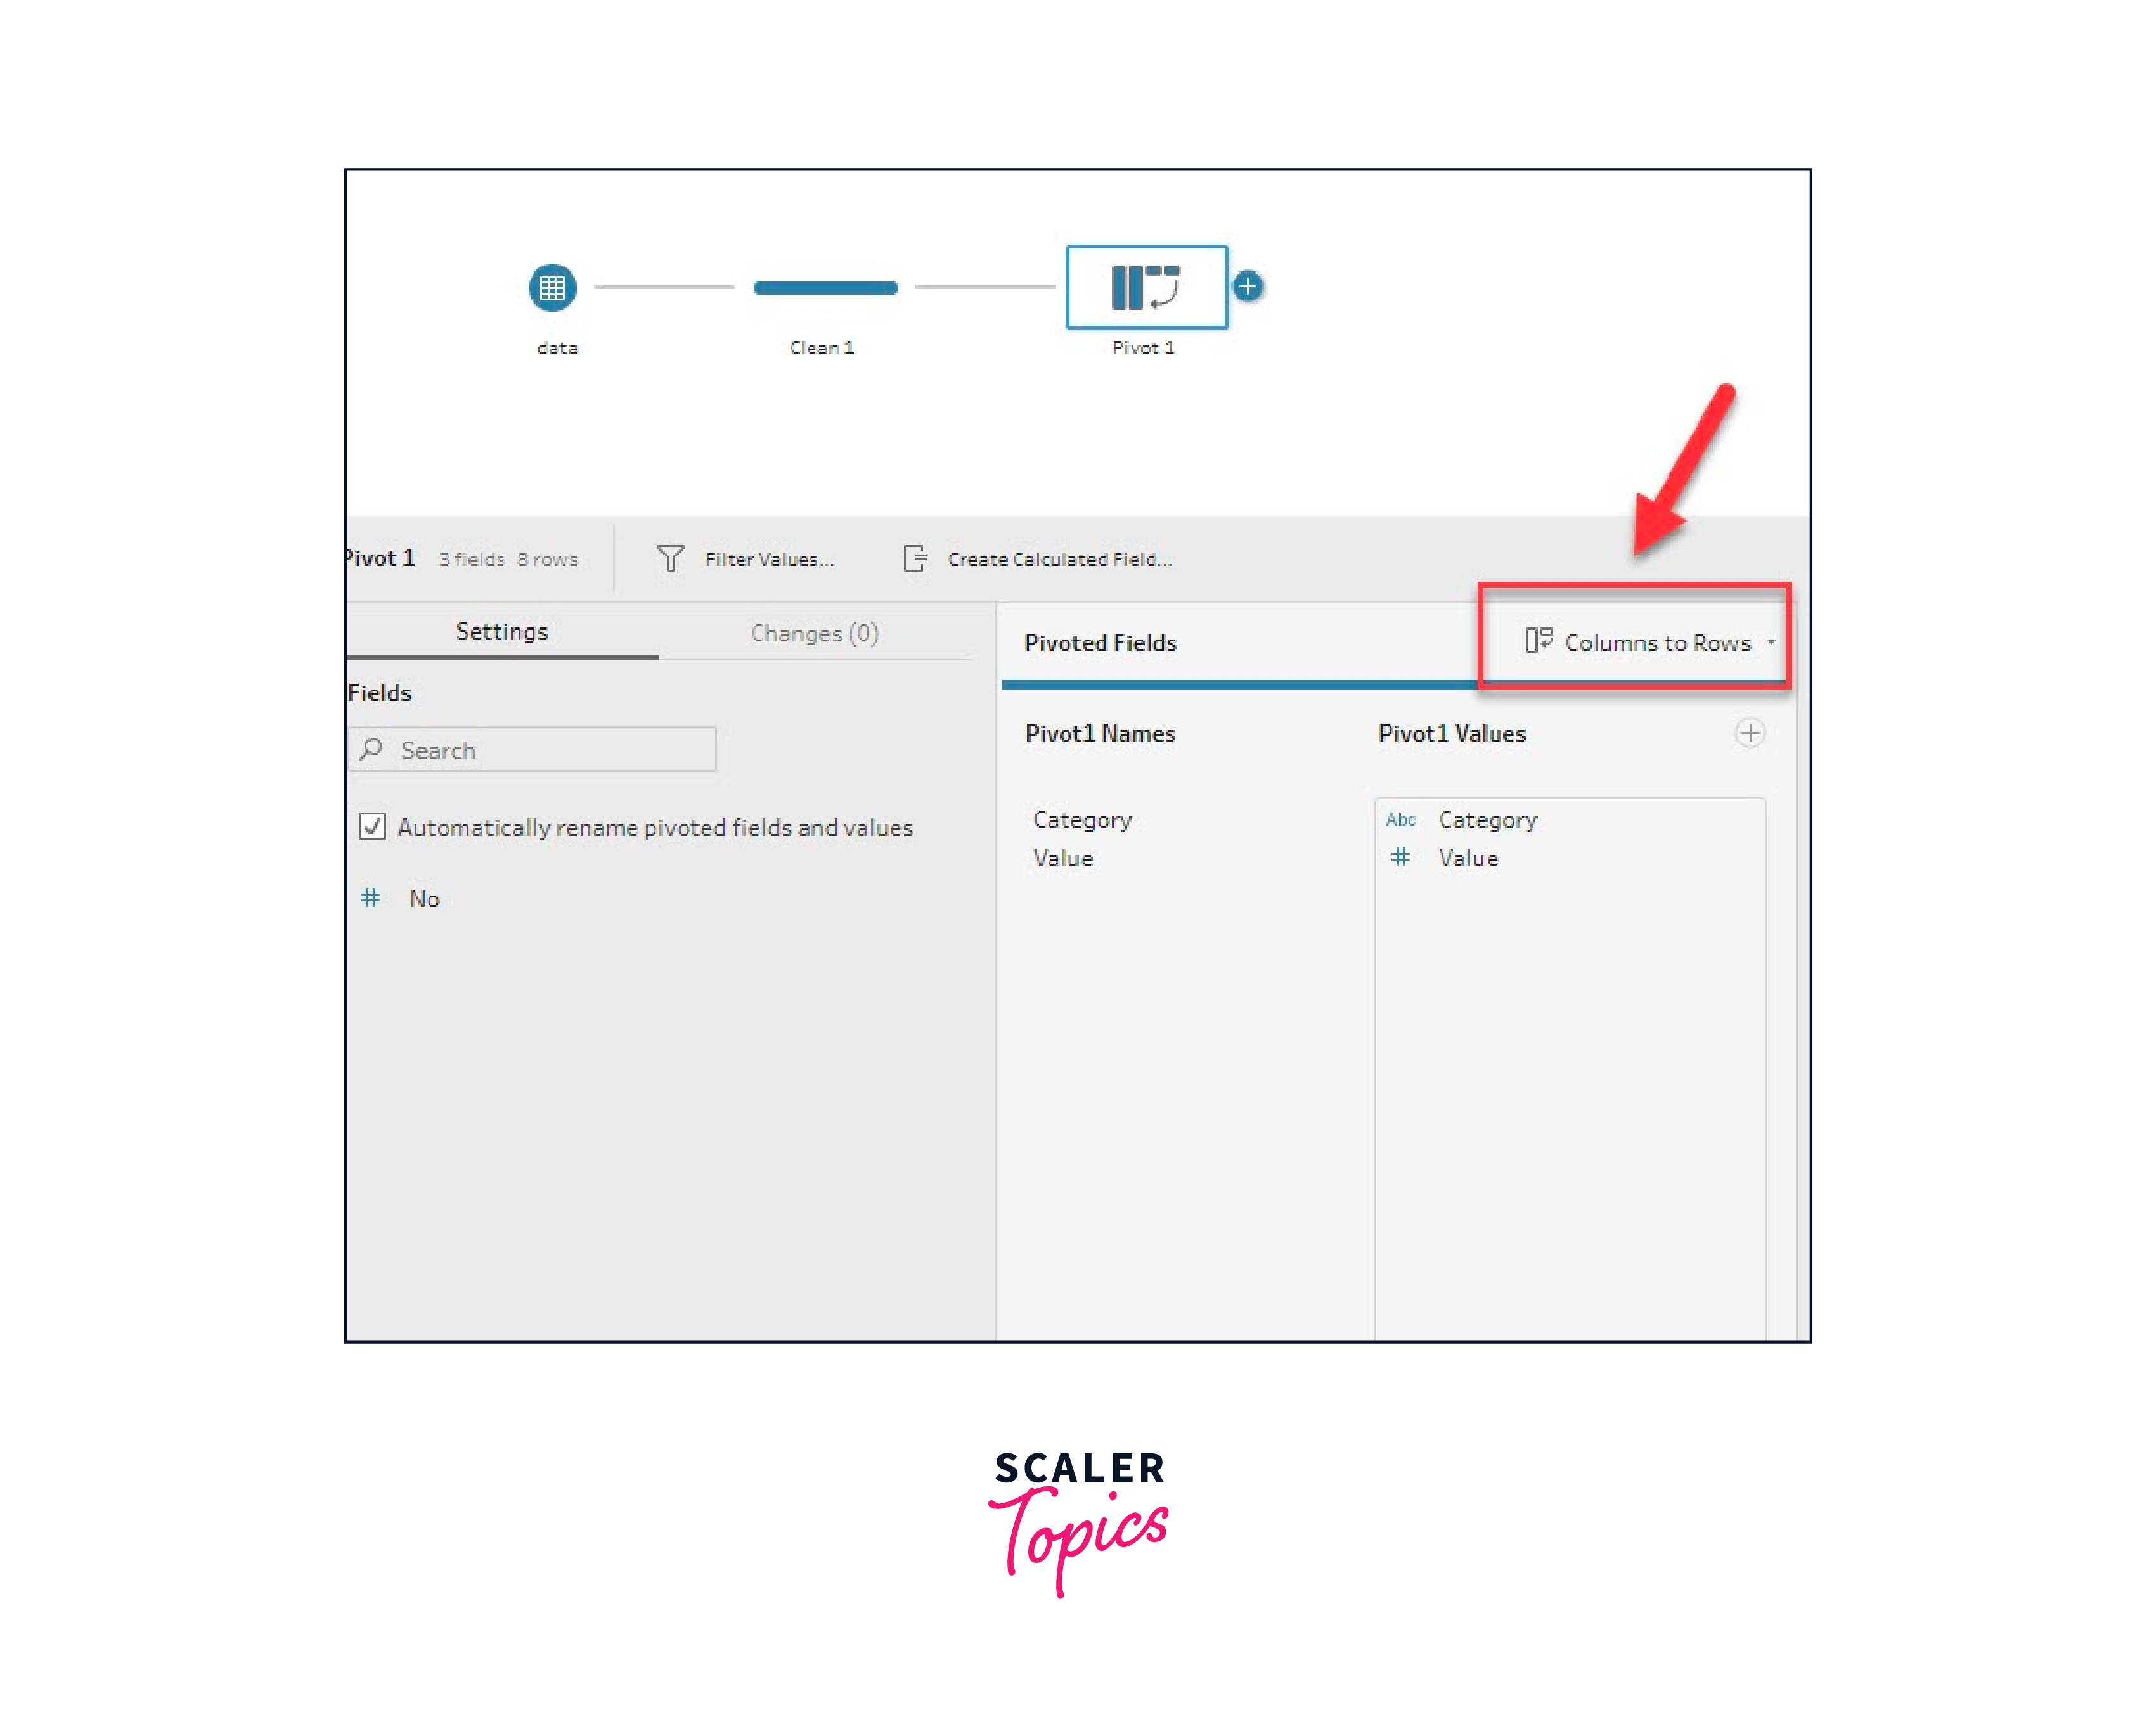
Transposing Columns to Rows
Unpivot Data Transformation
Unpivoting, also known as melting or reshaping from a long to wide format, is a crucial data transformation technique in Tableau that enables you to revert data back to its original structure. This process is particularly useful when you want to consolidate multiple rows representing different categories or attributes into columns. Unpivoting allows you to prepare data for specific analytical tasks, data integration, and visualization purposes, enhancing your ability to gain insights from complex datasets.
Here's a detailed guide on how to apply the unpivot operation in Tableau:
- Step 1: Load Your Data:
Begin by loading your dataset into Tableau. This dataset should have a structure where attributes that should be columns are currently in rows. This might be a dataset with rows representing different categories, dates, or attributes.
- Step 2: Identify Attributes to Unpivot:
Identify the attributes (columns) that you want to unpivot or reshape into rows. These are the attributes that will become values in a new "Attribute" column, while their corresponding values will be stored in another column.
- Step 3: Select Data > Unpivot:
Once your data is loaded, navigate to the "Data" menu at the top and choose the "Unpivot" option. This will open the Unpivot dialog box.
- Step 4: Configure Unpivot:
In the Unpivot dialog box, you'll see a list of available fields. Select the attributes that you want to unpivot and move them from the "Available Fields" list to the "Columns to Unpivot" list. These attributes will become values in the new "Attribute" column.
- Step 5: Provide Names for New Columns:
Next, you need to provide names for two new columns that will be created during the unpivot operation: * Attribute Column: This column will store the attribute names that you selected for unpivoting. For example, if you're unpivoting columns named "Q1 Sales," "Q2 Sales," and so on, the "Attribute" column might contain values like "Q1 Sales," "Q2 Sales," and so on. * Value Column: This column will store the corresponding values of the attributes being unpivoted. It might contain the actual sales values for each quarter.
- Step 6: Unpivoting Summary:
In the Unpivot dialog box, you'll find a summary of the unpivot operation, showing the new columns that will be created and the number of rows in the unpivoted dataset. Review this summary to ensure that the operation will yield the expected outcome.
- Step 7: Apply Unpivot:
Once you've configured the unpivot settings, click the "OK" button to execute the unpivot operation. Tableau will perform the transformation and generate a new dataset with the reshaped data.
- Step 8: Utilize Unpivoted Data:
The newly unpivoted data will be available in your Tableau worksheet. You'll notice that the attributes you selected for unpivoting have been transformed from columns to rows, allowing for more focused analysis and visualization. You can now utilize this data to create insightful charts, graphs, and dashboards that highlight trends and patterns based on the unpivoted attributes.
Performing Unpivot in Tableau
Performing the unpivot operation in Tableau involves converting column-based data into a more normalized format, where each row represents a unique combination of attributes and values. This process is valuable for analyzing data at a more granular level and creating dynamic visualizations. Here's how to perform the unpivot operation in Tableau:
- Connect to Data Source: Start by connecting to your data source in Tableau Desktop.
- Data Source Tab: Once connected, navigate to the "Data Source" tab at the bottom of the screen.
- Select Columns to Unpivot: In the Data Source tab, select the columns that you want to unpivot. These are the columns containing attributes or categories that need to be transformed into rows.
- Right-Click and Unpivot: Right-click on the selected columns and choose "Unpivot."
- Define Unpivot Options:
- Name Column: Specify a new column that will hold the attribute names from the unpivoted columns.
- Value Column: Specify a new column that will hold the corresponding values from the unpivoted columns.
- Apply Unpivot: Click "OK" to apply the unpivot transformation.
- View Unpivoted Data: Return to the "Data Source" tab or navigate back to the "Data" tab to view the transformed data in a more normalized format.
- Use in Visualizations: Utilize the unpivoted data in your visualizations, calculations, and analysis. The data is now structured to enable a more detailed exploration.
Conclusion
- Data transposition enables users to adapt data orientation to match their analysis objectives, facilitating a more insightful understanding of trends, patterns, and relationships.
- Pivoting and unpivoting allow users to structure data in ways that suit the creation of specific visualizations, making it easier to communicate complex information effectively.
- Unpivoting normalizes data, which is particularly useful when dealing with aggregated or wide datasets, allowing for more detailed exploration.
- Pivoting can convert data from a wide format (multiple attribute columns) to a long format (attribute-value pairs), enhancing the ability to perform multi-dimensional analysis.
- Data transposition provides flexibility to adapt data structures to changing analytical needs without altering the original dataset.