Talend in Big Data
Overview
With Talend's big data platform, users can perform data integration, manage the data, ensure data quality, prepare the data, and deal with big data. Talend's big data platform offers various big data components available in the Talend Open Studio. These tools help to work efficiently and onboard users easily to get started with creating and executing the Hadoop jobs with its simple to use drag and drop Hadoop components.
Introduction
We know that dealing with big data with our traditional relational database systems is not efficient. We need a solution that can not only handle the huge amount of data but also contribute to simplifying the ETL/ELT (Extract-Transform-Load or Extract-Load-Transform) process too. This would help the users spend time gaining insights from the data rather than spend time dealing with the data processing.
To ensure users are efficiently working with big data and with the tagline that says “Simplify ETL and ELT with the leading free open source ETL tool for big data”, the Talend Big data platform was introduced. Talend's big data platform can be defined as a free, open-source, one-stop solution for data processing in the big data environment.
With Talend's big data platform, users can perform data integration, manage the data, and data quality, prepare the data, and deal with big data. Talend's big data platform offers various big data components available in the Talend Open Studio. These tools help to work efficiently and onboard users easily to get started with creating and executing the Hadoop jobs with its simple to use drag and drop Hadoop components. Users also don't have to worry about writing long code for MapReduce as with the Talend Open Studio Big data, users can automatically generate the MapReduce code and configure the parameters as per requirement.
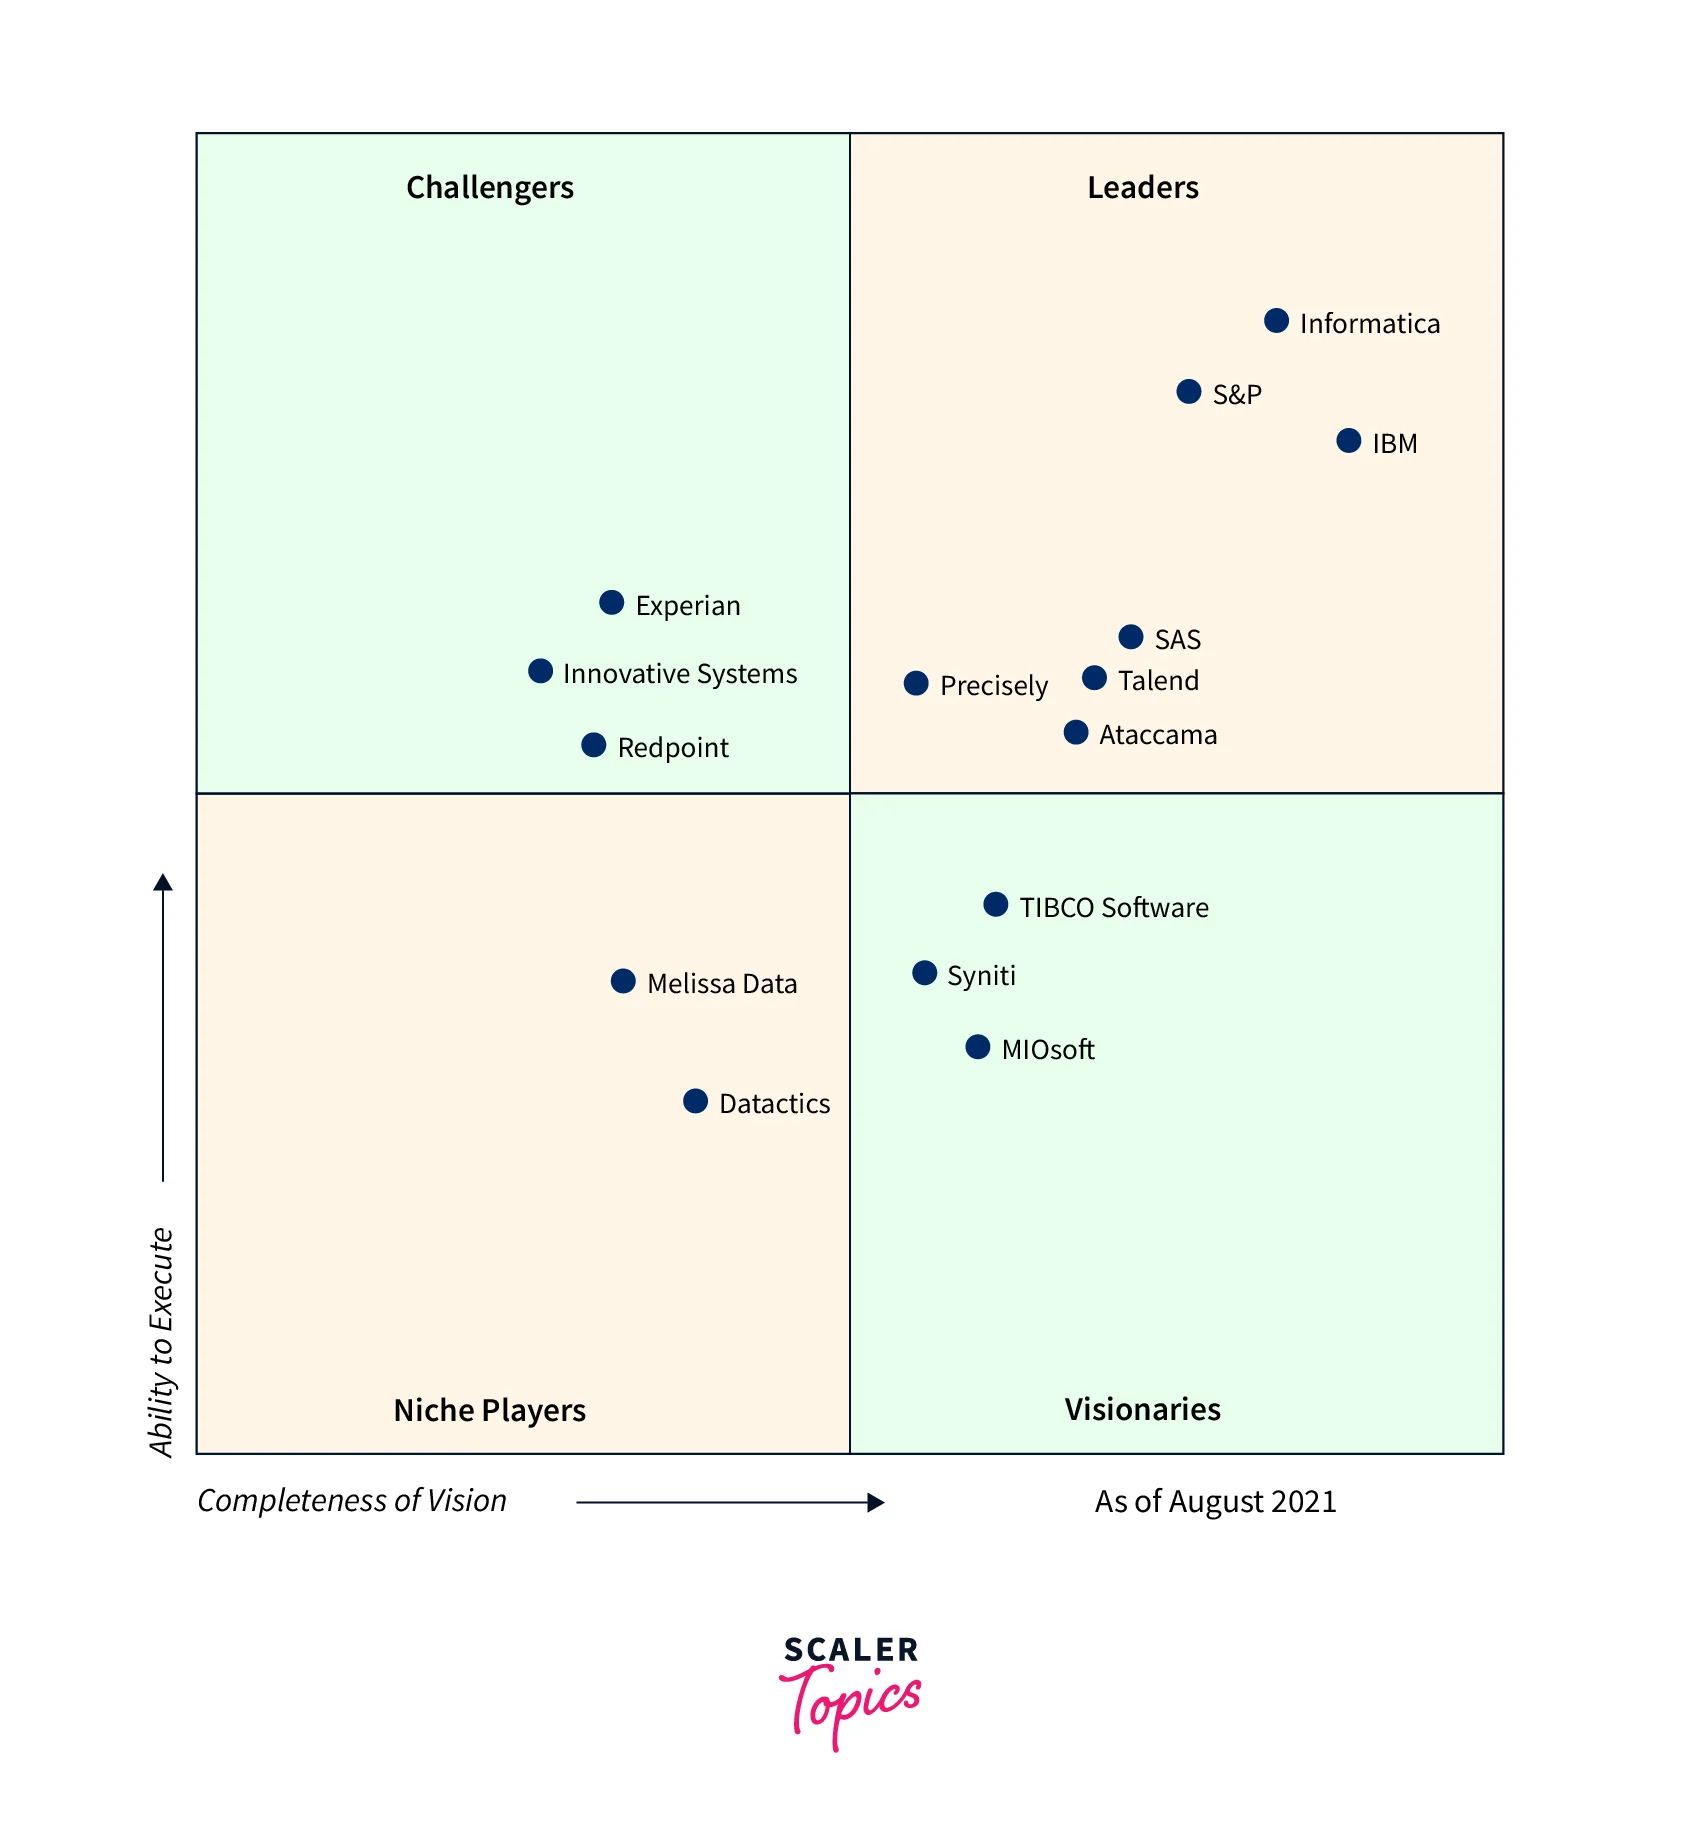
Connecting with various other known platforms like HortonWorks, MapR, Cloudera, Amazon EMR, and even Apache can be easily achieved with the help of the plugins offered. Research from Gartner also suggests that Talend's big data platform falls in the Leader magic quadrant for Data Integration tools as seen below.
Some of the commercial products offered by Talend's big data platform are listed below −
- Talend Data Quality
- Talend Big Data
- Talend MDM (Master Data Management) Platform
- Talend Data Services Platform
- Talend Metadata Manager
- Talend Data Fabric
- Talend Open Studio
- Talend Data Integration
- Talend Data Preparation
- Talend Cloud
Functional Architecture of Talend Big Data Platform
We shall now be focusing on the functional architecture of the Talend big data platform where most of the products from Talend are combined into a set of user-friendly and powerful solutions. The data integration solution from Talend's big data platform can be useful for an organization that is looking for an easier way of dealing with exponentially growing system complexities. Issues related to both, ETL for operational integration, as well as ETL for big data analytics, are resolved with Talend's industrialization characteristics as well as broadened monitoring abilities.
The big data solution that is built over the Talend big data integration solution, gives its users the capability for accessing, transforming, transferring as well as synchronizing the big data. This also allows its users to leverage the Apache Hadoop Big Data Platform which eventually makes the Hadoop platform quite user-friendly. To talk about data quality, users can navigate across profiles and start cleaning the data that is available from various data sources. Users can also search for the analyzed data and simultaneously generate reports via the Talend Data Quality Portal.
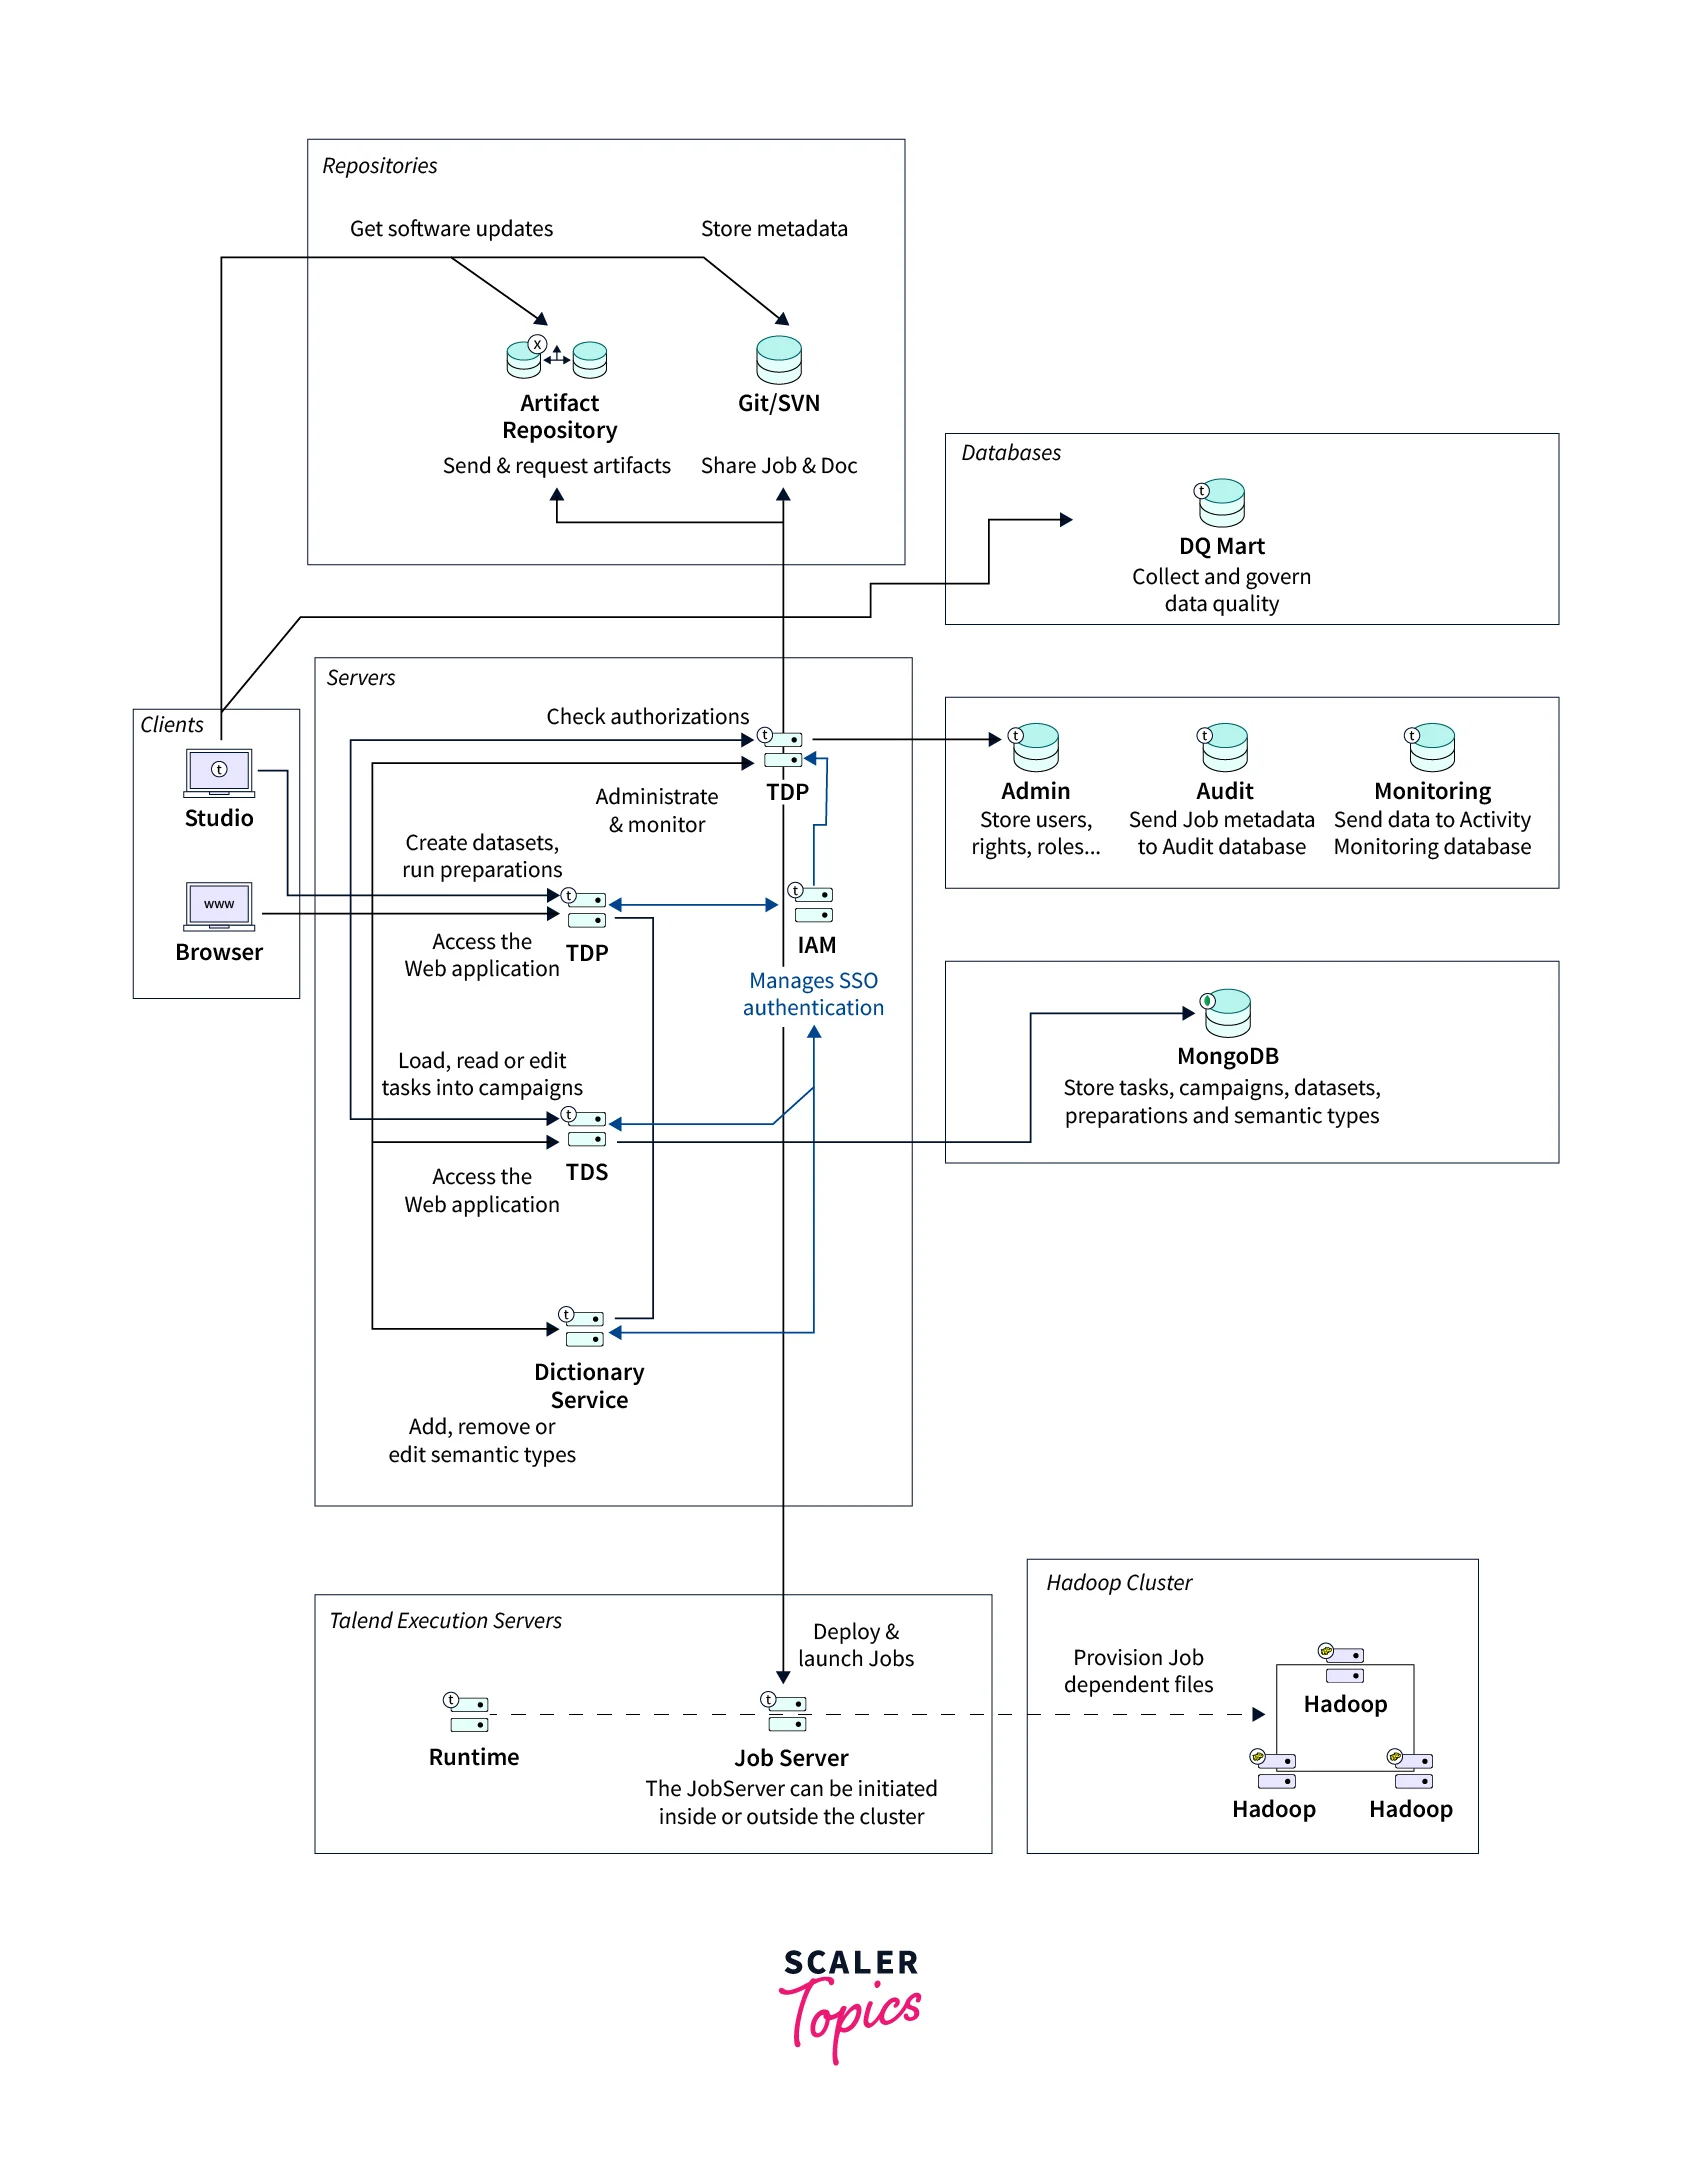
The functional architecture of the Talend big data platform can also be represented as an architectural model that helps its users to automatically identify the related Talend big data platform functions, and their interconnections as well as meeting their suitable IT needs. The entire architecture has been designed keeping in mind the user's needs and by specifically isolating the defined functionalities as functional blocks.
Given below are the main architectural functional blocks from the Talend big data platform.
The Different Types of Functional Blocks
Various types of functional blocks from the Talend data platform are described below:
- Users can efficiently design as well as easily launch big data jobs through the Apache Hadoop cluster via the Talend Studio, for effectively handling huge data sets. Once the users have launched the jobs, these are sent, deployed, and run on the defined Apache Hadoop cluster.
- While working with the AWS EMR cluster, it is recommended that the JobServer or Runtime is installed in the cluster.
- To analyze the data stored across various data sources, and scan and query the results from the analysis, users can use the predefined patterns and indicators from the Talend Studio. This also helps to remove incomplete, irregular, corrupt, or inaccurate data records.
- It's recommended to install the JobServer or Runtime in the EDGE node machine while working with the Hortonworks cluster. This way users can avoid any potential firewall and access-related difficulties.
- The huge datasets can be handled by the Apache Hadoop cluster independent of the Talend system.
- From deploying the job to its execution, Talend JobServer or Runtime can help the users by simply installing it either inside or outside the Apache Hadoop cluster.
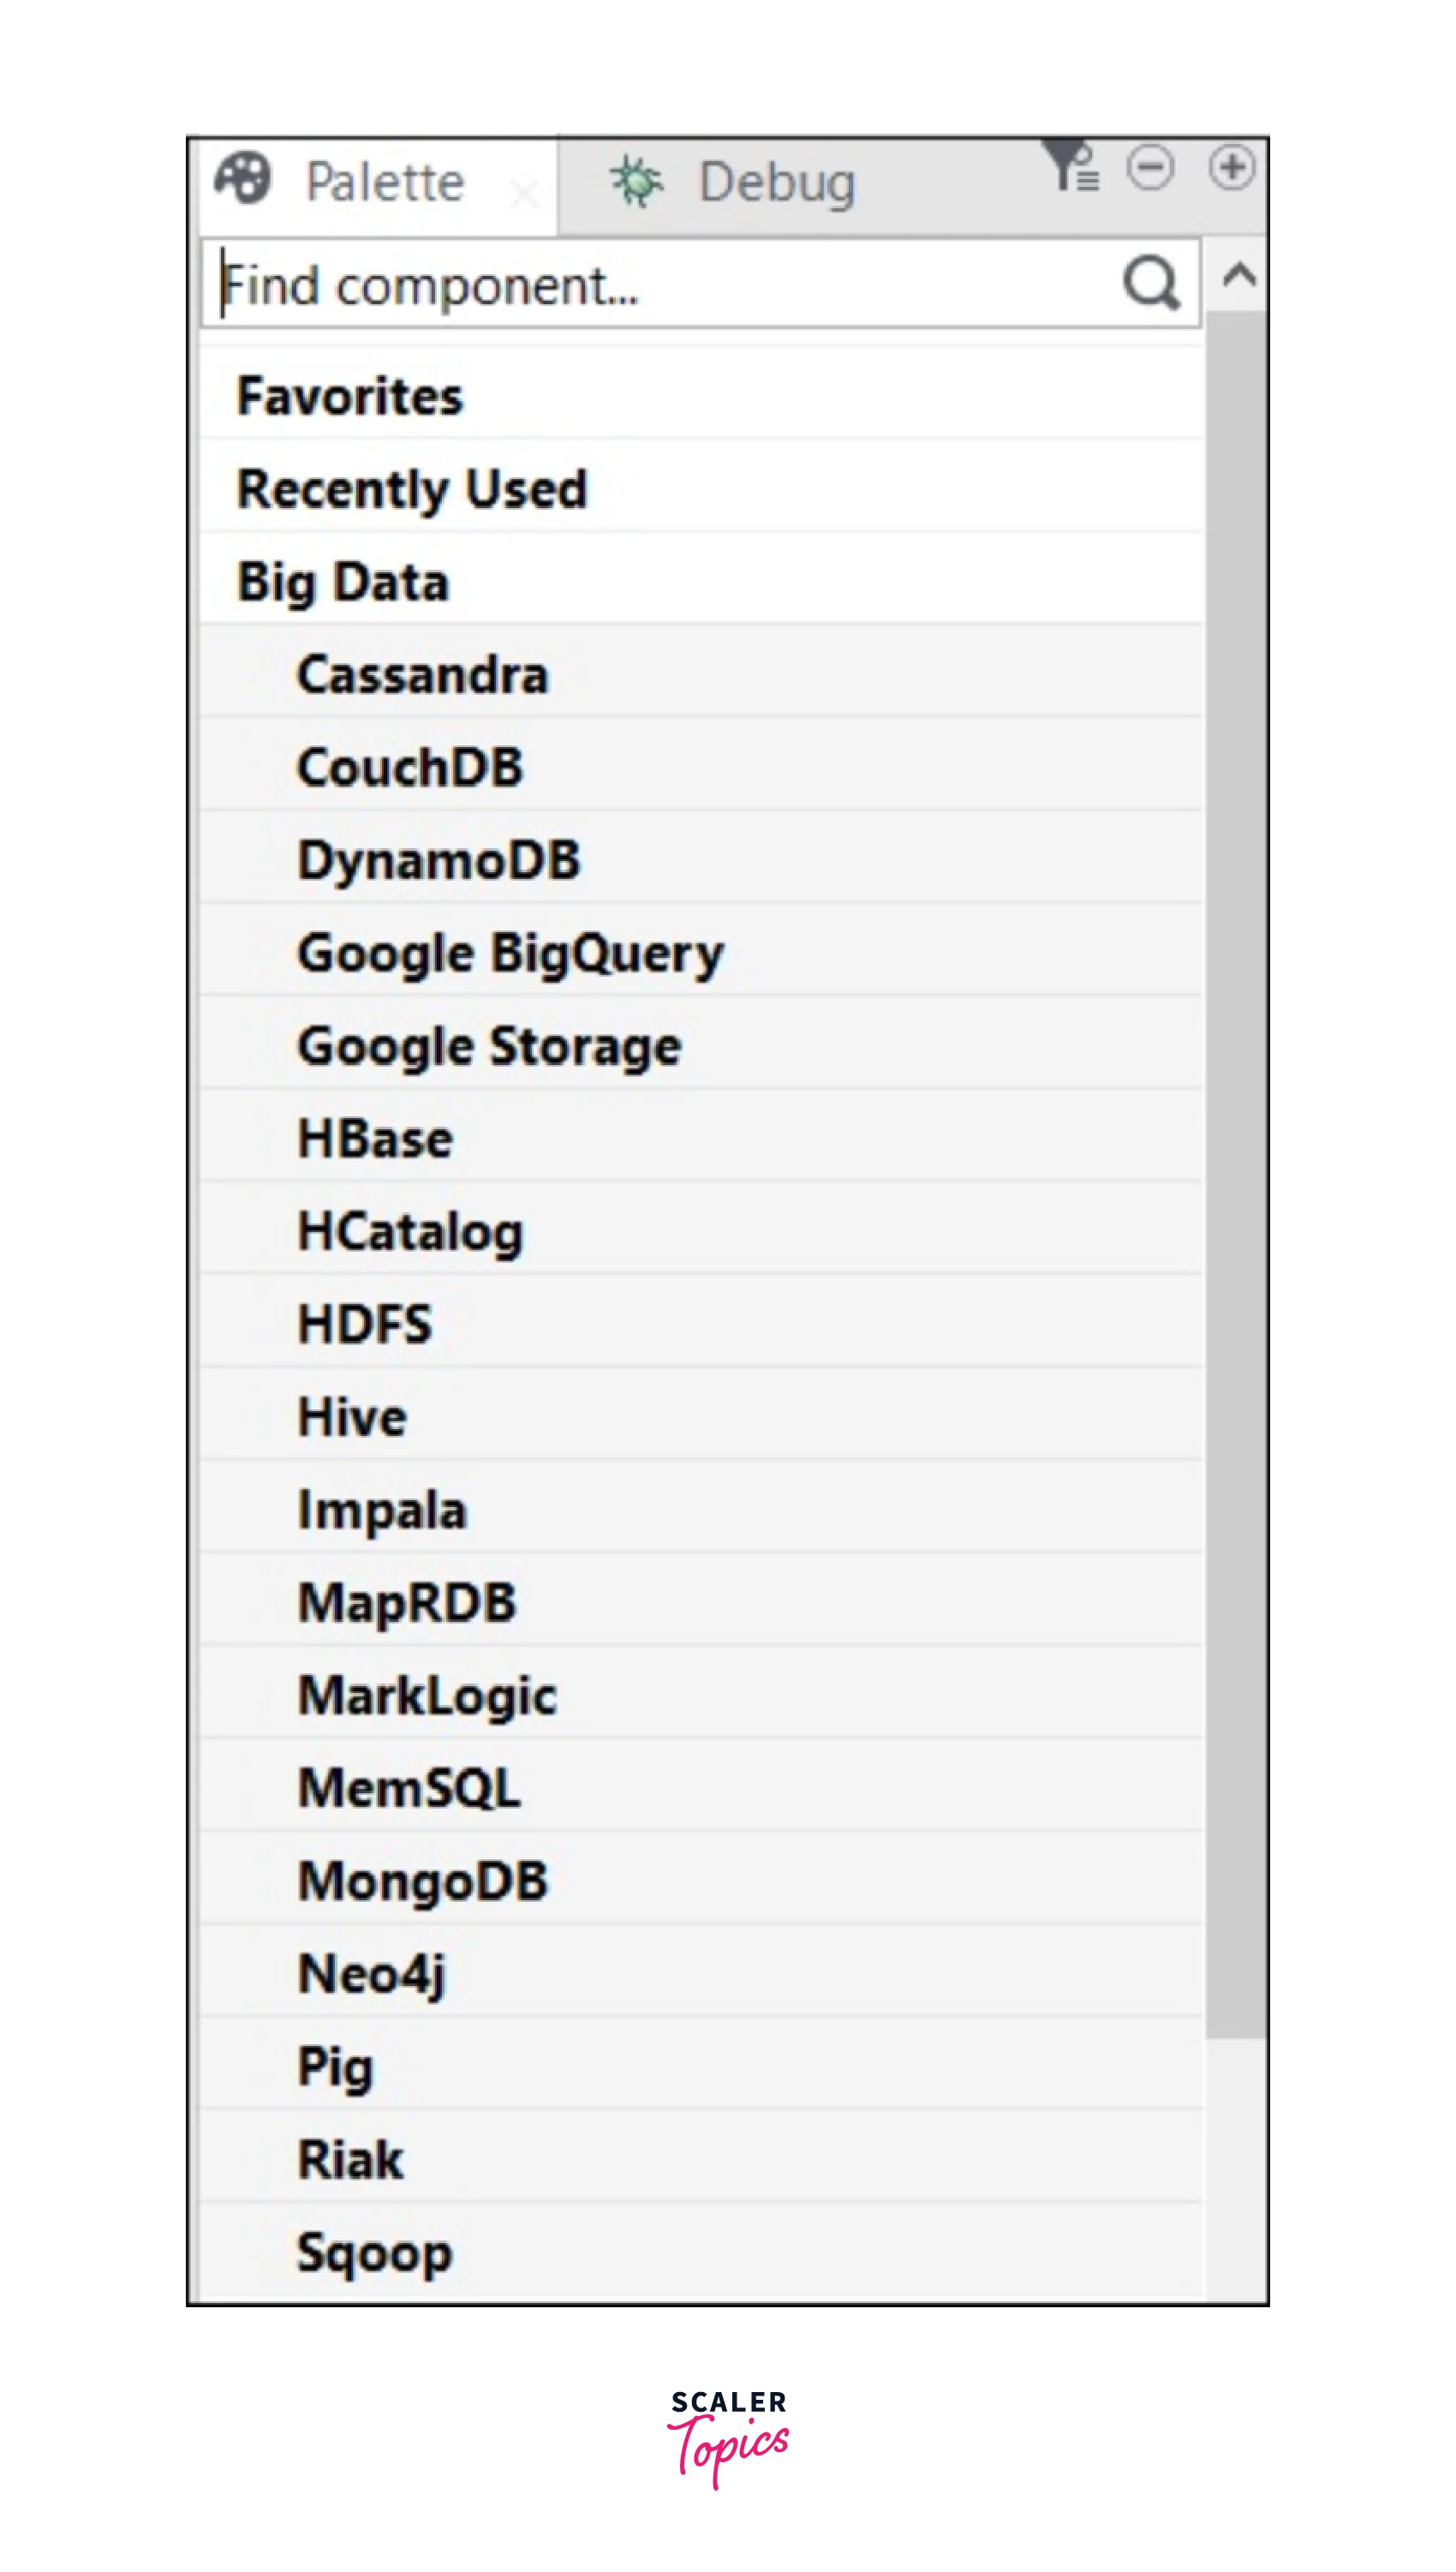
Talend Components for Big Data
Listed below are a few of the many Talend big data connectors and components in their Open Studio. Let us discuss each one by one.
| Connectors | Description |
|---|---|
| tHiveLoad | Helpful when the user needs to write data to the Hive table or any defined directory. |
| tHDFSExist | Validates if a file is present or not in the HDFS. |
| tCassandraRow | Useful to run CQL (Cassandra Query Language) queries on the defined database. |
| tSqoopExport | Users can transfer the data from the HDFS location to a relational database such as MySQL, or Oracle DB. |
| tHiveCreateTable | Users can easily create tables inside a Hive database. |
| tHDFSConnection | Can be implemented while connecting to the Hadoop Distributed File System. |
| tHiveConnection | Helpful in opening the connection to the Hive database. |
| tHDFSPut | Users can use this when they want to copy the respective file/folder from the local user-defined file system to the HDFS-defined path. |
| tHDFSOutput | Can be used to write the data flows in HDFS. |
| tCassandraConnection | Used to open the connection to the Cassandra server. |
| tPigLoad | You can easily load the input data to an output data stream in a single transaction after the data has been validated. |
| tHBaseInput | Users can read the data from the HBase database. |
| tHBaseConnection | Helpful in opening the connection to the HBase database. |
| tHDFSInput | Can be implemented when the users need to read the data from a defined HDFS path, and put it into the Talend schema. |
| tPigMap | Users can make use of this connector for transforming the data and routing it to a Pig process. |
| tHiveRow | Helpful if users want to run HiveQL queries on the defined database. |
| tHDFSDelete | Can be implemented to delete any specific file from the HDFS. |
| tHDFSList | This connector helps to retrieve the files and folders lying in the defined HDFS path. |
| tHiveInput | Used to read the data from the Hive database. |
| tSqoopImport | Users can implement this connector when they want to transfer data from a relational database such as Oracle DB, or MySQL to the HDFS. |
| tHDFSGet | Users can use this to copy the respective file/folder from the HDFS to the local user-defined file system from the HDFS-defined path. |
Installing Talend Big Data Platform
In this section, we shall be covering how you can quickly and easily download as well as install the Talend big data platform.
- After subscribing to the Talend Big Data Platform, you will be receiving an email containing the license file, which is very important as with this file, users can easily install and access each Talend module.
- Now, download the Talend Installer zip file via the link you will get in the email.
- To install the Talend Big Data Platform, via the Talend Installer, you need to unzip it and open the Talend Installation wizard. Ensure that the “Talend-Installer-Starter-YYYYMMDD_HHmm-VA.B.C-installer.zip” dist is in the same directory as the Installer.
- Accept the License Agreement and you can select an installation mode.
- Specify the license file to authorize your installation. Then as per the license received, you can select from the available licenses.
- Ensure to select Talend Administration Center, Talend Runtime, Talend Data Quality Data Mart, and Talend Studio to install the modules with their default settings. Once done, you can select the Finish option to close the wizard.
- Once done, all the required modules are installed in the computer and you can start to set up the Talend Big Data Platform.
Talend Big Data Platform in Use
In this section of the article, we shall be understanding via an example how you can easily and quickly get started with the Talend big data platform. We shall be taking the example of an organization that offers show rental as well as other video streaming services. This way it would be easier to understand how an organization can implement the Talend big data platform.
Our objective with this exercise would be to gain the following perspective about Talend big data platform:
- Verify the information from customers like email addresses, and standardize the phone numbers so that Customer Support System can work efficiently.
Profiling and Cleansing Data
We start by first preparing the data where we shall be profiling and cleansing data. Here, we shall profile the customer's phone number and email address. We shall learn how we can identify any discrepancy in the address columns, and how to effectively utilize the Talend Jobs to recover the inconsistent data. Lastly, we shall learn how the users could easily generate periodic evolution reports for monitoring the data evolution and share the statistics received with the business users.
1. Setting up Input Customer Data for The Service
Assume the customer data that we shall be profiling is already stored in a MySQL database.
Note: For replicating the test scenario we are explaining here, you can simply download the 'gettingstarted.sql' file and import it in a MySQL database.
Pre-requisites:
- Access to a MySQL database.
- Download the 'tpbd_gettingstarted_source_files.zip' from the Talend_Downloads link and store the source file 'gettingstarted.sql' locally.
Step-by-Step Guide:
- Start by launching an instance of the MySQL Workbench.
- Click the Server > Data Import from the menu bar which will open the import wizard.
- Now select the Import option from the Self-Contained File option to find the location of the 'gettingstarted.sql' file.
- You can either define a new schema from the Click New option or select the schema according to which the data should be imported.
- Select the Start Import option at the lower right corner.
Output
You shall see that the 'gettingstarted' database is finally imported into the MySQL database.
2. Identifying the Inconsistencies/Anomalies in Data
To critically analyze the customer phone numbers and email addresses, we can learn how to utilize the Profiling perspective of the Studio. Here, we shall make use of some out-of-box indicators as well as patterns to showcase the consistent and inconsistent address data.
To clean the customer data, the Profiling Jobs are generated over the analysis of the result which can then monitor the evolution too. To browse over the inconsistent data, the user can utilize the Data Explorer perspective.
Step-by-Step Guide:
- Start by creating a column analysis of the customer's phone numbers and email addresses.
- From the Analysis editor, you can connect to the MySQL database where the data resides.
- With the help of the indicators, users can see statistics of the data like blanks, row count, or duplicate count.
- For matching phone numbers and email addresses, users can implement the standard patterns.
- To showcase the results in charts or tables, you can execute the analysis.
- For identifying invalid records, users can view the analyzed data.
- Users can remove the duplicated values from the data or any data records that are not following the standardized formats for email and phone numbers, by generating any out-of-box Jobs from analysis results.
3. Defining a Column Analysis
To validate the phone number and email in a MySQL database, users can create a column analysis from the Profiling perspective of the Studio and collect the statistics for it. The analysis runs on several columns but each column is analyzed separately and independently.
Pre-requisite:
Open the Profiling perspective in the Studio.
Step-by-Step guide:
- When you enter the Data Quality Repository view, you can go through the Analyses and click on New Analysis.
- Once the New Analysis is opened, users can type Basic Column Analysis in the search field.
- Once done, users can click Basic Column Analysis from the list.
- Users can enter a name in the Name field (mandatory field) for the analysis. Avoid using any space or special characters.
- To open the Analysis editor, the users need to set the purpose and description for that analysis.
Note: It is not necessary to fill the Purpose and Description fields, but users can fill in the information displayed in Detail View once they select the analysis.
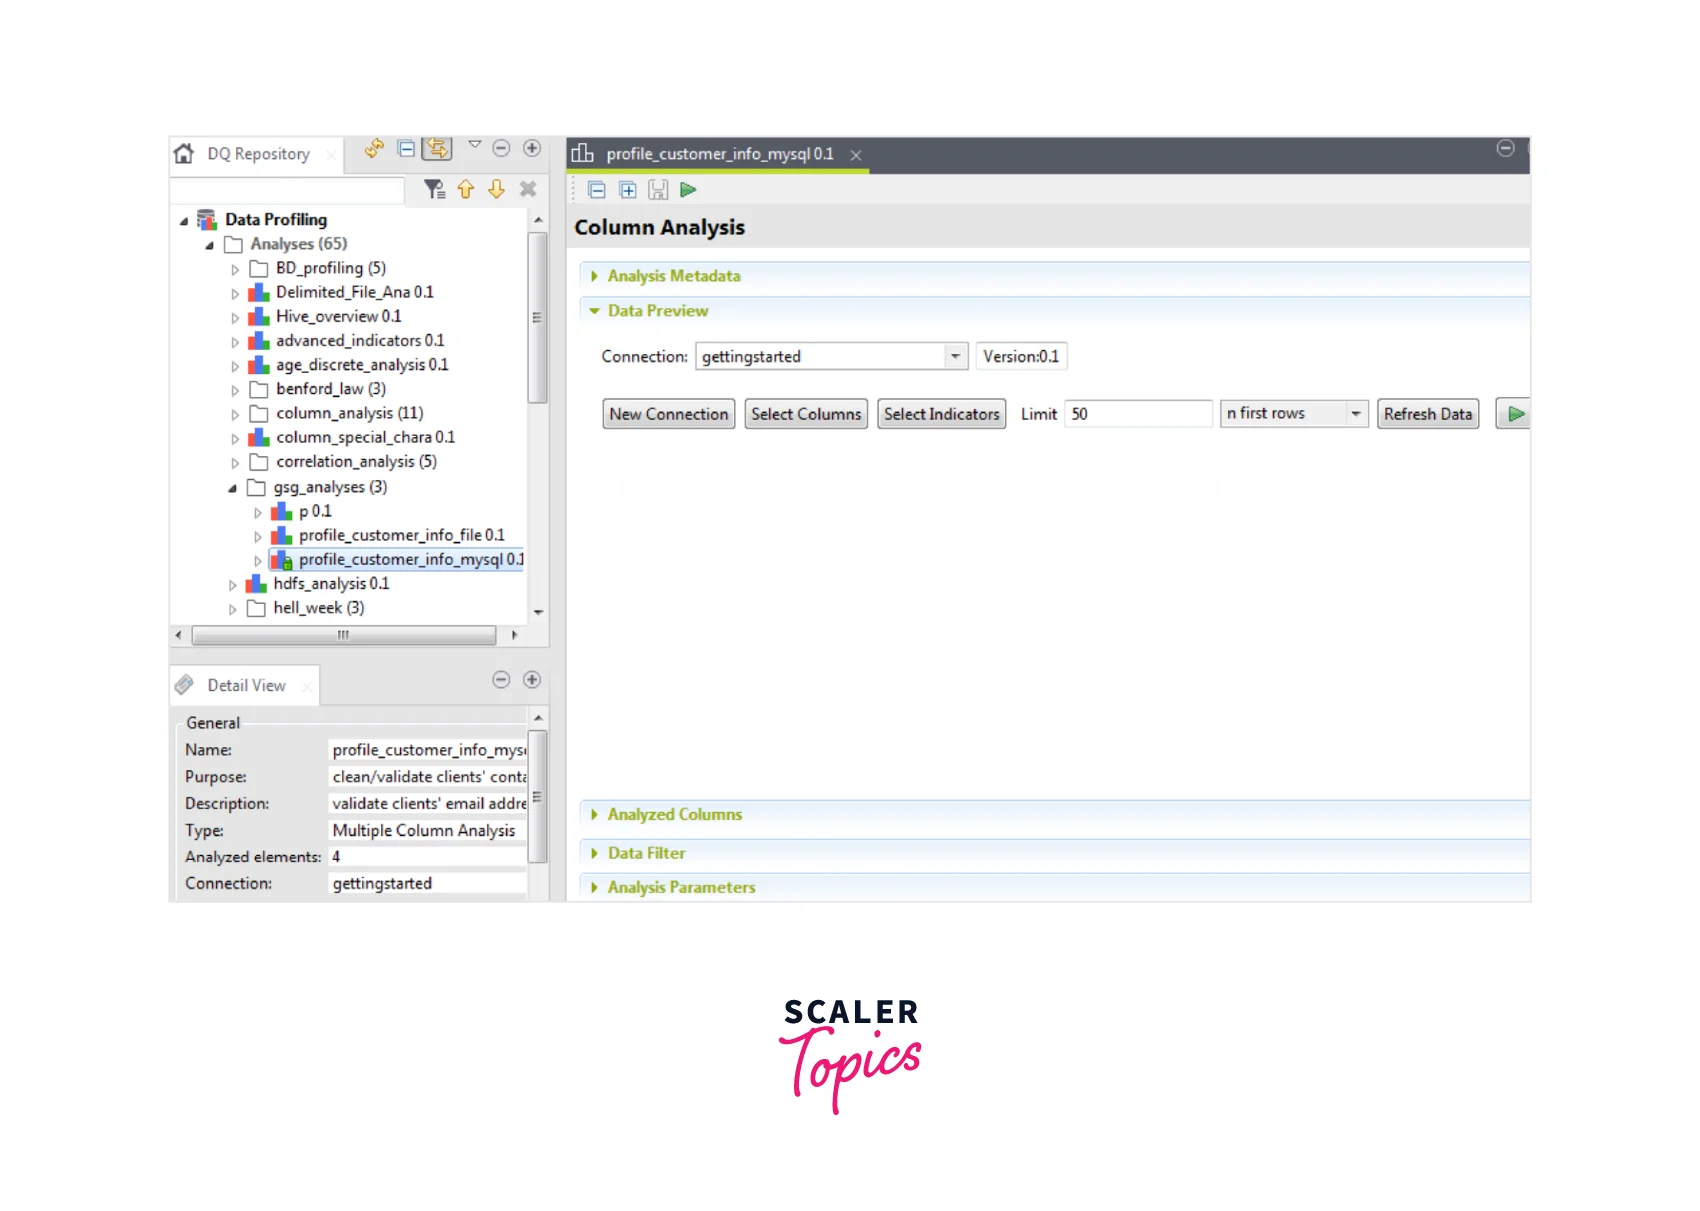
Output
Below is how the output shall be seen. Users can see that the new analysis is given in the Data Quality Repository tree view under the Analysis folder.
4. Creating the Database Connection
To analyze the customer data, we first need to establish a connection to the MySQL database.
Pre-requisites:
- Open the Profiling perspective in the Studio.
- Create a column analysis and open the Analysis editor.
- Import the 'gettingstarted.sql' file.
Step-by-Step guide:
- In the Analysis editor, select the New Connection tab and open the Create New Connection window.
- Users can opt for the database connections via the Connection Type list.
- To create the database connection, select the Finish button. Then users need to list as part of the Metadata node.
- Once done, users can open a new step and expand the DB connection.
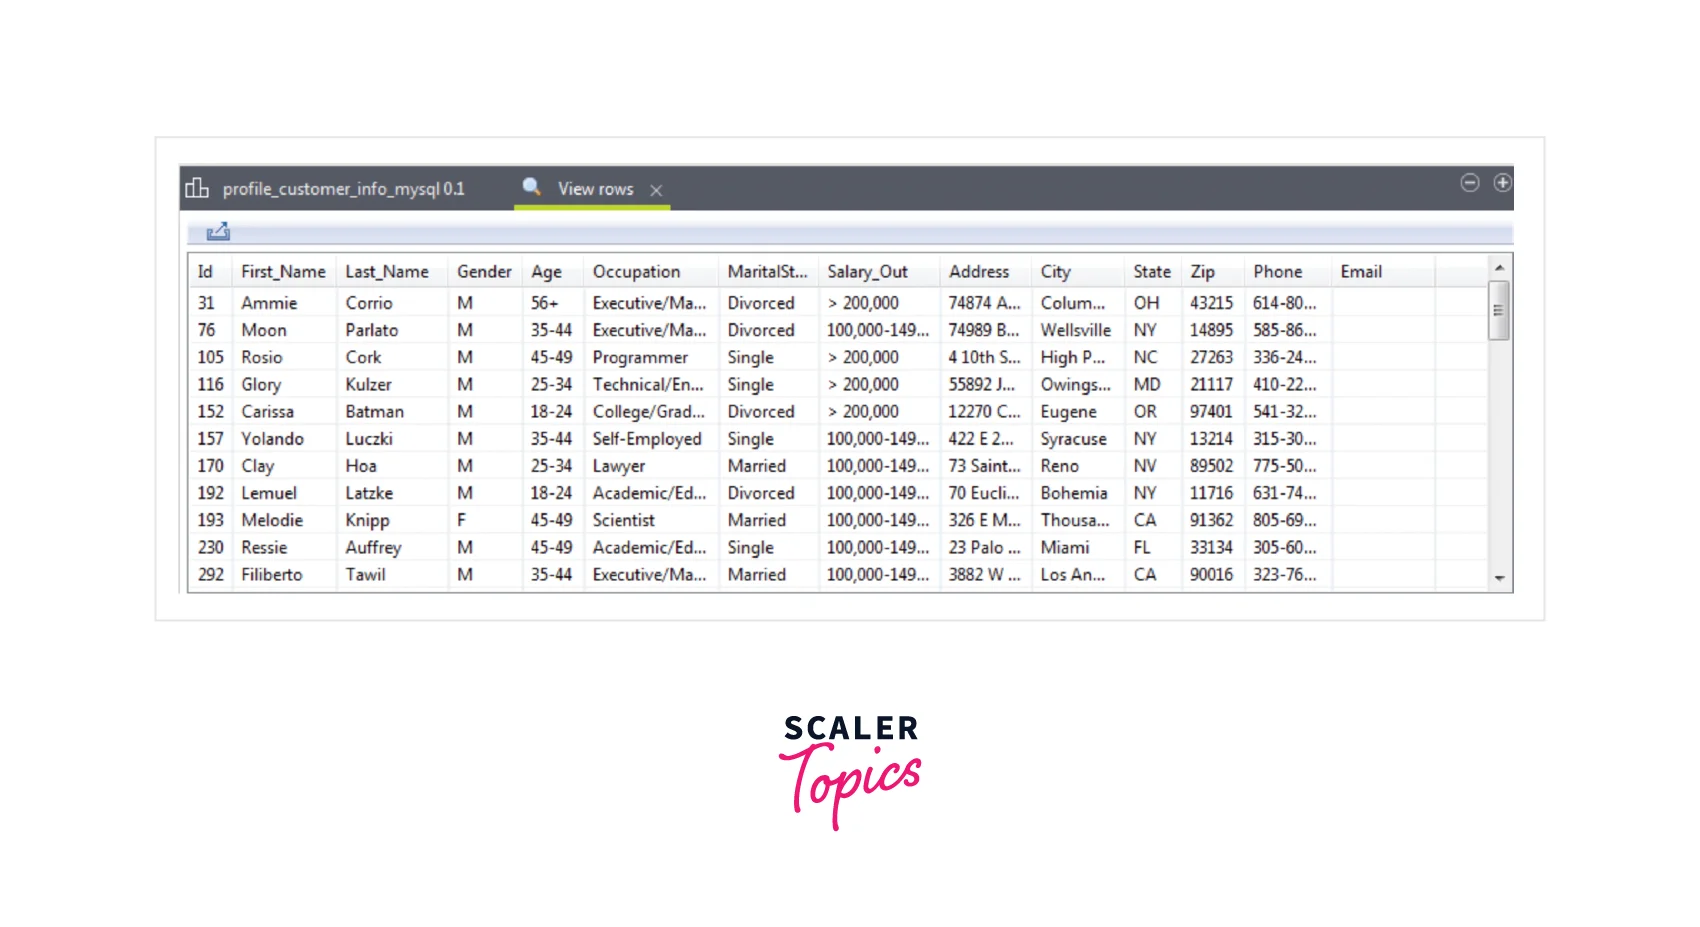
- Select the defined table name and select all the required check boxes for the columns where users need to create the analysis as seen below.
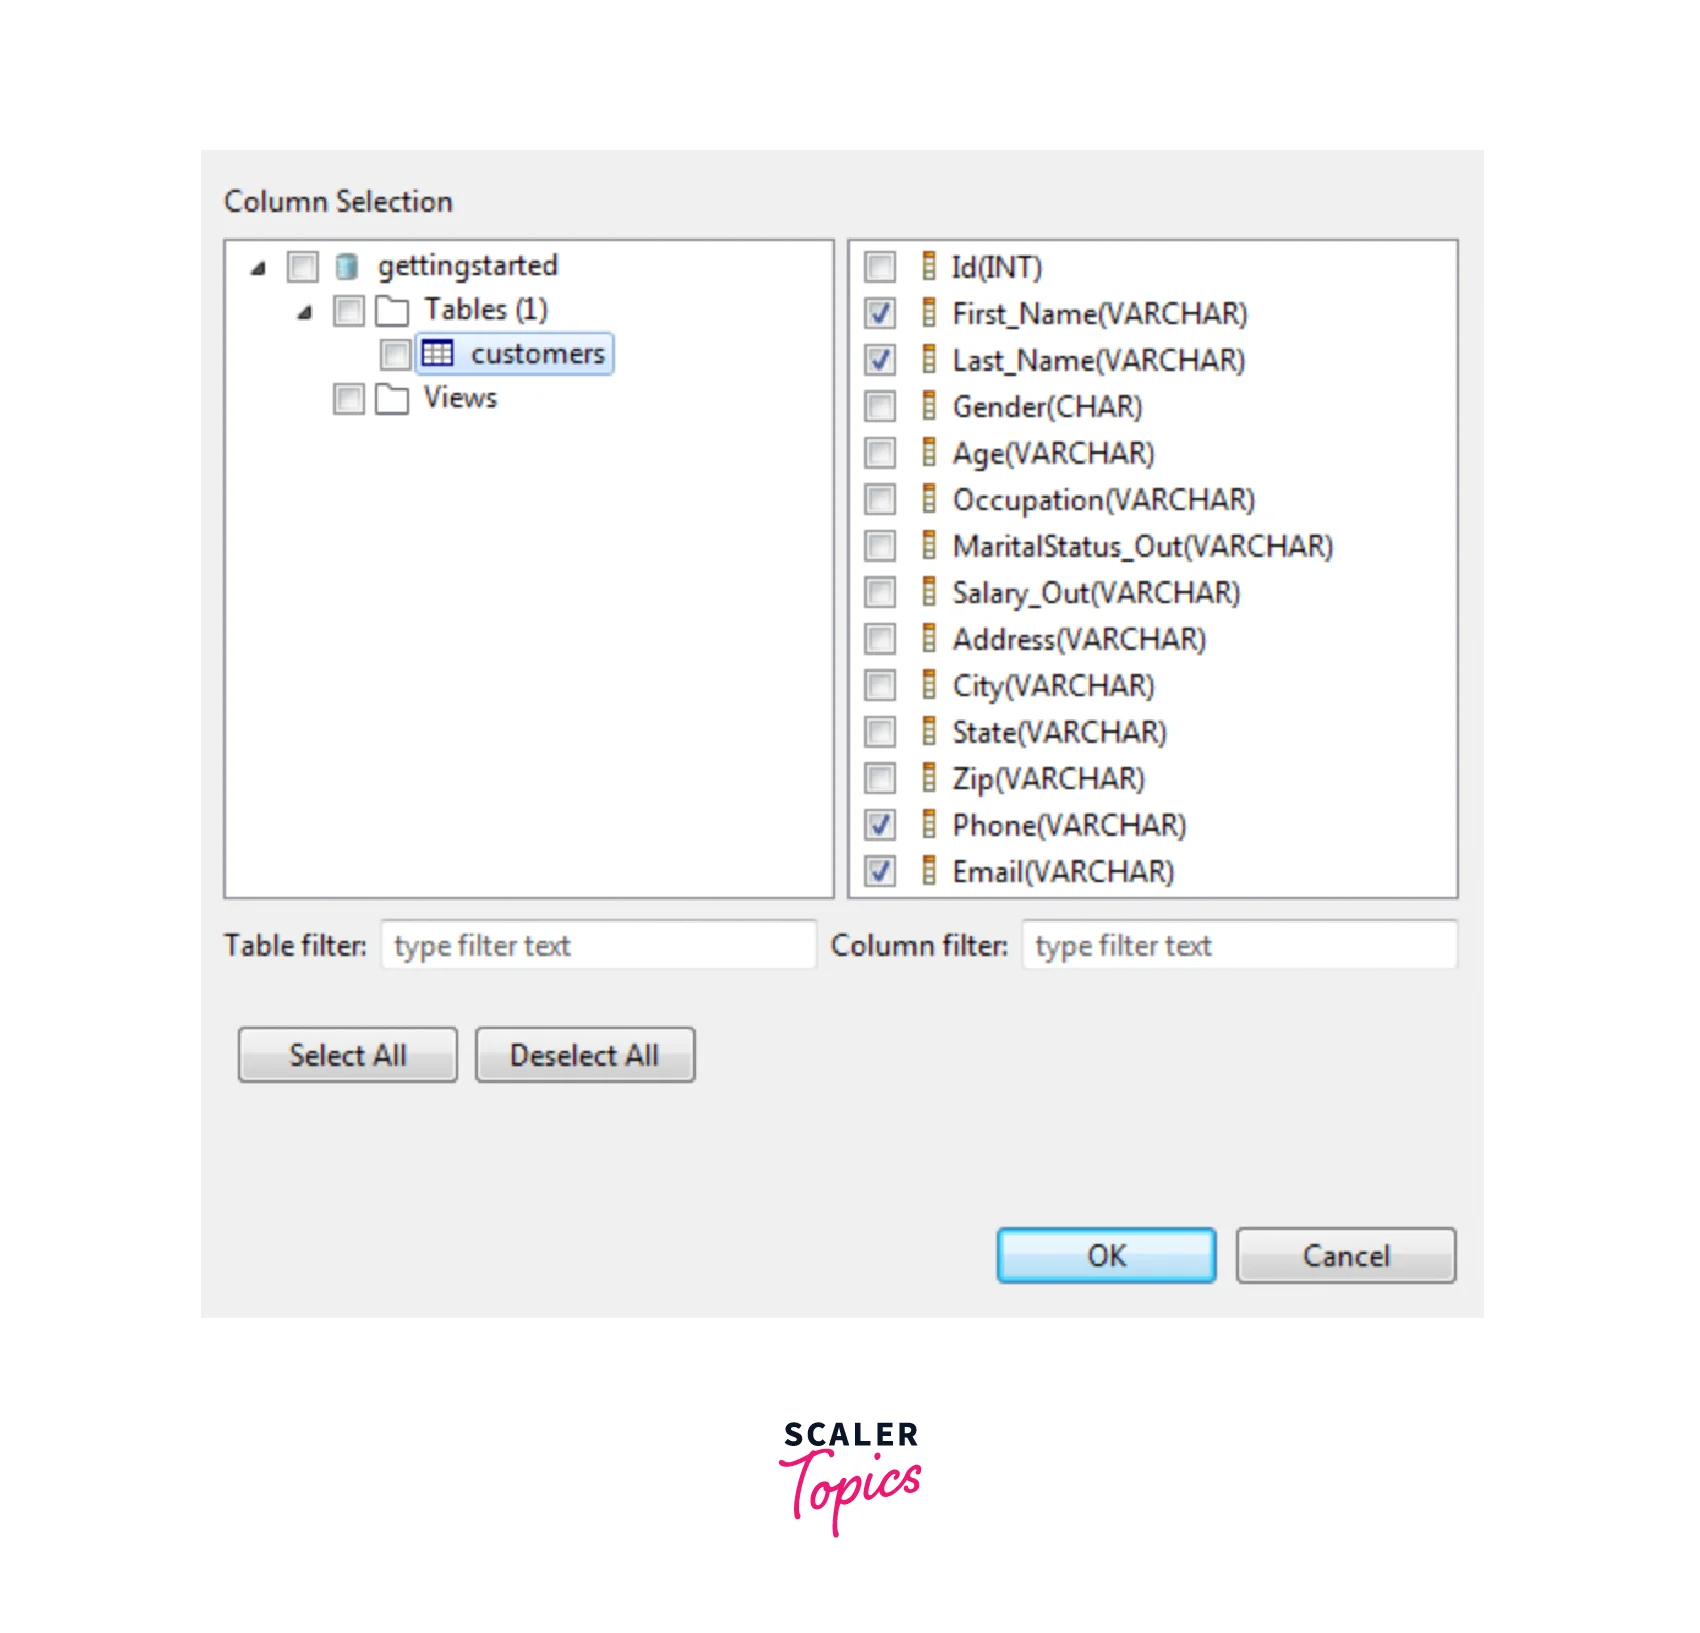
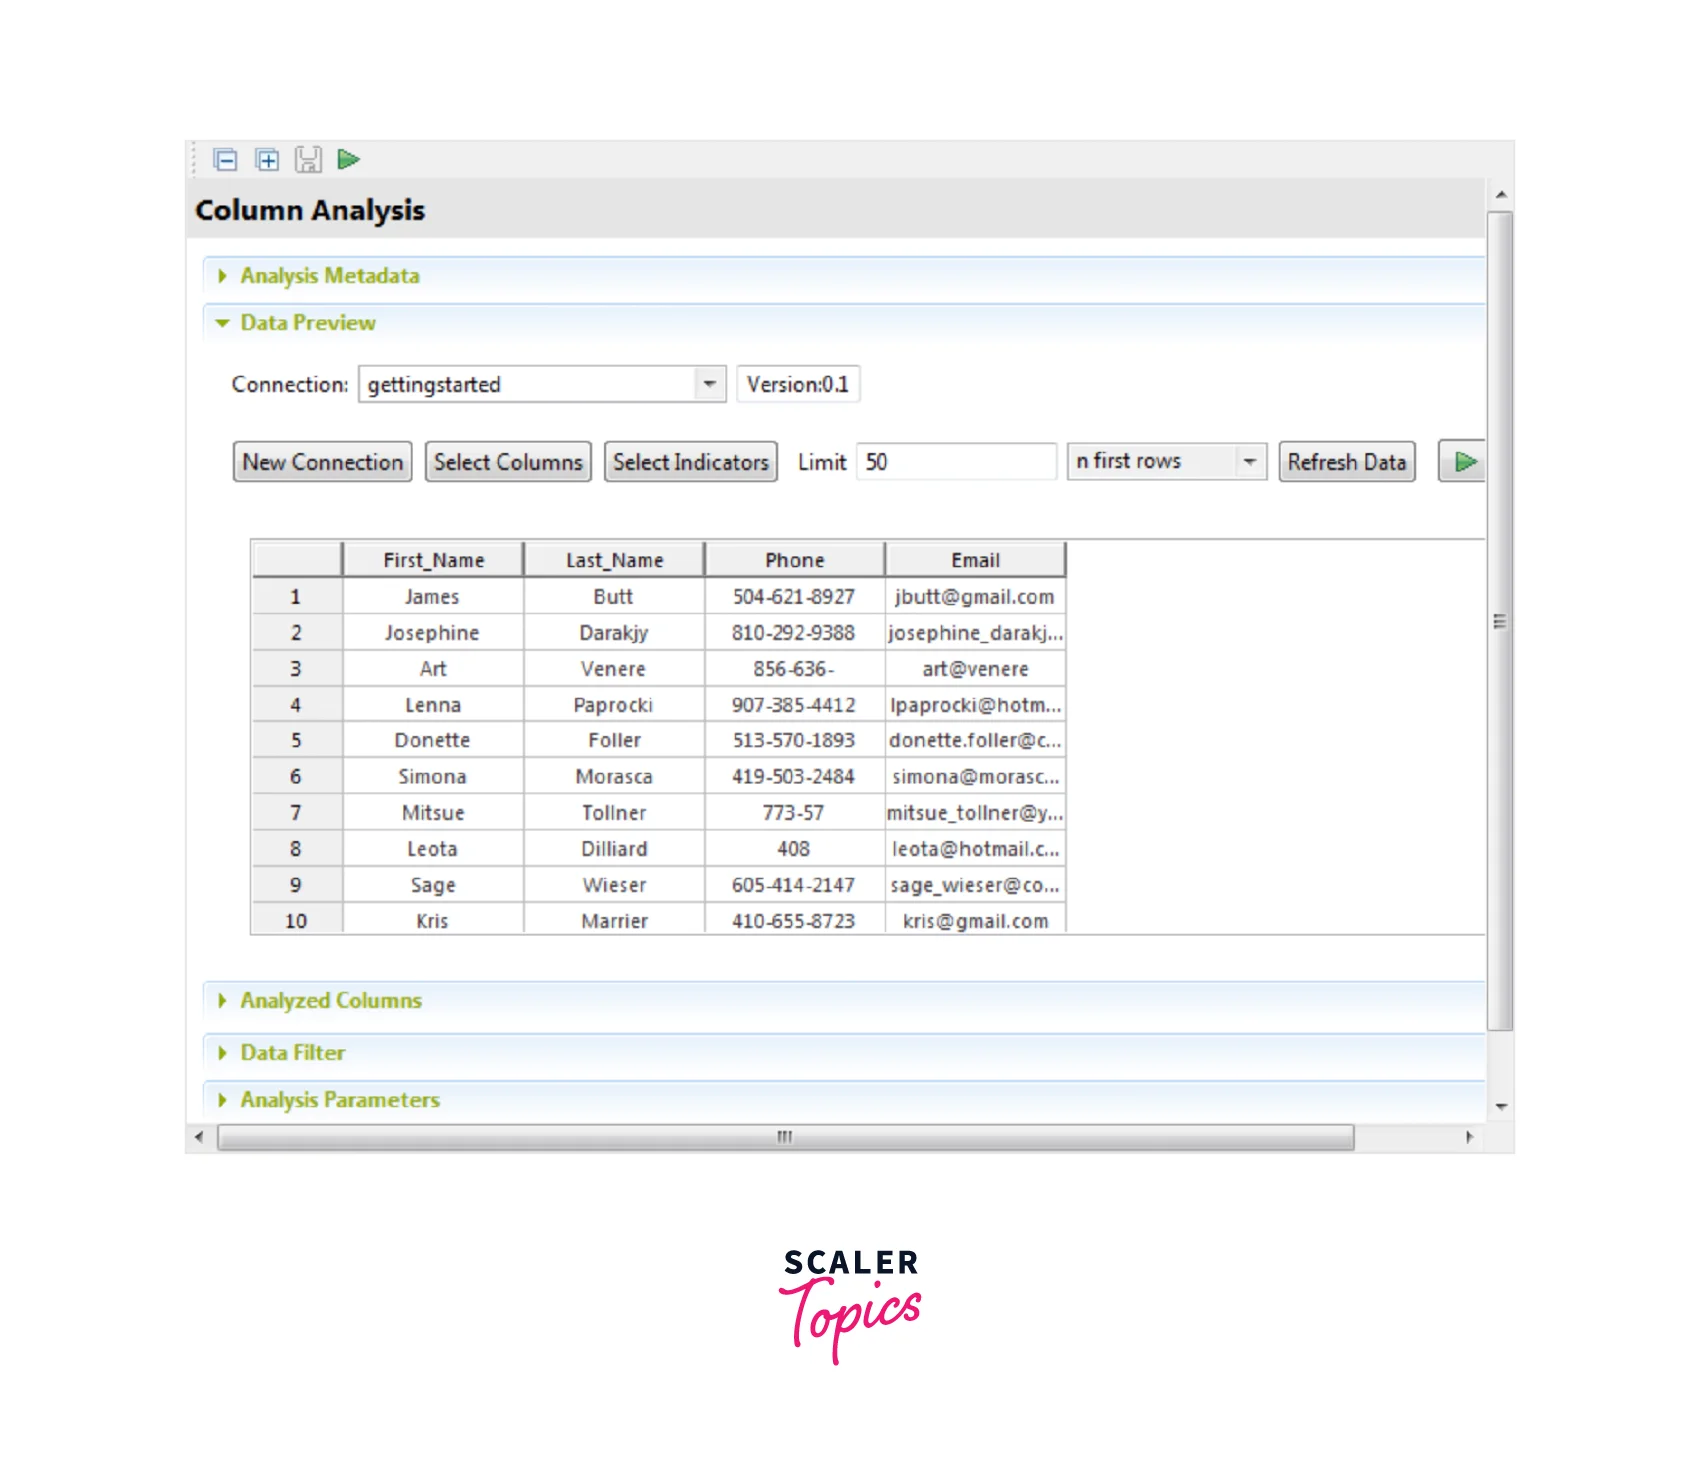
- Select the OK button for closing the wizard. Similarly, you can list other columns and Refresh the data for displaying the actual data as seen below.
5. Setting System Indicators
To offer easier statistics like blanks, row count, and duplicate count, users can implement the column analysis using out-of-box indicators over the phone number as well as the email columns.
Step-by-Step Guide:
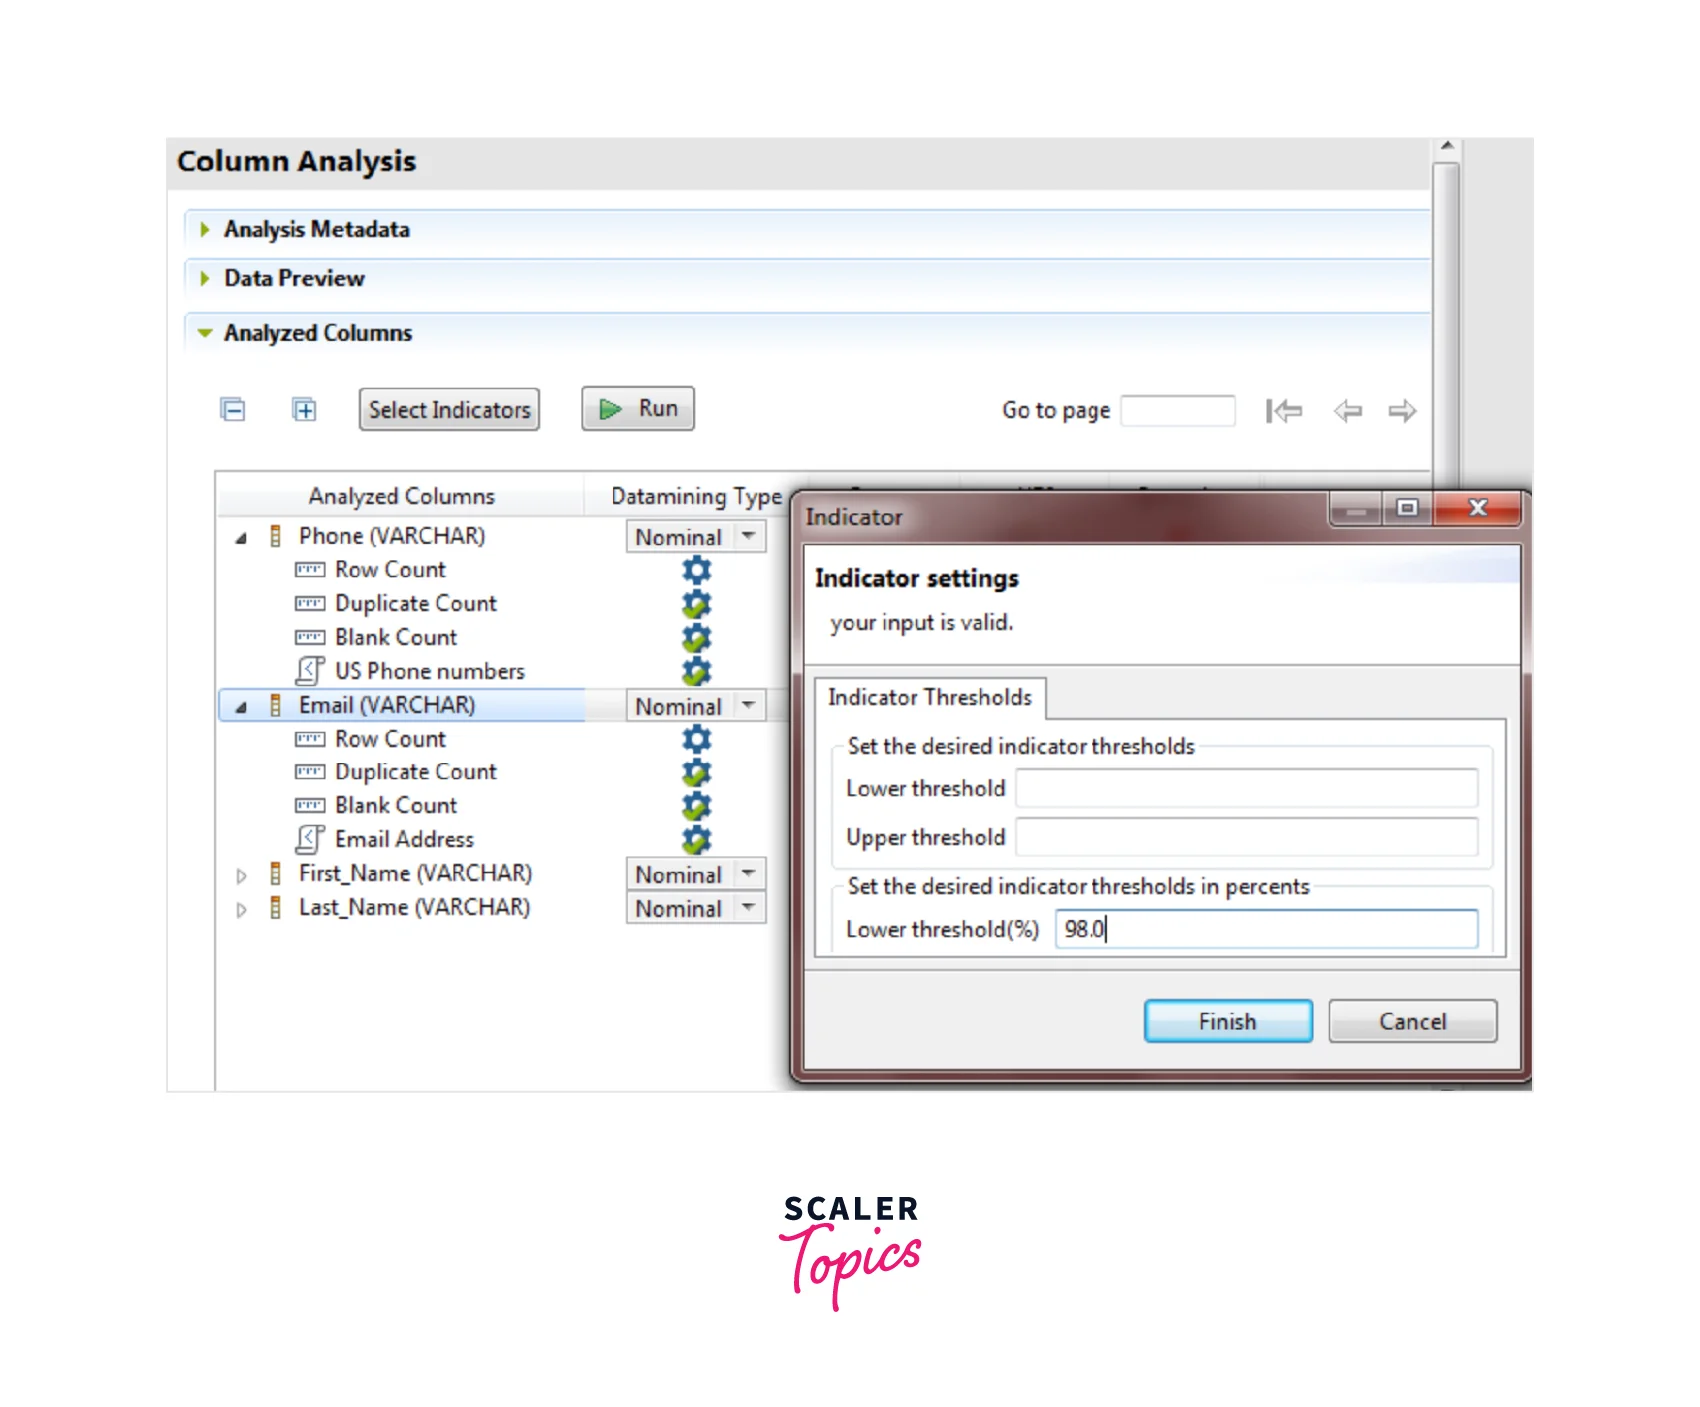
- Select the indicators from the Data Preview section to open the Indicator Selection window in the Analysis editor.
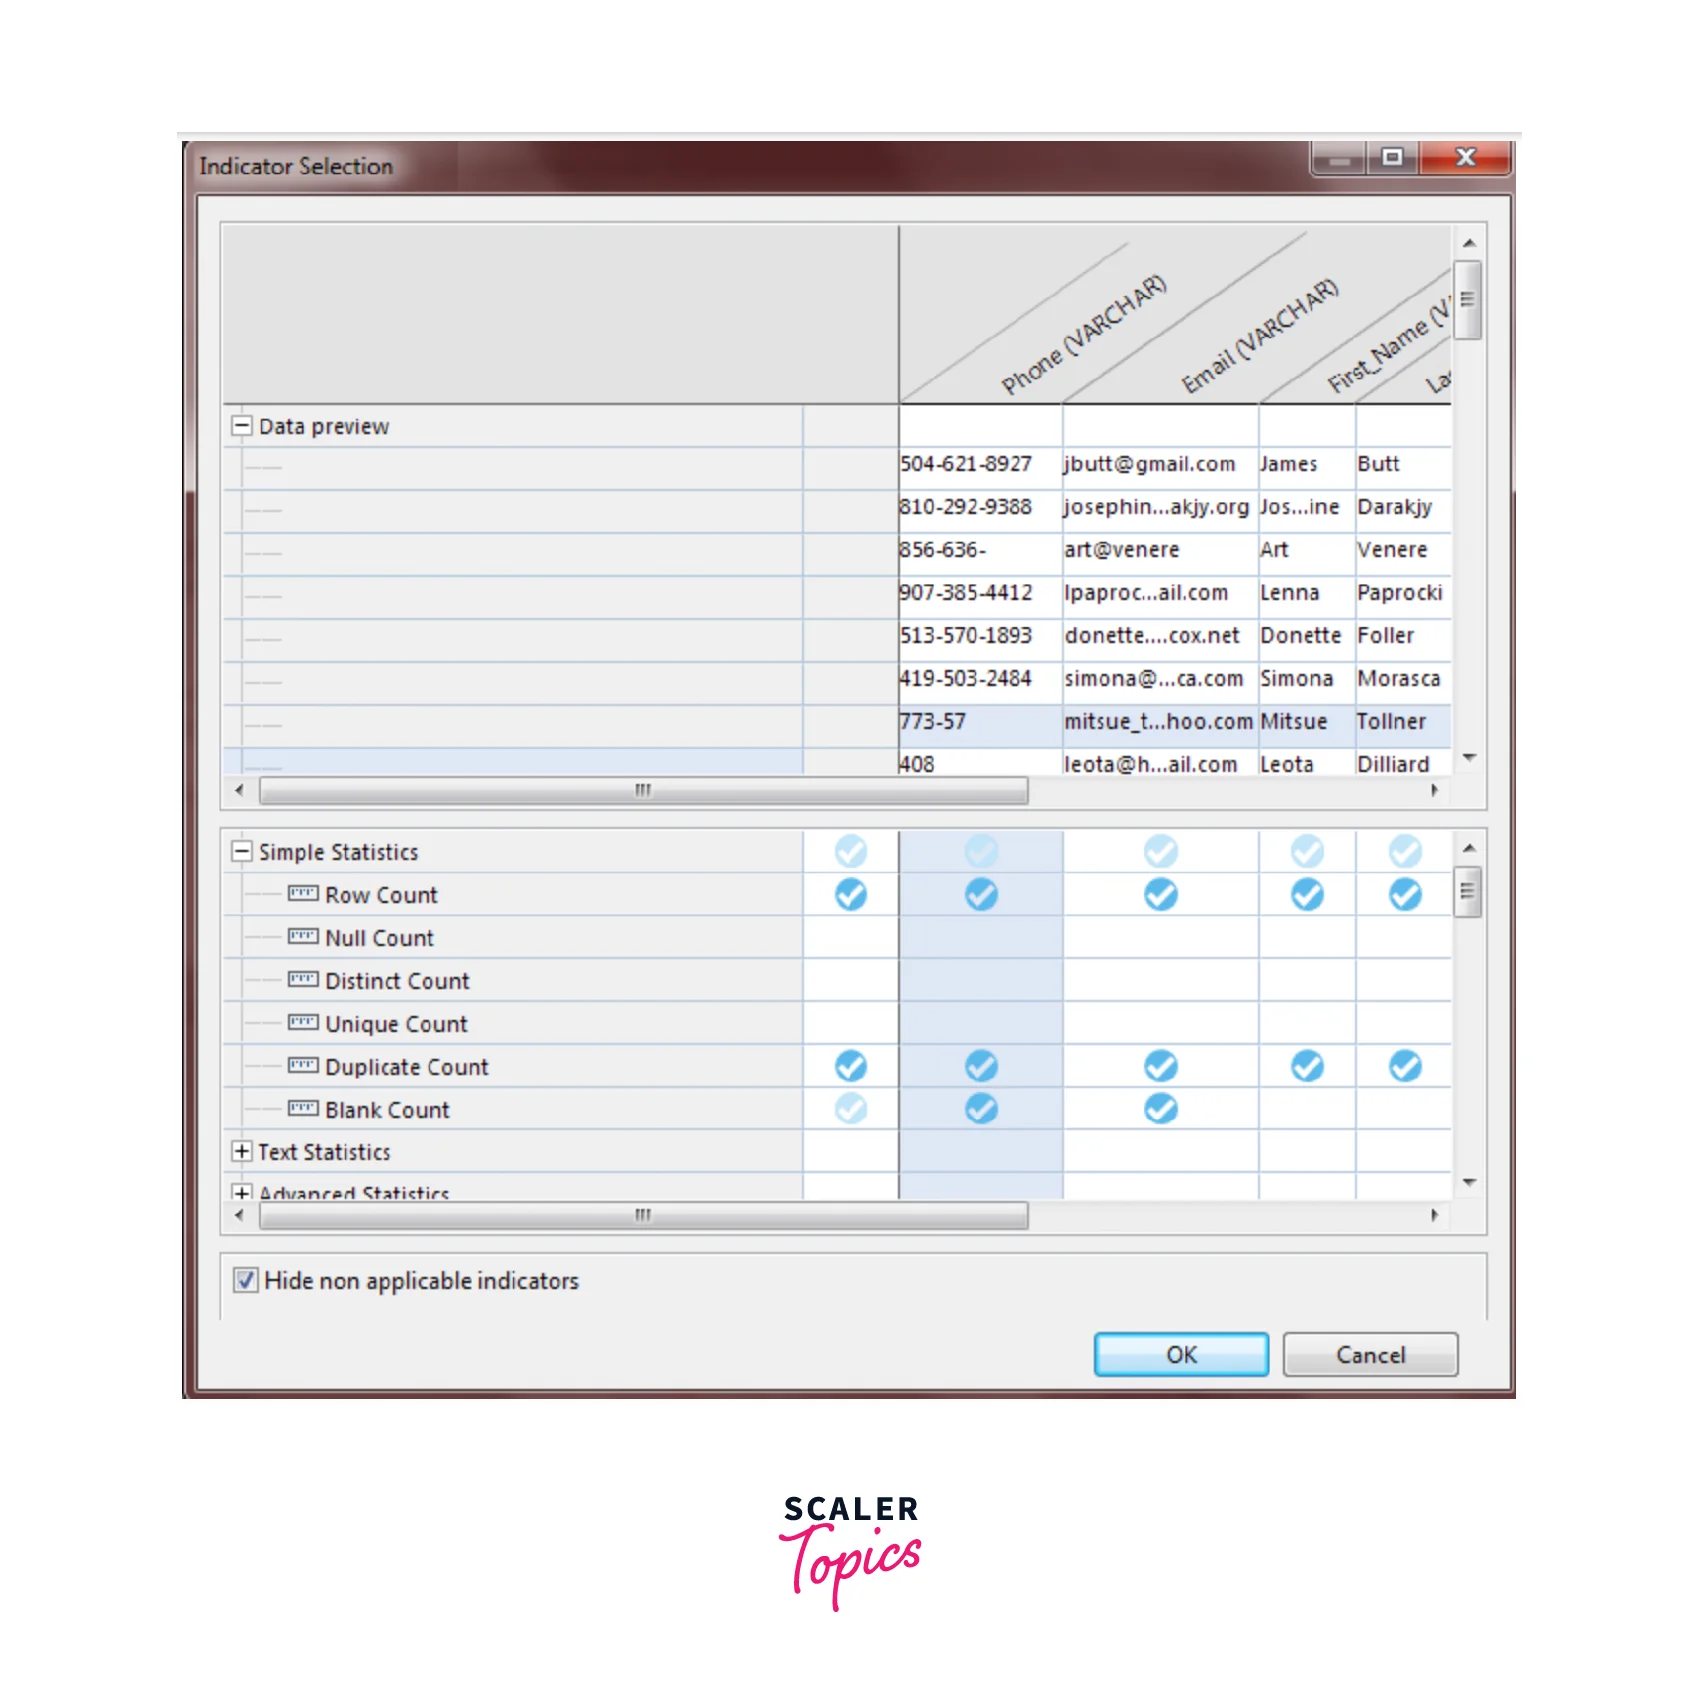
- Users can expand Simple Statistics and select the Blank Count, Row Count, and Duplicate Count to verify the consistency of the data. You want to see the row, blank and duplicate counts in the Email and Phone columns to see how consistent the data is.
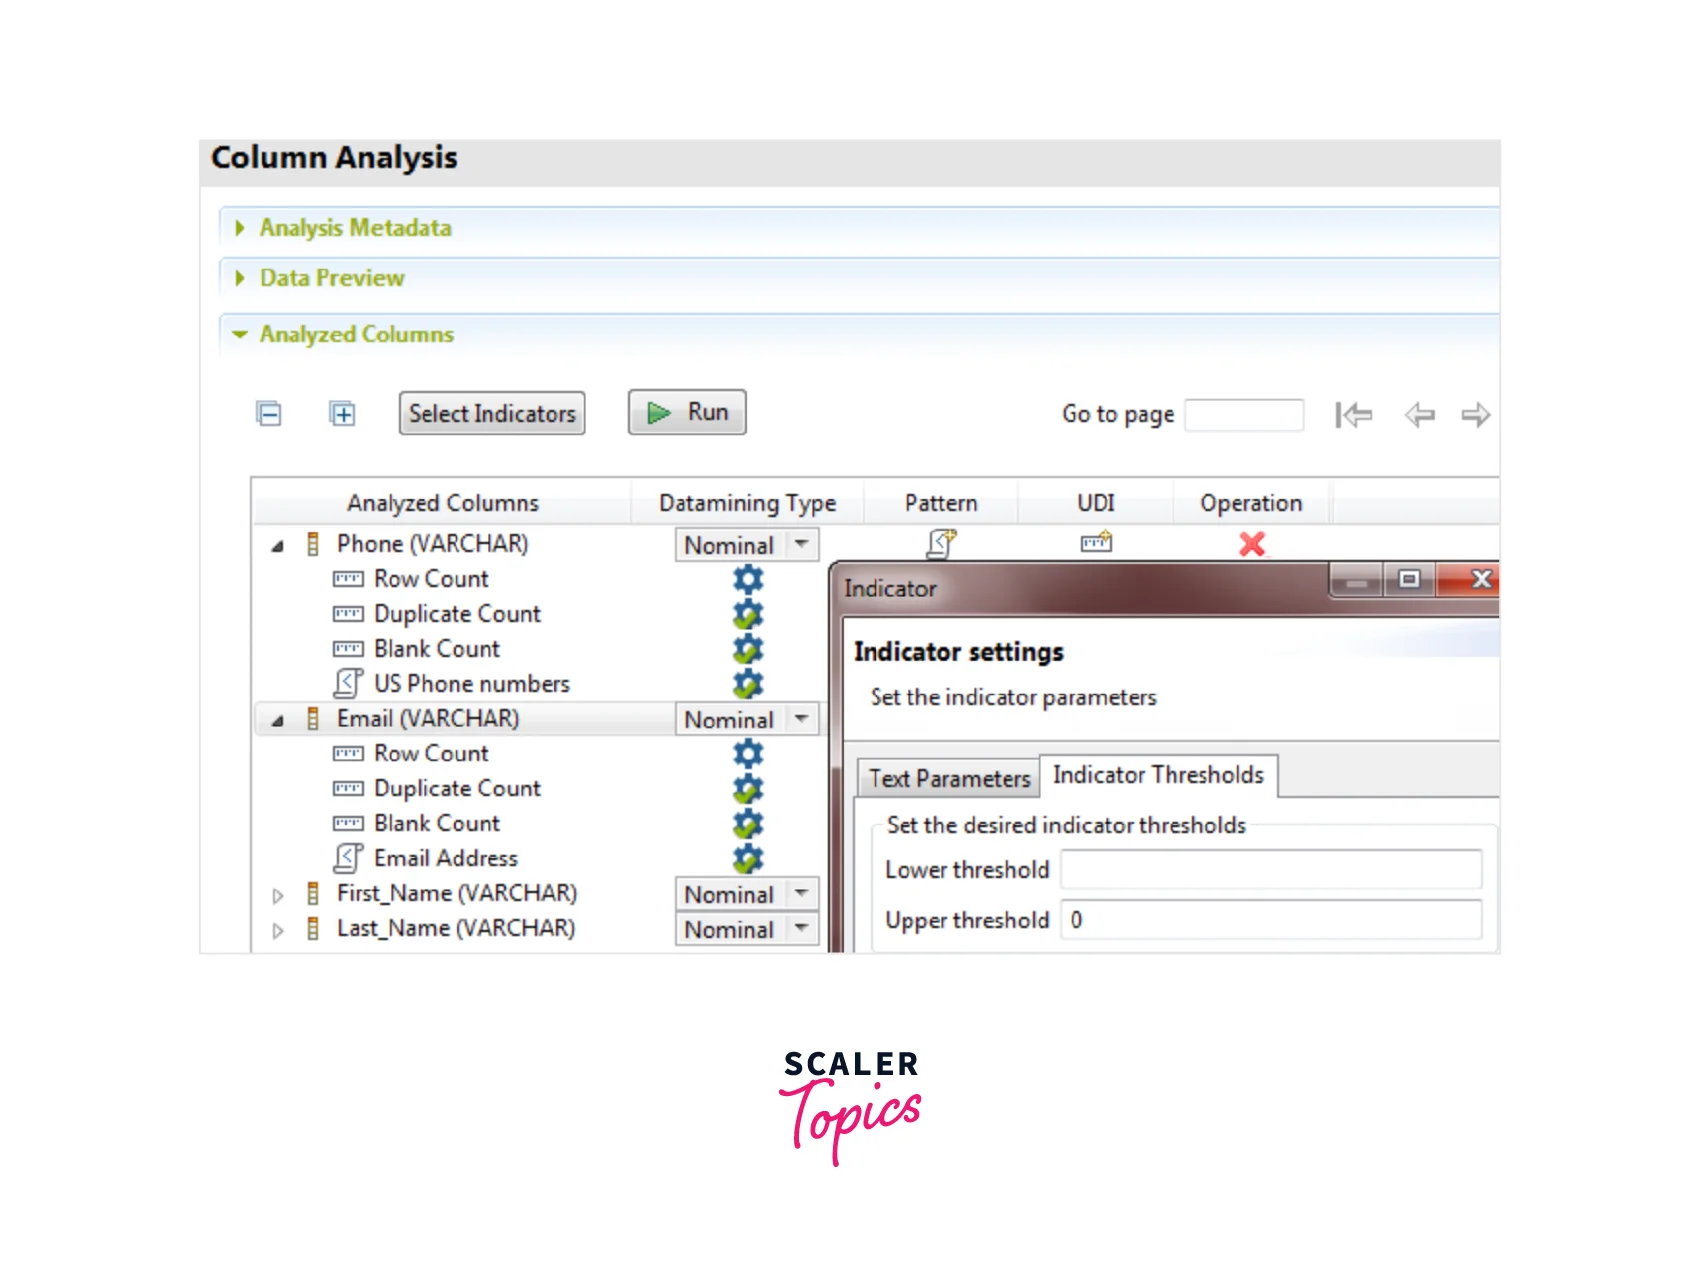
- Users can select the settings icon and set thresholds on the Email and Phone columns. The threshold can be set as 0 in the Upper threshold field. This writes the values in red color for the count of the duplicate and blank values in the analysis results.
6. Setting Patterns
With the help of pre-specified patterns, users can identify any records that are not following the standardized format for the phone number or email by matching the content. This helps to identify the content, structure, and quality of phone numbers and emails. The percentage of data that matched or did not match the standard formats can be identified.
Step-by-Step Guide:
- In the Data Preview section, select the add_pattern icon for opening the Pattern Selector window.
- You can now expand the Regex > internet, where the users can select the check box for the email address and continue with the OK button. This way the pattern gets added in the Analyzed Columns section.
- Similar steps could be followed for the Phone number column and it too gets added in the Analyzed Columns section.
- In the Setting section, the user can set 98.0 in the Lower threshold (%) field. This ensures that the records with match pattern less than 98% eventually gets written in red.
7. Showing Analysis Results
We are now ready for executing and displaying the analysis results as charts and tables, once the column analysis and setting of the indicators and patterns are finalized.
Step-by-Step guide:
- To start analyzing the results, users need to select Java from the Execution engine list in the Analysis Parameters.
- You can either press the F6 button or simply the Run button to execute the analysis.
- You shall see that the editor switched to the Analysis Results view. You can see the details related to the statistic and pattern-matching results in the generated charts.
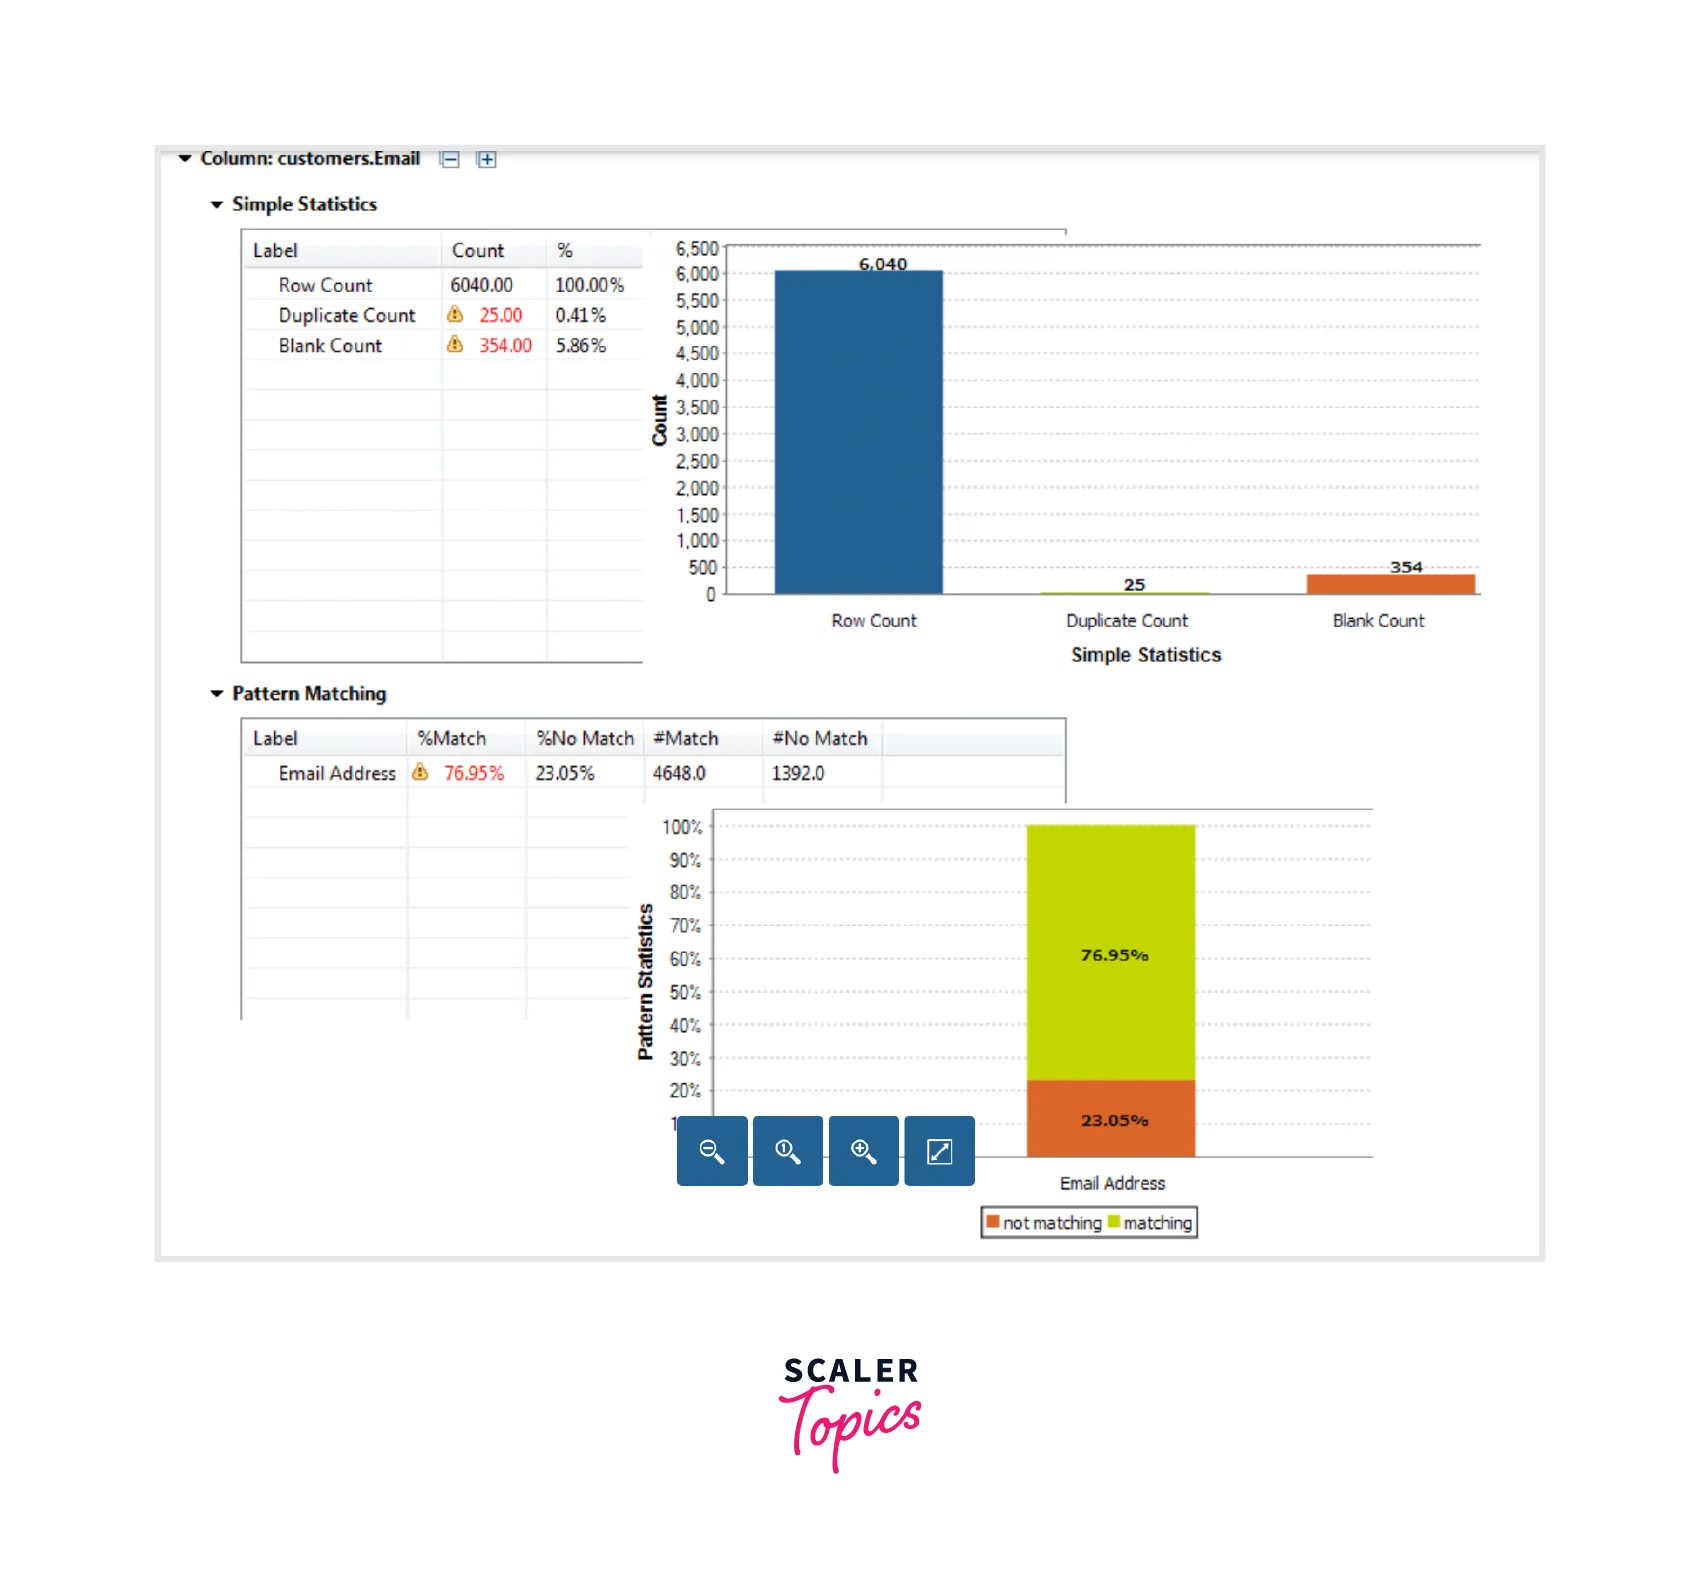
The chart generated for the Email column:
The chart generated for the Phone column:
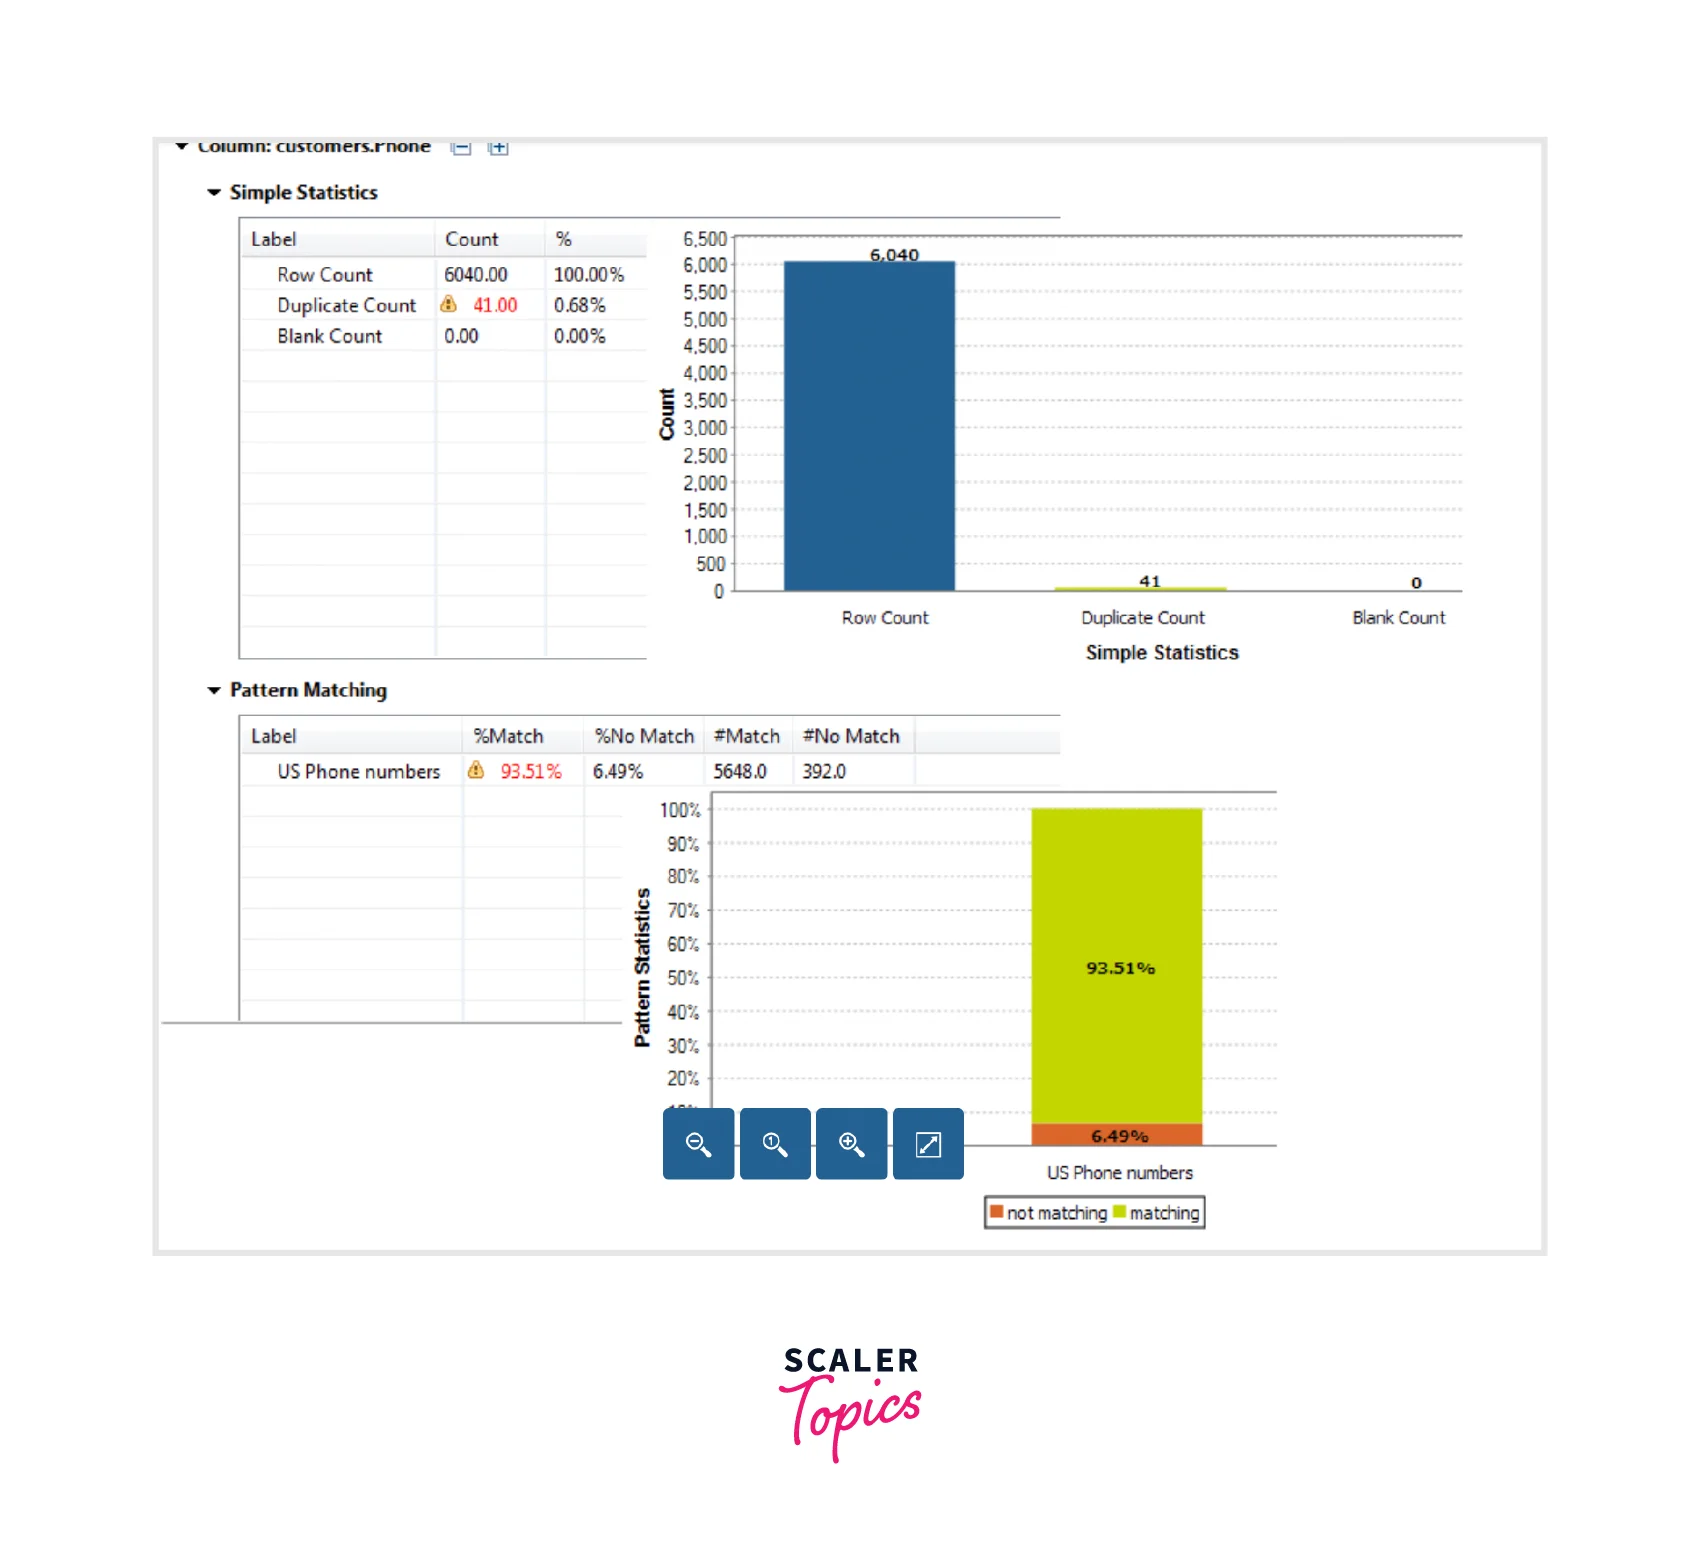
Output:
We see that the count of the records is obtained for the phone number and email columns for both the matched and not-matched records. You will also see the results for blank and duplicate counts telling that the data is not consistent and must be corrected before processing.
Browsing Non-Match Data
As we saw from the column analysis, the data is inconsistent and now we need to scan for all the data records which don't follow the standardized format. This helps to understand what can be done to correct the inconsistent data and start analyzing the need for validating and cleansing the data.
Step-by-step guide:
- Users can view all the blank rows in the Email column, by selecting Blank Count in the statistic results from the Analysis Results view.
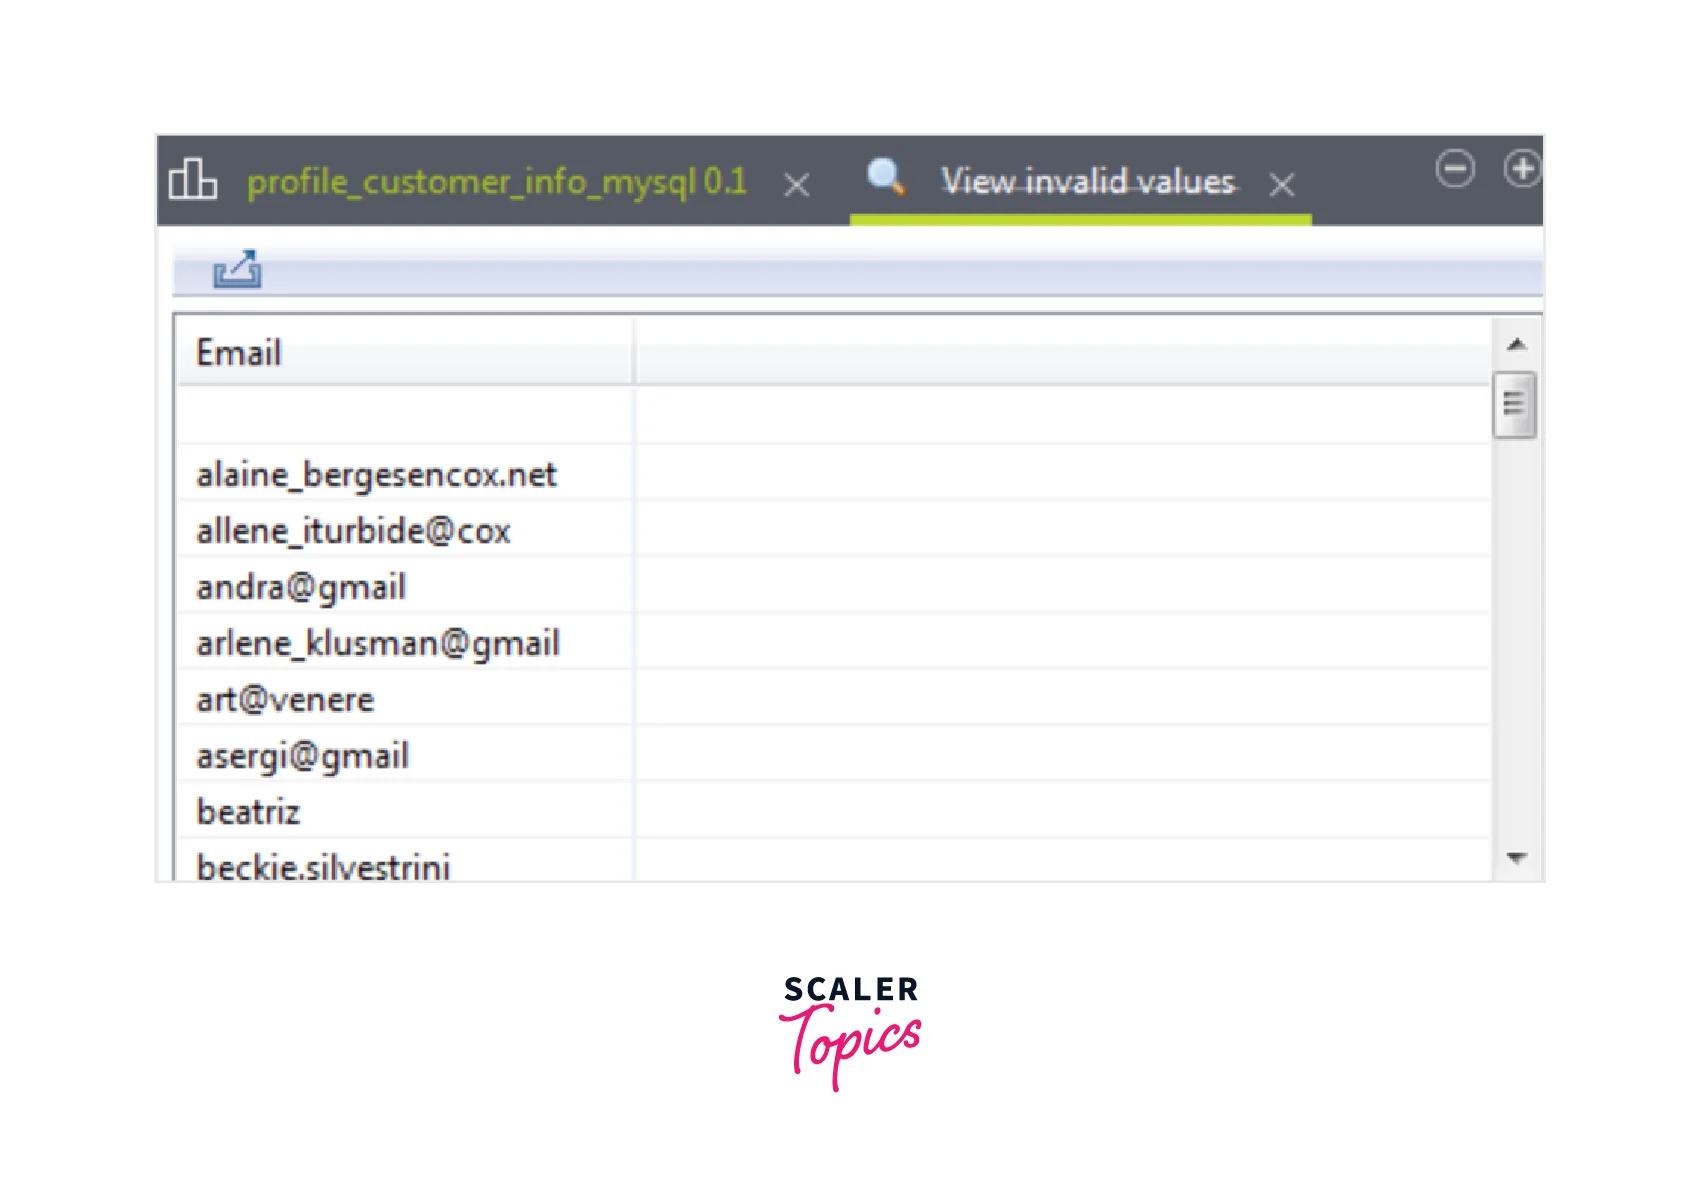
- Users can view the invalid values in the Email column, by selecting Pattern Matching of the Email column in the Analysis Results.
Cleansing Customer Contact Information
Once the customer data is profiled and the issue is identified, users can take some actions to properly clean the data. This can be easily done by generating out-of-the-box Talend Jobs. With these jobs, duplicate values from the columns could be removed along with the values that do not satisfy the pattern. This tells the users what needs to be resolved and identification of the issues that are present in the address data.
Removing Duplicate Values
Once the duplicated values are identified from the profiling results in the Email and Phone columns, out-of-box jobs can be created to separate distinct values from duplicate records. These jobs show all the duplicates in a rejected delimited file. Also, it then writes the unique values in the database for further analysis.
Step-by-step guide:
- From the Profiling perspective, open the column analysis and validate the Analysis Results in the editor.
- Users can identify duplicates from the Duplicate Count option present in the Simple Statistics.
- You shall see that the Integration perspective shows the created Job under the Repository tree view.
- According to the user's requirement, the tMysqlInput, tUniqueRow, and tMysqlOutputBulkExec components are automatically configured for analysis. Here, tMysqlOutputBulkExec is used to write unique records to a new table while with tFileOutputDelimited, the duplicate records are written in an output delimited file.
- You can click F6 for running the Job.
Output:
All the duplicated records are written back to the output file while the distinct unique records are written to a new table.
Removing Non-Matching Values
We saw that some of the data records didn't follow the standard email and phone formats from the pattern-matching results. You can generate out-of-box jobs to recover all the non-matching rows from their columns.
Step-by-step guide:
- From the Profiling perspective, open the column analysis and select the Analysis Results.
- Then in the Pattern Matching tables, you can easily Generate a Job from the option present.
- Once you press the Finish icon, the job is created.
- Now, the Integration perspective shows the generated Job in the Repository view.
- Users can make use of this job for performing the ETL process. This would be helpful for writing the matched and unmatched data into two separate output files.
- tMysqlInput is automatically configured as per your connection while tPatternCheck is configured as per the column analysis.
- You can change either the default name or path of the output files as per the requirement, and select the F6 button to run the Job.
- With the tFileOutputDelimited component, the Data Viewer option opens a view of the data where the matched and unmatched data is seen.
Output:
Similarly, an automatic job can be created to standardize the formats related to phone numbers or emails. Users can design a Job that adheres to the international format via the tStandardizePhoneNumber component.
Conclusion
- With Talend's big data platform, users can perform data integration, manage the data, ensure data quality, prepare the data, and deal with big data.
- Talend big data platform offers various big data components available in the Talend Open Studio.
- Some components offered by the Talend big data platform are tHDFSDelete, tHDFSList , tHiveInput, tSqoopImport, and tHDFSGet.