TensorBoard: Tools for Model Training
Overview
TensorBoard is a web-based visualization tool provided by TensorFlow, an open-source machine learning framework developed by Google. TensorBoard is designed to help users monitor and understand their machine learning models during the training process. It offers a range of features and visualizations that aid in analyzing and debugging models, tracking metrics, and comparing experiments.
What is TensorBoard?
TensorBoard serves as a dashboard for monitoring and visualizing various aspects of the training process. It allows you to observe the behavior of your model over time, assess its performance, and gain insights into how different hyperparameters affect its training.
- Visual Insight: TensorBoard enables users to visually monitor the training process of their models, helping them comprehend complex behaviors and patterns.
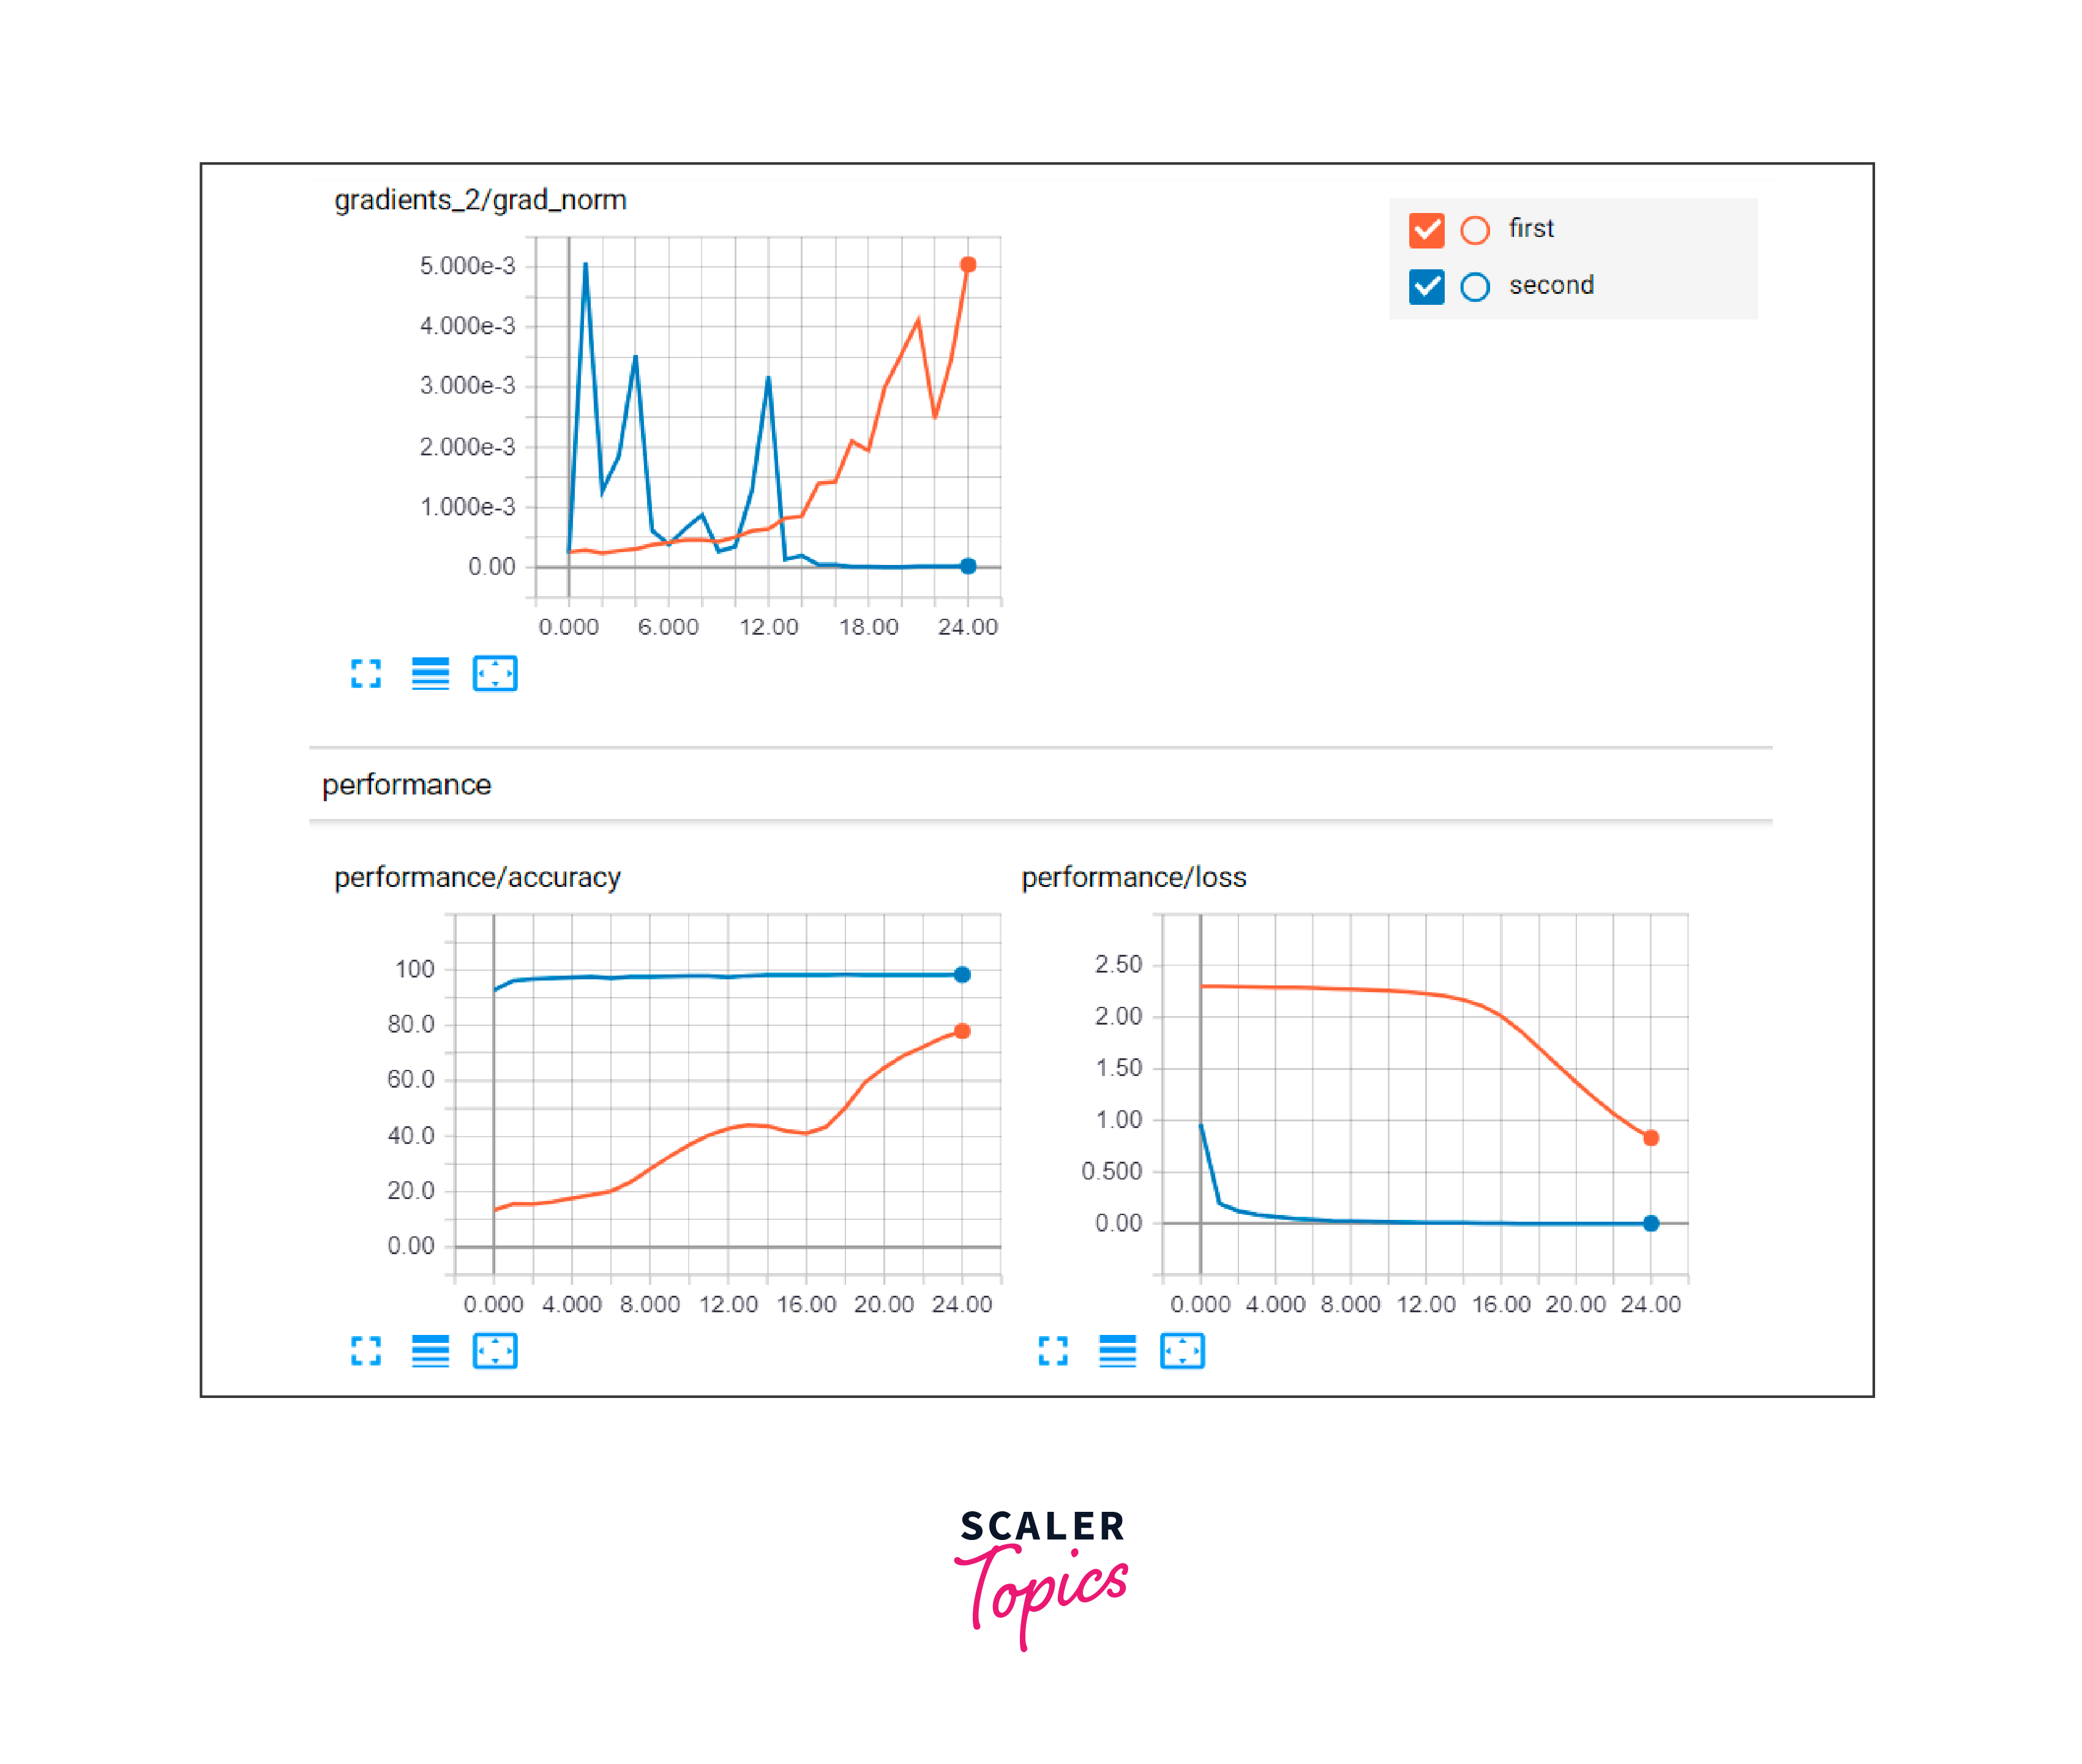
- Performance Analysis: It aids in analyzing model performance by offering various dashboards, such as Scalars, Graphs, Distributions, and Histograms, for tracking metrics and visualizing weights and activations.
- Debugging Aid: TensorBoard helps in identifying and addressing issues like overfitting or vanishing gradients by allowing users to visualize changes in metrics and model behavior over training epochs.
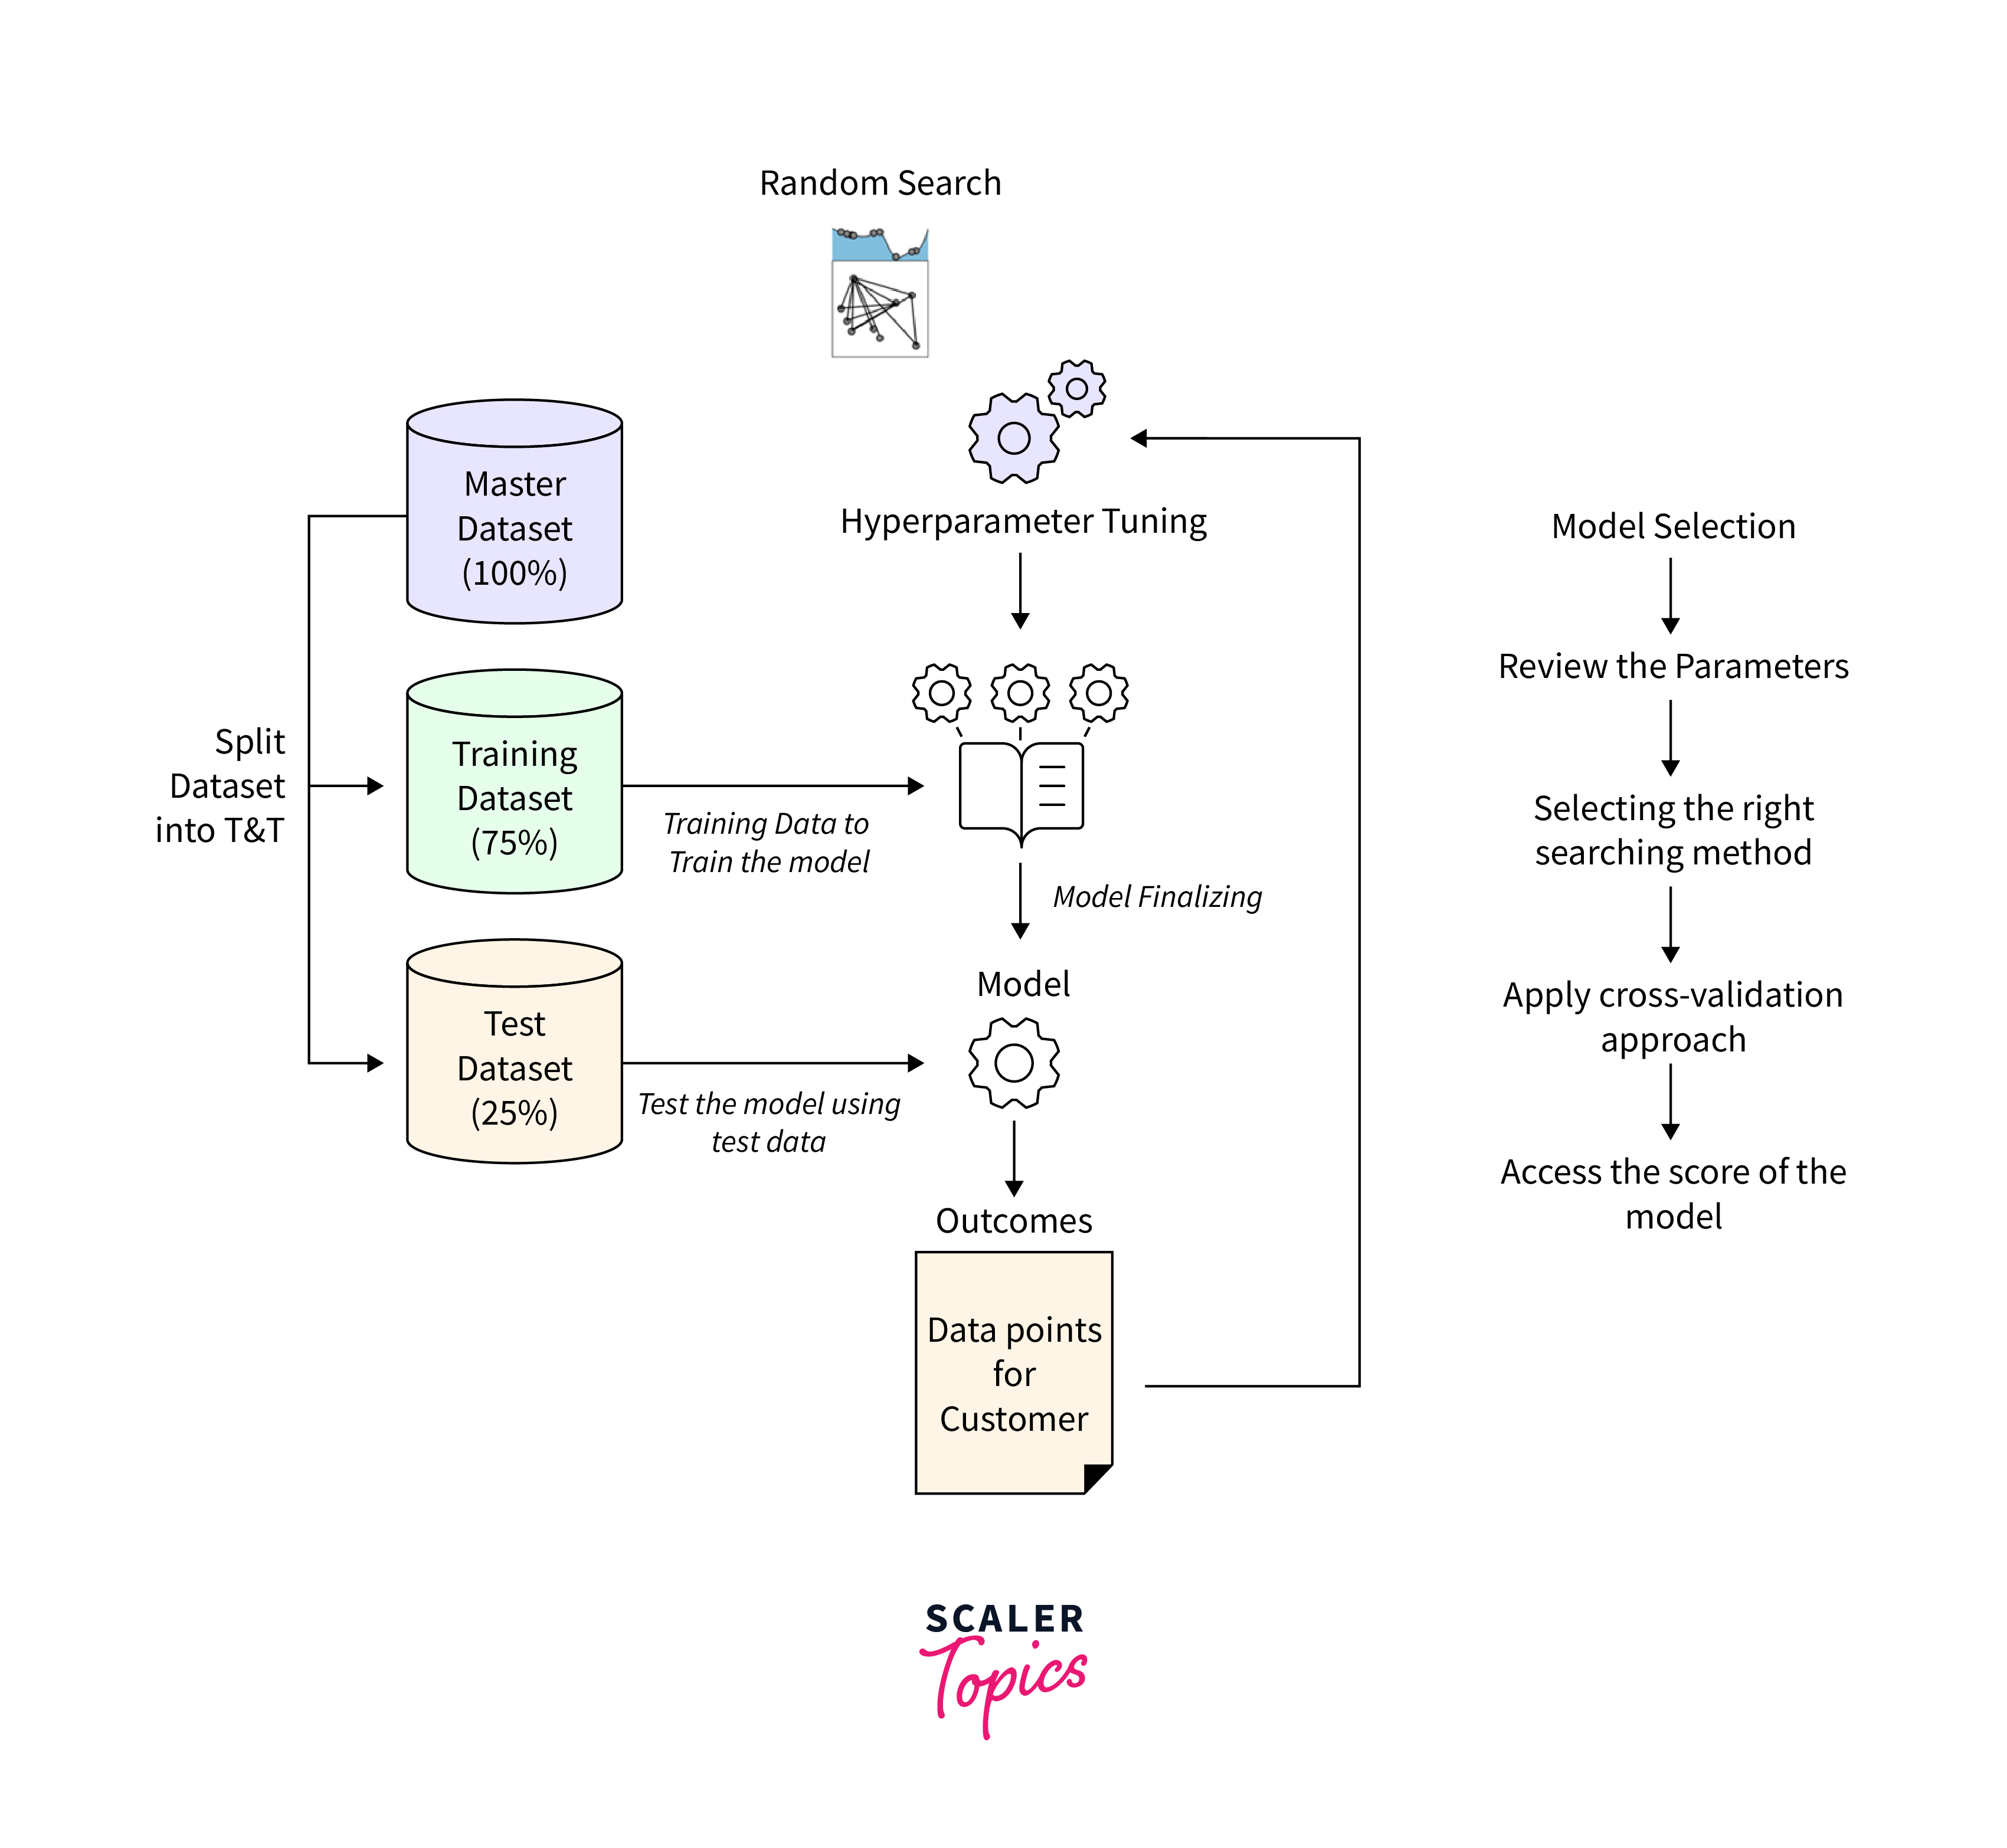
- Hyperparameter Optimization: Users can use TensorBoard to compare different training runs with varying hyperparameters, facilitating the optimization of model configurations.
- Customizable Integration: TensorBoard can be integrated into various workflows, including Keras models, custom training loops, and non-Keras models, making it a versatile tool for diverse machine learning projects.
Types of DashBoard in TensorBoard
TensorBoard provides several types of dashboards, each focusing on a different aspect of model training:
-
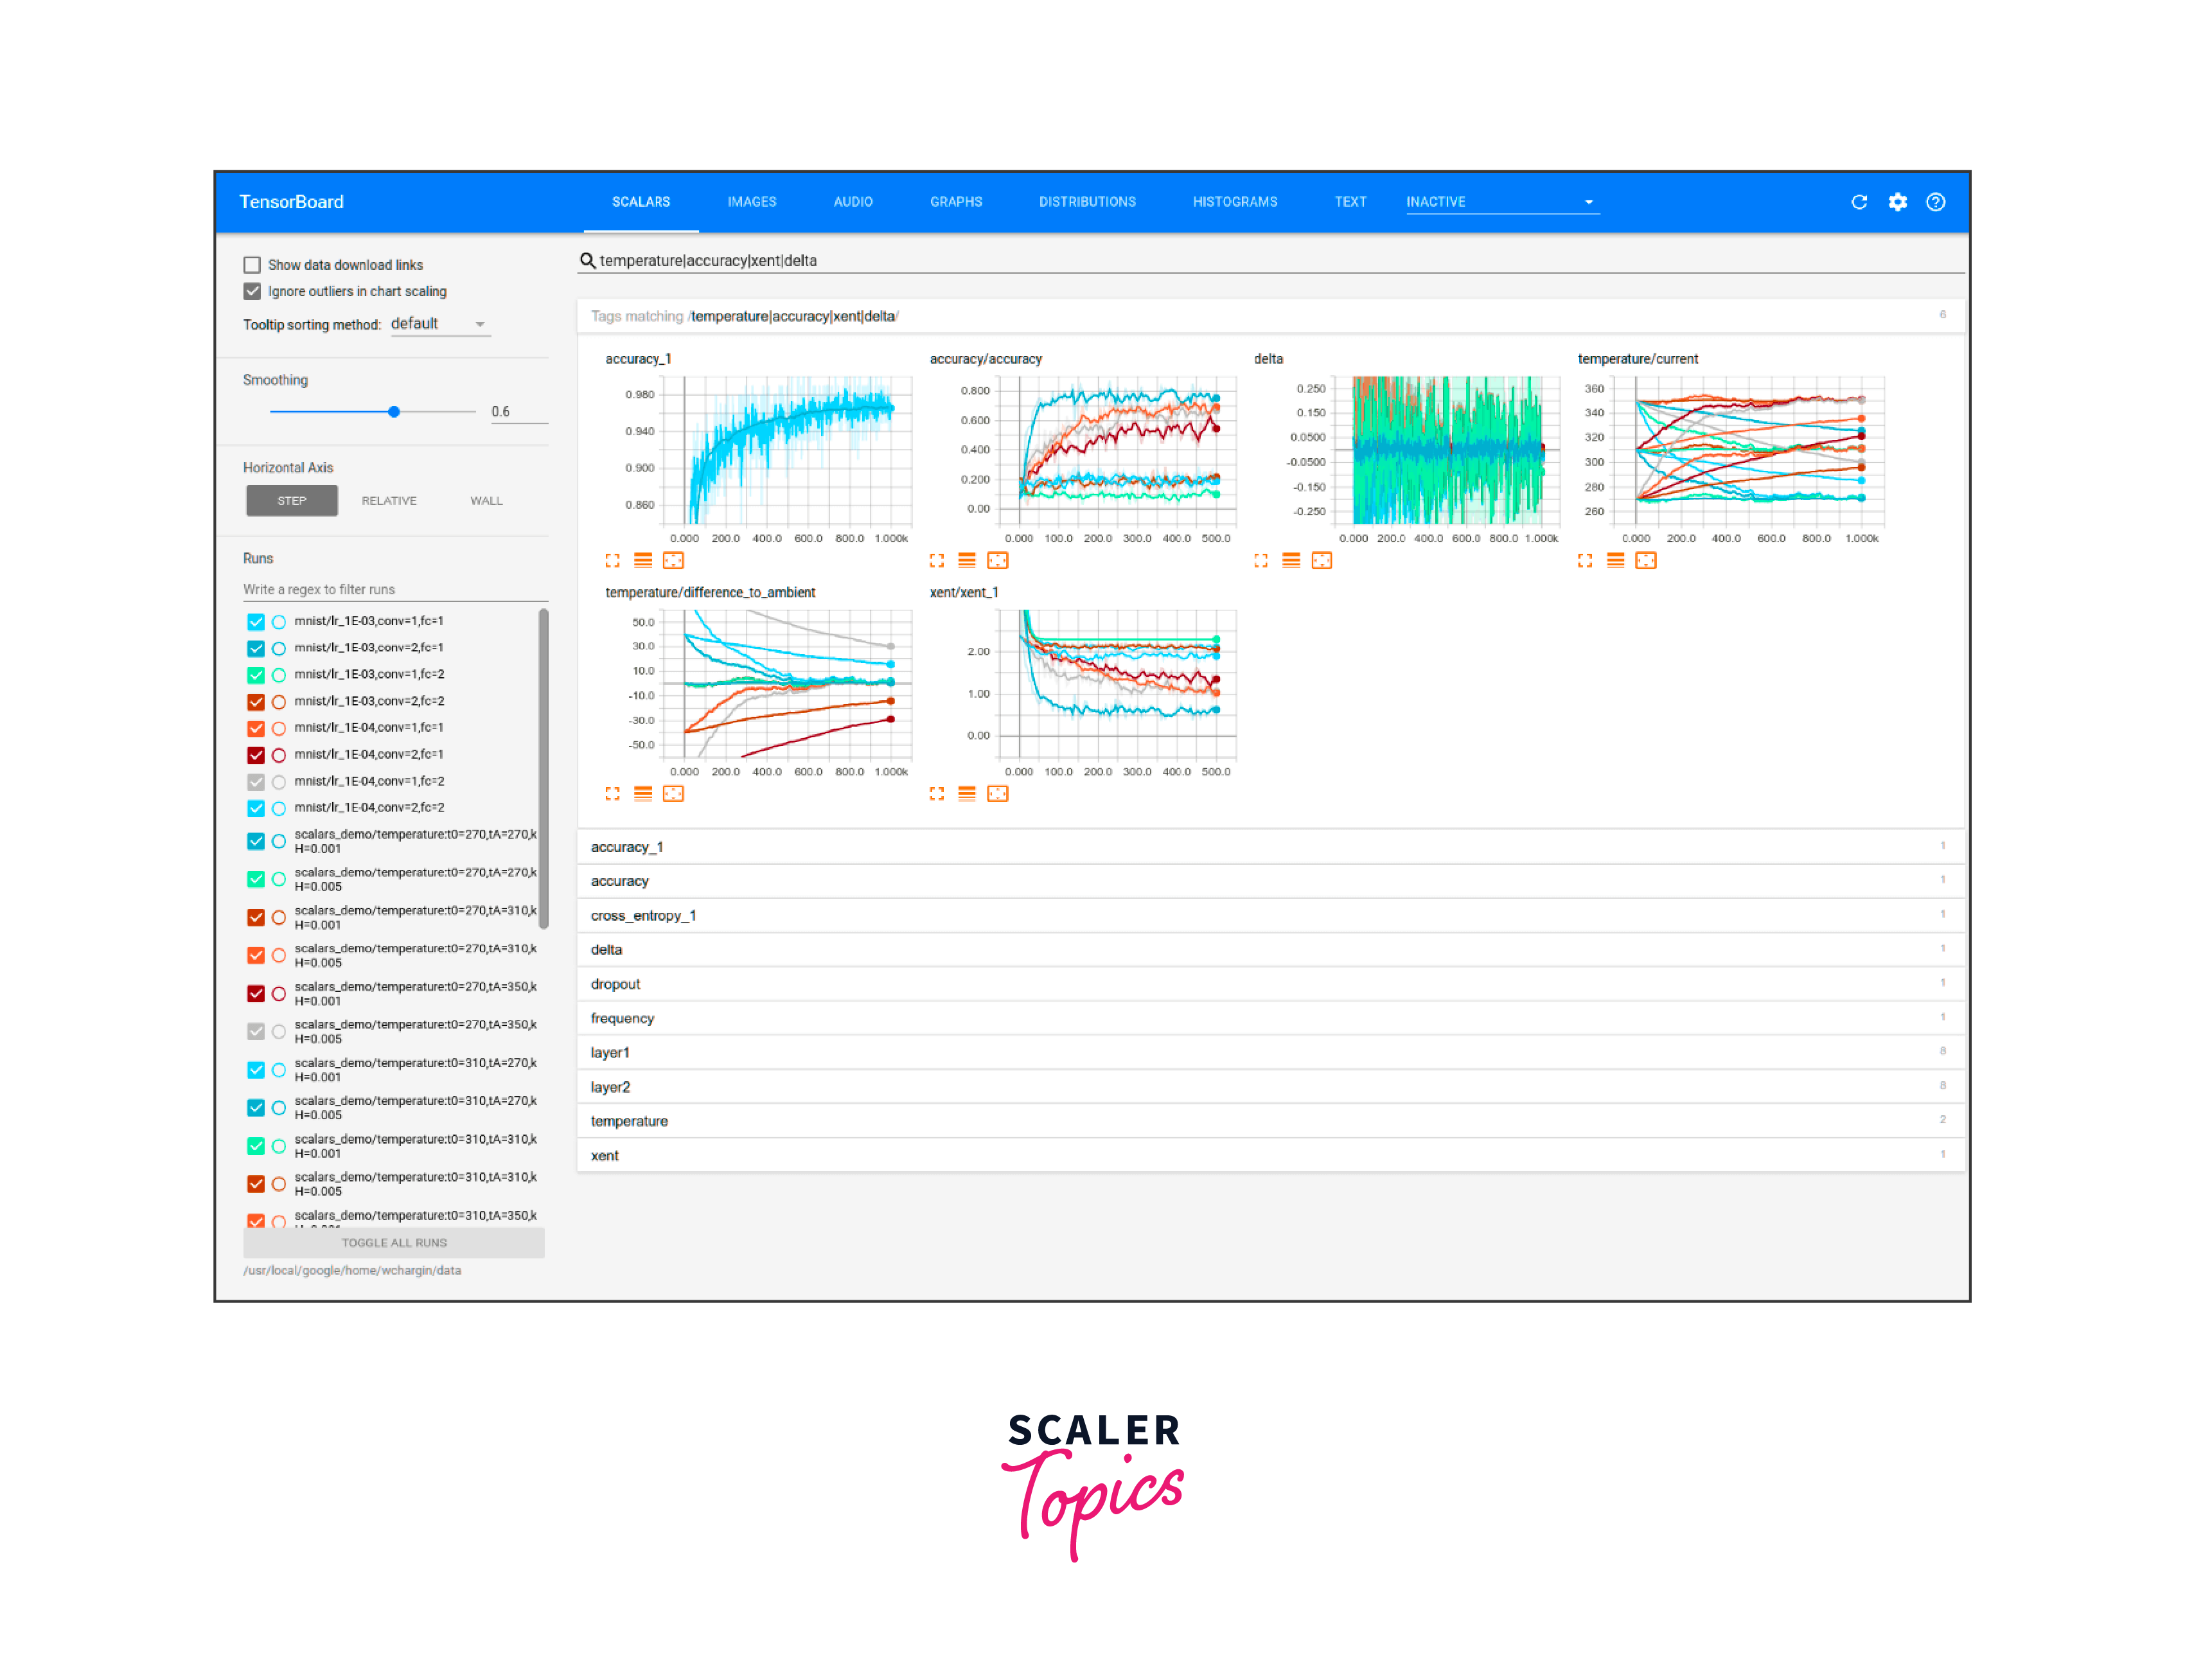
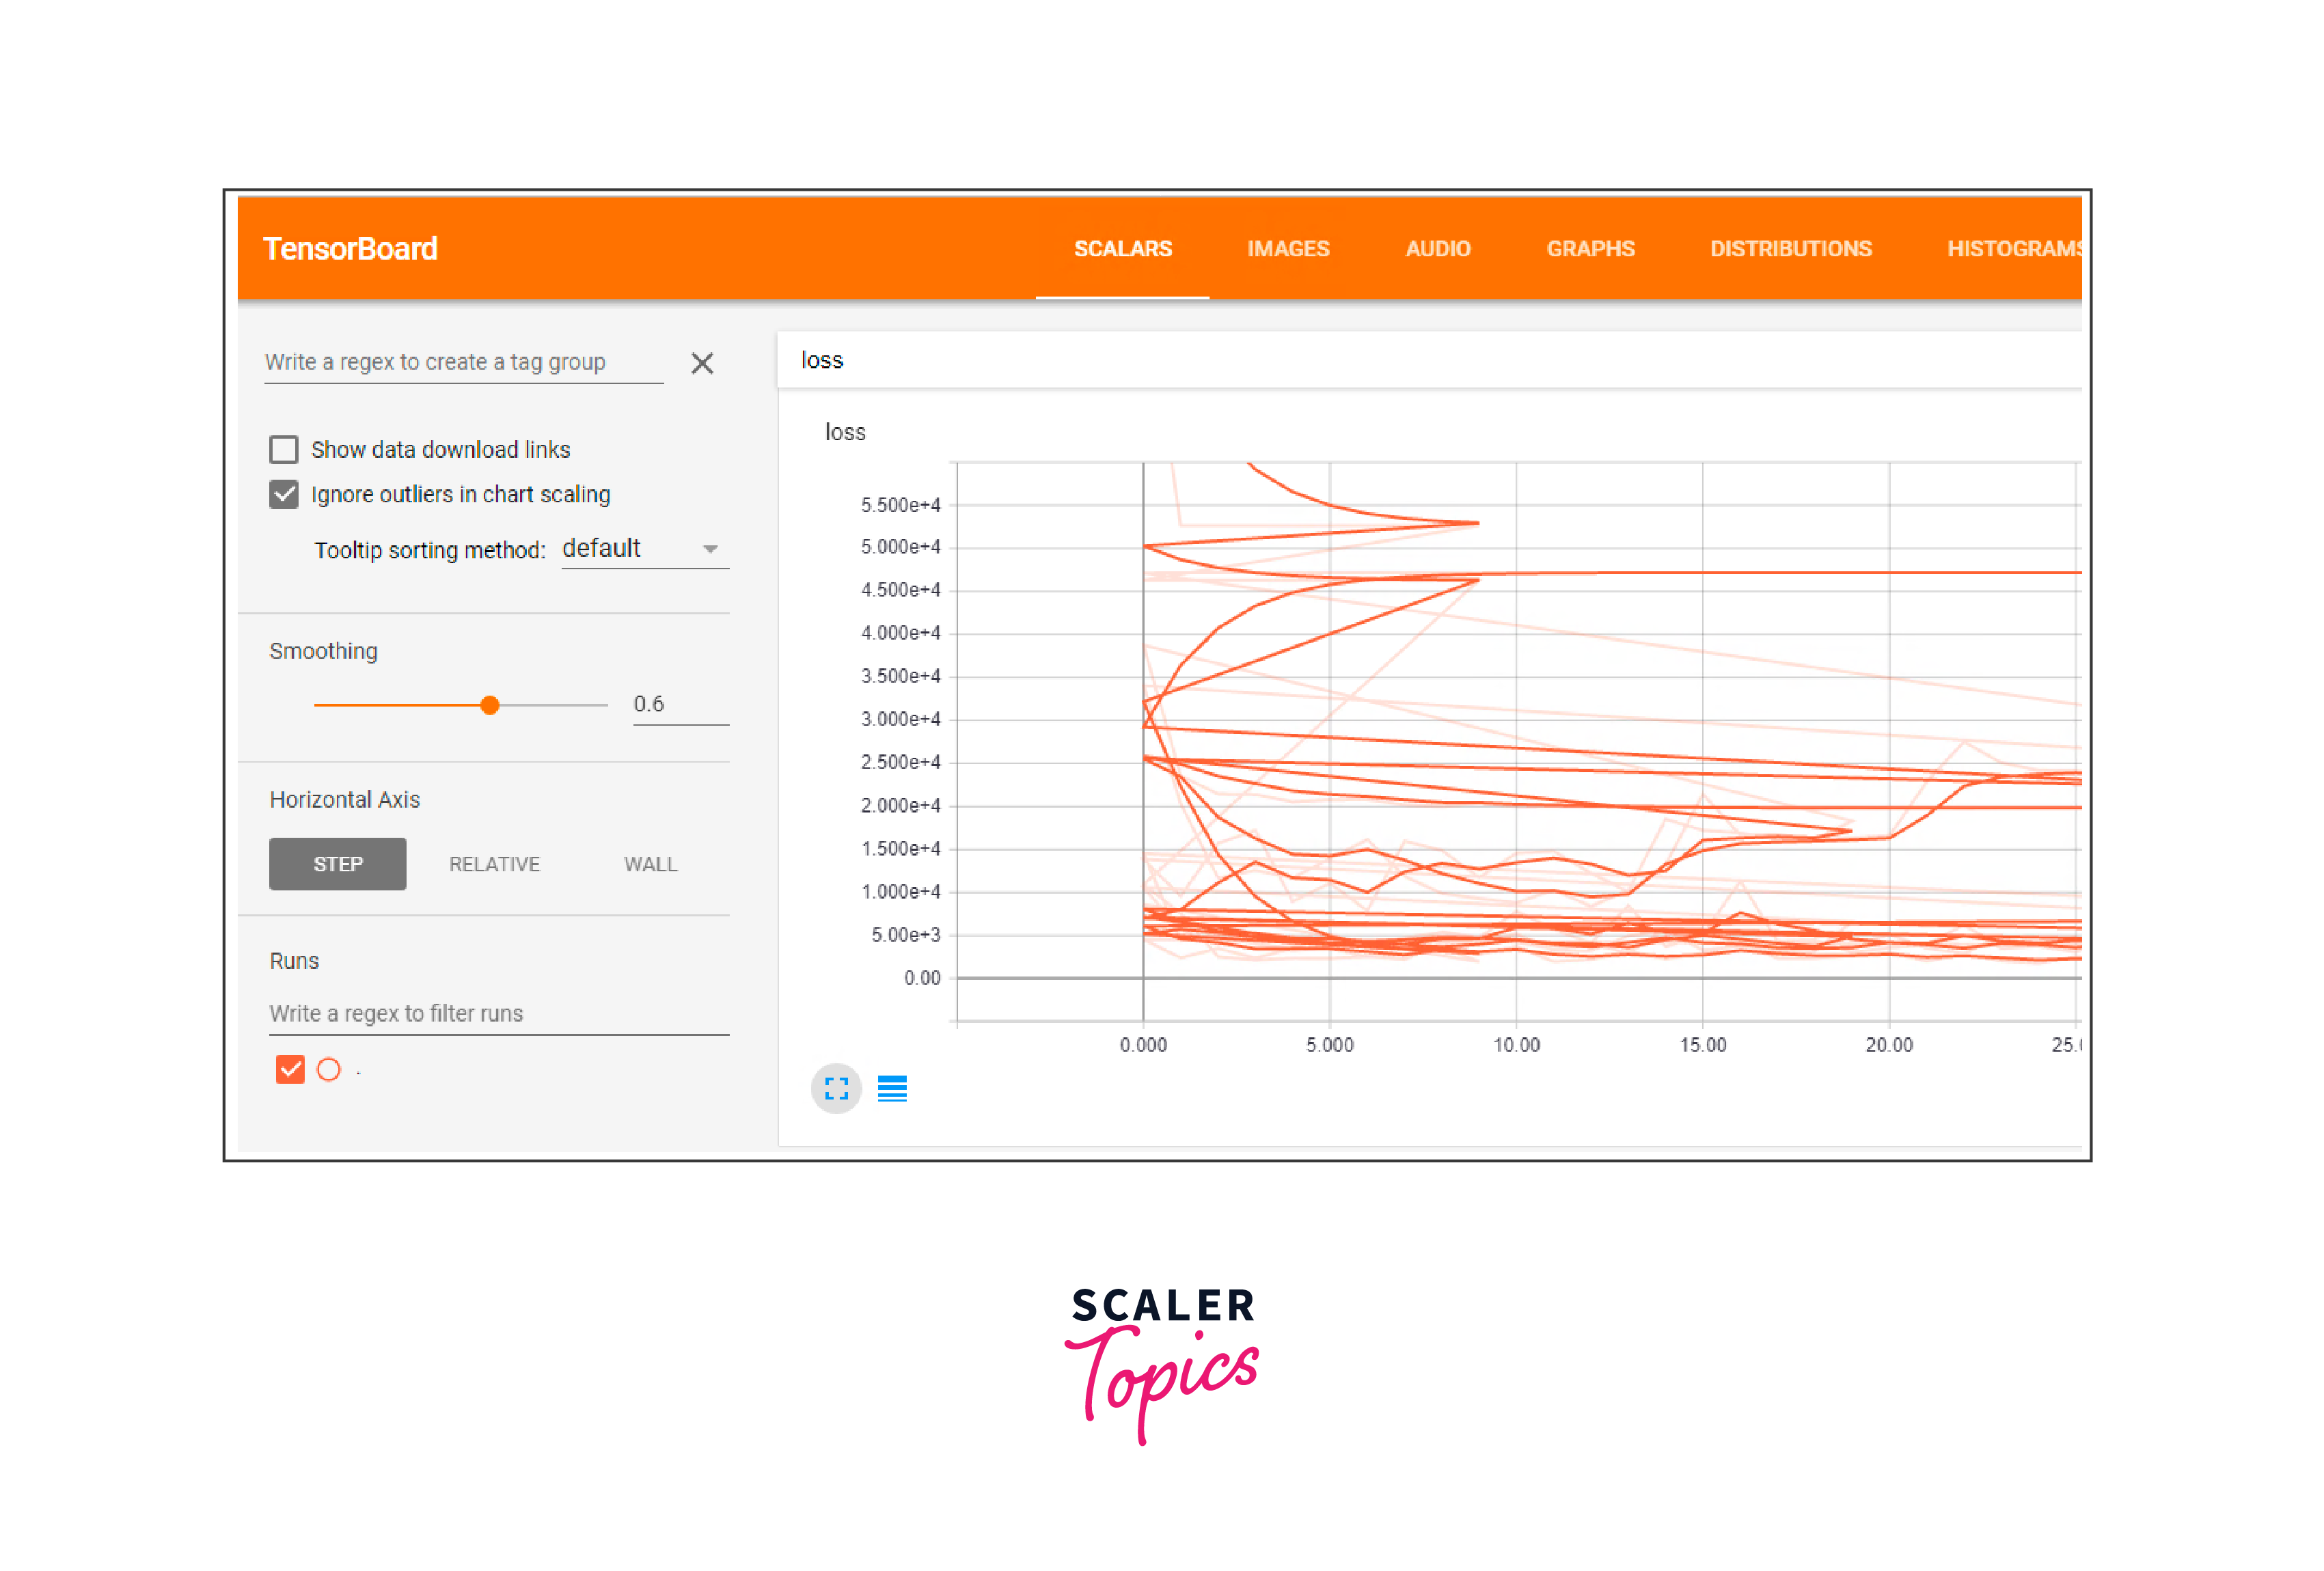
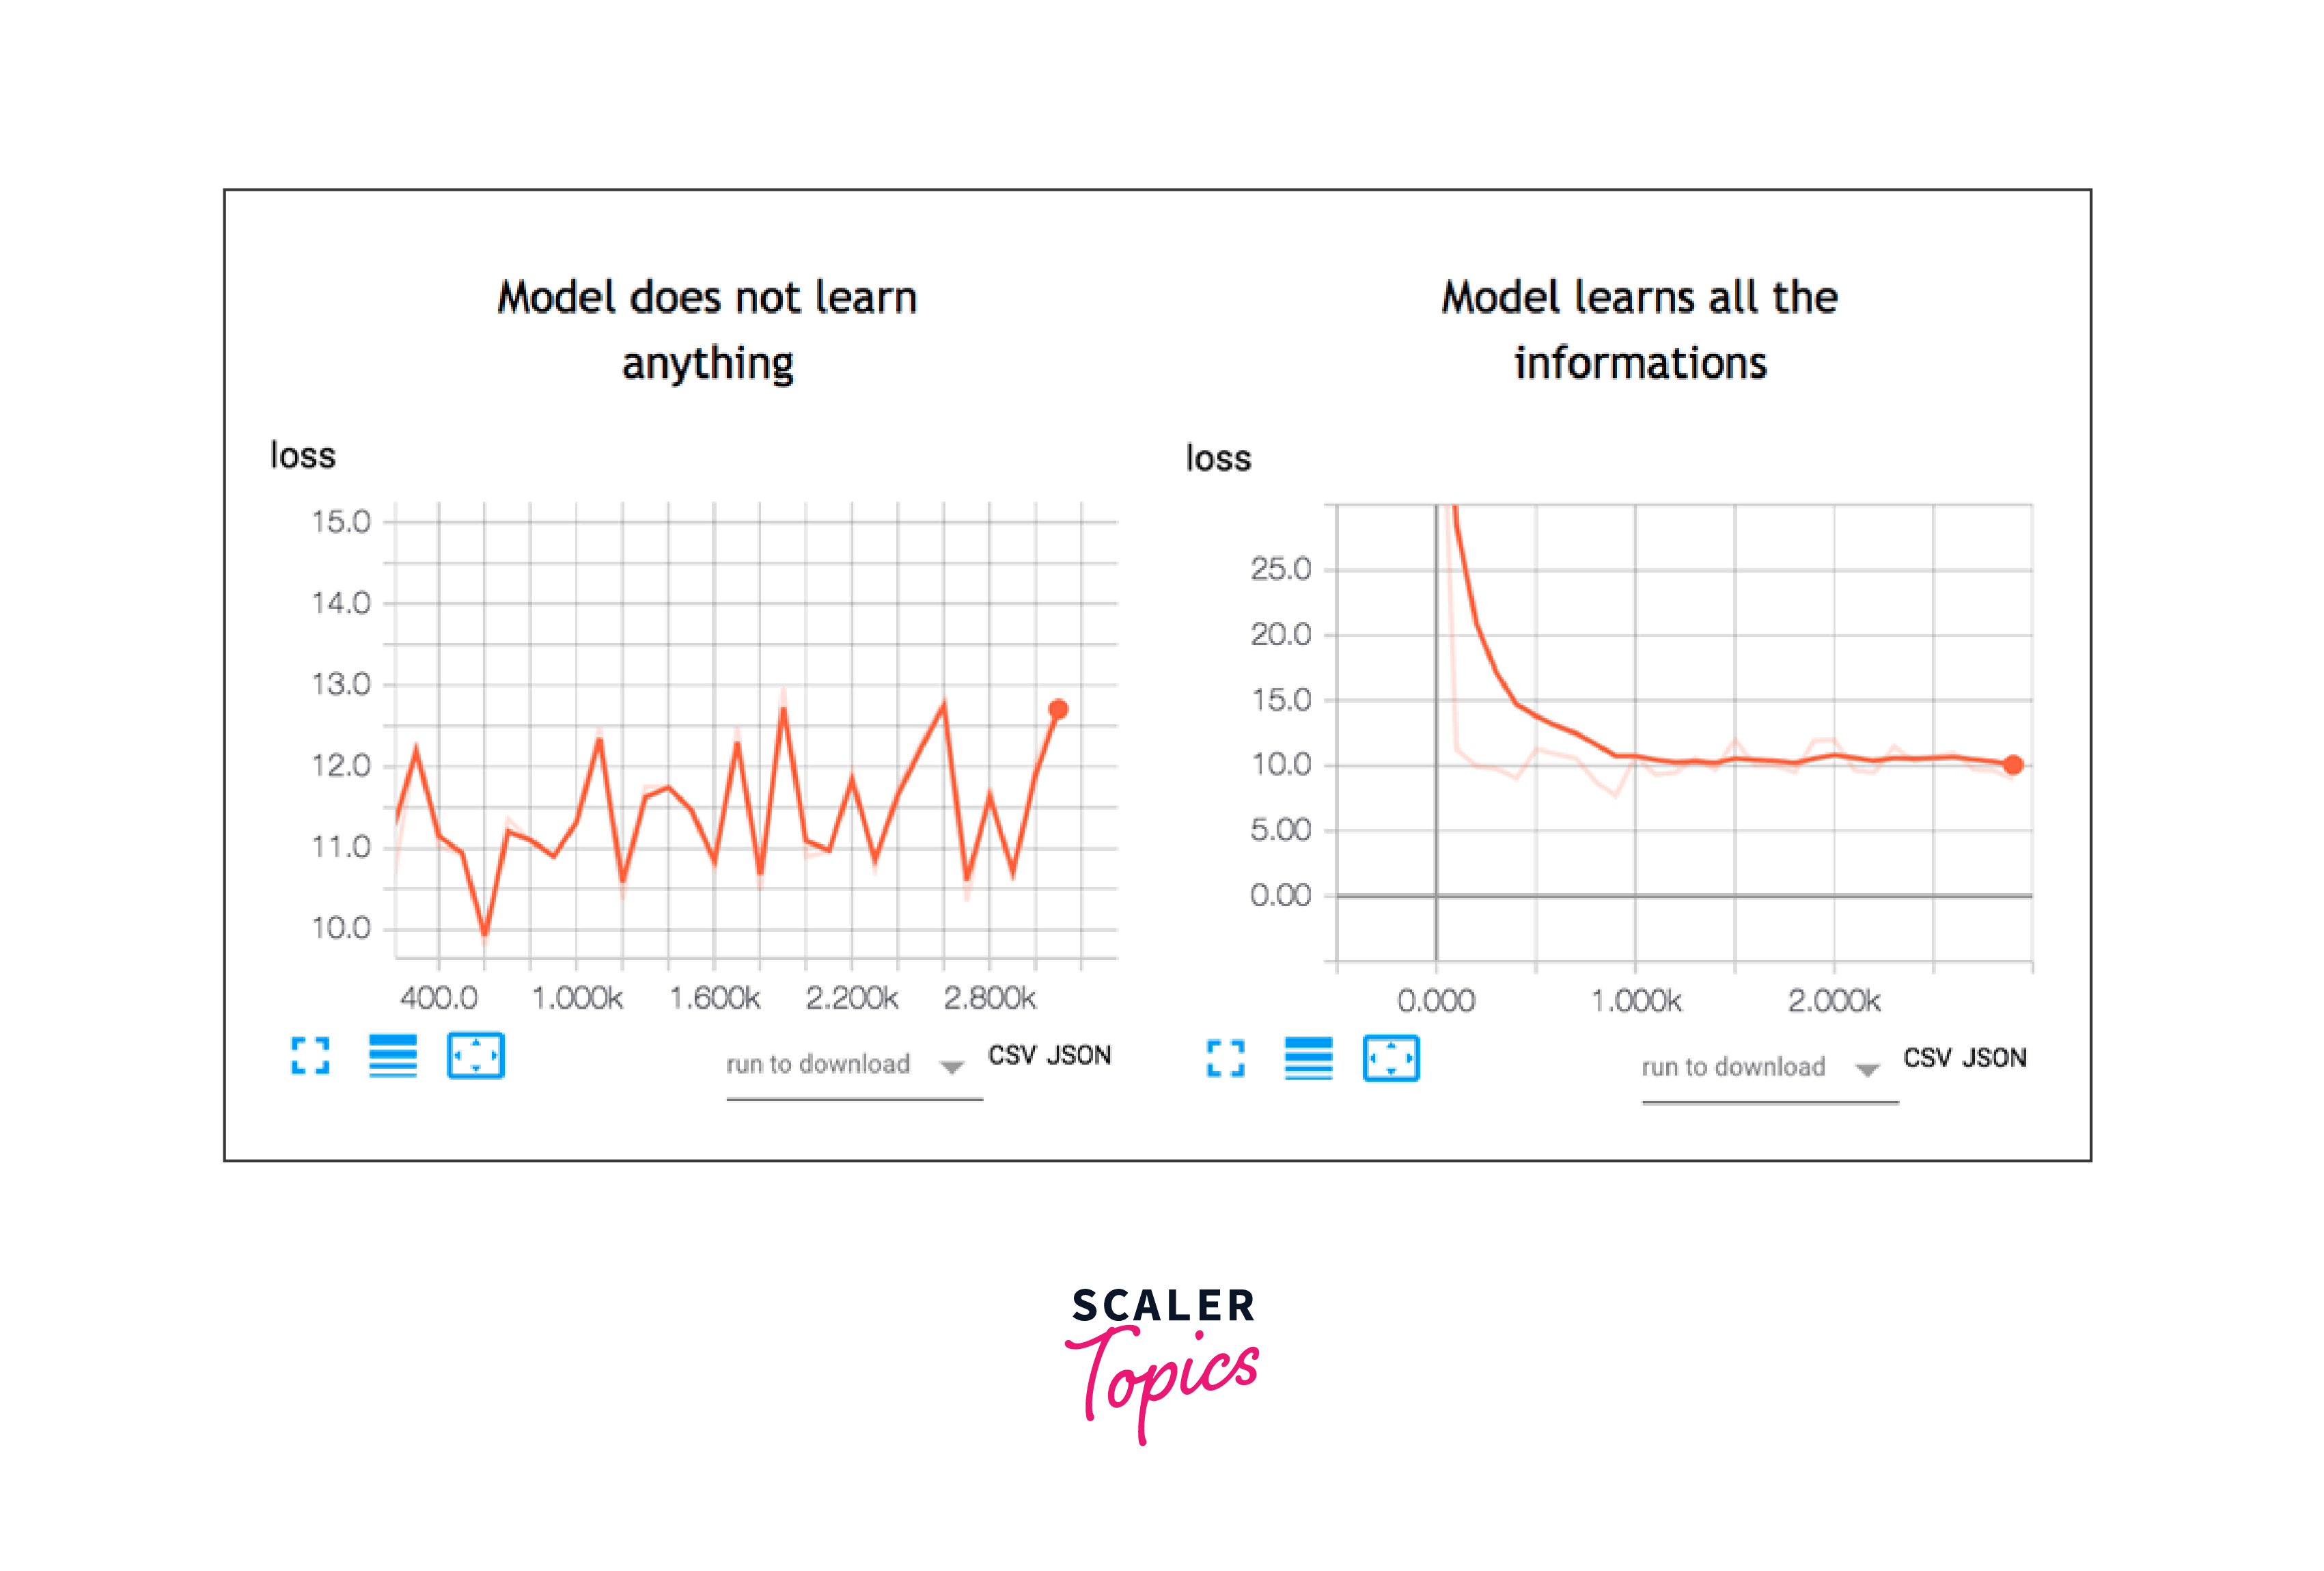
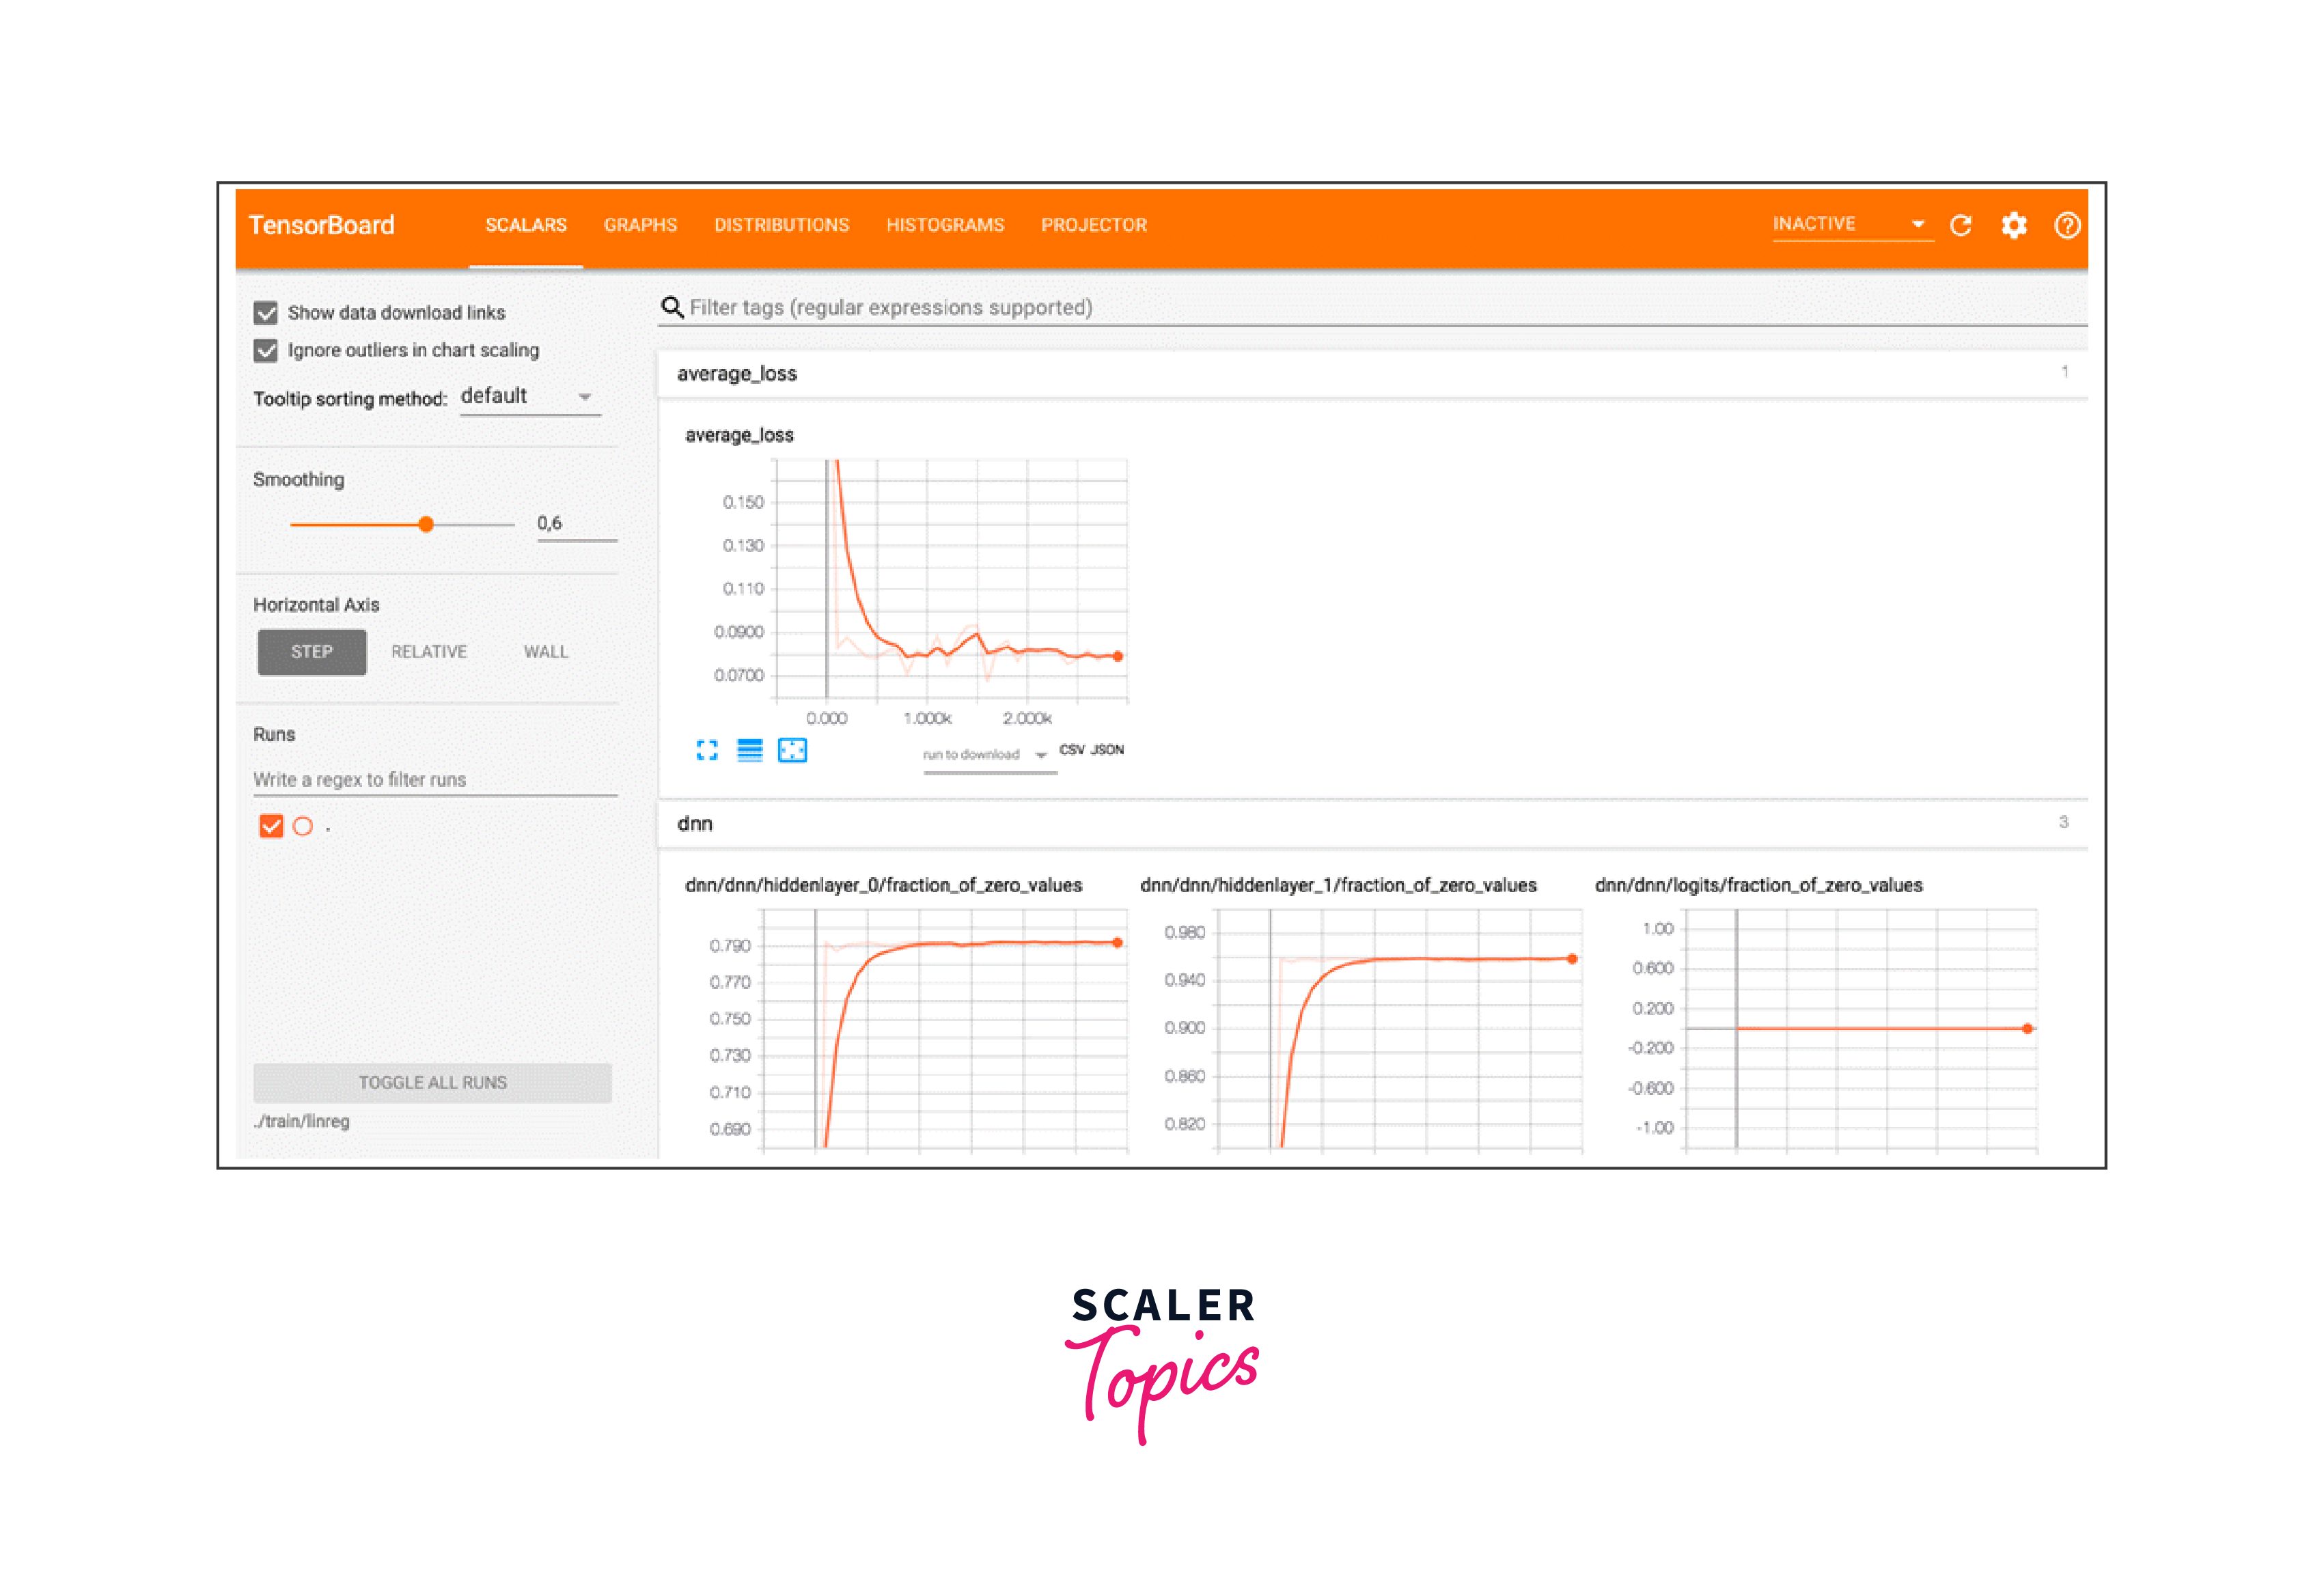
Scalars Dashboard: This dashboard displays scalar values over time. Scalars can include metrics like loss, accuracy, learning rate, etc. You can visualize how these values change during training, helping you identify trends, anomalies, and improvements.
-
Graphs Dashboard: The Graphs dashboard provides a visual representation of your model's computational graph. It enables you to explore the structure of your model, understand how data flows through it, and identify potential issues.
-
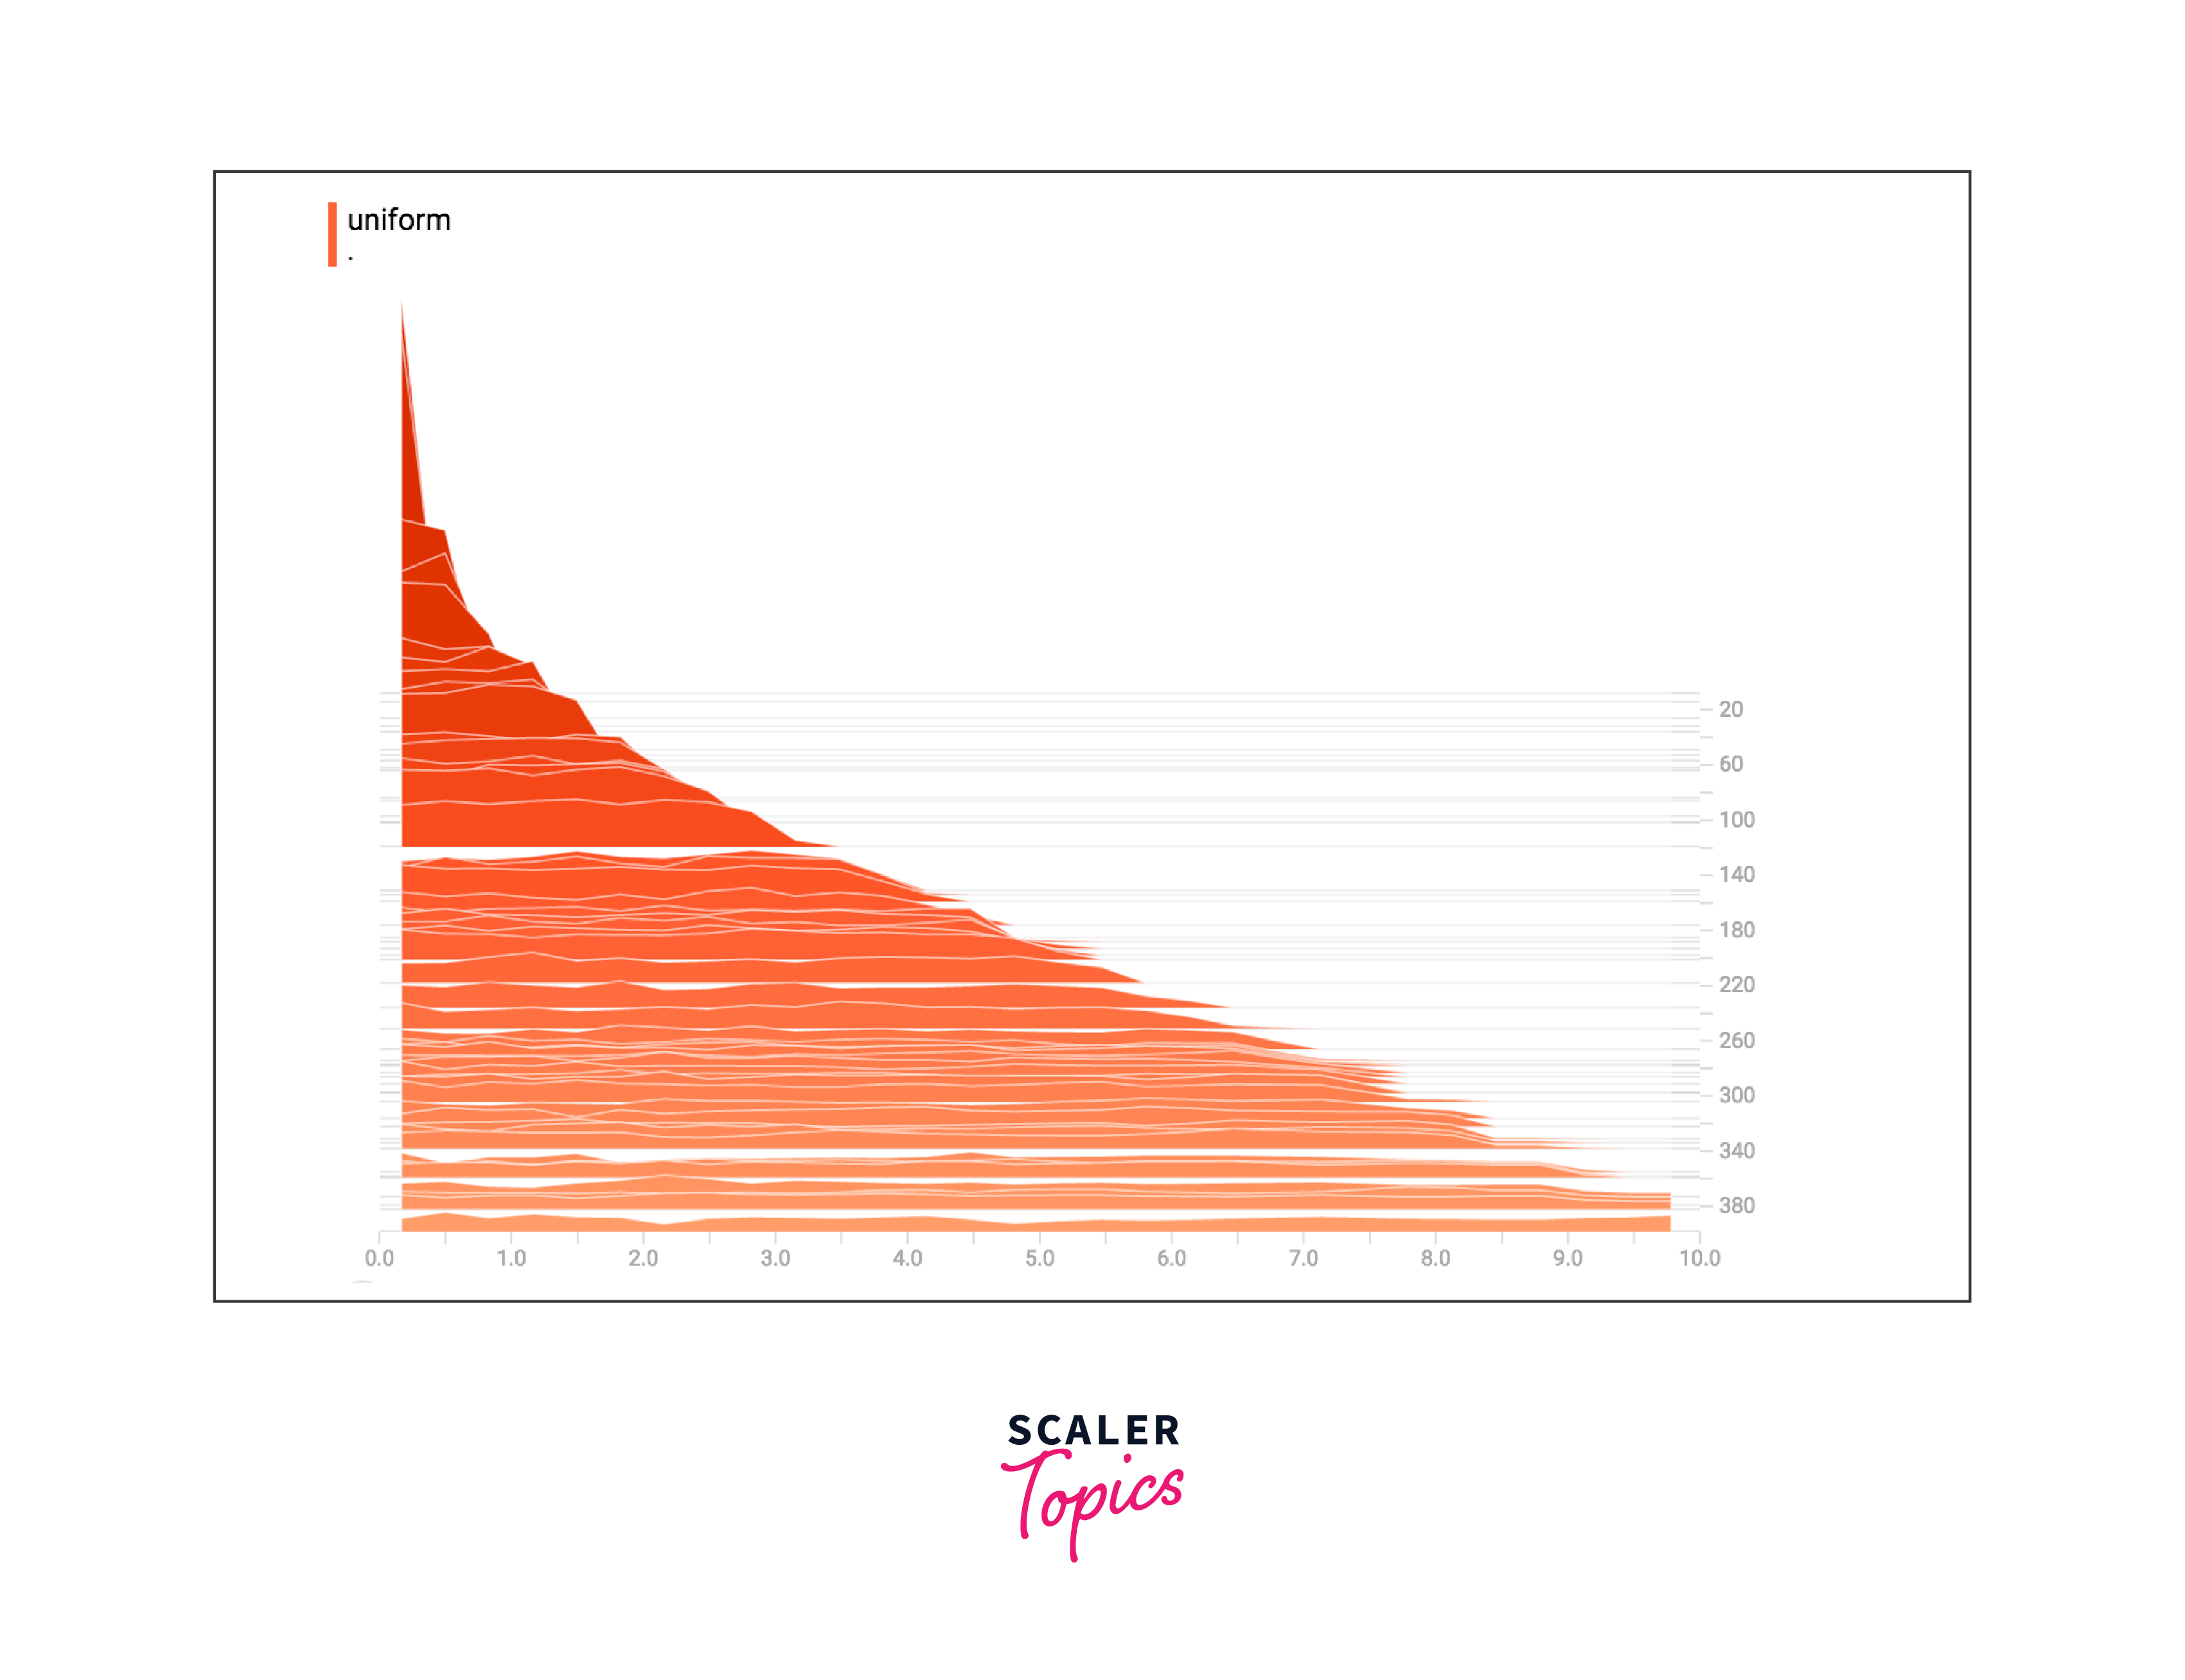
Distributions Dashboard: This dashboard is used to visualize the distributions of tensor values in your model. It's particularly useful for understanding weight distributions, activation distributions, and gradient distributions.
-
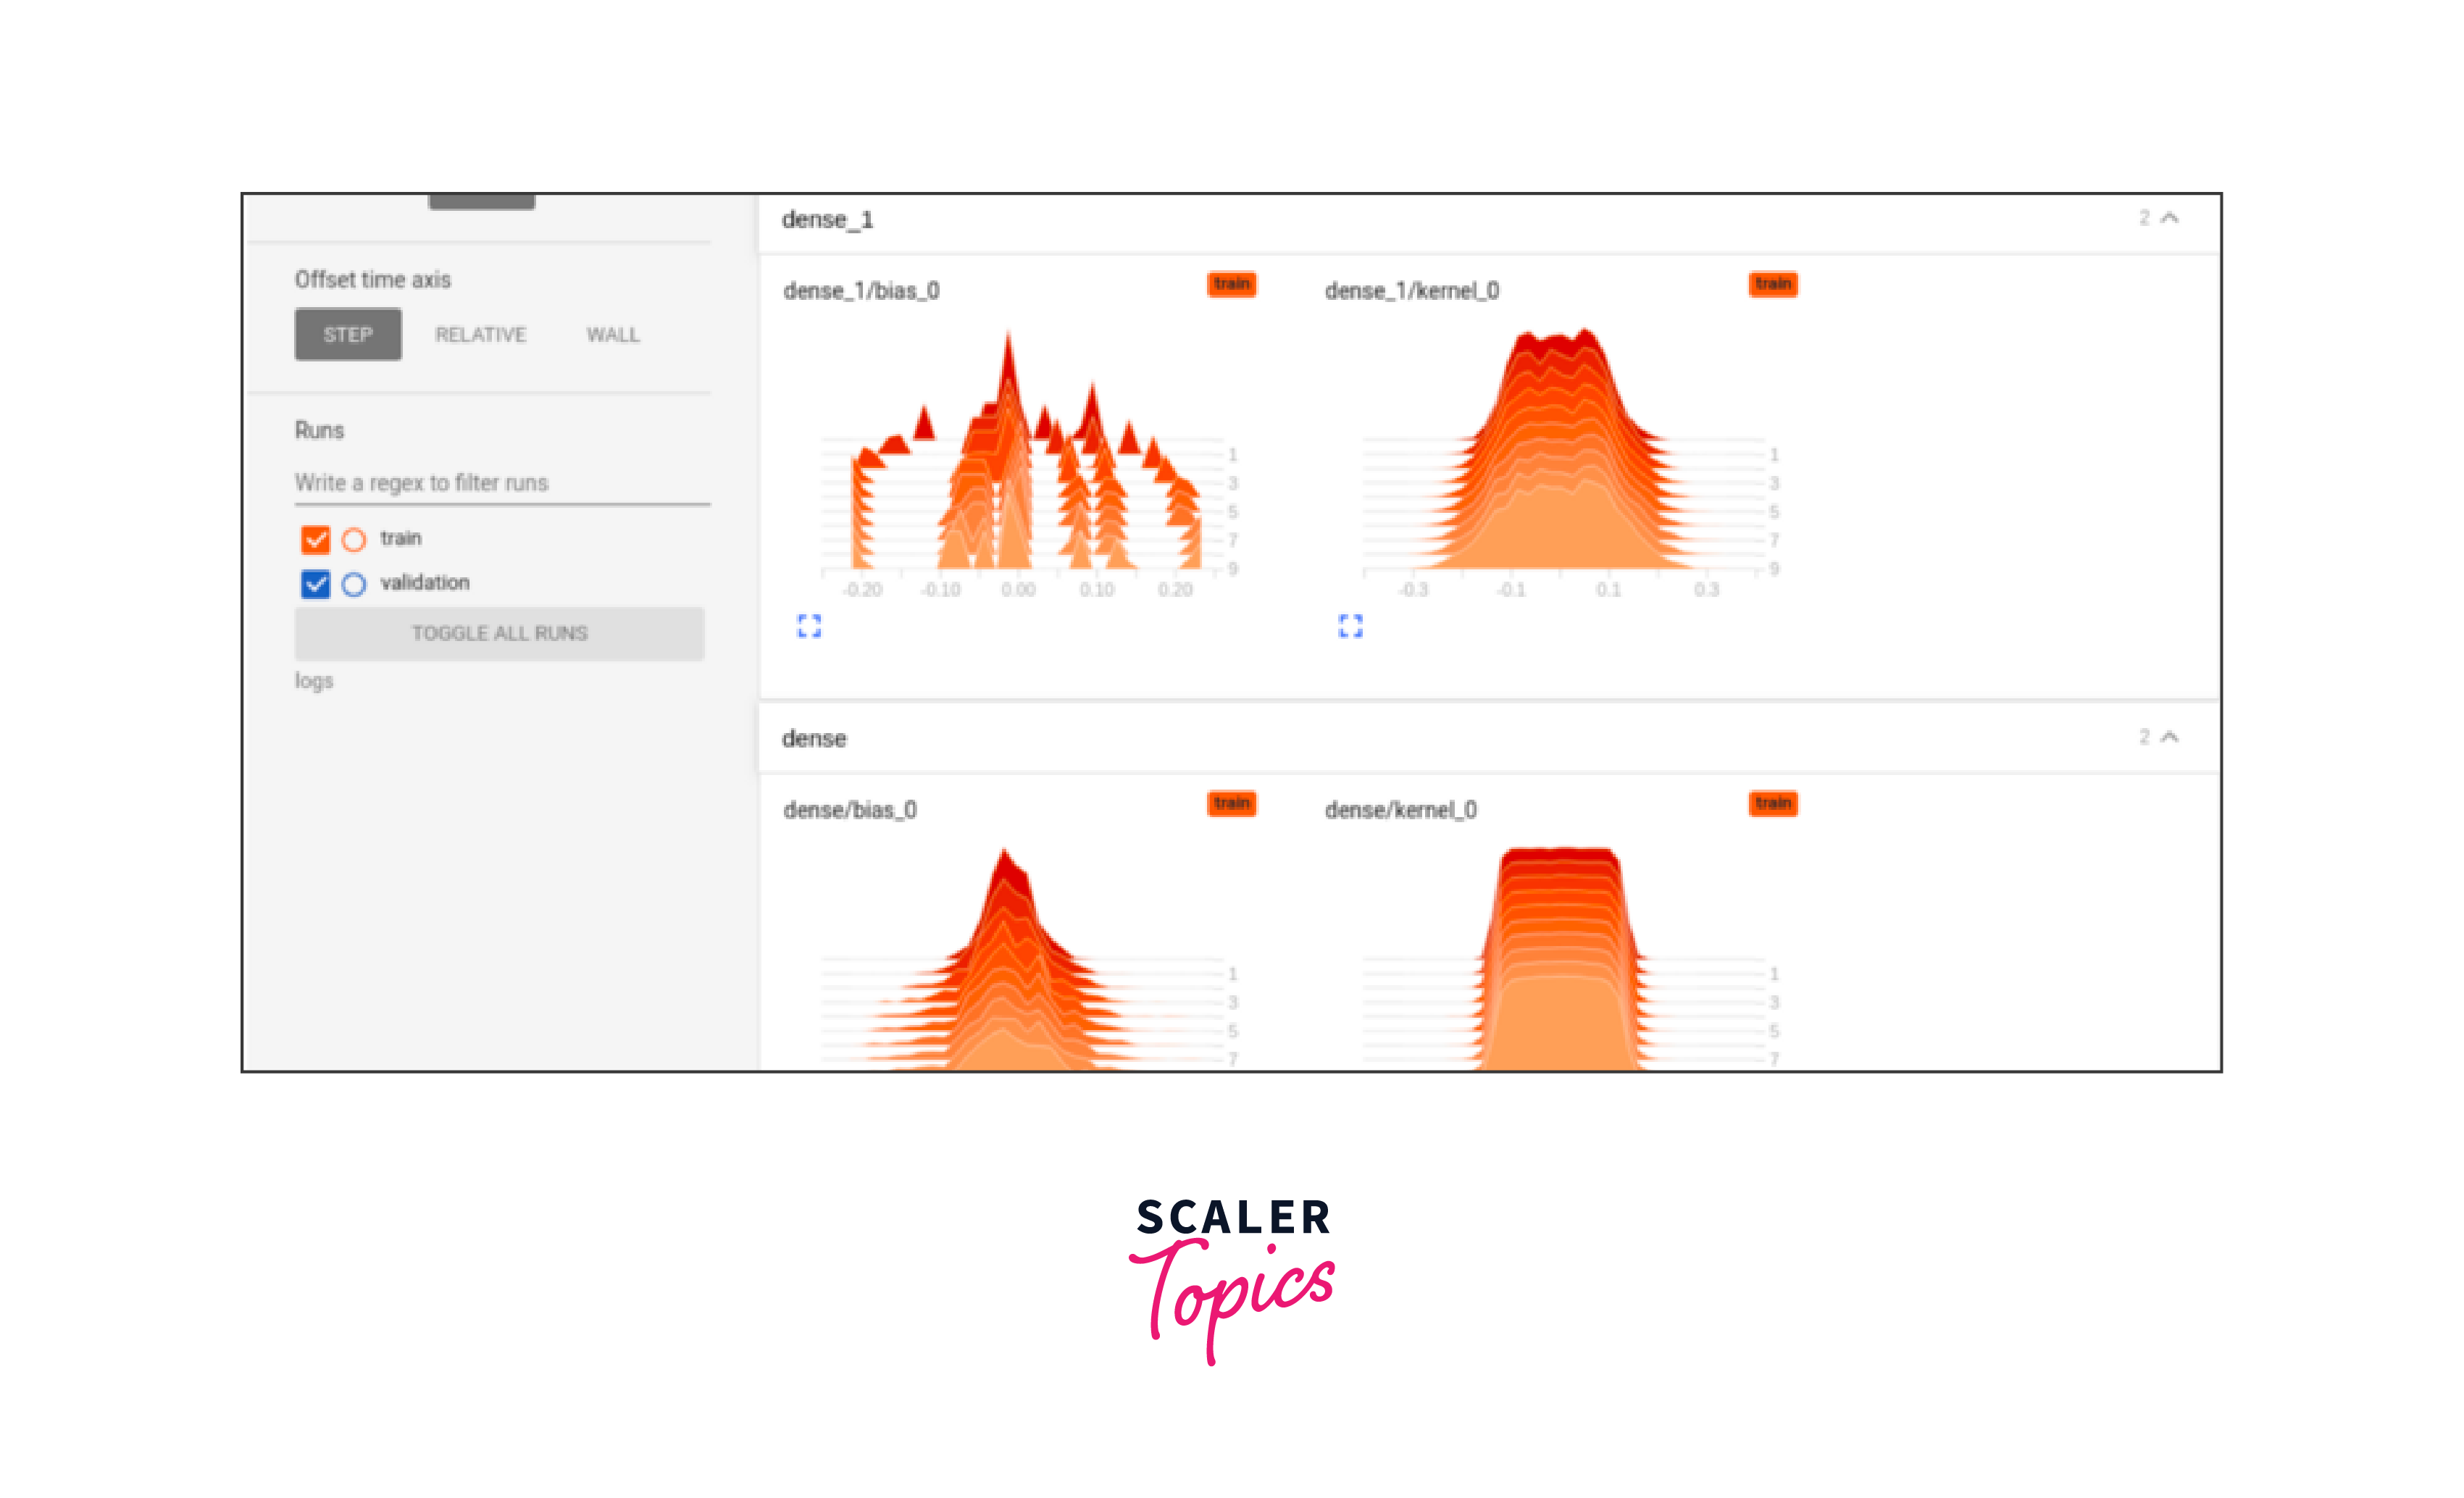
Histograms Dashboard: Similar to the Distributions dashboard, the Histograms dashboard displays histograms of tensor values. It helps you understand the distribution of values in your tensors and how they change over time.
-
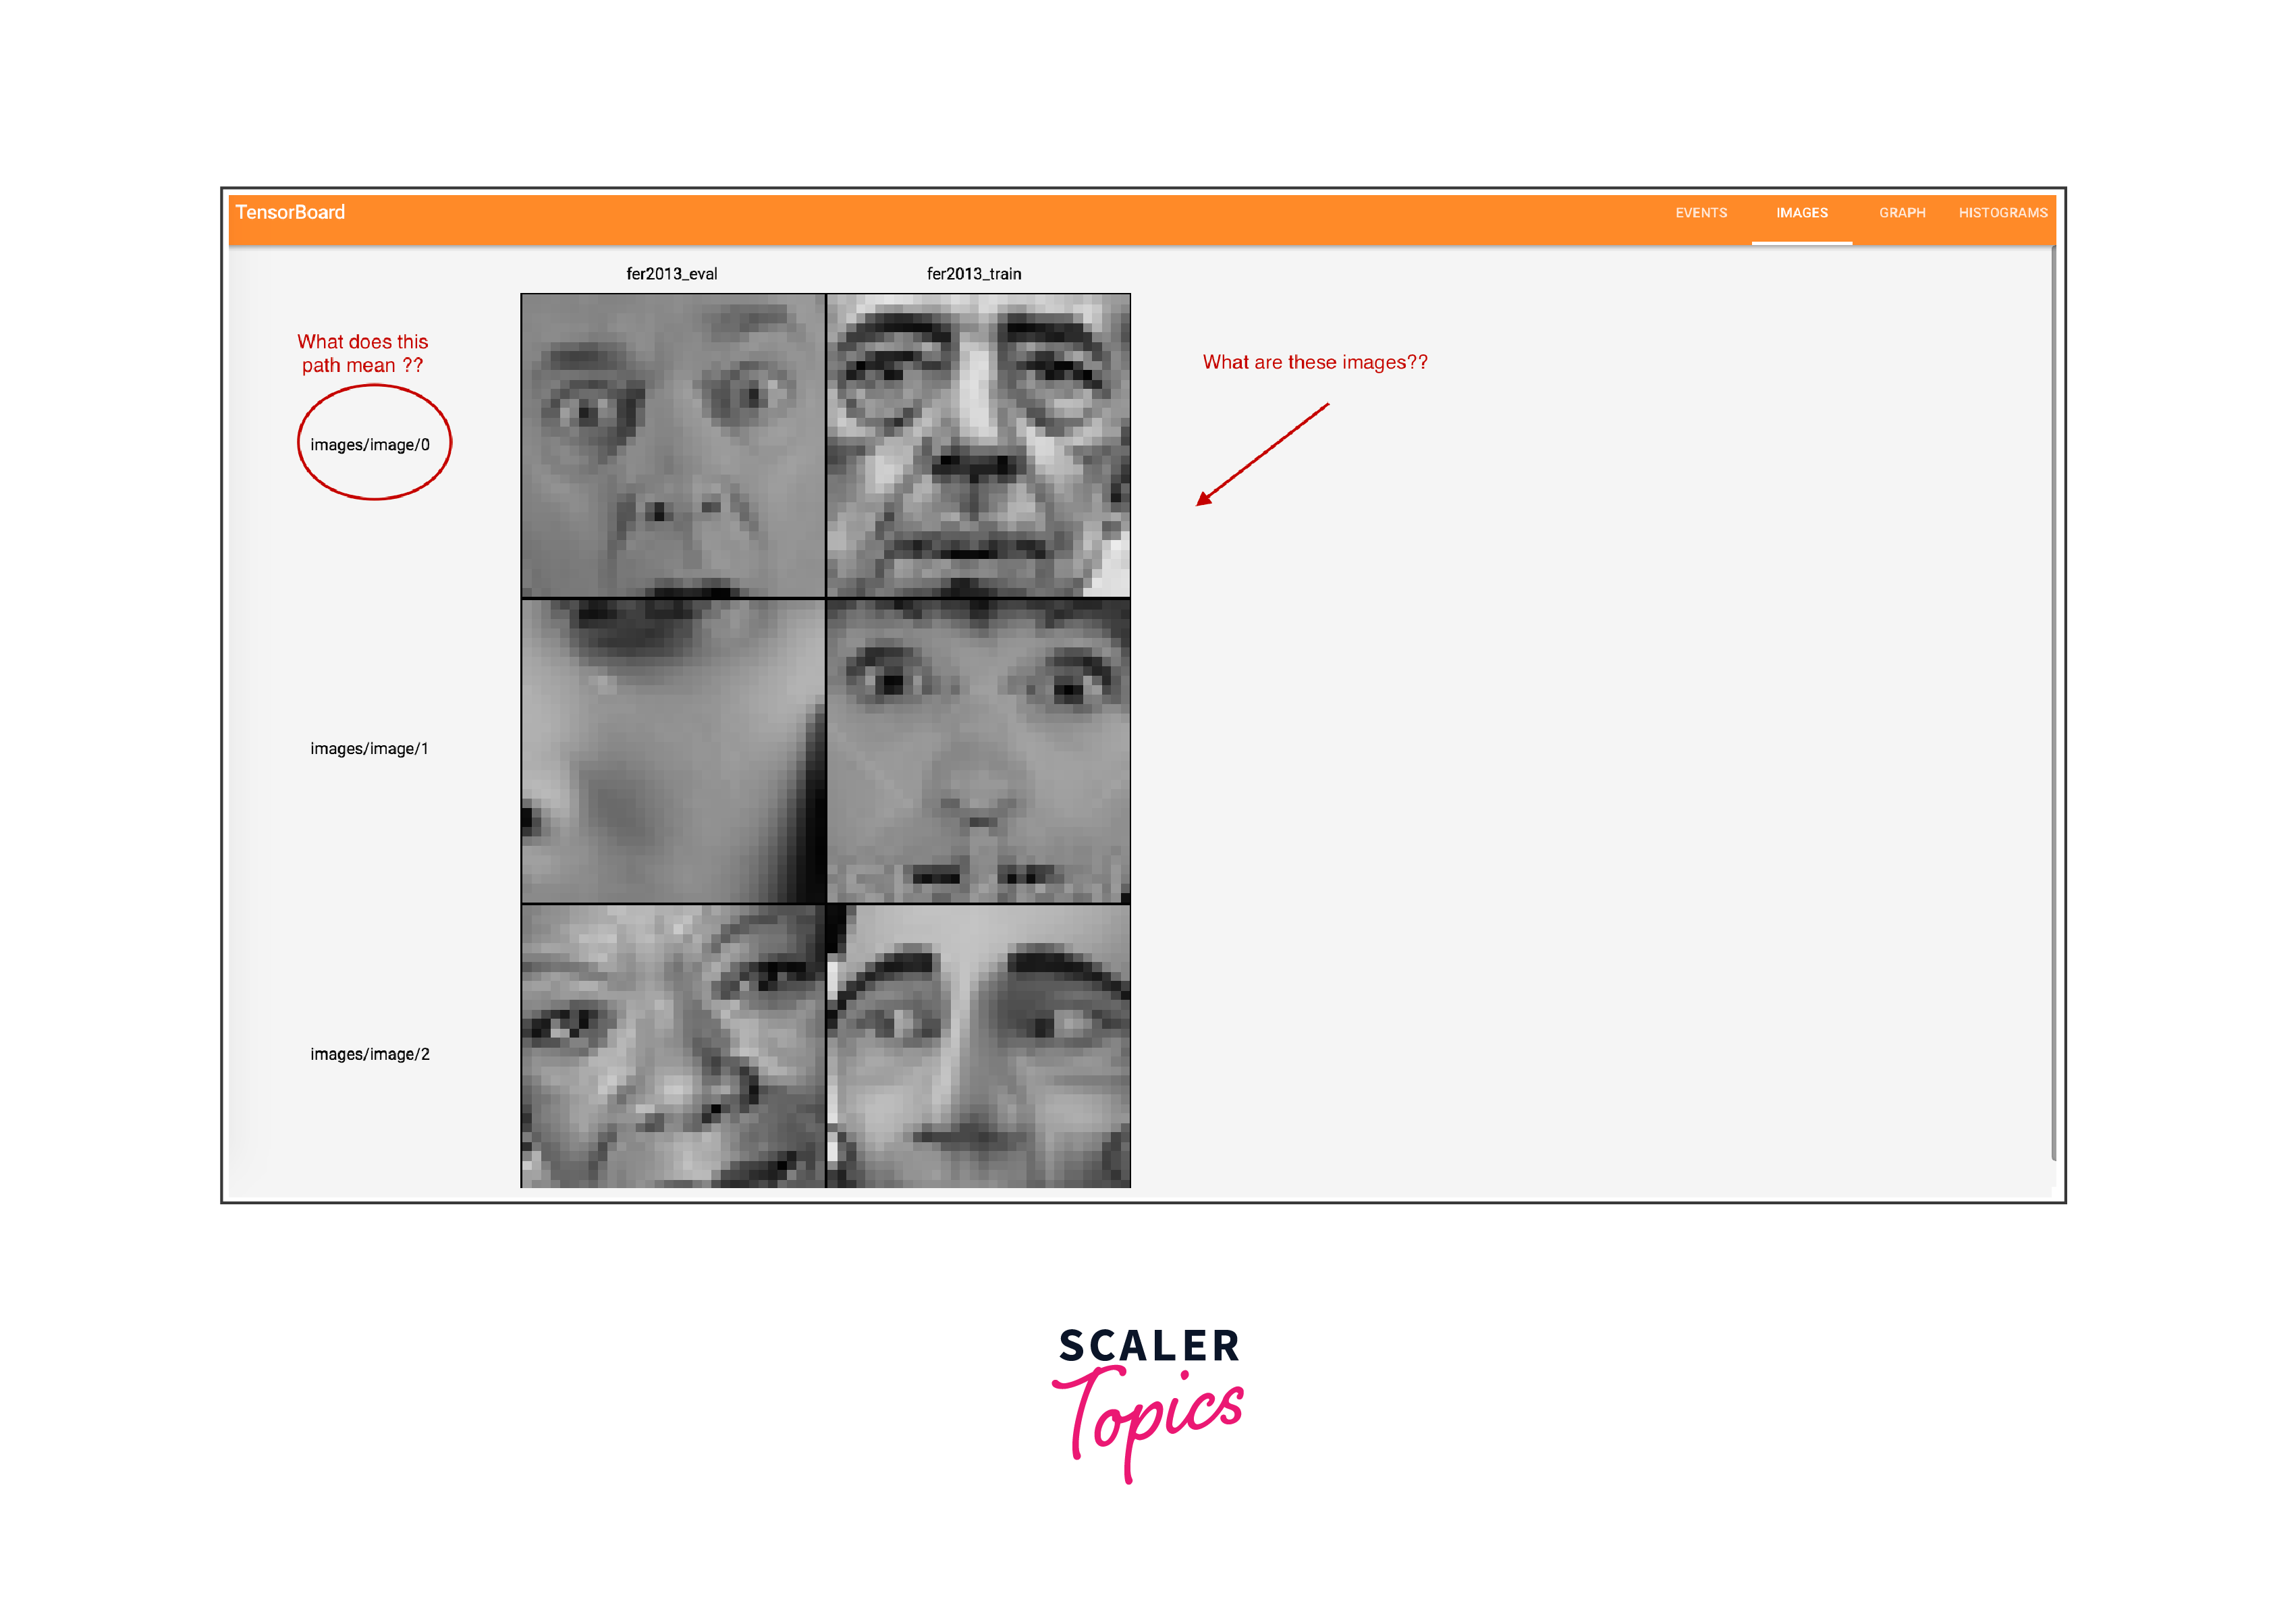
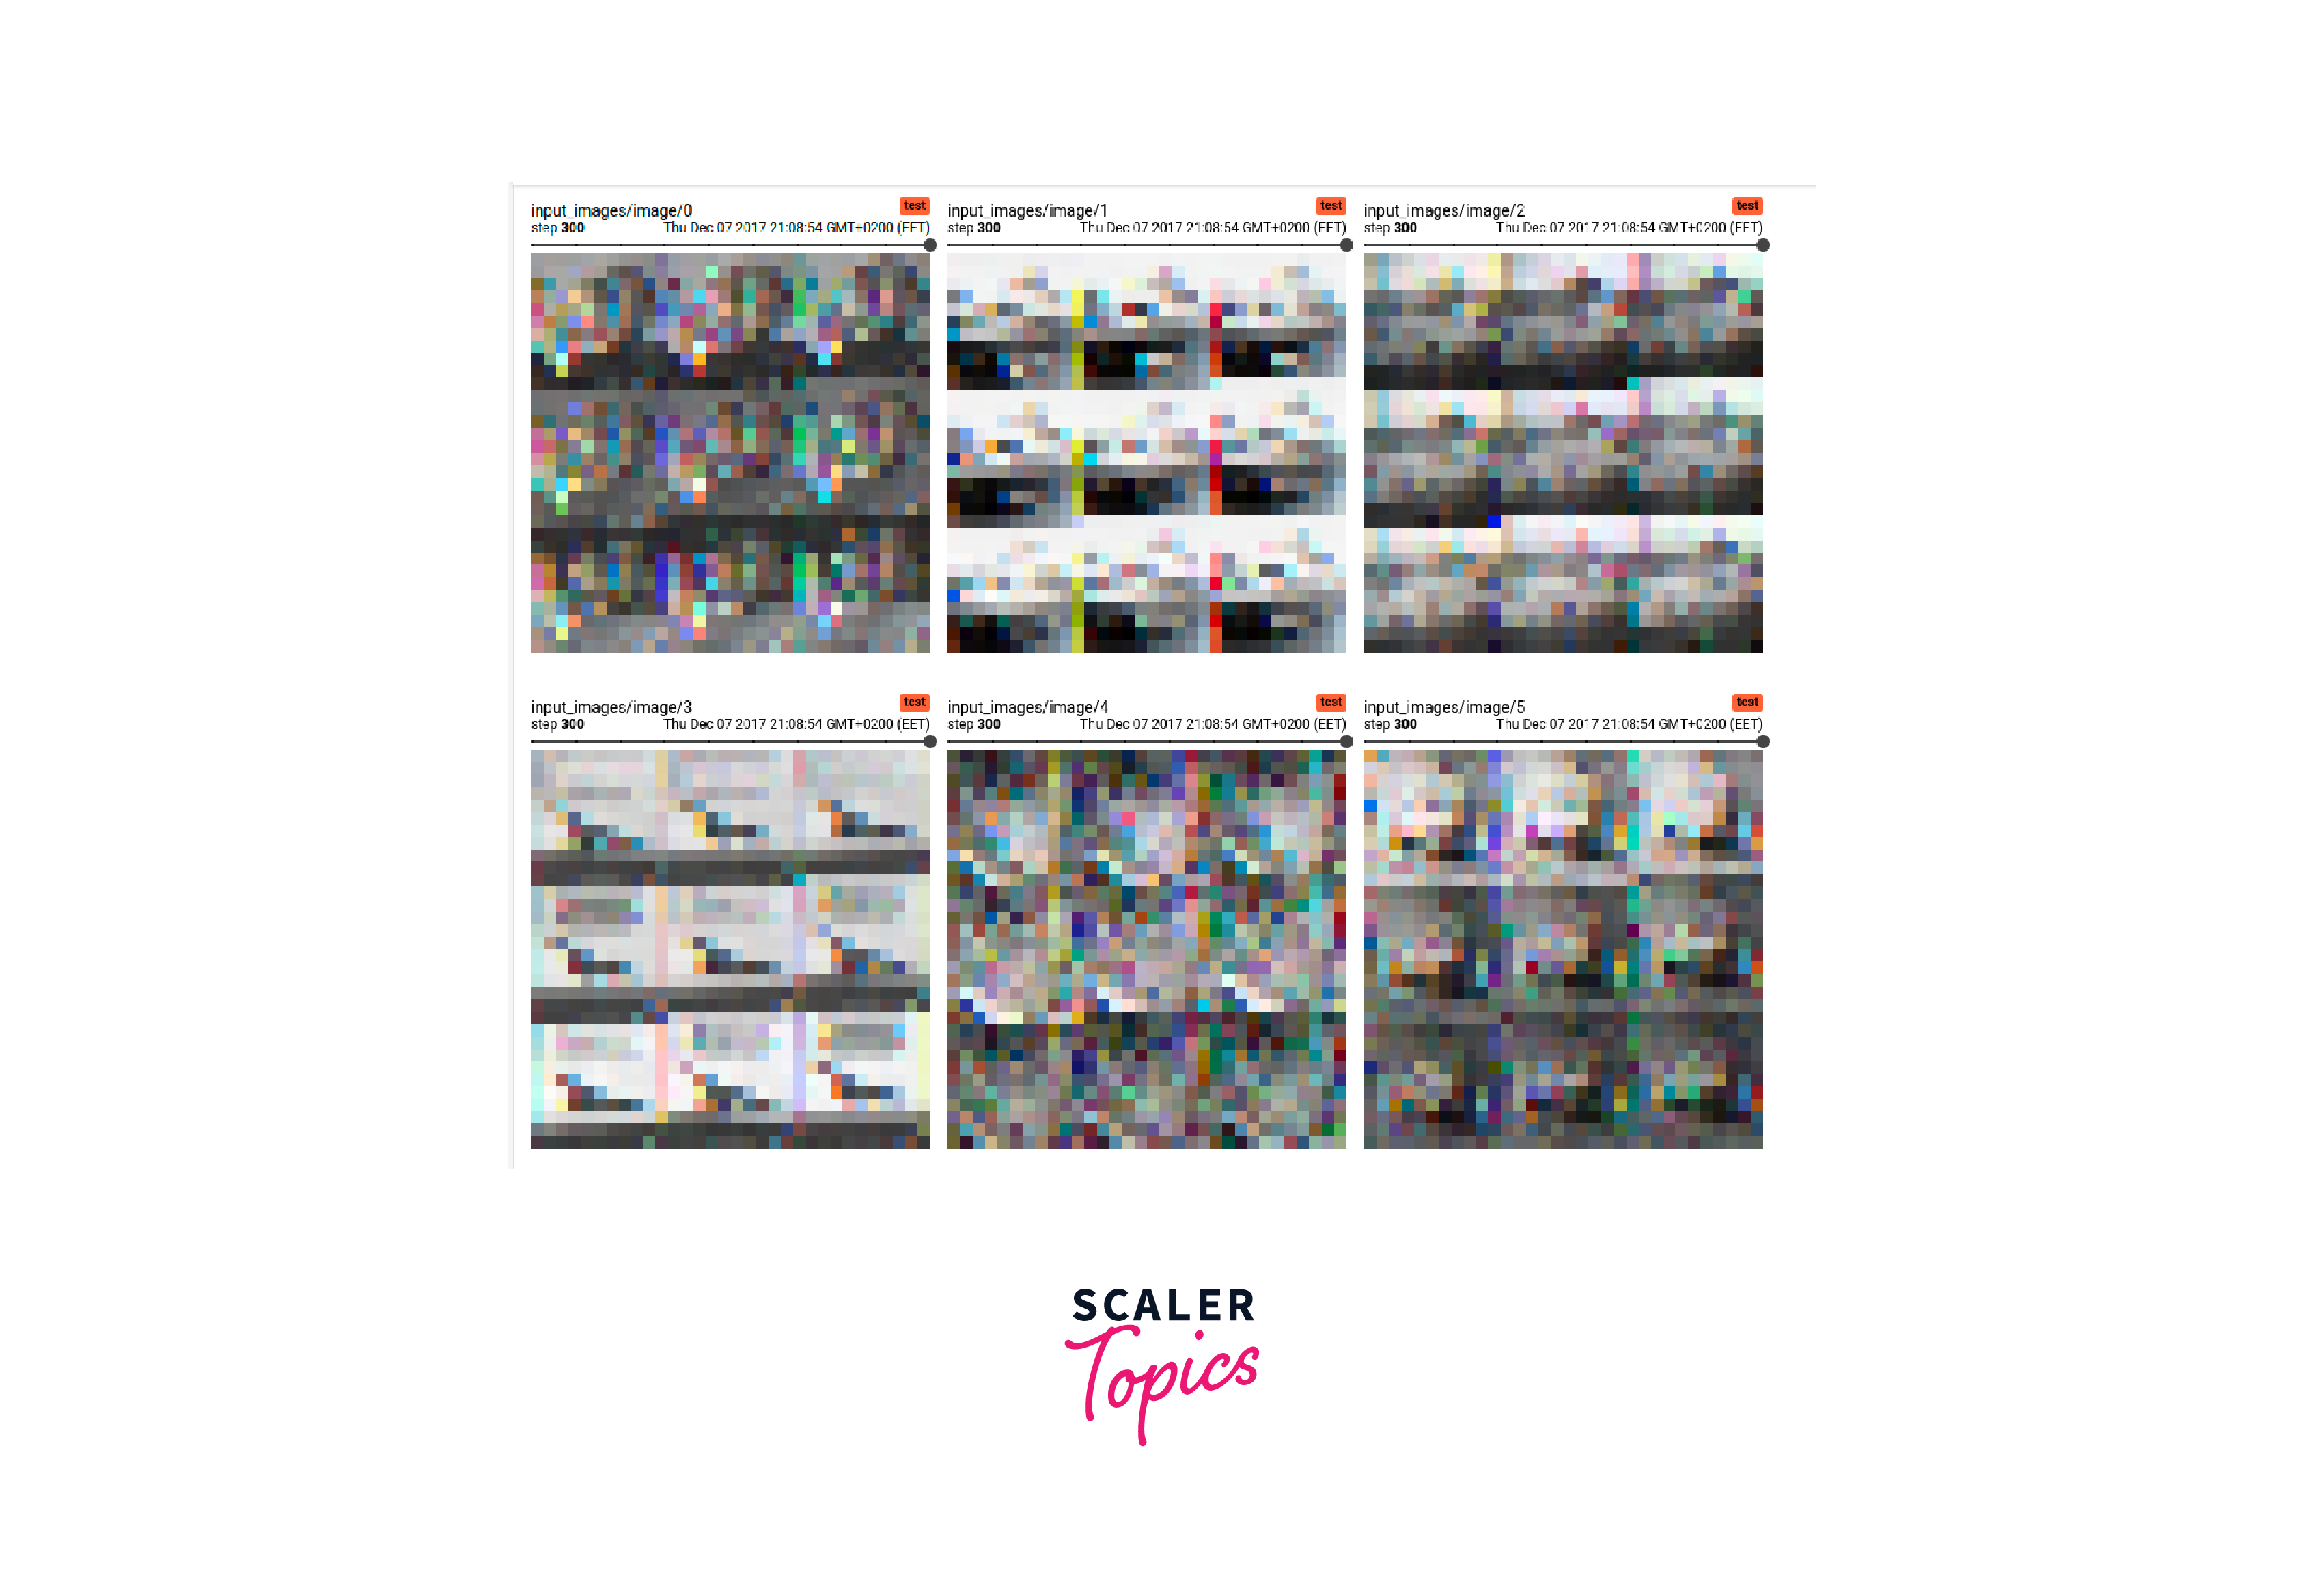
Images Dashboard: The Images dashboard allows you to visualize images during training. This is useful for monitoring how your model's predictions align with the actual images, helping you spot misclassifications or other issues.
-
Audio Dashboard: If your model deals with audio data, this dashboard can be used to visualize audio clips and their characteristics during training.
-
Text Dashboard: If your model processes text data, the Text dashboard can display text embeddings, showing how your model's text representations evolve over time.
-
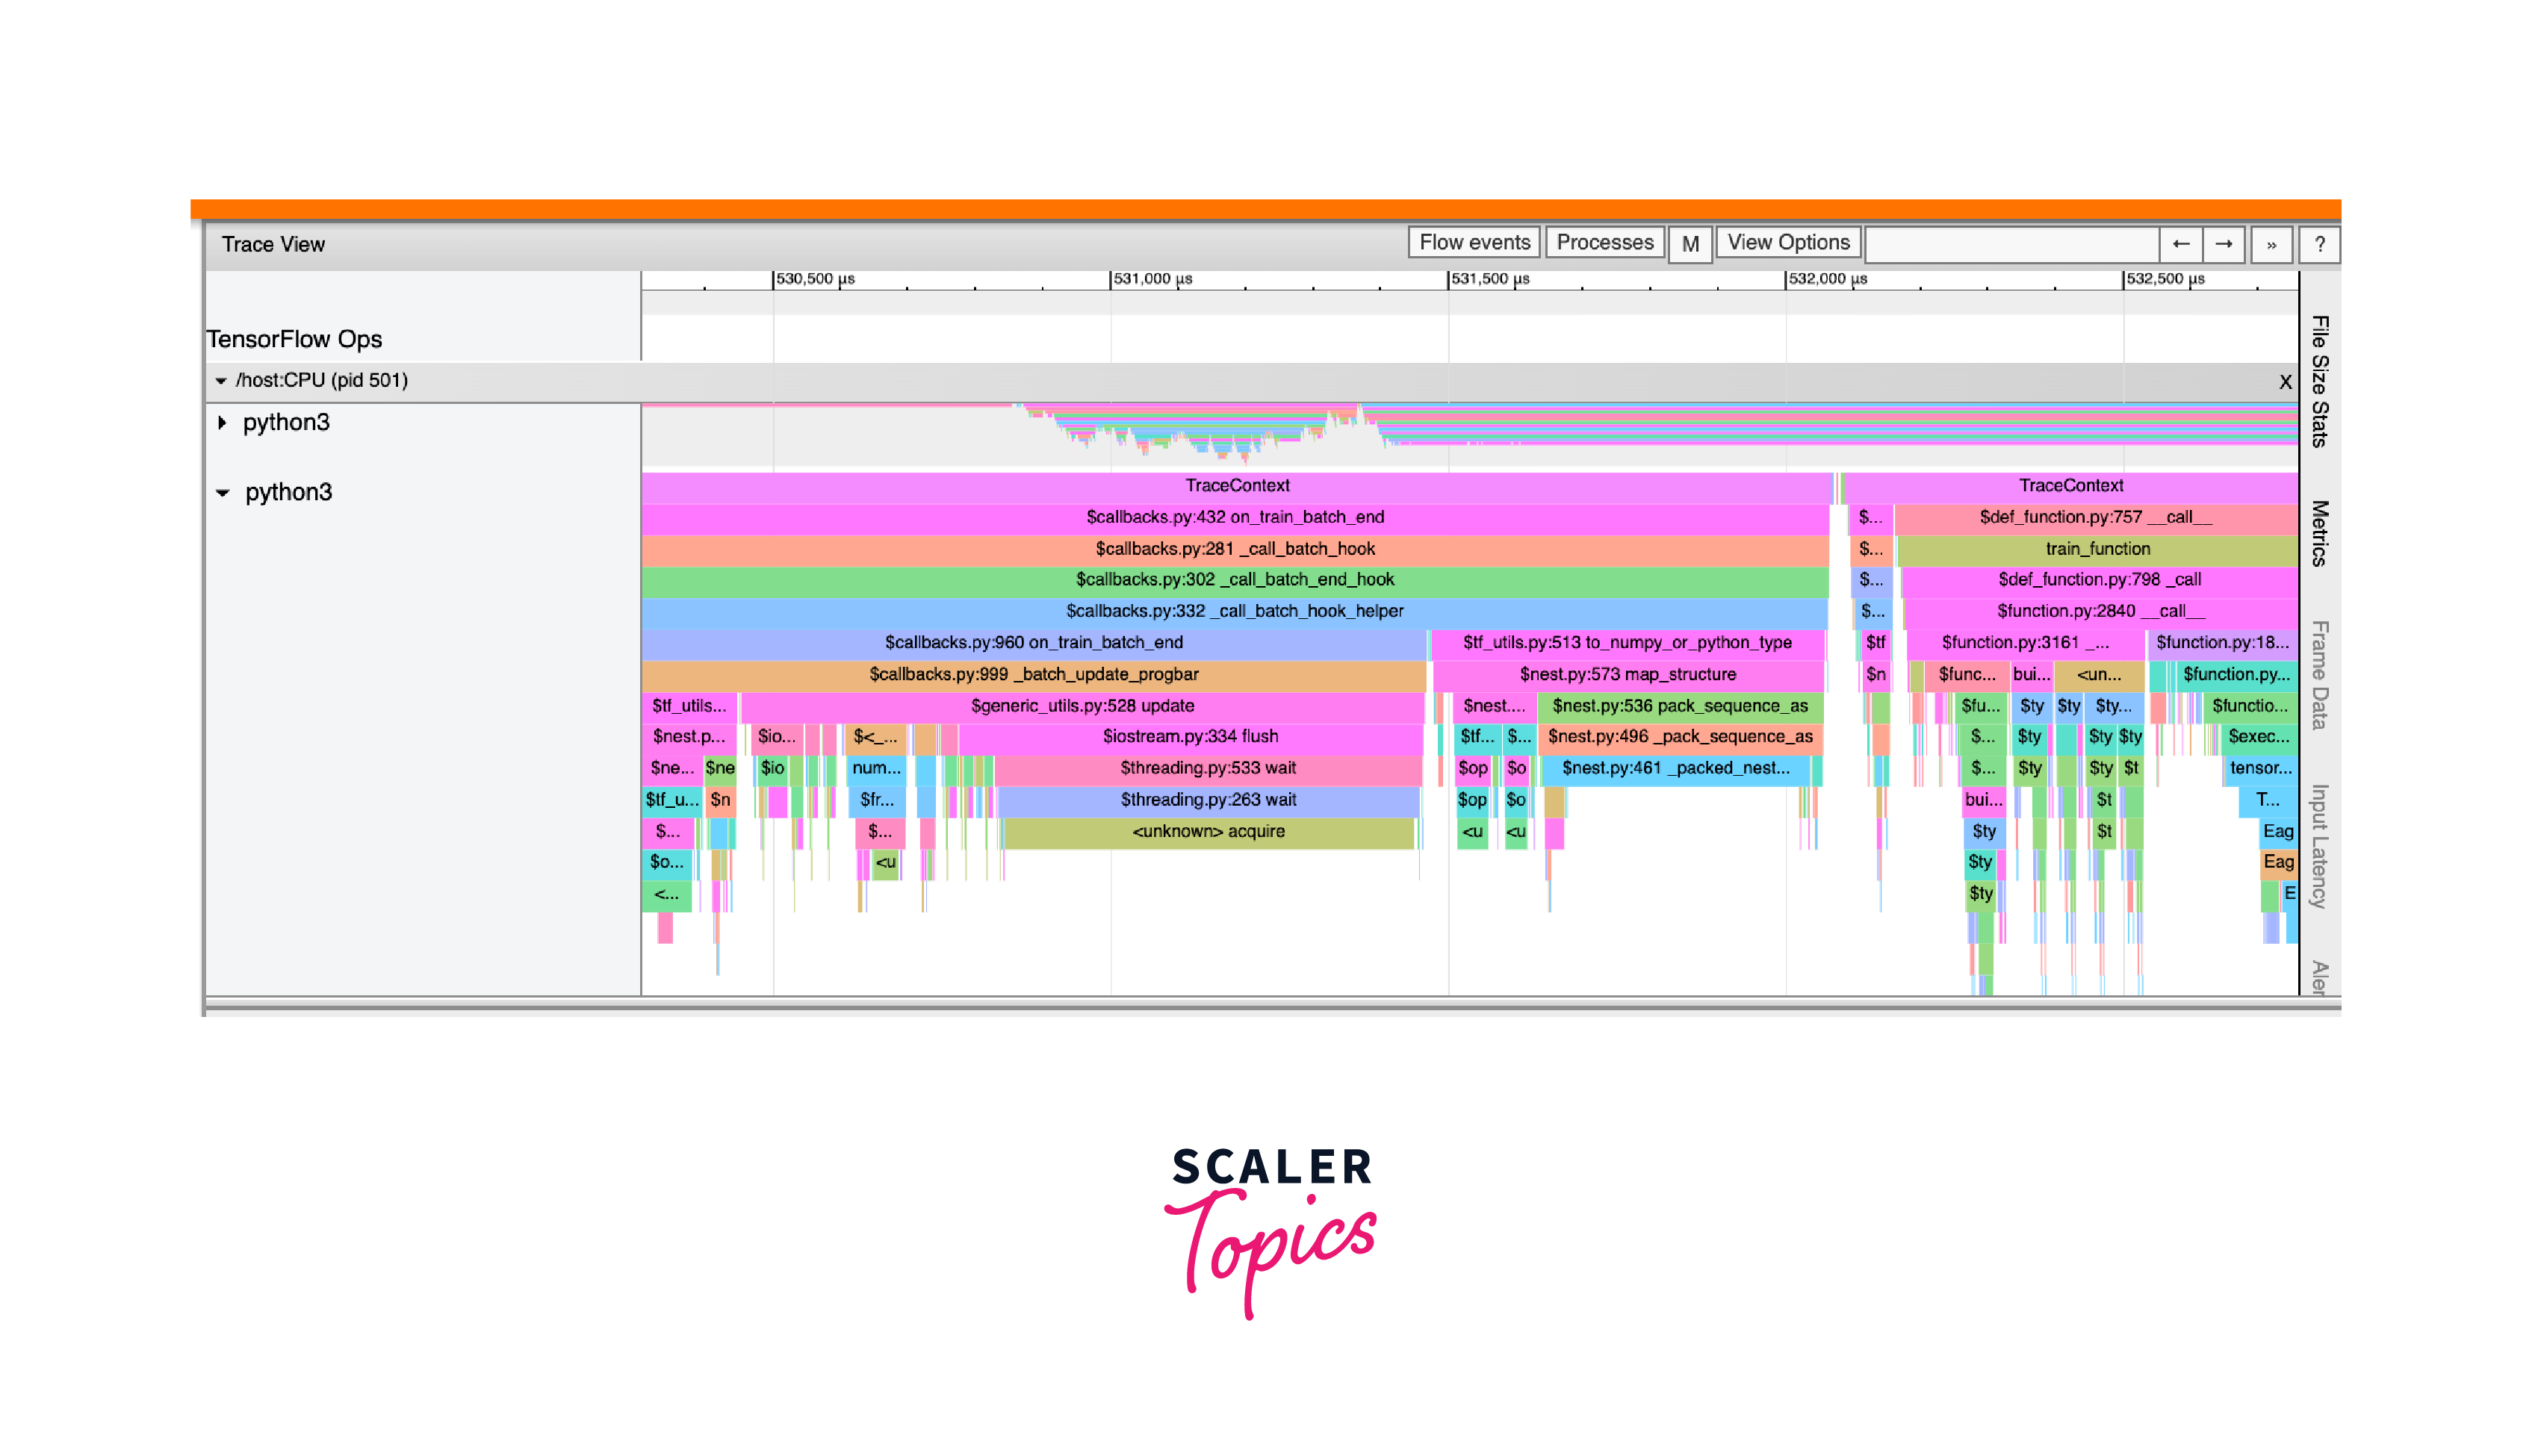
Profile Dashboard: The Profile dashboard helps you analyze the performance of your model, identifying potential bottlenecks or areas for optimization.
Different Views of TensorBoard
Within each dashboard, you can access different views that provide additional insights:
-
Scalars View: Shows the plots of scalar values over time, allowing you to compare multiple runs and metrics.
-
Graphs View: Displays the computational graph of your model, showing the connections between different layers and operations.
-
Distributions and Histograms View: Provides visualizations of tensor value distributions.
-
Images View: Lets you see actual images alongside their predicted labels or any other relevant information.
-
Audio and Text Views: These views are specific to audio and text data, respectively, and provide insights into your model's processing of such data.
-
Profile View: Offers performance analysis and helps you identify bottlenecks in your training process.
How to use TensorBoard?
Using TensorBoard involves several steps, and it's primarily used for visualizing and analyzing the training process and performance of your machine learning models. Here's a step-by-step guide on how to use TensorBoard:
-
Import Required Libraries: Before you start, make sure you have TensorFlow installed. You can import the necessary libraries:
-
Create and Compile Your Model: Create your machine learning model using TensorFlow's Keras API. Compile the model with an optimizer, loss function, and any metrics you want to track during training.
-
Configure the TensorBoard Callback: Set up the TensorBoard callback to log data during training. Specify the directory where TensorBoard should save the logs.
You can also set additional parameters like histogram_freq to log histograms of weight and bias distributions.
-
Start Training with Callback: Use the fit method to train your model and pass the TensorBoard callback to the callbacks parameter.
-
Launch TensorBoard: Open a terminal and navigate to the directory where you saved the logs. Run the following command to start TensorBoard:
This command launches TensorBoard and specifies the directory where your logs are stored. By default, TensorBoard runs on port 6006.
-
Access TensorBoard in Your Browser: Open a web browser and go to http://localhost:6006 to access the TensorBoard interface. Here, you'll see various dashboards and visualizations based on the data logged during training.
-
Explore TensorBoard: In TensorBoard, you can explore different dashboards such as Scalars, Graphs, Distributions, Histograms, Images, and more. Each dashboard provides insights into different aspects of your model's training and performance.
-
Experiment and Analyze: Use TensorBoard to compare different training runs, analyze trends, identify potential issues, and make decisions about model improvements.
-
Stop TensorBoard: Once you're done, you can stop TensorBoard by pressing Ctrl+C in the terminal where it's running.
Using TensorBoard with Keras Model.fit()
Using TensorBoard with the Model.fit() method in TensorFlow's Keras API is straightforward. TensorBoard provides a callback that you can include in the callbacks list when calling the fit() method. This callback will automatically log various metrics and information during the training process.
Here's how you can use TensorBoard with Model.fit():
In this example, we load the MNIST dataset, build a simple neural network model, compile it, and then define the TensorBoard callback with the specified log directory. When calling the fit() method, we include the tensorboard_callback in the callbacks list.
After running the training process, you can start TensorBoard in your terminal using the following command:
Once TensorBoard is running, you can access it in your web browser at http://localhost:6006. This will allow you to explore various dashboards and visualizations related to the training process of your Keras model.
Output:
This output indicates the progress of the training process for each epoch. The model's loss (cross-entropy) and accuracy metrics are shown for each epoch. Additionally, the TensorBoard callback we have defined will generate logs that can be visualized using TensorBoard, showing you more detailed information such as loss curves and histograms of activations.
Using TensorBoard with other methods
Certainly! Here's an overview of different methods you can use to integrate TensorBoard with various scenarios beyond the standard Keras Model.fit() approach:
-
Custom Training Loop:
-
Scenario: You're using a custom training loop instead of the Keras fit() method.
-
Method: Within your training loop, use tf.summary.scalar() to log metrics such as loss and accuracy. Use a FileWriter to create a log directory for TensorBoard.
-
Benefits: Allows flexibility in designing your training loop and is applicable to models not using the Keras API.
-
-
Non-Keras Models:
- Scenario: You're working with models that are not built using the Keras API.
- Method: Similar to a custom training loop, manually log metrics using tf.summary.scalar() within your training logic. Use a FileWriter to organize log files.
- Benefits: Provides a way to visualize and monitor non-Keras models' training progress using TensorBoard.
-
Custom Metrics and Visualizations:
- Scenario: You want to track custom metrics or visualizations during training.
- Method: Besides scalars, you can log other types of data like histograms, images, audio clips, and more using relevant tf.summary functions.
- Benefits: Allows you to gain deeper insights into your model's behavior and performance by visualizing custom data.
-
TensorBoard Profiling:
- Scenario: You want to profile the performance of your model for optimization.
- Method: Use TensorFlow's Profiler API to record and visualize performance information. This can help identify bottlenecks and areas for improvement.
- Benefits: Enables performance analysis and optimization to make your model training more efficient.
-
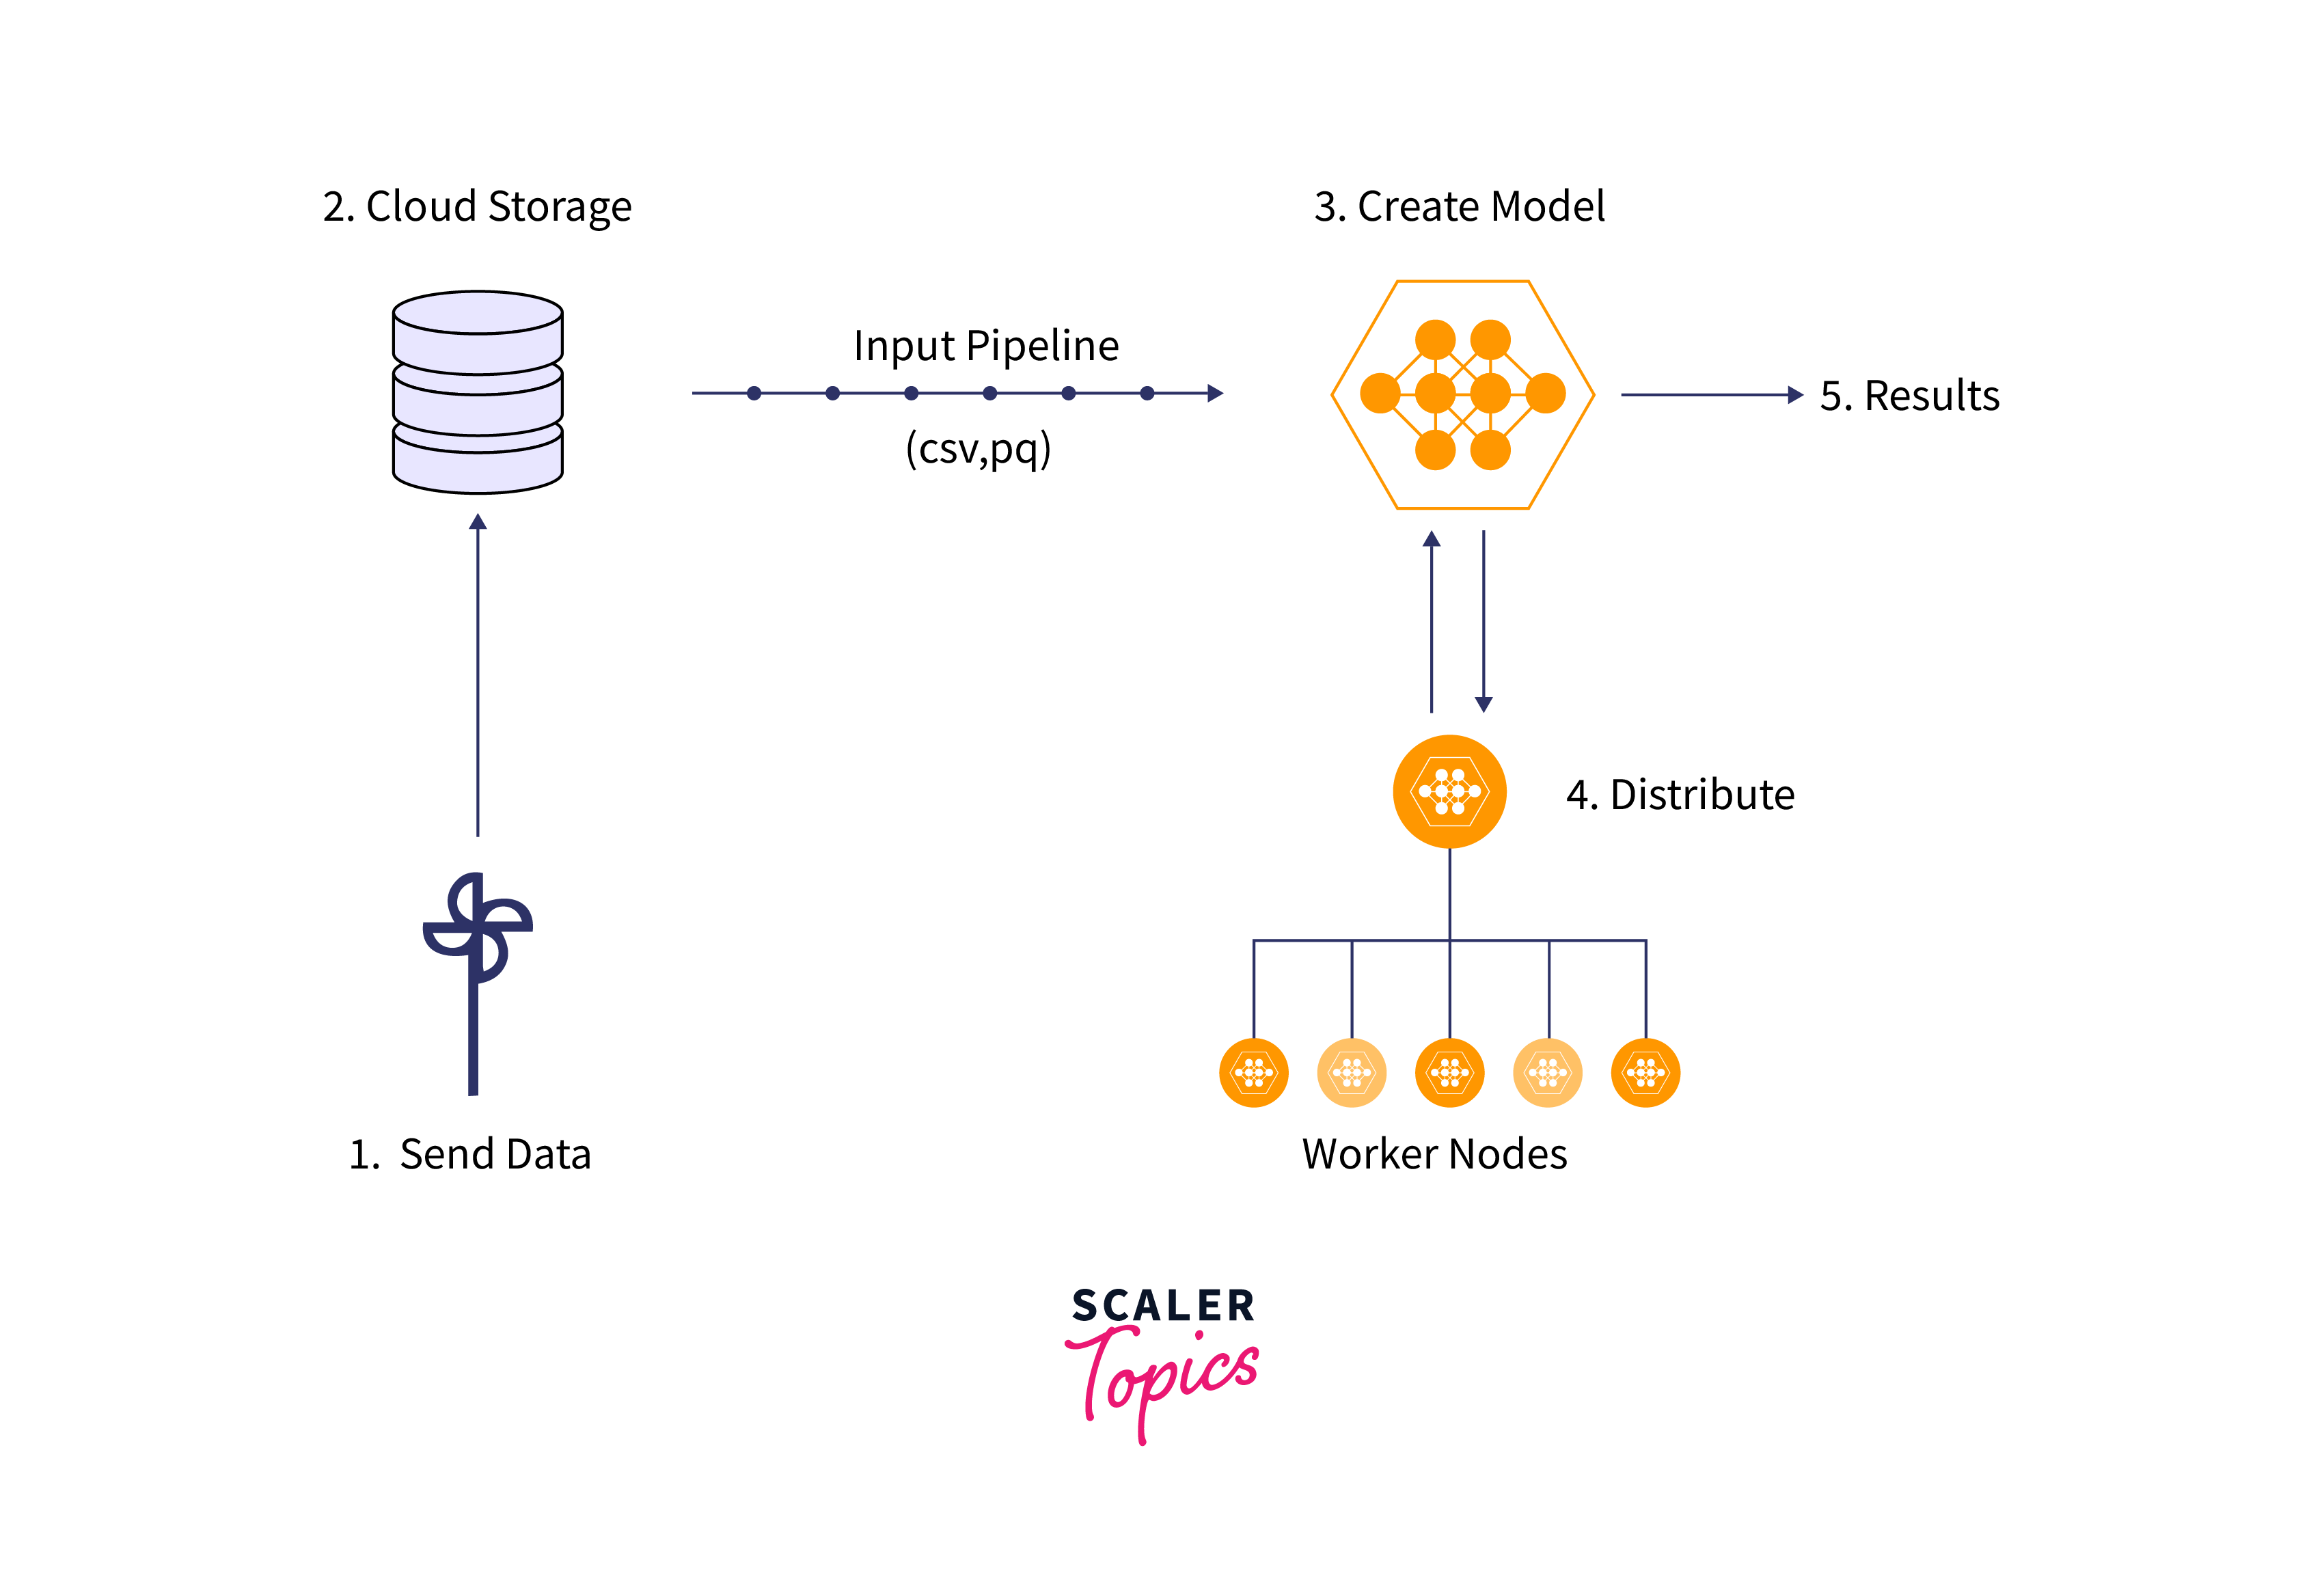
Distributed Training:
-
Scenario: You're training your model using distributed computing across multiple devices or machines.
-
Method: Use the tf.distribute.experimental.CentralStorageStrategy or other strategies in combination with the TensorBoard callback to monitor and visualize distributed training.
-
Benefits: Provides insights into the distributed training process and model behavior across devices.
-
-
Transfer Learning and Fine-Tuning:
- Scenario: You're applying transfer learning or fine-tuning a pre-trained model.
- Method: Utilize TensorBoard to compare the performance of your model before and after fine-tuning, monitoring metrics and visualizations.
- Benefits: Helps assess the impact of transfer learning and fine-tuning on your model's training process.
-
Hyperparameter Tuning:
-
Scenario: You're performing hyperparameter tuning to optimize your model's performance.
-
Method: Log hyperparameters along with metrics in your training loop using tf.summary.text(). Compare different runs in TensorBoard.
-
Benefits: Aids in evaluating the effect of different hyperparameters on your model's training and performance.
-
Remember that these methods provide versatility in using TensorBoard to monitor and improve various aspects of your model training process. Adapt the approach that best fits your specific use case and model implementation.
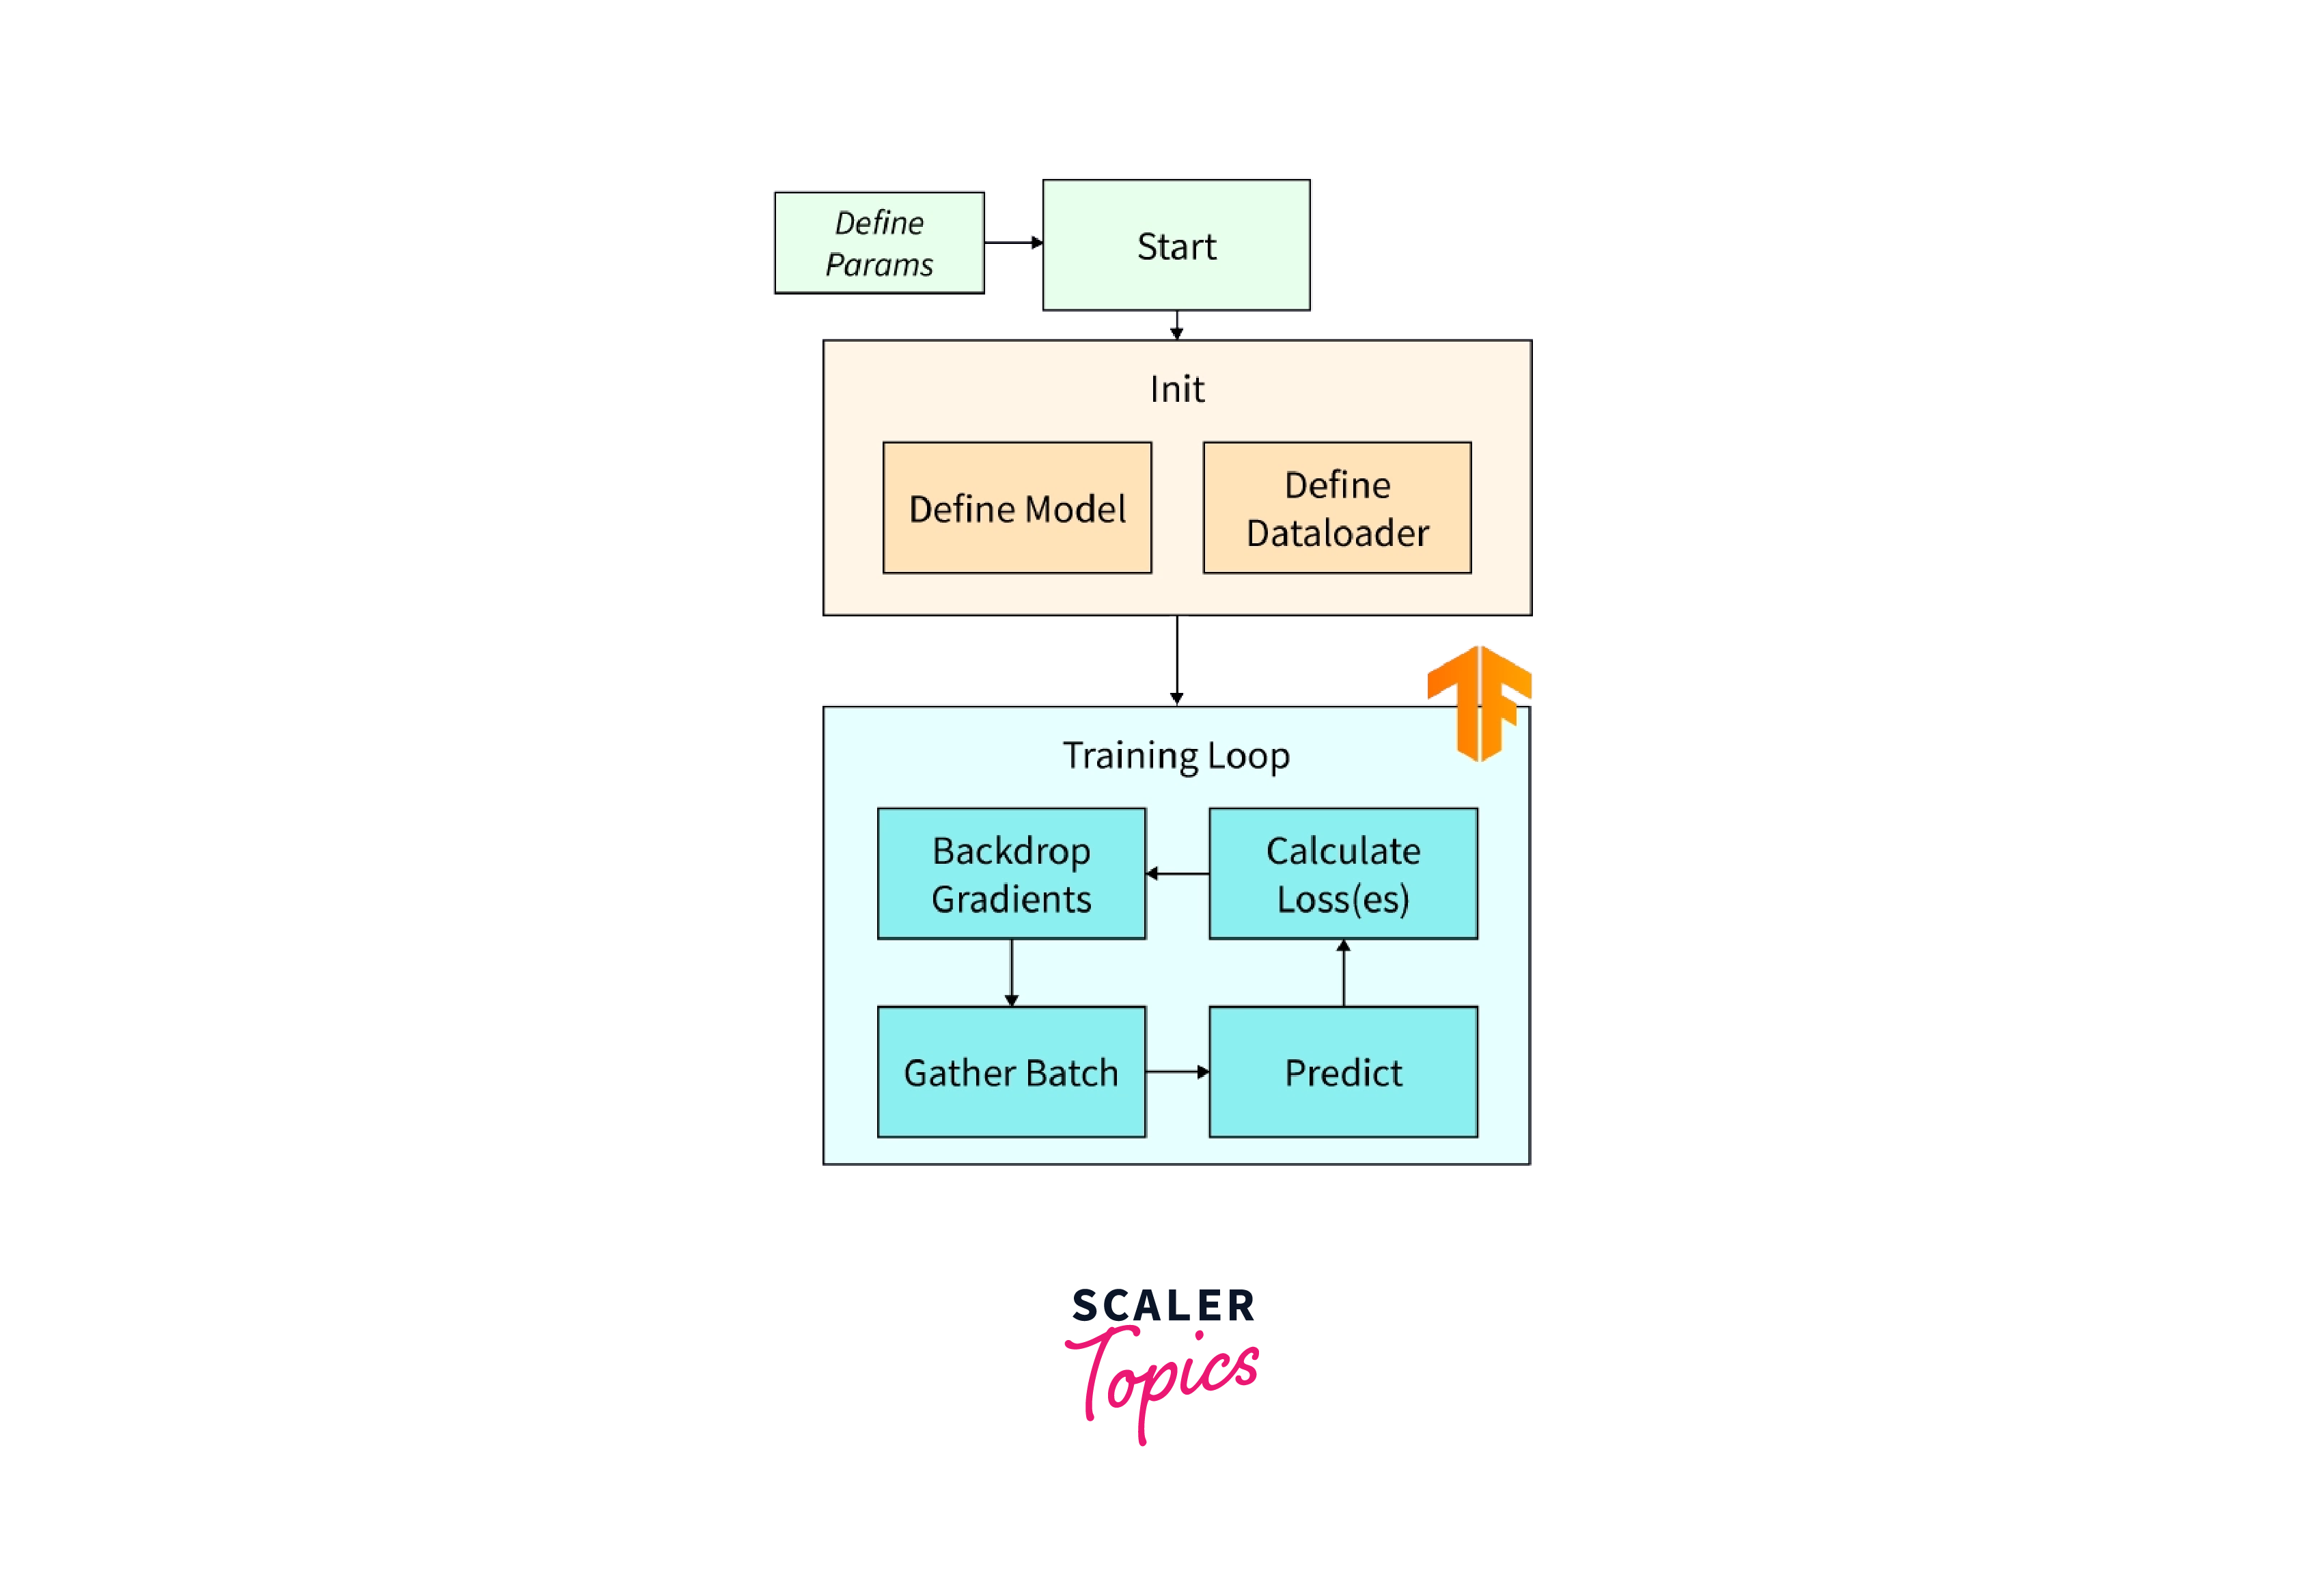
Example: Using TensorBoard with Custom Training Loop
This example demonstrates how to integrate TensorBoard with a custom training loop. It assumes you have a simple model architecture and want to log metrics during training.
Output:
This simulated output represents the training process for a few epochs and steps. In a real training scenario, the loss values would vary as the model is updated through backpropagation. The code logs the loss values after each step to the specified directory using TensorFlow's tf.summary.scalar()
Example: Using TensorBoard with Non-Keras Model
In this example, we illustrate using TensorBoard with a non-Keras model. This is a common scenario when you're working with custom model implementations and training loops.
Output:
In both examples, we emphasize the use of tf.summary.scalar within the training loop to log metrics. The FileWriter allows you to create log files that TensorBoard can read and visualize. This approach enables you to integrate TensorBoard with a variety of model implementations beyond the Keras API.
Applications of TensorBoard
TensorBoard, as a visualization and monitoring tool, finds application in various aspects of machine learning and deep learning model development and training. Some of its key applications include:
-
Model Monitoring and Debugging: TensorBoard helps in tracking and visualizing metrics like loss, accuracy, and other custom metrics during training. It aids in identifying issues such as overfitting, vanishing gradients, and exploding gradients.
-
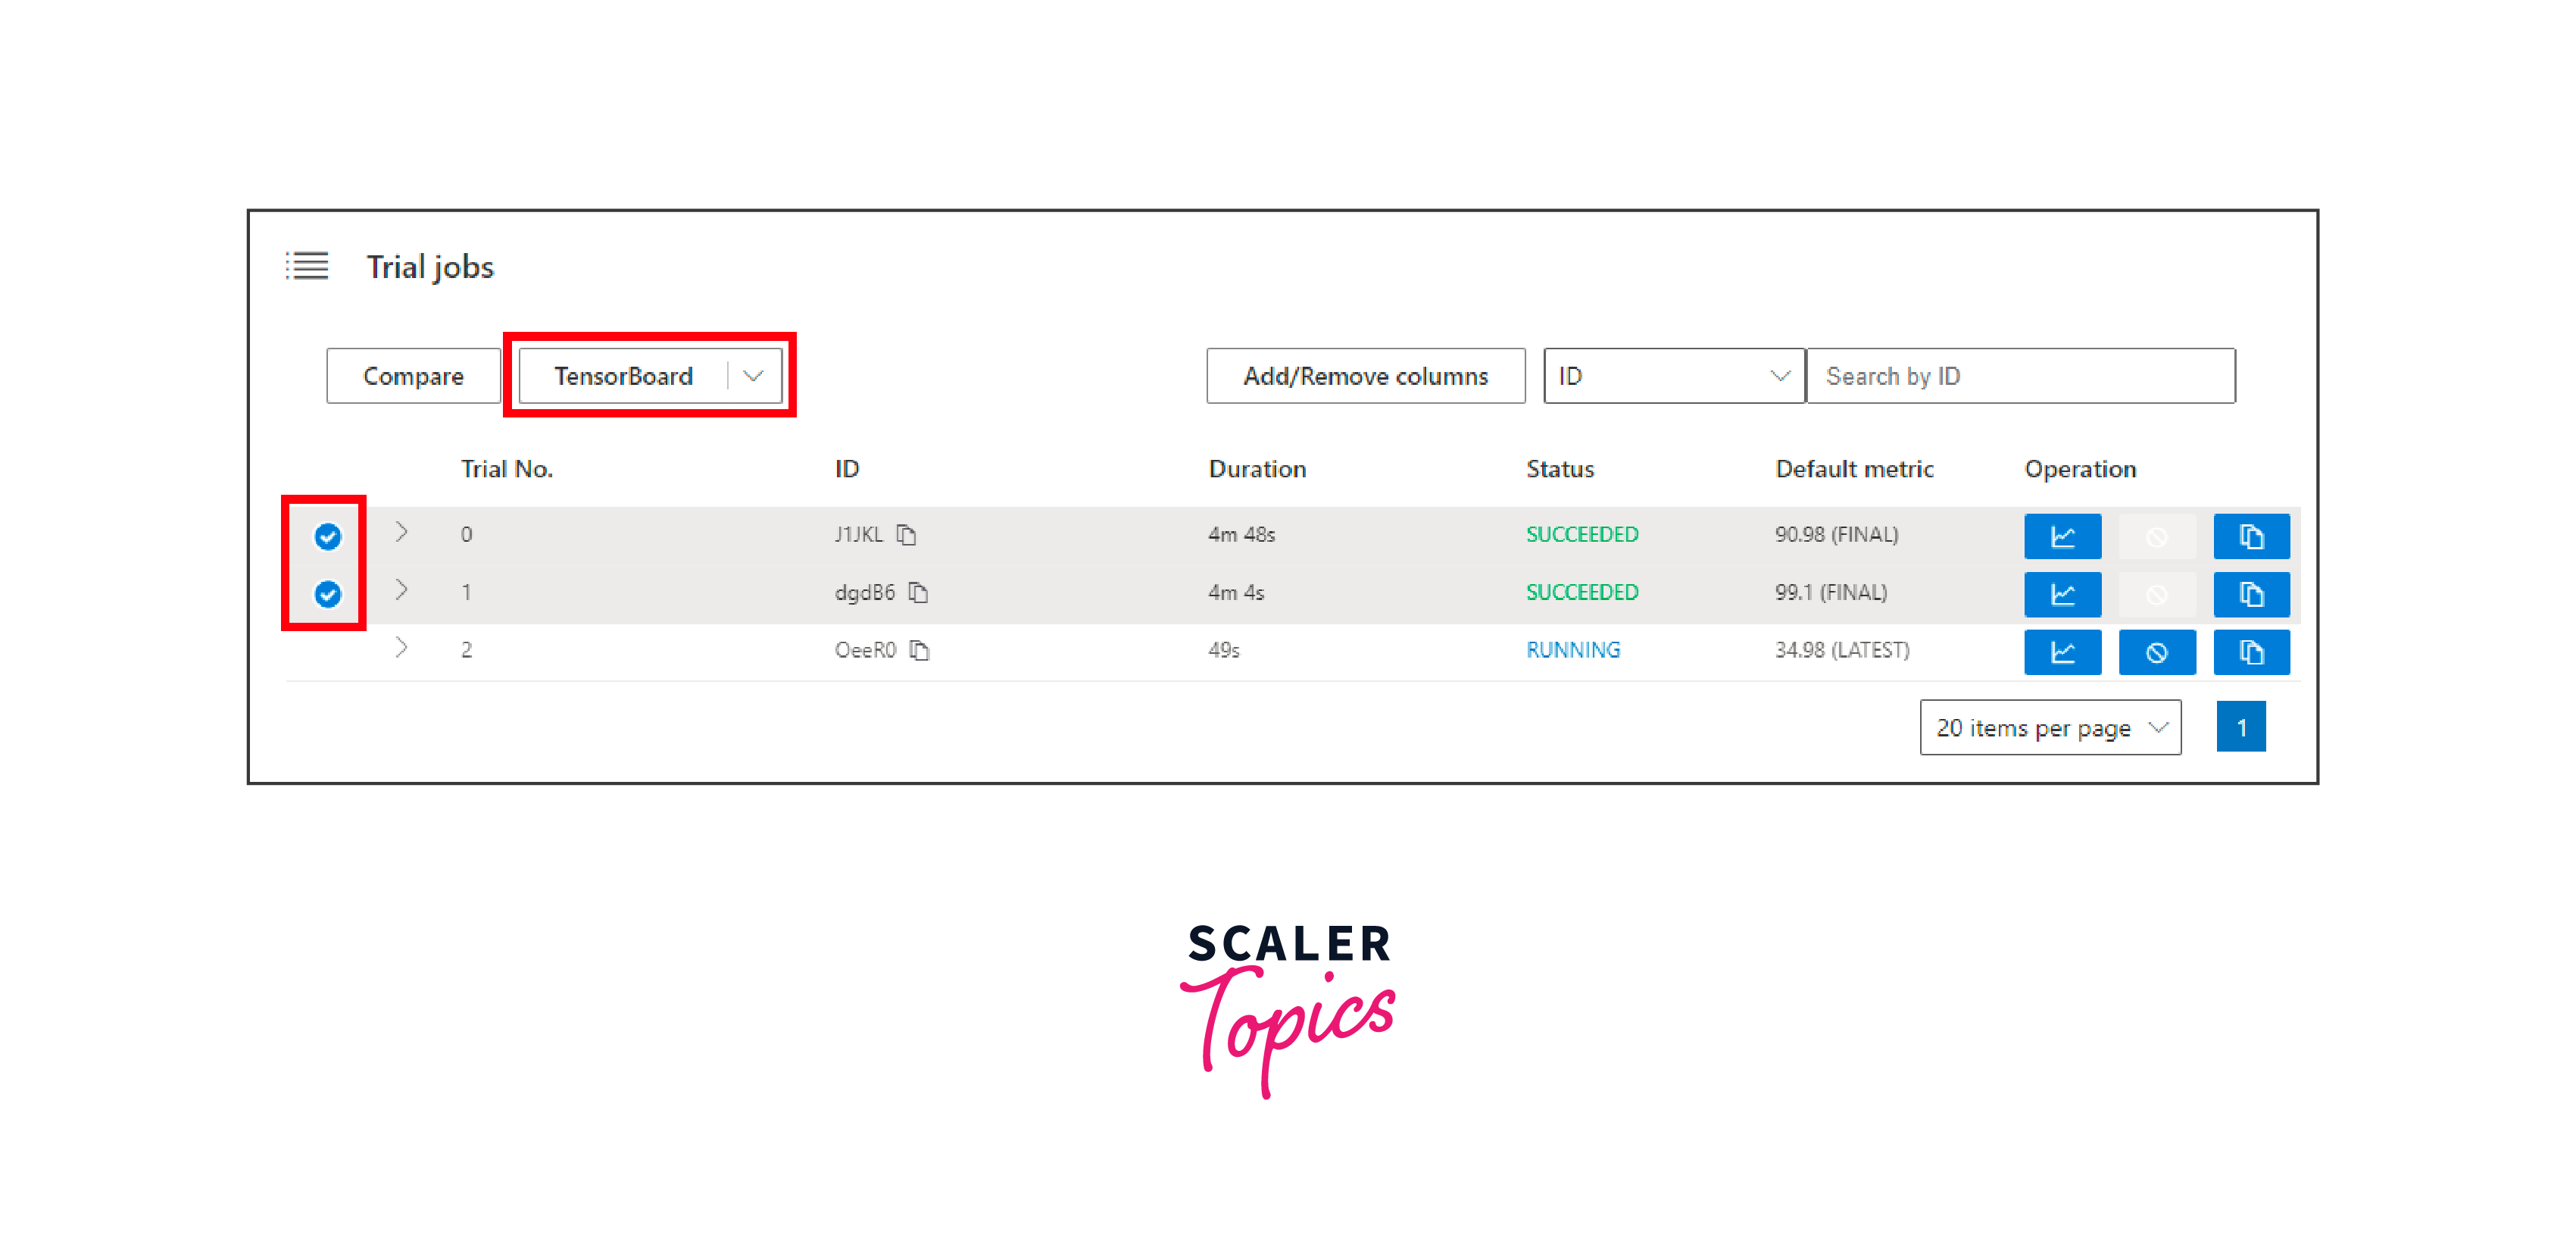
Hyperparameter Tuning: During hyperparameter tuning, TensorBoard enables you to compare different runs with varying hyperparameters, helping you identify the best configuration for your model.
-
Visualization of Model Architecture: The Graphs dashboard provides a visual representation of your model's architecture, assisting in understanding the flow of data and identifying potential problems.
-
Weight and Activation Visualizations: TensorBoard's Distributions and Histograms dashboards allow you to visualize the distributions of weights, biases, and activations, which can reveal insights into convergence and potential issues.
-
Fine-Tuning and Transfer Learning: When performing fine-tuning or transfer learning, TensorBoard can help you track how the pretrained model adapts to the new data, allowing you to monitor and compare the training progress.
-
Performance Profiling: TensorBoard's profiling features assist in optimizing model performance by highlighting computational bottlenecks and memory usage patterns.
-
Distributed Training Monitoring: When training models on distributed systems, TensorBoard aids in tracking the progress of each device or machine, helping ensure uniform convergence.
-
Custom Metric Visualization: You can visualize custom metrics, embeddings, and even images in TensorBoard, making it versatile for a wide range of model types.
Conclusion
- TensorBoard is a powerful visualization and monitoring tool that assists in tracking and understanding the training process of machine learning models.
- It offers a range of dashboards, including Scalars, Graphs, Distributions, Histograms, Images, and more, catering to different aspects of model analysis and optimization.
- TensorBoard aids in debugging by visualizing metrics, weight distributions, and activations. It's also valuable for hyperparameter tuning, identifying overfitting, and optimizing model performance.
- TensorBoard can be applied to various scenarios, including Keras models, custom training loops, transfer learning, distributed training, and more. Its flexibility and versatility make it a valuable tool for researchers and practitioners.