Types of Data Analysis
Data analysis uses different methods to extract insights from complex information. Descriptive analysis summarizes key aspects and reveals data trends, while diagnostic analysis identifies underlying causes. Predictive analysis estimates future trends with statistical models, and prescriptive analysis recommends optimal actions. Exploratory analysis fosters dynamic discovery and pattern detection. These methods help navigate information complexities, providing valuable insights for informed decision-making and enhancing our understanding of the data world.
What is Data Analysis?
Before learning about types of data analysis, let use learn what is data analysis.
In the broad world of technology, data analysis is a driving force, enabling individuals and organizations to glean useful insights from the sea of information that surrounds them. At its heart, data analysis is the art and science of evaluating, cleansing, converting, and modelling data to extract meaningful information, make conclusions, and aid decision-making.
Consider your favourite recipe; each component plays an important function in the finished product. Similarly, data analysis entails a thorough review of datasets, which are the building blocks for informed decision-making. These datasets can take numerous forms, ranging from spreadsheets and databases to more complicated formats such as JSON or XML files.
One of the most important components of data analysis is the process of cleaning and processing data. Analysts clean and improve datasets to guarantee correctness and relevance, just as a professional chef would prepare ingredients before cooking. This process entails removing missing or incorrect data items and turning raw data into an analysis-ready format. The thorough attention to detail throughout this stage provides the groundwork for dependable and insightful findings.
Syntax highlighting in data analysis is similar to the artistic arranging of food on a dish. It entails assigning colour-coded visual signals to various code parts to assist analysts in identifying and comprehending the data's structure. This helps uncover errors, enhances code readability, and ultimately enhances the efficiency of the analysis process.
One of the most significant aspects of data analysis is the cleansing and processing of data. Analysts clean and refine databases to ensure their accuracy and usefulness, just as a skilled chef would prepare ingredients before cooking. This procedure comprises eliminating missing or inaccurate data items and converting raw data to an analysis-ready format. The meticulous attention to detail during this step lays the framework for reliable and informative results.
Why is Data Analysis Important?
Before learning about the types of data analysis, let us first learn about the importance of data analysis.
Understanding the importance of data analysis becomes critical in the digital age, as data is created at an unprecedented rate.
Understanding the Complex
Data analysis is the compass that directs decision-makers through the maze of information. It entails reviewing, cleaning, manipulating, and modelling data to extract usable information, develop conclusions, and aid decision-making. Consider it a decoding tool for the language of data, making it more accessible and understandable.
Informed Decision-Making
Fundamentally, data analysis enables organisations and people to make educated decisions. Whether you're a corporate executive planning for the future or a researcher looking for revolutionary discoveries, the ability to filter through large databases and extract important information is crucial. More is needed; you also need to be able to derive useful insights from it.
Focus on Opportunities
In the corporate world, data analysis is important for making a well-versed digits-oriented decision that otherwise may go unnoticed. Businesses that examine consumer behaviour, market trends, and operational efficiency can find areas for improvement, reinvent their goods or services, and remain ahead of the competition. It's not only about reacting to the present; it's also about preparing for and building the future.
Mitigating Risks
Data analysis protects against uncertainty by detecting possible dangers. The capacity to foresee and reduce risks is a game changer in many industries, including financial markets, healthcare, and cybersecurity. Analyzing historical data enables the detection of trends that may indicate imminent concerns, allowing preventative steps to be implemented.
Improving Efficiency
In any field, efficiency is essential to success. Data analysis improves operations by detecting bottlenecks, optimizing procedures, and increasing overall efficiency. It is about accomplishing more with less, a philosophy that applies across sectors.
Personal Empowerment
Individually, knowing the relevance of data analysis is analogous to having personal navigation through a vast set of information. Whether you're managing personal money, following health goals, or making educated decisions, the ability to analyze data provides a sense of control and empowerment.
What is the Data Analysis Process?
Before moving our focus to types of data analysis, let us see the overview of the process of data analysis.
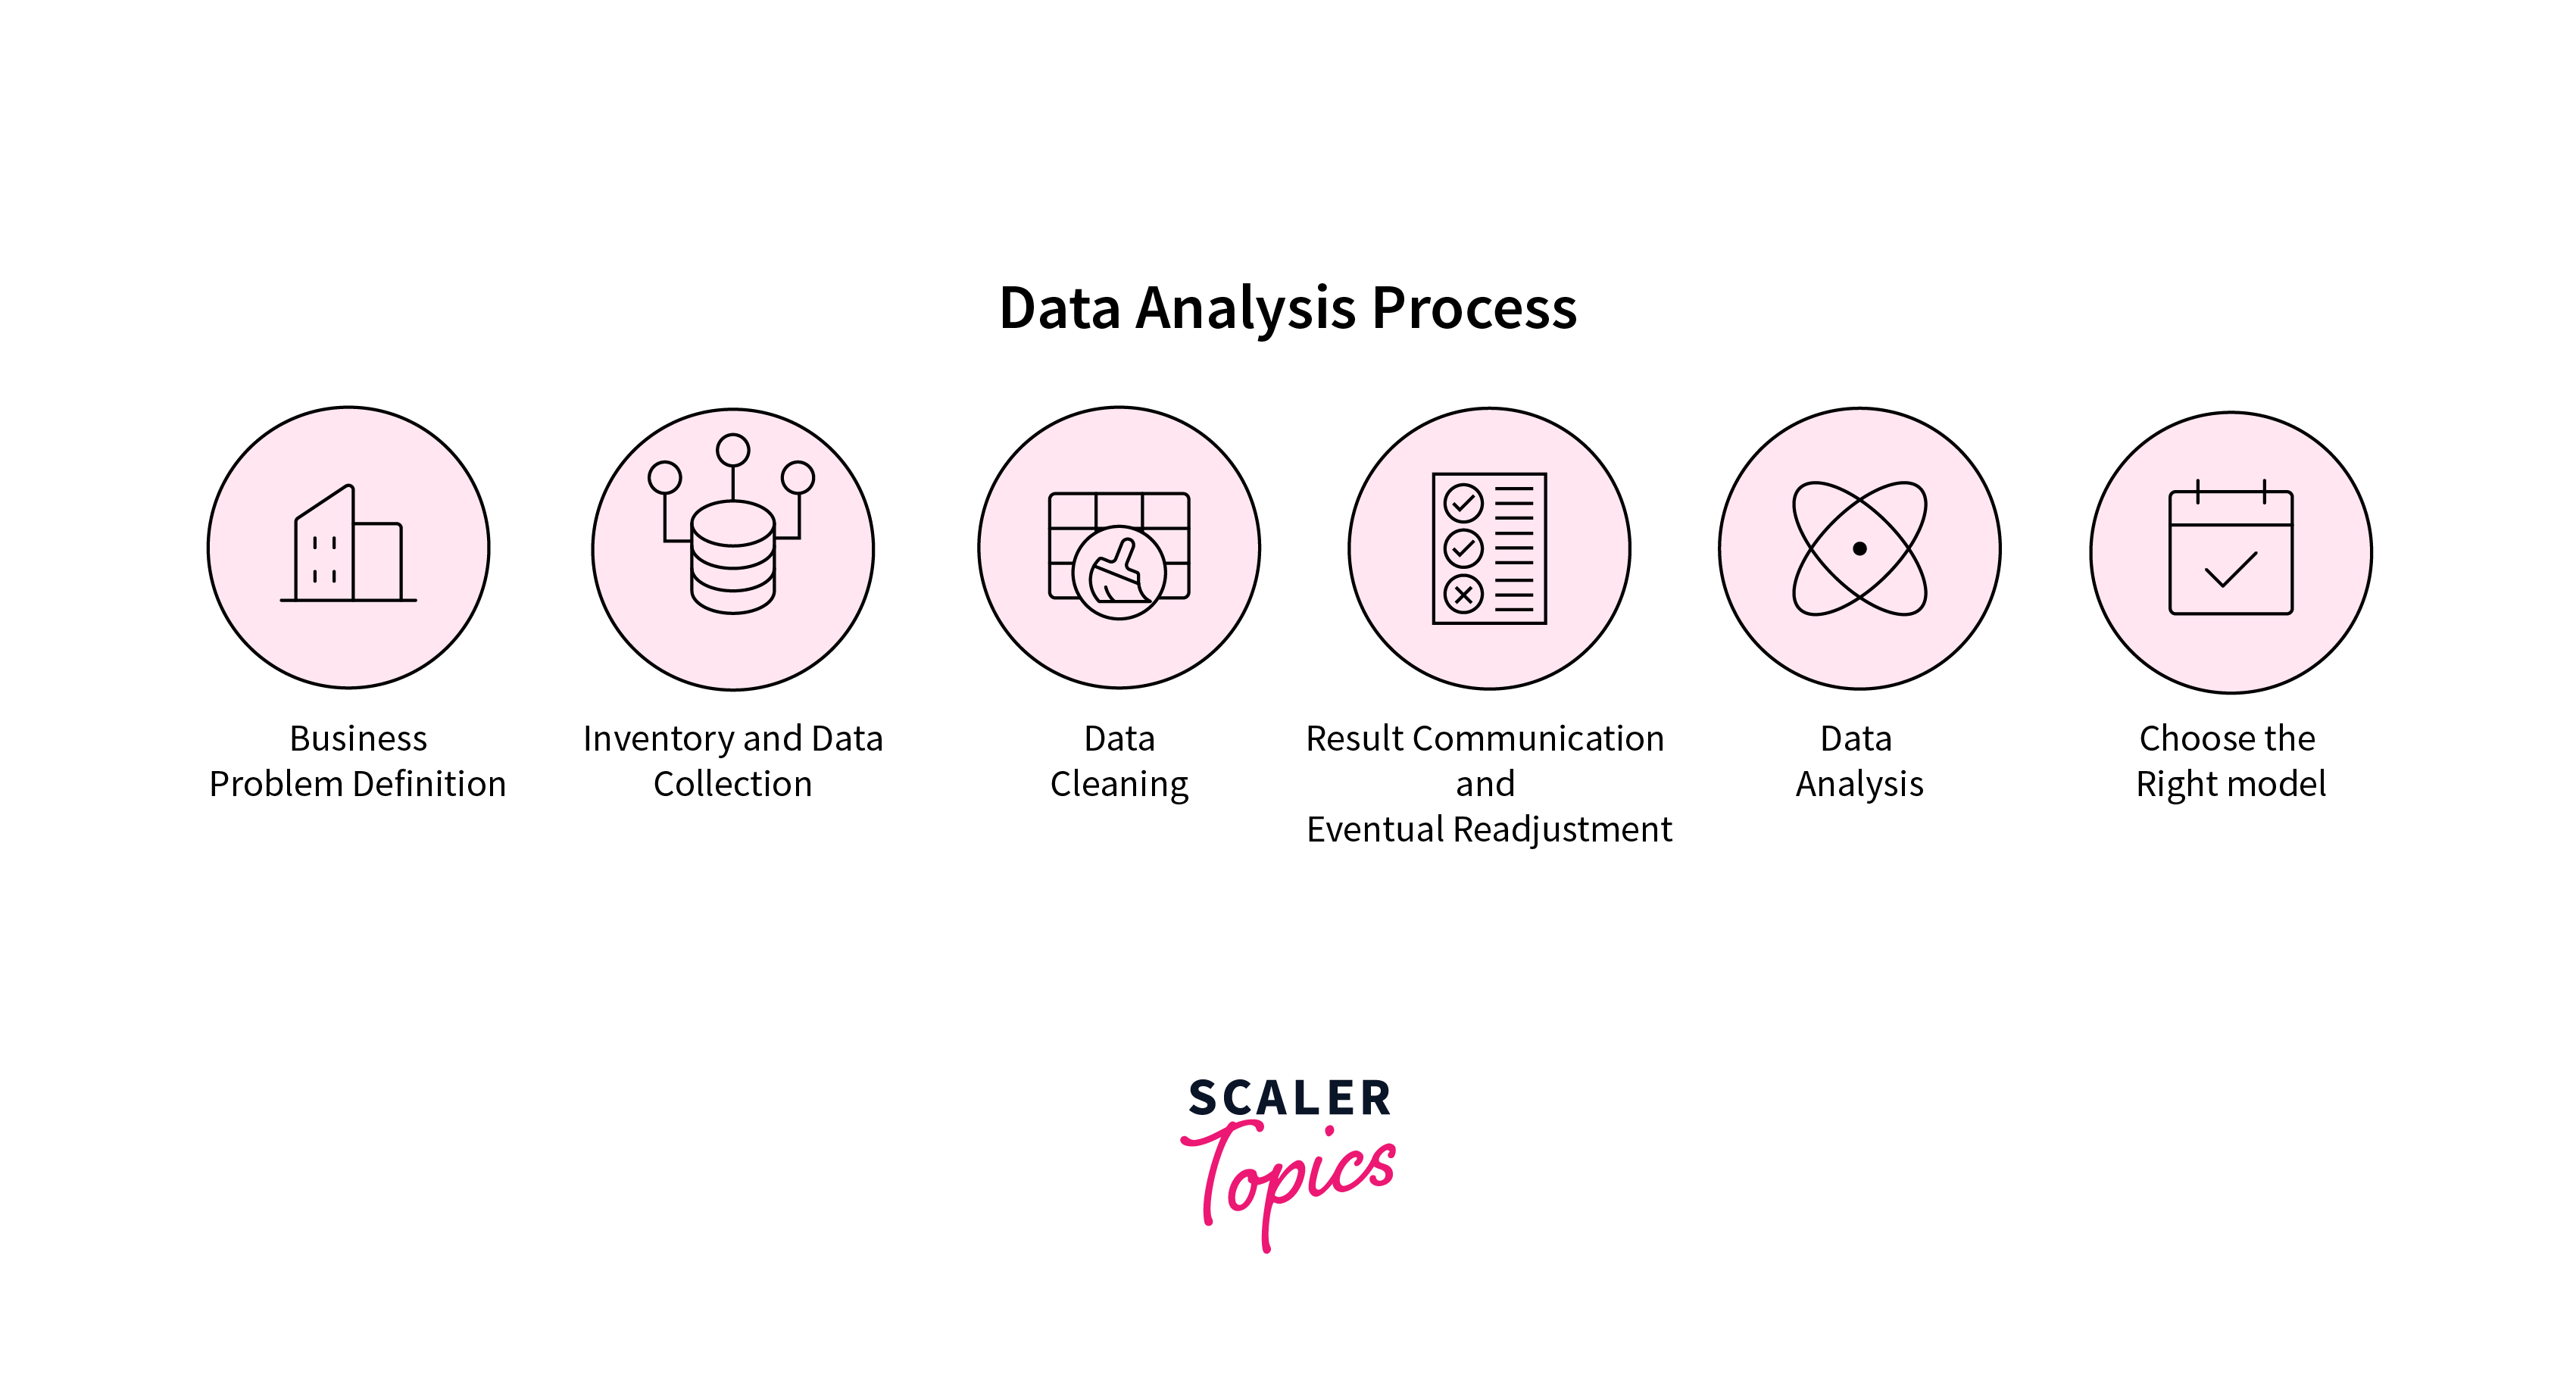
In the constantly evolving technology, data has emerged as the foundation of informed decision-making. The data analysis process is an organized path that converts raw data into meaningful insights, allowing organizations to make strategic decisions. Let us go into the complexities of this procedure, breaking it down into six key phases.
Data Requirement Gathering
At the outset, determining what data is required lays the groundwork for the entire study. This step entails comprehending the objectives, establishing important queries, and specifying the particular data parameters needed to answer them.
Data Collection
Once the criteria are visible, it's time to collect the relevant information. This might entail pulling data from many databases, APIs, or even human input. During this step, accuracy and comprehensiveness are critical to ensuring that the analysis is based on reliable facts.
Data Cleaning
Imperfections such as missing numbers, outliers, and inconsistencies are common in raw data. Data cleansing is a thorough method for addressing these concerns. Consider it like polishing a gem: by eliminating imperfections, we ensure that the ensuing analysis is based on dependable and correct data.
Data Analysis
The next step is to analyze the data. This entails using statistical or computational approaches to identify patterns, trends, and correlations in the data. Advanced algorithms and procedures come into play to extract meaningful insights that might not be apparent at first glance.
Data Interpretation
Analysis is only half the process that is required to be done; the true value comes from interpreting the data. This stage entails turning complicated discoveries into practical insights. It necessitates a detailed grasp of both the data and the larger environment in which it functions.
Data Visualisation
Data visualization tools can help make these findings more accessible to a larger audience. Charts, graphs, and dashboards convert raw data into visually appealing representations, making it simpler for stakeholders to understand and apply the results.
8 Data Analysis Methods
Let's discover the power of eight essential types of data analysis that empower workers across all sectors.
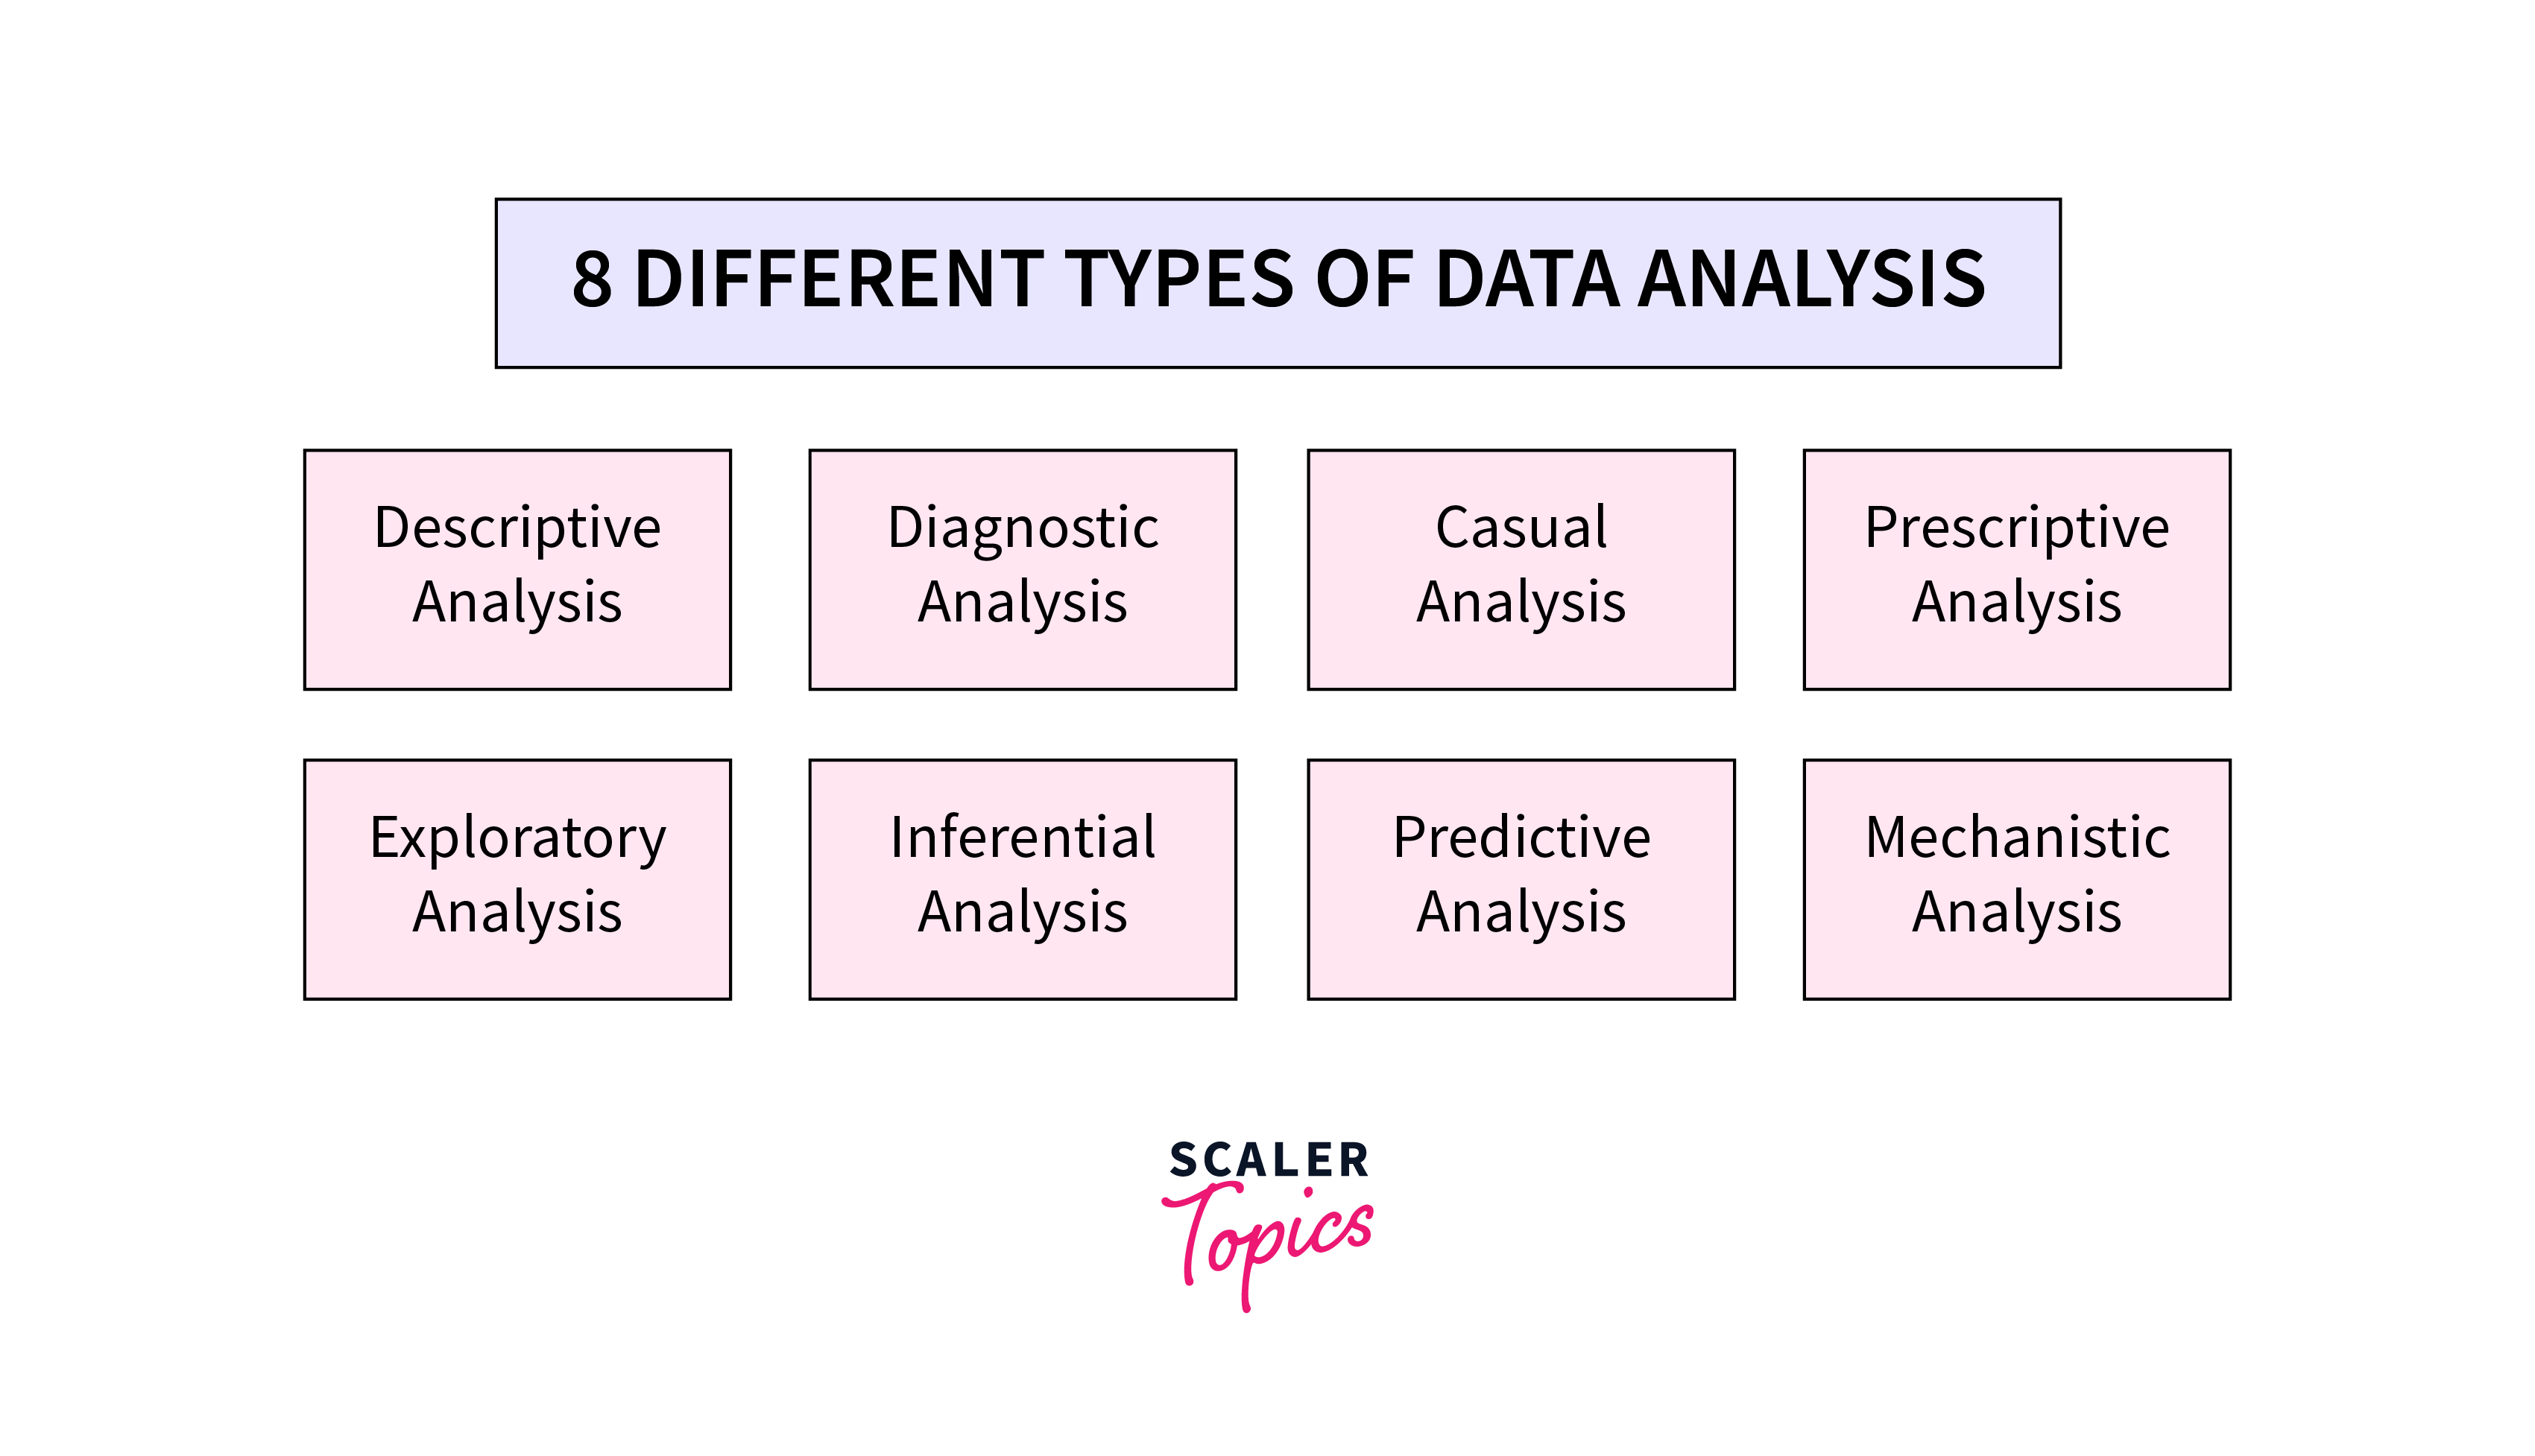
Descriptive Analysis
Descriptive analysis sets the basis by summarising and presenting raw data understandably. It condenses complicated data into a concise picture, giving an overview of trends, patterns, and core tendencies. Consider making a vibrant artwork of your data landscape.
Inferential Analysis
Building based on descriptive analysis, inferential analysis advances into generating predictions and drawing conclusions about a population using a sample. It's similar to forecasting the outcome of an election through careful analysis of the selected group of voters.
Exploratory Data Analysis (EDA)
EDA is the Sherlock Holmes of data analysis, looking for links, patterns, and outliers. It entails visualising data using charts and graphs to discover hidden gems that would go overlooked. EDA is the investigative work that comes before further in-depth examination.
Diagnostic Analysis
When things go wrong, diagnostic analysis is called in to determine the underlying source of the problem. It is a medical assessment of data that diagnoses problems and paves the road for successful treatments. Consider it the world's troubleshooter for data.
Predictive Analysis
Predictive analysis wears the hat of a fortune teller, predicting future patterns based on past data. This strategy uses statistical algorithms and machine learning models to predict outcomes, giving it a strategic advantage in decision-making.
Prescriptive Analysis
Prescriptive analysis goes beyond prediction by recommending the appropriate course of action in addition to forecasting outcomes. It's like having a knowledgeable tutor directing you down the most effective road forward in the face of uncertainty.
Causal Analysis
Causal analysis looks into the cause-and-effect correlations to better understand the elements that influence certain results. It is up to the investigator to figure out why something happened and untangle the deep web of links in the data universe.
Mechanical Analysis
Mechanistic analysis looks beyond causality to uncover the fundamental mechanics that drive observed occurrences. It's like dissecting a sophisticated machine to see how each cog and gear contributes to its operation. This approach reveals the internal workings of complex systems.
Top Data Analysis Techniques to Analyze Data
After covering the types of data analysis, let us look at the various techniques to analyze data.
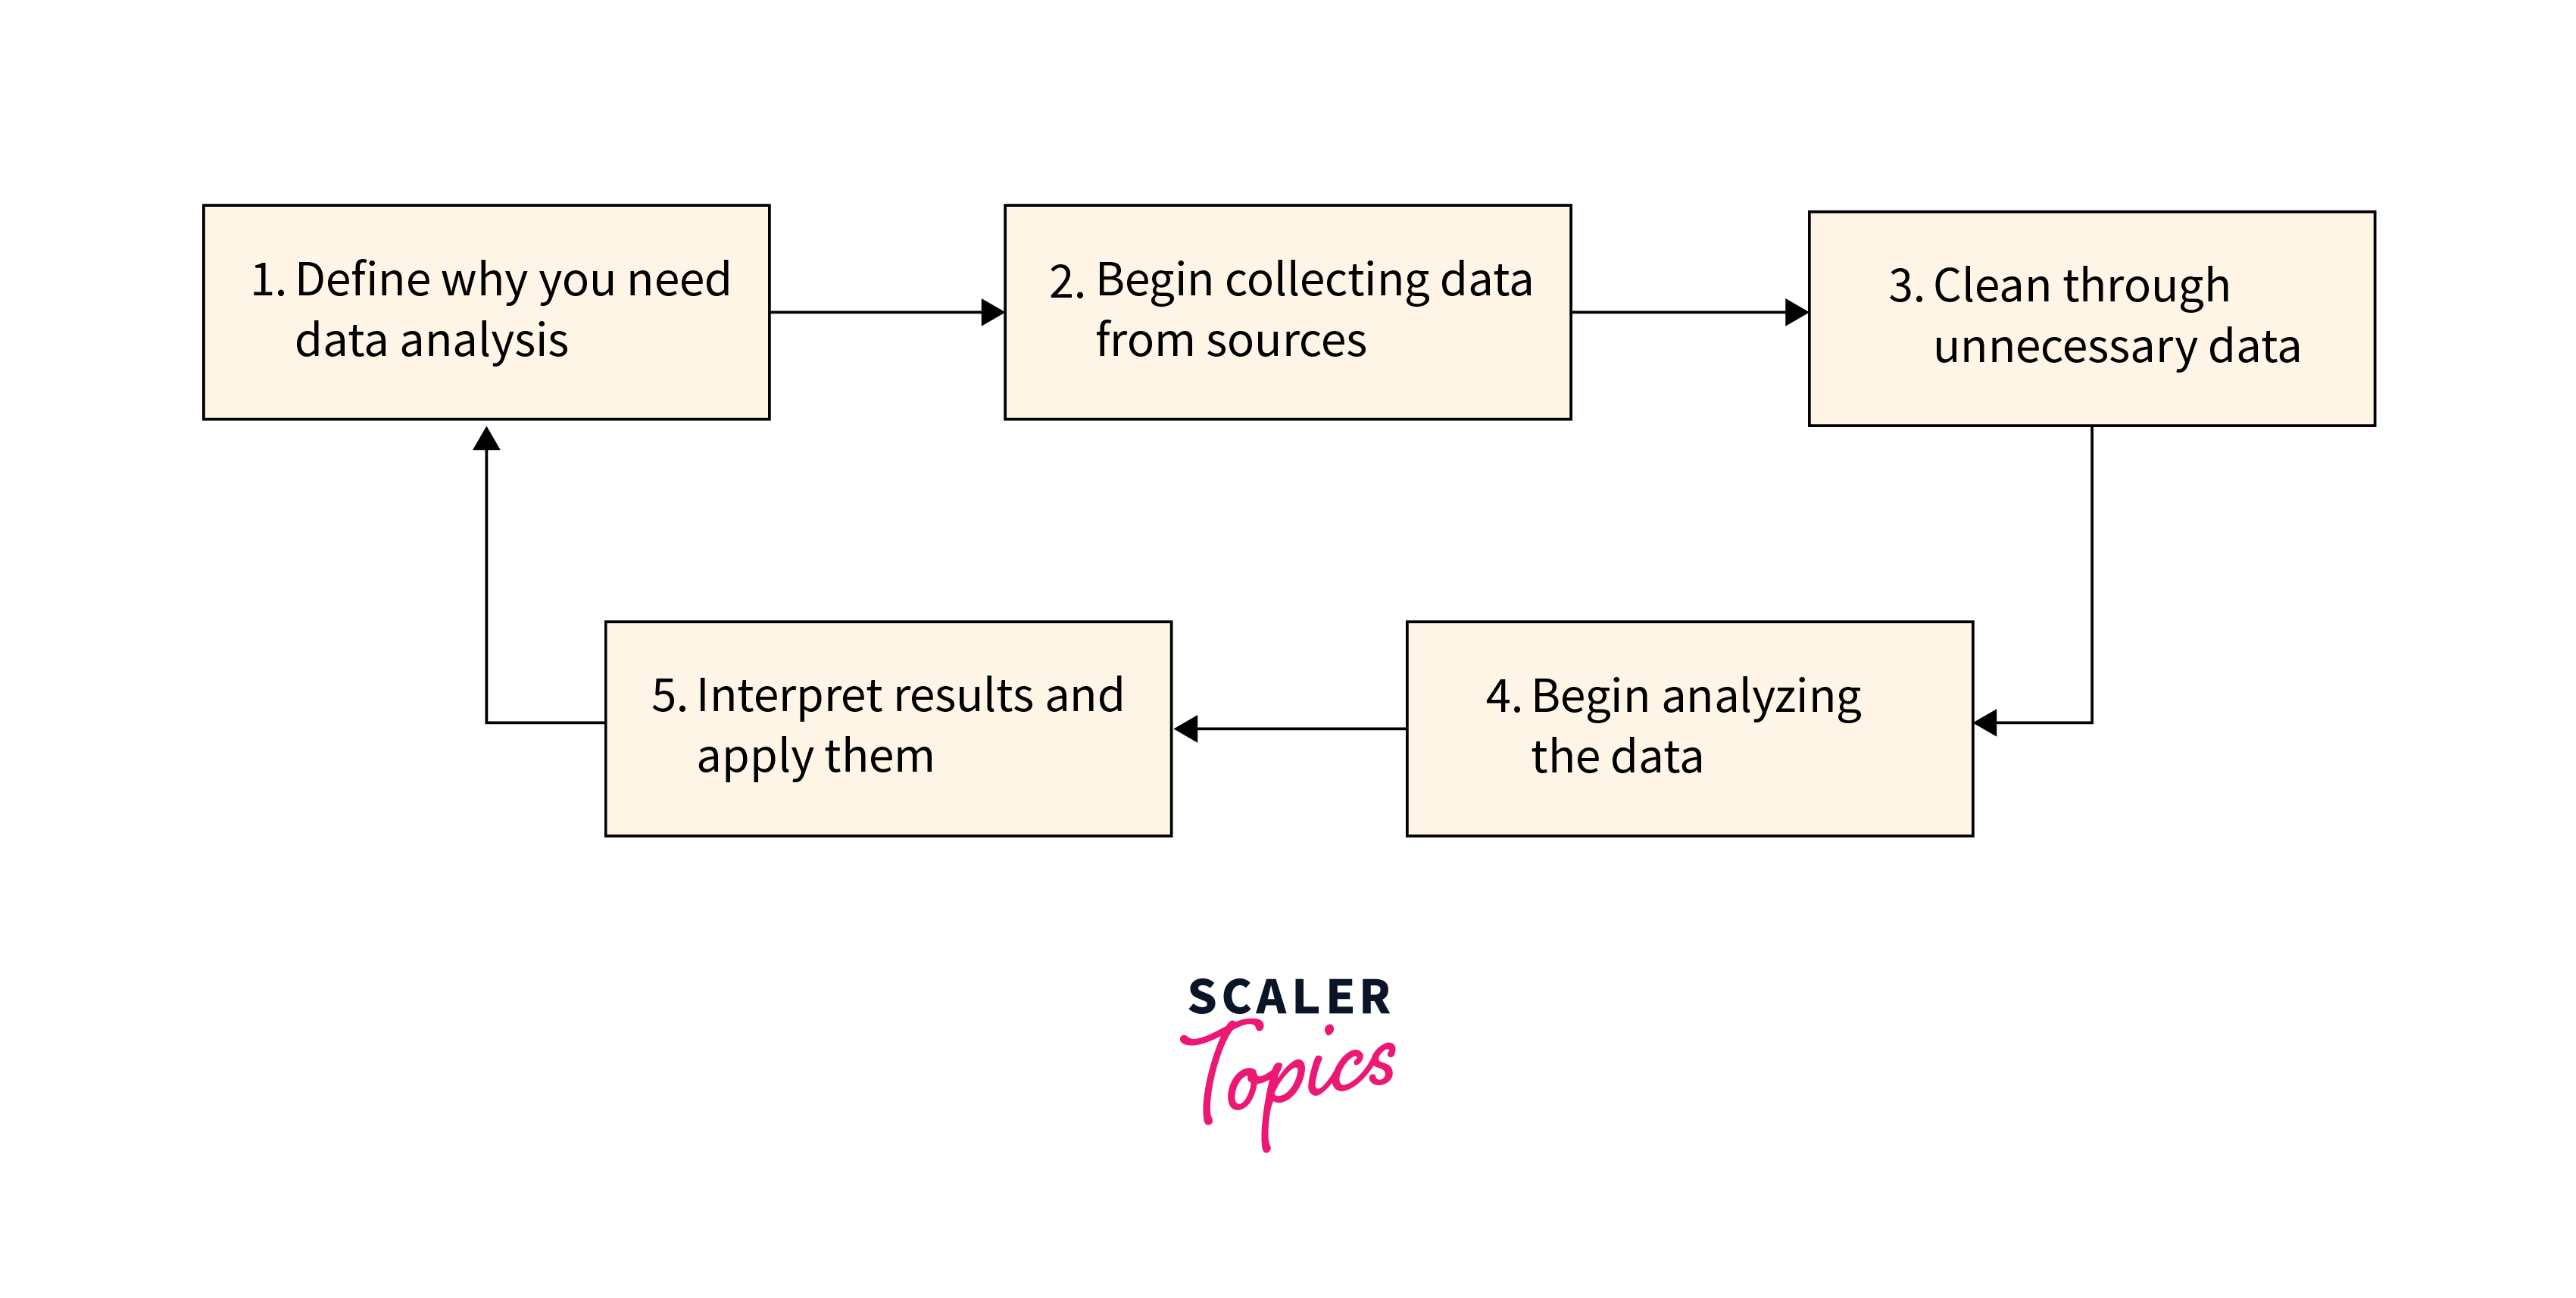
Define your objectives.
Begin your data analysis journey with a clear plan. Define your objectives ahead of time to help guide your investigation. Knowing what you want to achieve not only simplifies the process but also guarantees that your efforts are in line with larger aims.
Data Cleaning
Before you start working with your data, make sure it's clean. Data cleaning, also known as data cleansing, is the process of discovering and correcting mistakes and inconsistencies in your dataset. It's a necessary preface to robust analysis, preventing skewed results and ensuring the reliability of your findings.
Descriptive Statistics
Numbers tell tales and descriptive statistics provide the narrative. This approach includes summarising and displaying essential properties of a dataset to provide a picture of its characteristics. Mean, median, mode and standard deviation become your trusted partners in comprehending the substance of your data.
Data Visualisation.
Data visualisation is an art form that transforms raw numbers into visual masterpieces, adding clarity to complexity. Charts, graphs, and dashboards not only make data more accessible, but they can reveal underlying patterns that traditional analytical approaches may overlook.
Exploratory Data Analysis (EDA)
Exploratory Data Analysis (EDA) allows you to look deeper. This approach includes peeling back the layers of your dataset to reveal correlations, outliers, and patterns. EDA gives the background required to formulate the appropriate questions and develop your analytical approach.
Inferential Statistics
Make educated jumps from your sample to the overall population using inferential statistics. This approach involves making inferences about a population based on a representative sample. In this statistical trip, confidence intervals and hypothesis testing will serve as your guiding lights.
Machine Learning Algorithms
Utilize the power of algorithms to train your system to learn. Machine learning techniques, such as decision trees and neural networks, enable your analysis to adapt and change, allowing you to make predictions and discover patterns that traditional approaches cannot.
Clustering and segmentation
Clustering and segmentation help to classify and group comparable elements. These tools help to identify trends in your data, allowing you to customize strategies and behaviours to cater to certain groups.
Time Series Analysis
Time series analysis allows you to navigate your data's temporal aspects. Uncover trends, cycles, and anomalies over time, providing valuable insights for predictive modelling and future planning.
Text Mining and NLP
Text mining and Natural Language Processing (NLP) can reveal the abundance of information hidden in textual data. These approaches allow you to extract meaning from unstructured data, which opens the door to sentiment analysis, topic modelling, and other applications.
What is the Importance of Data Analysis in Research?
Data analysis is extremely important in research. It acts as a compass, directing researchers through the immense sea of information, finding hidden patterns and valuable insights. Consider it detective work, solving riddles hidden in the data haystack.
Data analysis is essential for translating raw data into usable knowledge. It enables researchers to make educated judgements, discover patterns, and reach valid findings. Consider this: without data analysis, study findings would be dispersed like pieces of a jigsaw puzzle, missing the cohesiveness required to form a whole image.
Furthermore, data analysis improves the reliability of study findings. It serves as a quality control step, ensuring that the acquired data is not simply a random collection of numbers, but rather a well-organized and accurate picture of reality. This rigorous inspection adds rigour to the study process, increasing the reliability of the outcomes.
In today's data-driven world, when information is abundant but insights are few and far between, the ability to extract meaning from data distinguishes academics. It enables individuals to traverse the complexity of their area, promoting innovation and advancement. In essence, data analysis is the unsung hero who converts data into knowledge, paving the way for ground-breaking discoveries and improvements in all areas of study.
Data Analysis In The Big Data Environment
In Big Data, where information is in huge amounts, Data Analysis emerges as a directing tool, assisting organizations in making sense of the digital deluge. At the heart of this revolutionary process is the seamless interaction of technology and human cognition, which results in a synergy that reveals significant discoveries.
Data analysis in the Big Data context is similar to traversing a complicated maze, with various datasets serving as puzzle pieces that must be assembled. In this context, the capacity to identify patterns, trends, and outliers becomes a strategic advantage. The process entails using advanced analytical tools, machine learning algorithms, and statistical models to extract meaning from the massive quantities that comprise the Big Data ecosystem.
Syntax highlighting in the data analysis editor is the unsung hero that improves the experience of data scientists and analysts. This feature, editor.copyWithSyntaxHighlighting, improves code readability by colouring distinct parts, making it simpler to identify variables, functions, and keywords. This little detail dramatically simplifies the analytical procedure, increasing productivity and accuracy.
As organisations use the potential of Big Data, data analysis becomes the cornerstone of informed decision-making. It is the art and science of translating raw data into usable insights, hence enabling innovation and strategic growth. In the dynamic world of Big Data, where every bit and byte counts, competent data analysis is the compass that directs businesses to success.
FAQs
Q. What is meant by data analysis?
A. Data analysis is the systematic process of reviewing, cleaning, manipulating, and modelling data to extract relevant insights, make conclusions, and assist decision-making. It entails applying numerous approaches and tools to identify patterns, trends, and correlations in datasets.
Q. What is the purpose of data analysis?
A. The basic goal of data analysis is to extract useful information from raw data and provide organisations with actionable insights. Businesses may acquire a competitive advantage in their industry by identifying underlying patterns and trends.
Q. What are the analytical tools used in data analytics?
A. Data analytics uses a wide range of tools, from classic ones like Microsoft Excel to modern platforms such as Python and R, as well as specialised applications like Tableau and Power BI. These technologies help with data cleaning, visualisation, and statistical analysis, allowing analysts to reach relevant conclusions.
Q. What is the career progression in data analytics?
A. The discipline of data analytics provides a promising career path, with a steady need for competent people. There are several prospects for data scientists and business analysts alike. Continuous learning and being current with the newest technology are critical to success in this dynamic and ever-changing sector.
Q. How is data analysis transforming industries?
A. Data analytics is transforming industries by improving decision-making processes. From healthcare to banking, organisations are using data to improve operations, personalise consumer experiences, and acquire a better knowledge of market trends.
Q. Is SQL useful for data analysis?
A. SQL (Structured Query Language) is an effective tool for data analysis. It is frequently used for accessing and administering relational databases, making it a necessary skill for analysts dealing with structured data.
Q. What is Data Analysis in Excel?
A. Using Excel's built-in features and functions to analyse and visualise data. Excel is a versatile tool for novices and experts, including features such as pivot tables and statistical analysis.
Q. What is data analysis in Python?
A. Python has evolved as a popular programming language for data analysis due to its rich libraries, which include Pandas and NumPy. Analysts use Python to handle, analyse, and visualise data, making it a flexible tool in the field.
Conclusion
- Descriptive analysis sets the groundwork by summarising and presenting raw data understandably. This method reveals patterns and trends, offering a clear overview of the data's features.
- When abnormalities or unexpected patterns appear, diagnostic analysis is called in. It goes beyond reporting what occurred and investigates why it happened, assisting organisations in identifying the core causes of certain patterns or situations.
- Predictive analysis uses previous data to estimate future patterns and results. Organisations obtain the foresight they need to make proactive decisions and develop strategic plans by utilising advanced statistical models and machine learning algorithms.
- Prescriptive analysis goes one step further, advocating steps to optimise results rather than just forecasting future events. This form of analysis provides decision-makers with actionable insights, directing them through the most effective actions to attain the intended results.
- Prescriptive analysis is built on the concept of continuous improvement. Organisations that regularly analyse and refine plans based on continuing data analysis may adapt to changing conditions, remain ahead of the curve, and assure long-term success.