Applications of Excel in Data Analytics
Overview
Microsoft(ms) Excel is a spreadsheet software application that allows users to analyze, organize and manipulate data using a grid of cells arranged in rows and columns.
Data analytics examines and interprets data to extract insights, identify patterns, and make informed decisions. Data analytics aims to uncover meaningful insights that can be used to improve business performance, optimize processes, and drive innovation.
There are a plethora of uses of ms excel in data analytics. We will discuss them in detail in this article.
Introduction
Data analysis involves using various techniques to extract meaningful insights and draw conclusions from a data set. Microsoft Excel is a popular software tool for organizing, analyzing, and visualizing data. It offers a range of functions and features that allow users to perform various data analysis tasks such as filtering, sorting, and creating charts and graphs. Excel is widely used in businesses and research organizations for data analysis because of its accessibility, versatility, and ease of use.
Top Applications of MS Excel
Data Entry and Storage
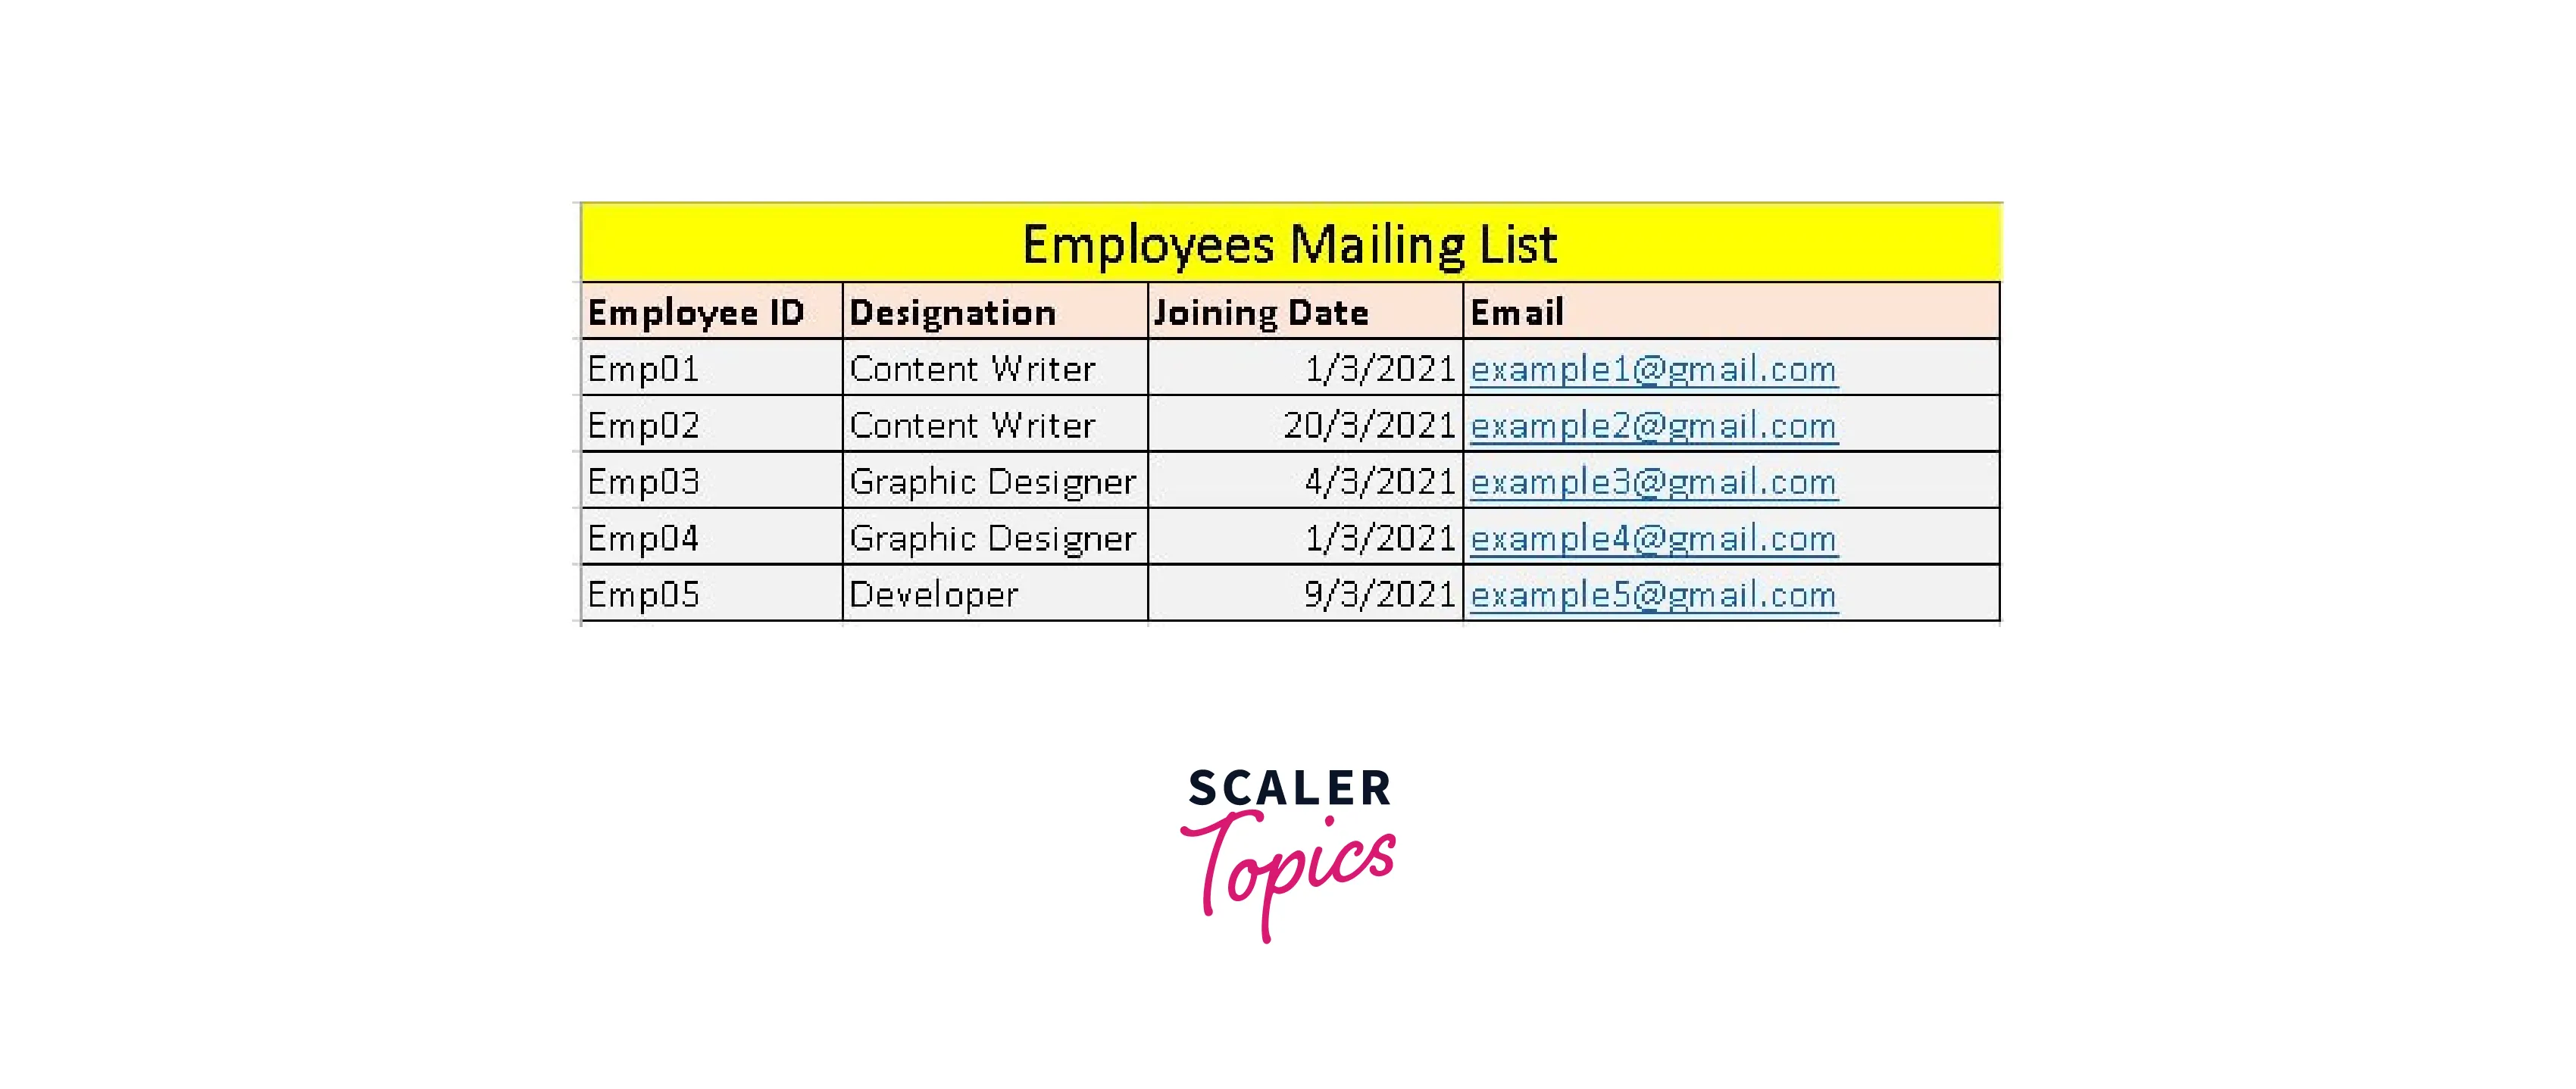
MS Excel is a powerful tool for data entry and storage. It is important to organize data in columns and rows, use proper formatting and naming conventions, and use features such as data validation to ensure accuracy. Generally, excel worksheets can have 1,048,576 rows and 16,384 columns in a table form. Once the table is created, we can perform various tasks and analyses on it using multiple tools and formulae.
Performing Calculations
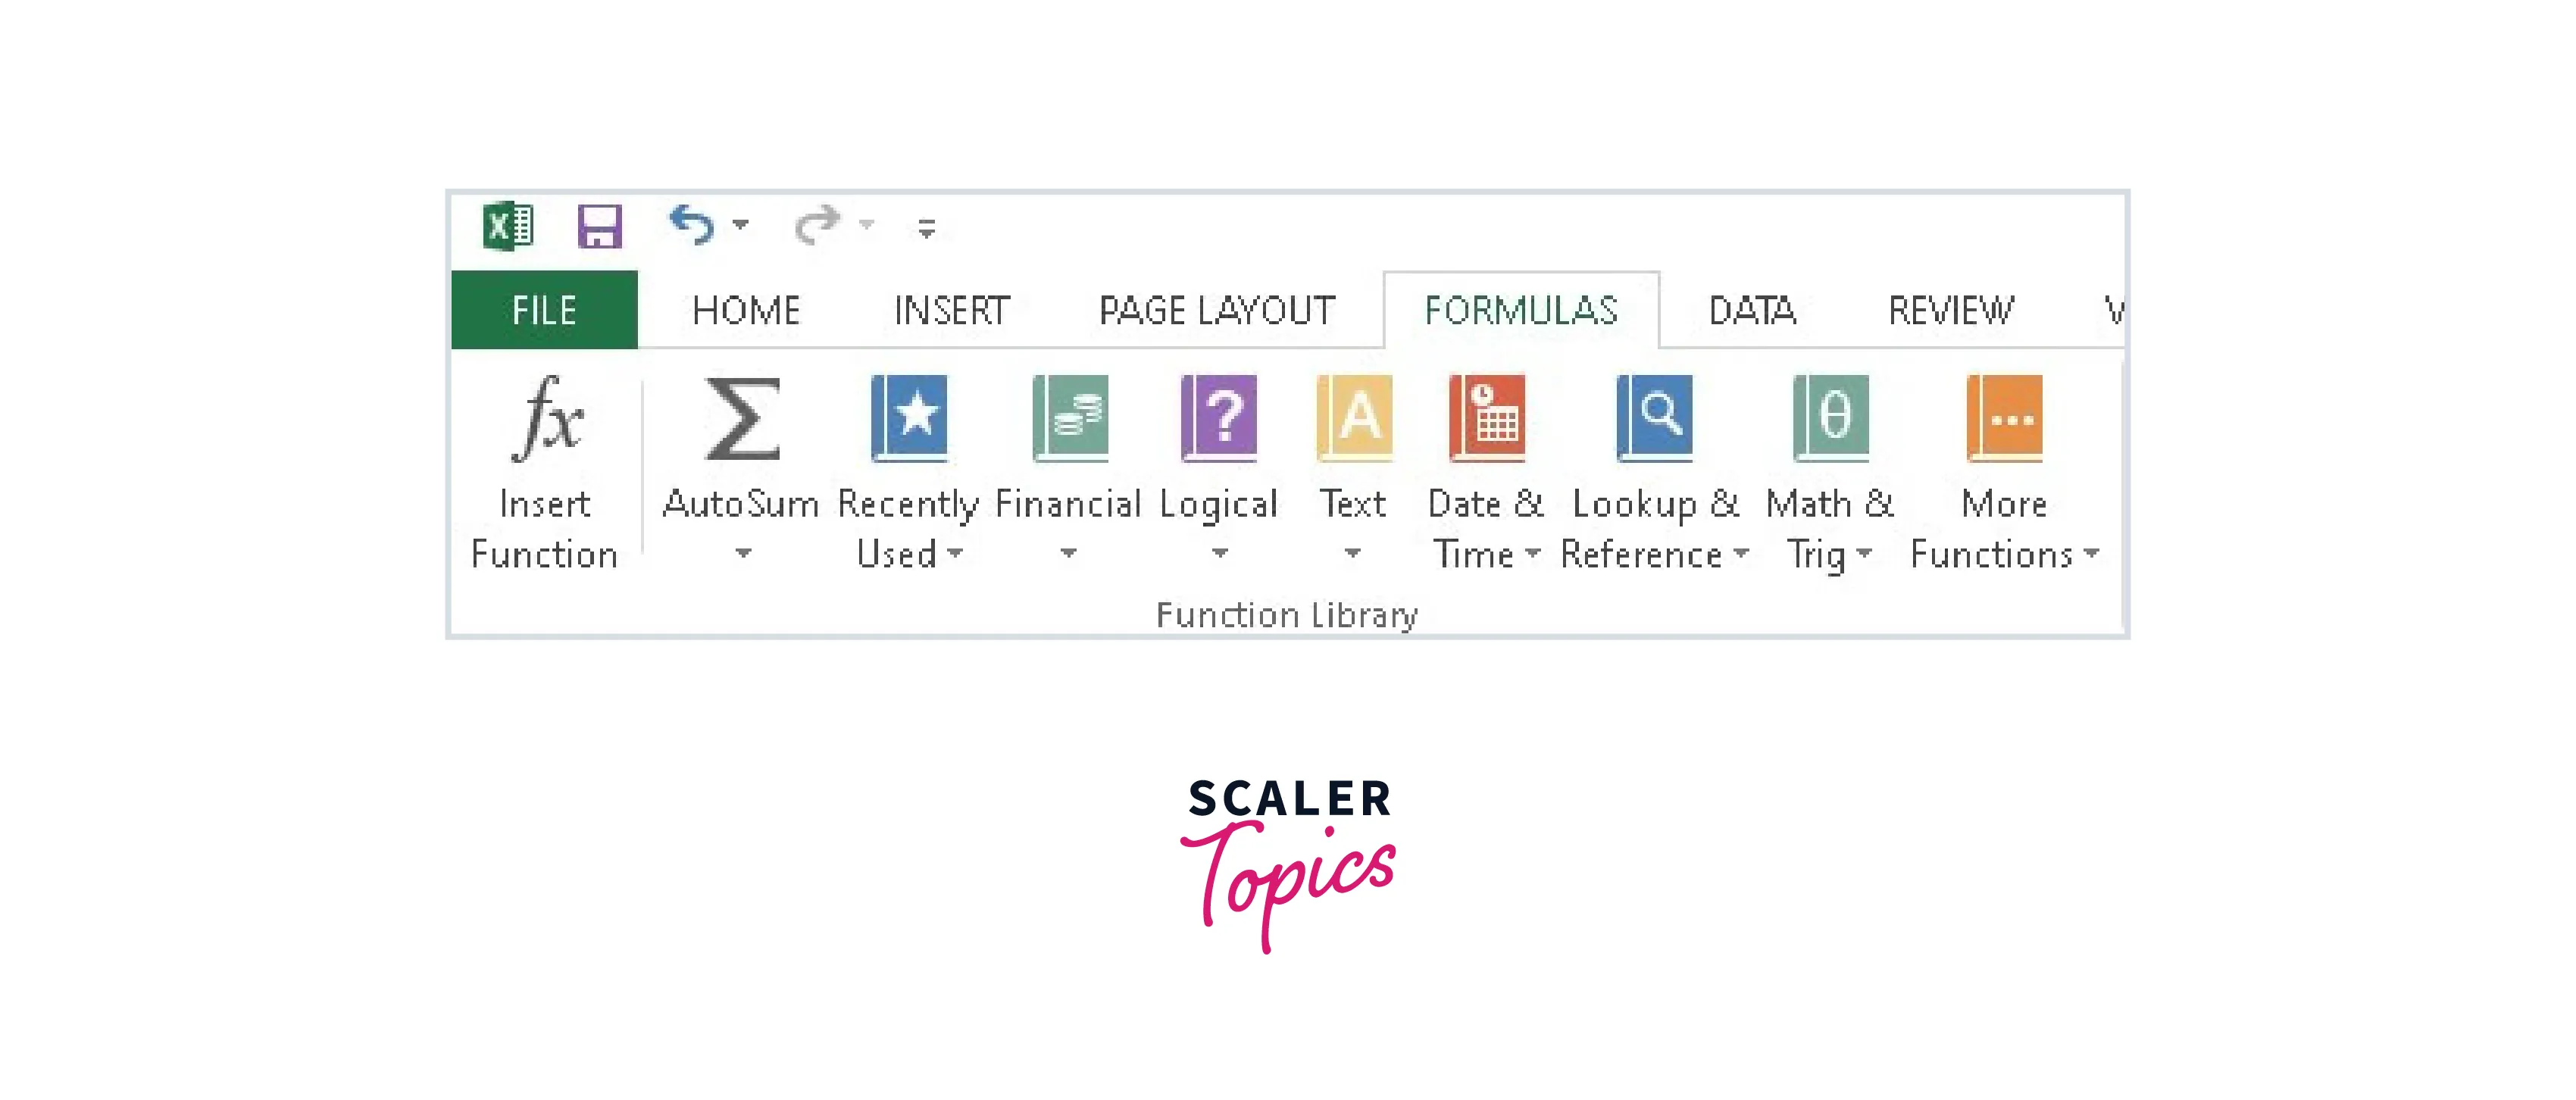
MS Excel is a powerful tool for performing calculations. To perform calculations, enter the formula in a cell using appropriate mathematical operators such as +, -, *, /, ^ for exponentiation. It is important to use proper cell references and check for formula errors. Excel also has built-in functions that can be used for more complex calculations, such as SUM, AVERAGE, COUNT, MAX, and MIN.
Data Analysis and Interpretation
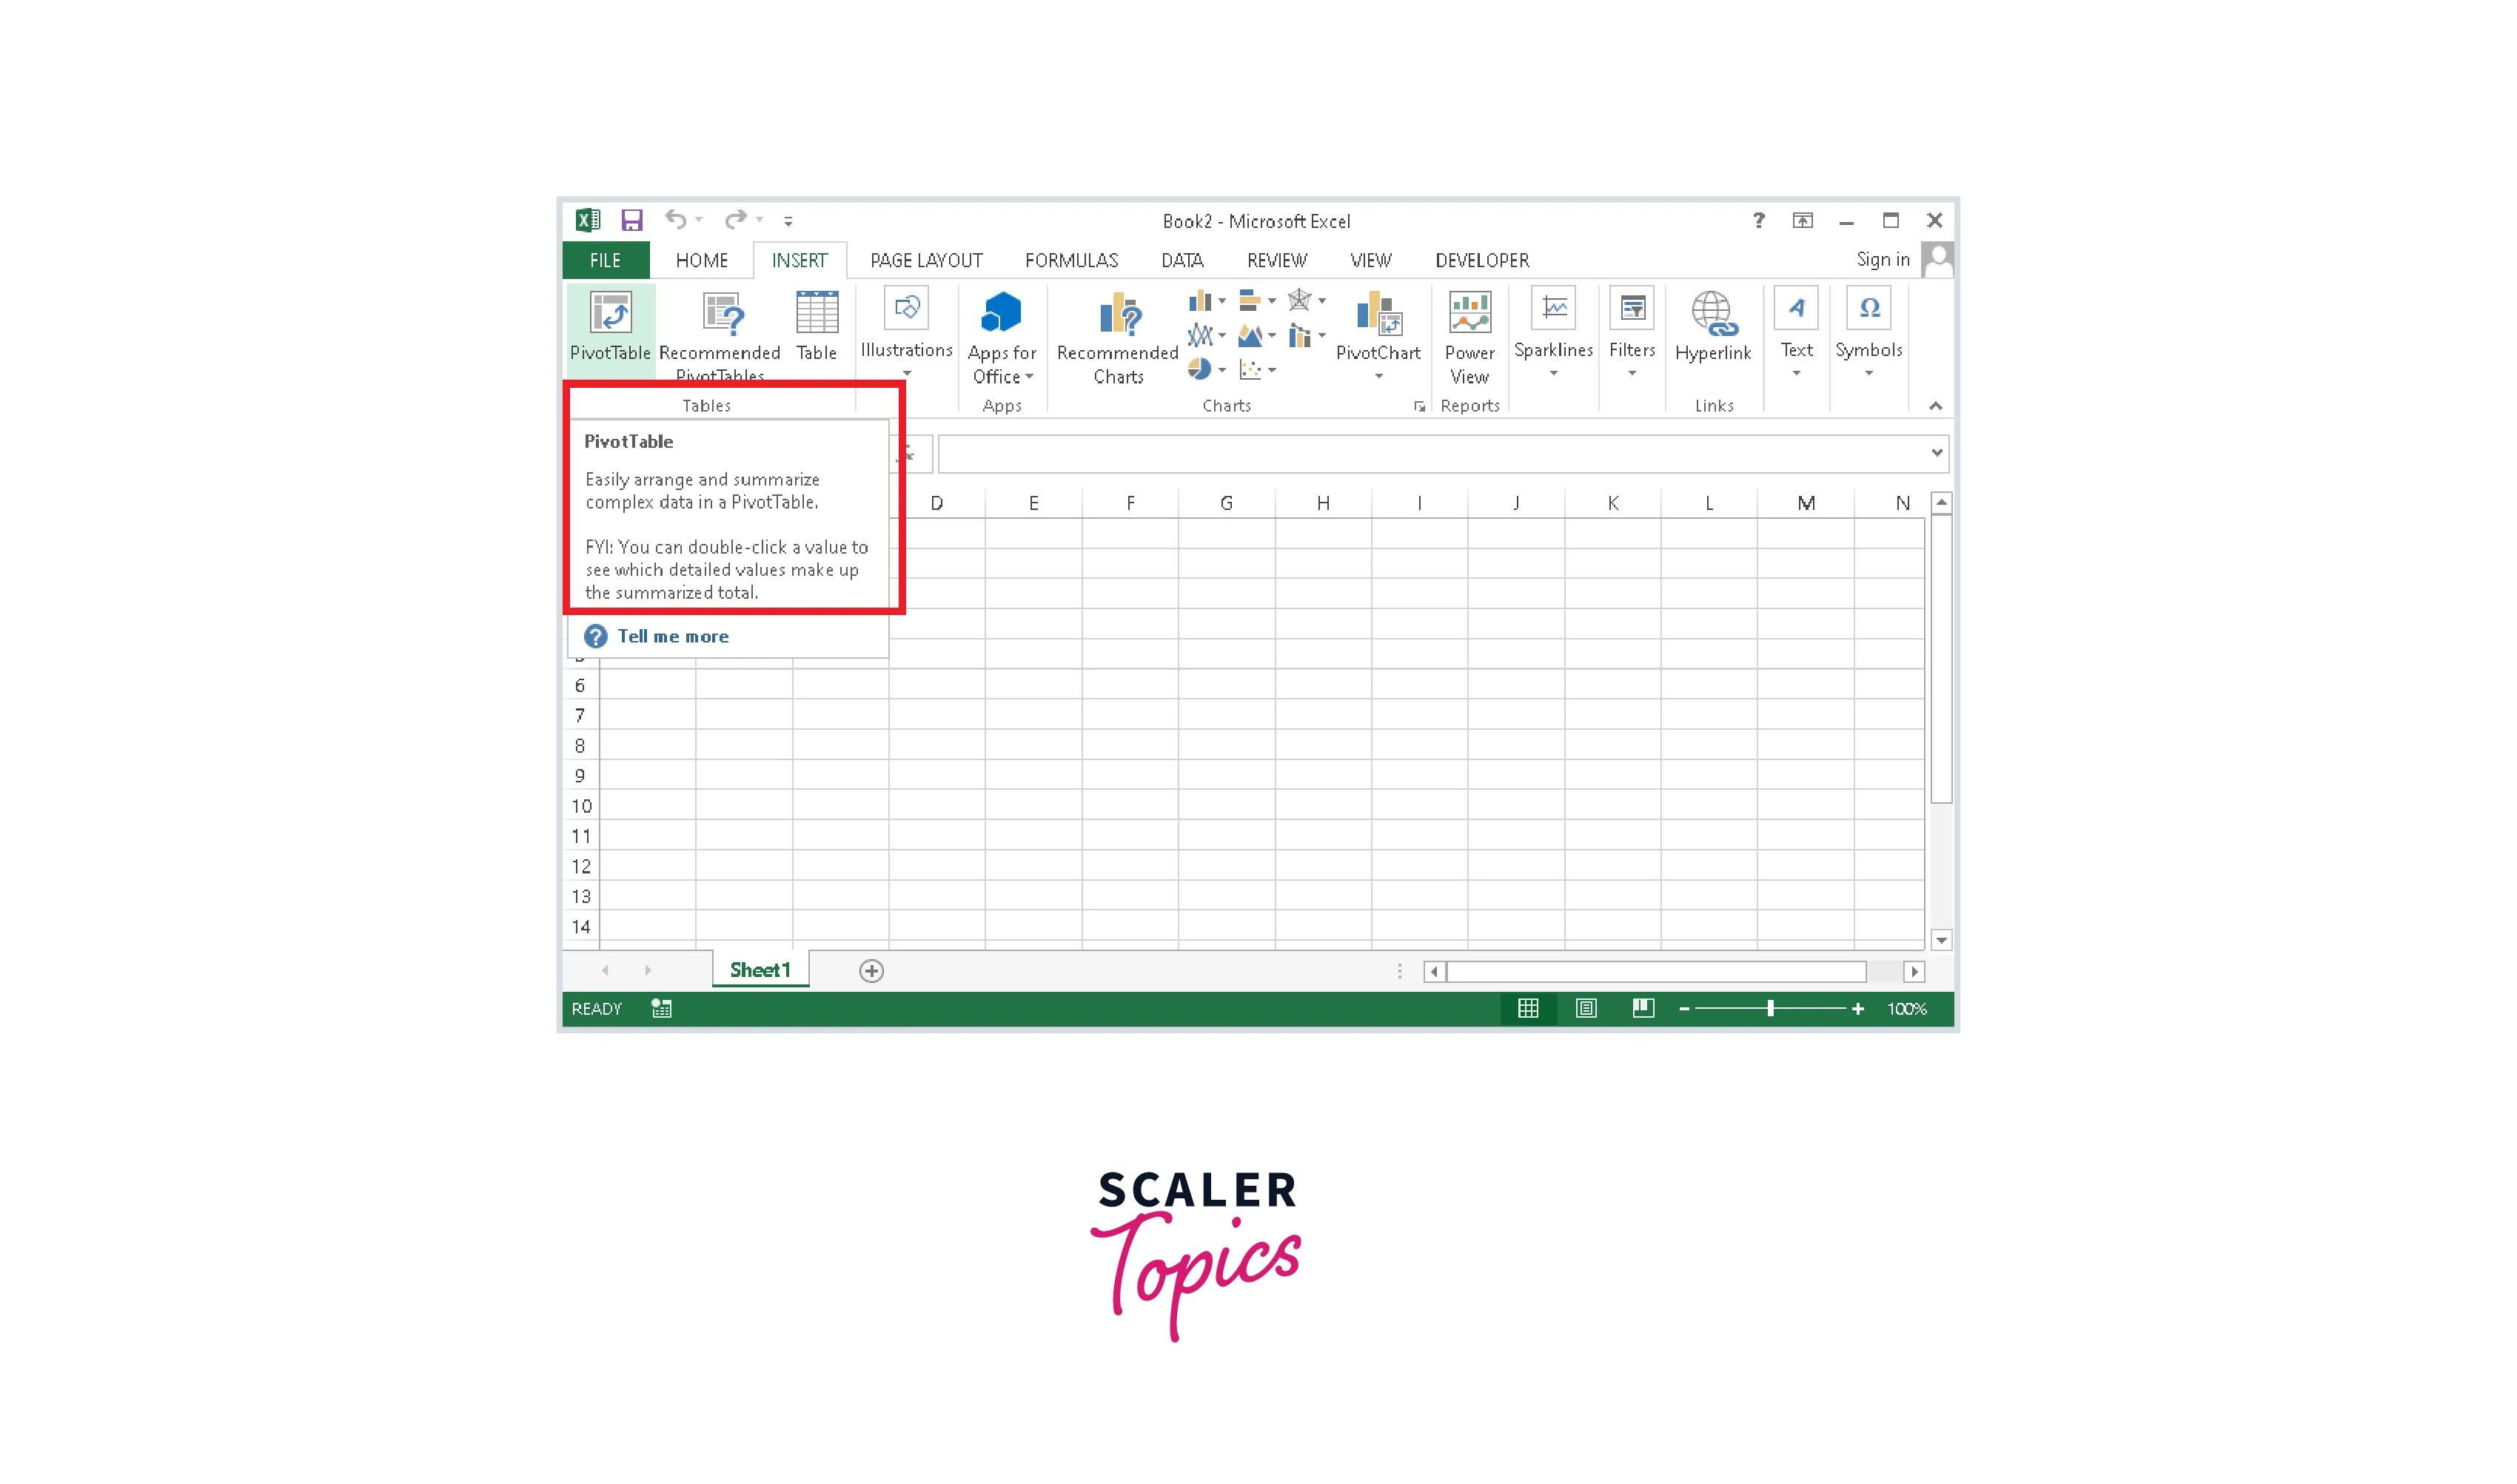
Data analysis and interpretation using Microsoft Excel involve using various tools and functions within the program to analyze and make sense of numerical data. This can include using functions such as SUM, AVERAGE, and COUNT to perform calculations and tools like charts and pivot tables to visualize and summarize data. Using Excel's features effectively lets you gain insights into your data and make informed decisions based on the results.
Reporting and Visualizations
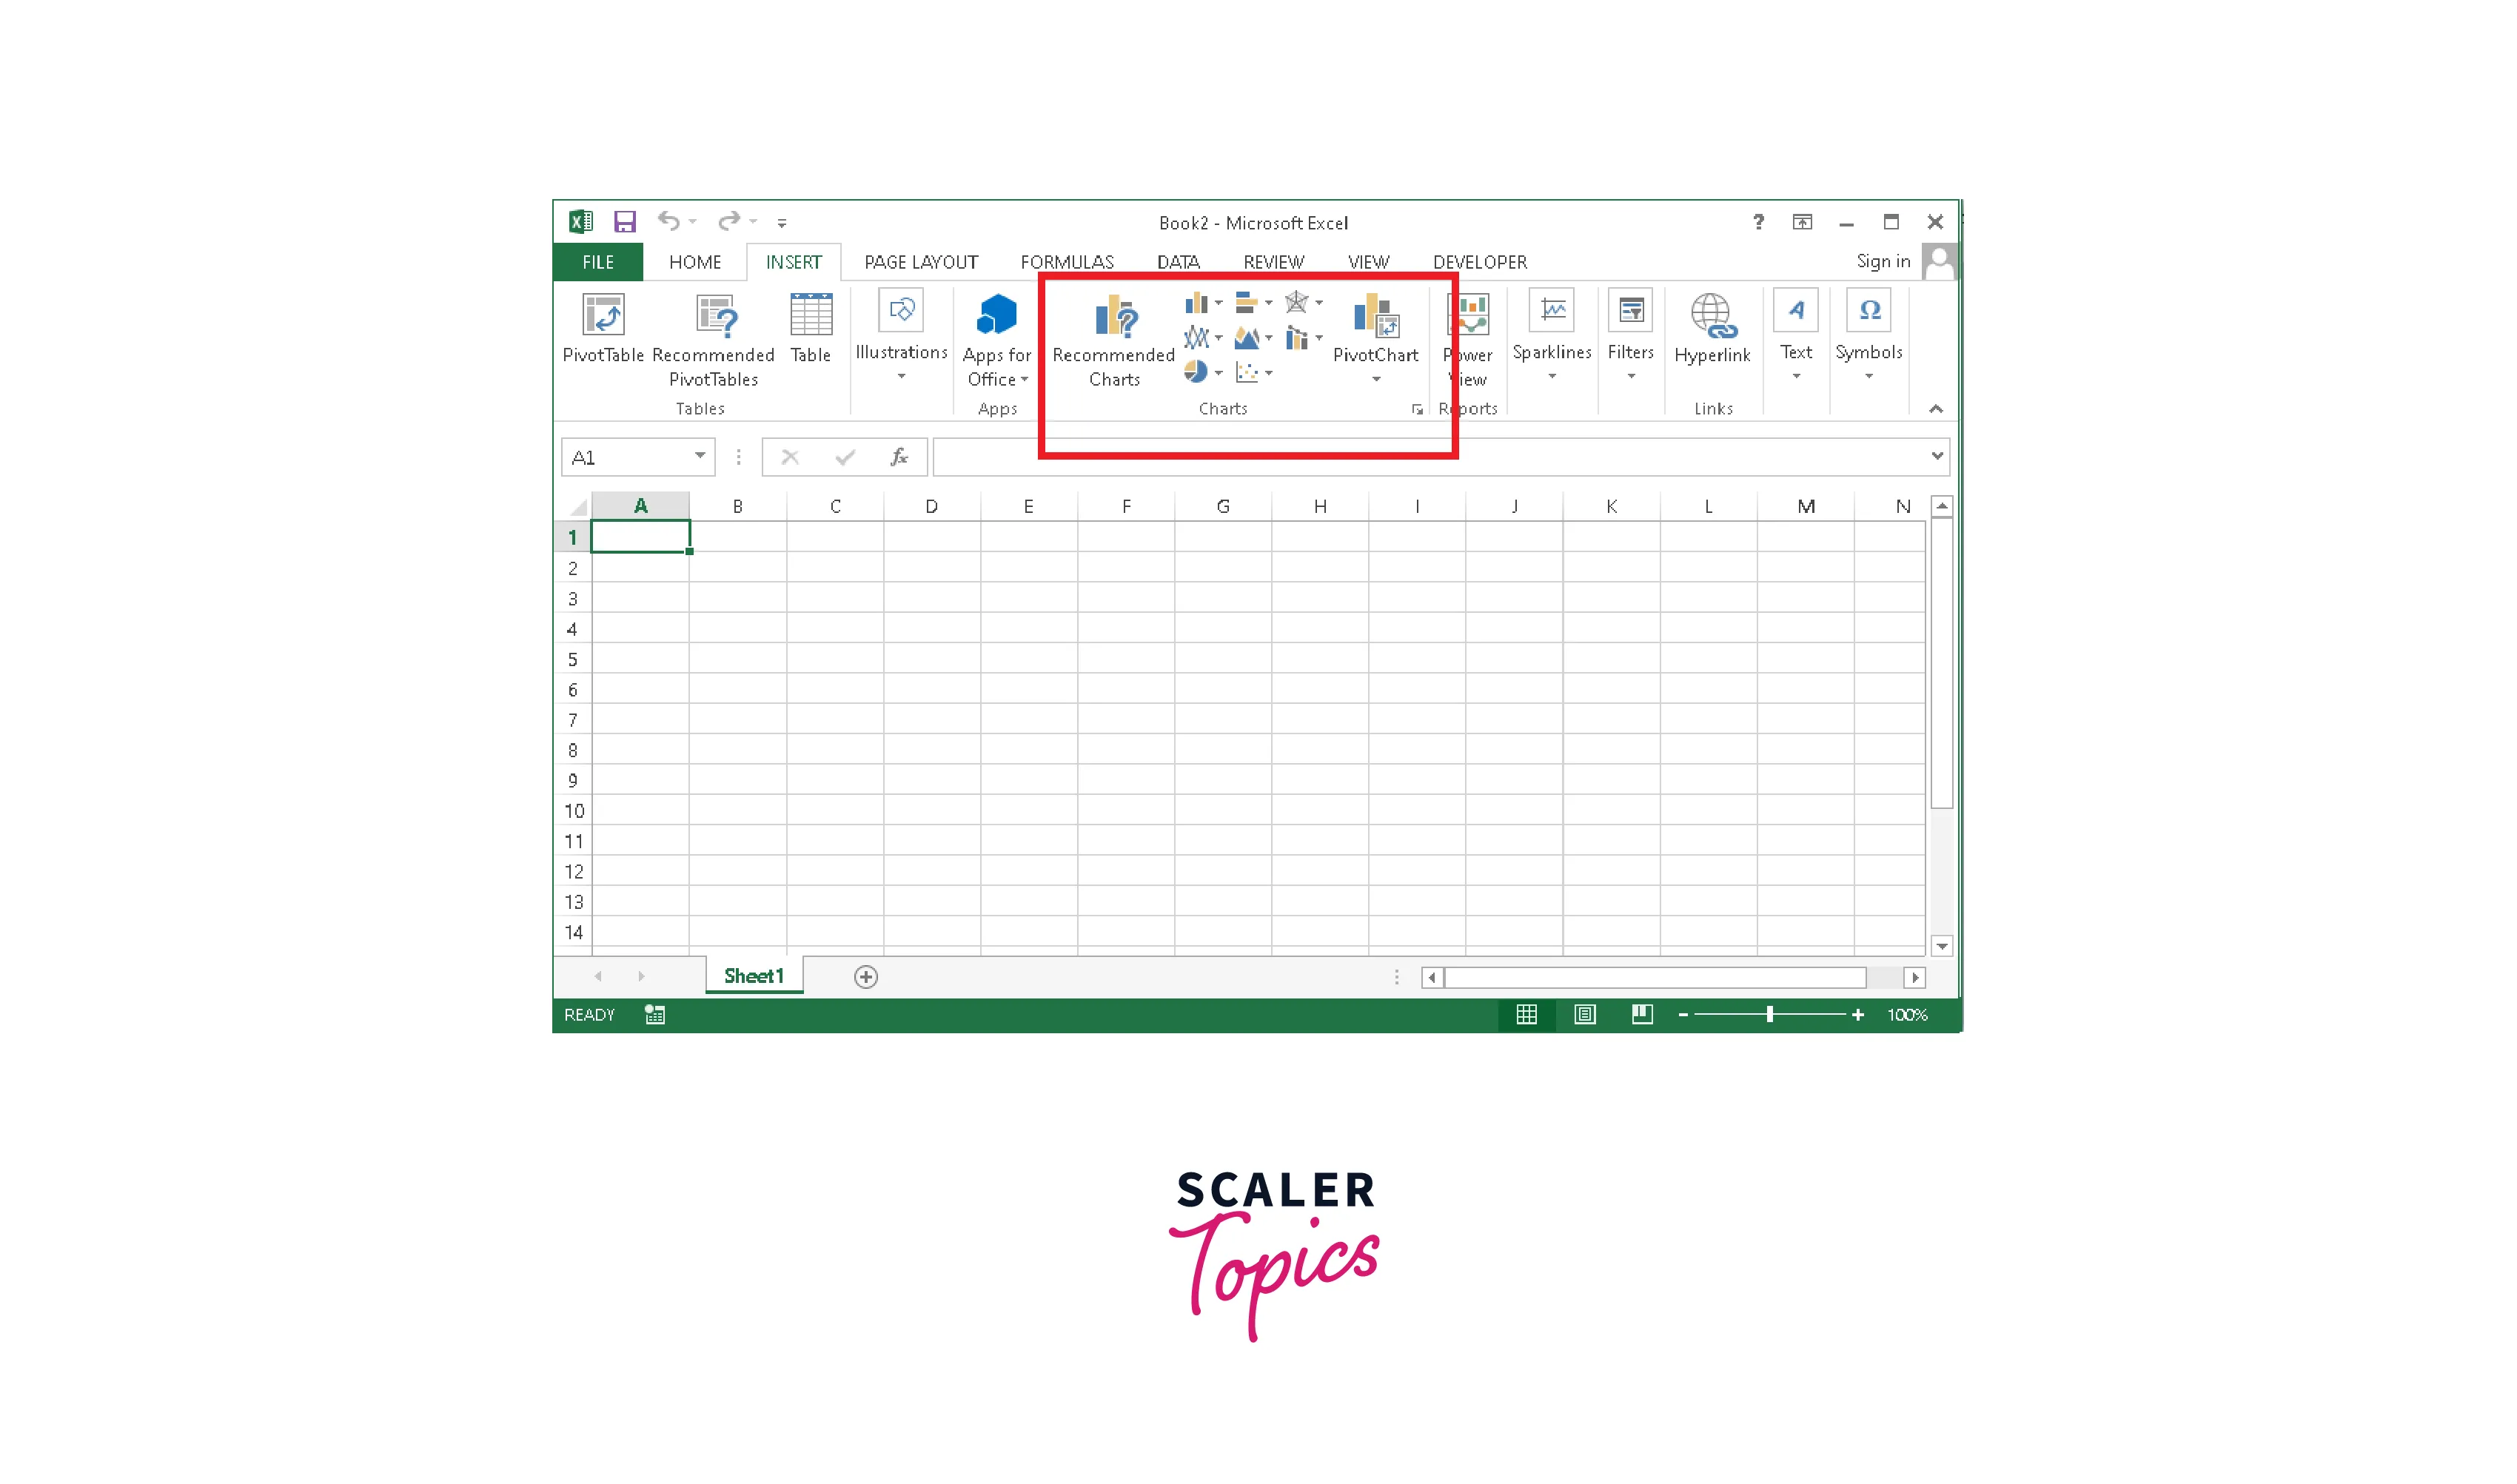
Reporting and visualizations in Microsoft Excel involve using features such as charts, tables, and graphs to organize data. This can include creating pivot tables and pivot charts to summarize large amounts of data, using conditional formatting to highlight important information, and creating interactive` dashboards to display key metrics. By utilizing Excel's reporting and visualization tools, you can effectively communicate insights and findings to stakeholders in a compelling and easily understandable way.
Forecasting
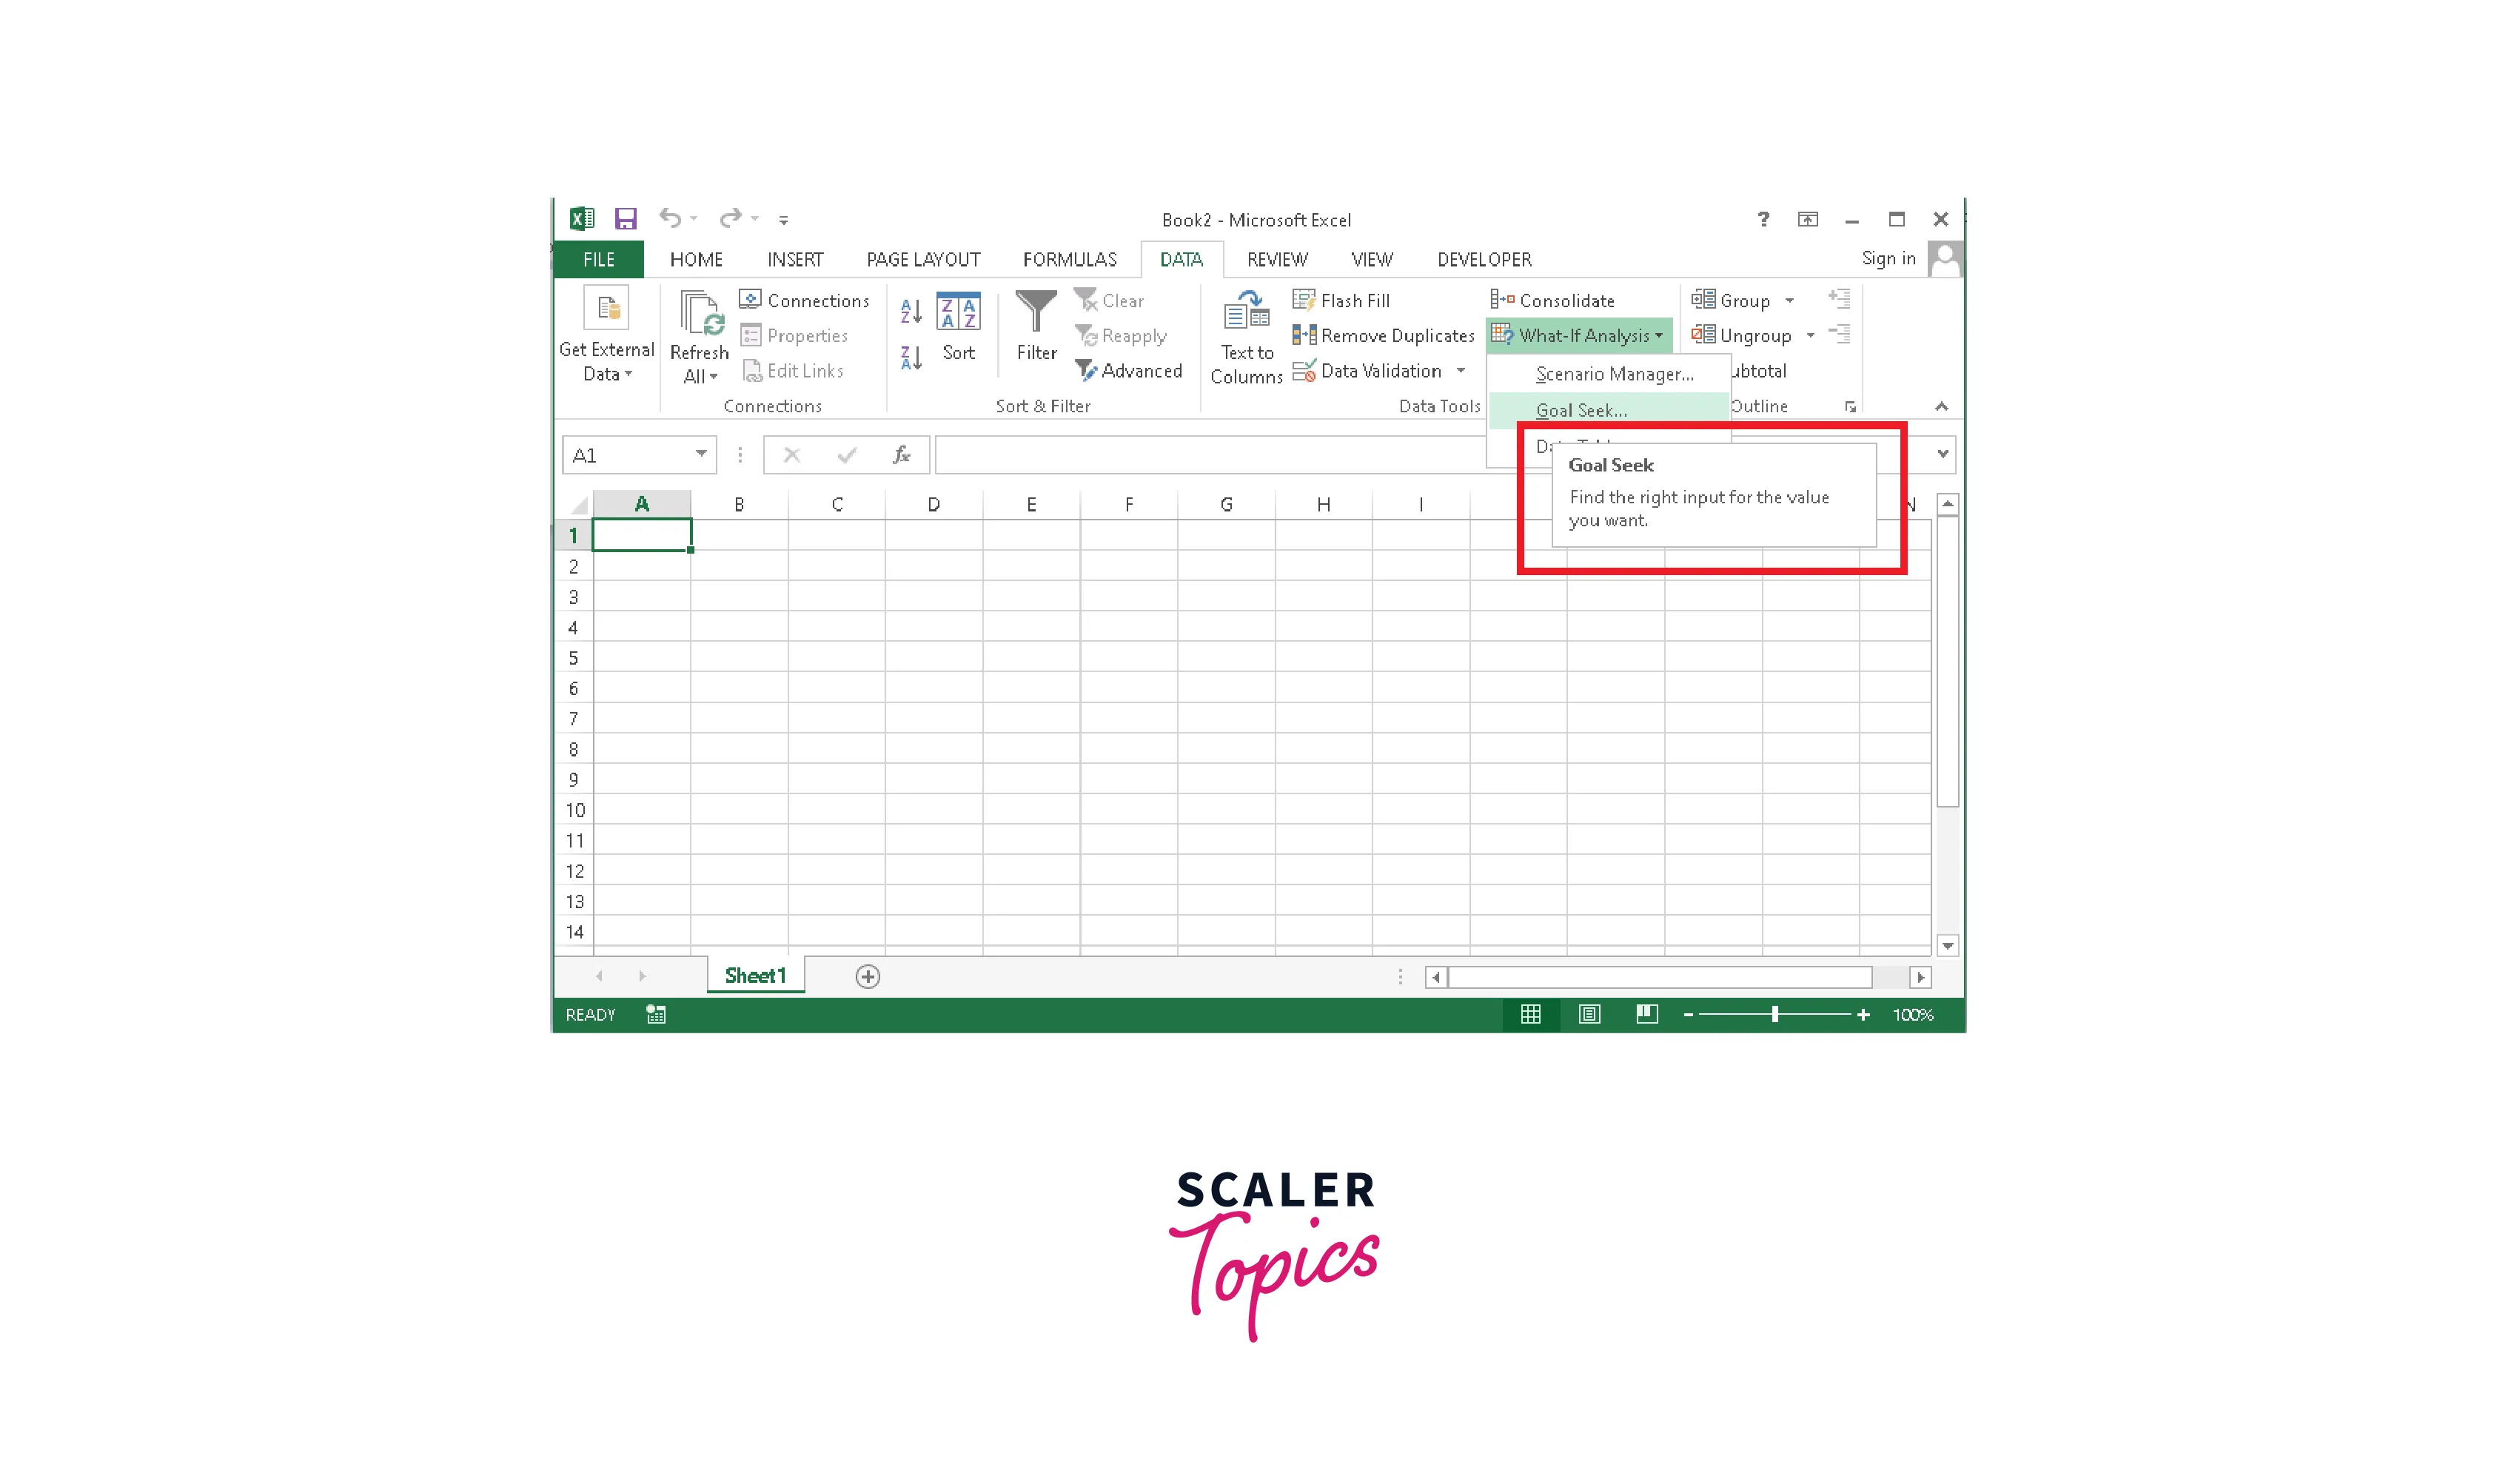
Forecasting using Microsoft Excel involves using various tools and functions within the program to predict future trends based on historical data. This can include using functions such as TREND, FORECAST, and GROWTH to generate forecasts and create charts and graphs to visualize the forecasted data.
Additionally, when there is no past data, but we have the target, excel can be essential in finding the correct inputs for the specific results. This can be done using the feature Goal Seek Analysis. By properly feeding the right target objective, one can identify what can be done to achieve the set target.
Using Excel's forecasting features, you can make informed decisions about future actions and allocate resources effectively.
Importance of Microsoft Excel for Data Analytics
Here are some key points on the importance of Microsoft Excel` for data analytics:
-
Data organization: Excel allows users to organize and store large amounts of data in a structured and efficient manner.
-
Data analysis: Excel provides a wide range of tools and functions that can be used to analyze and make sense of numerical data.
-
Visualization: Excel enables users to create charts, graphs, and pivot tables to visualize data and gain insights into trends and patterns.
-
Forecasting: Excel's forecasting features allow users to predict future trends based on historical data.
-
Collaboration: Excel enables multiple users to collaborate on the same data set, making it an effective tool for team-based data analytics projects.
-
Accessibility: Excel is widely used across industries and is available on most computers, making it an accessible and familiar tool for data analytics.
-
Integration: Excel can be integrated with other data analytics tools and platforms, allowing seamless data transfer and analysis.
Key Features of Microsoft Excel for Data Analytics
Pivot Table
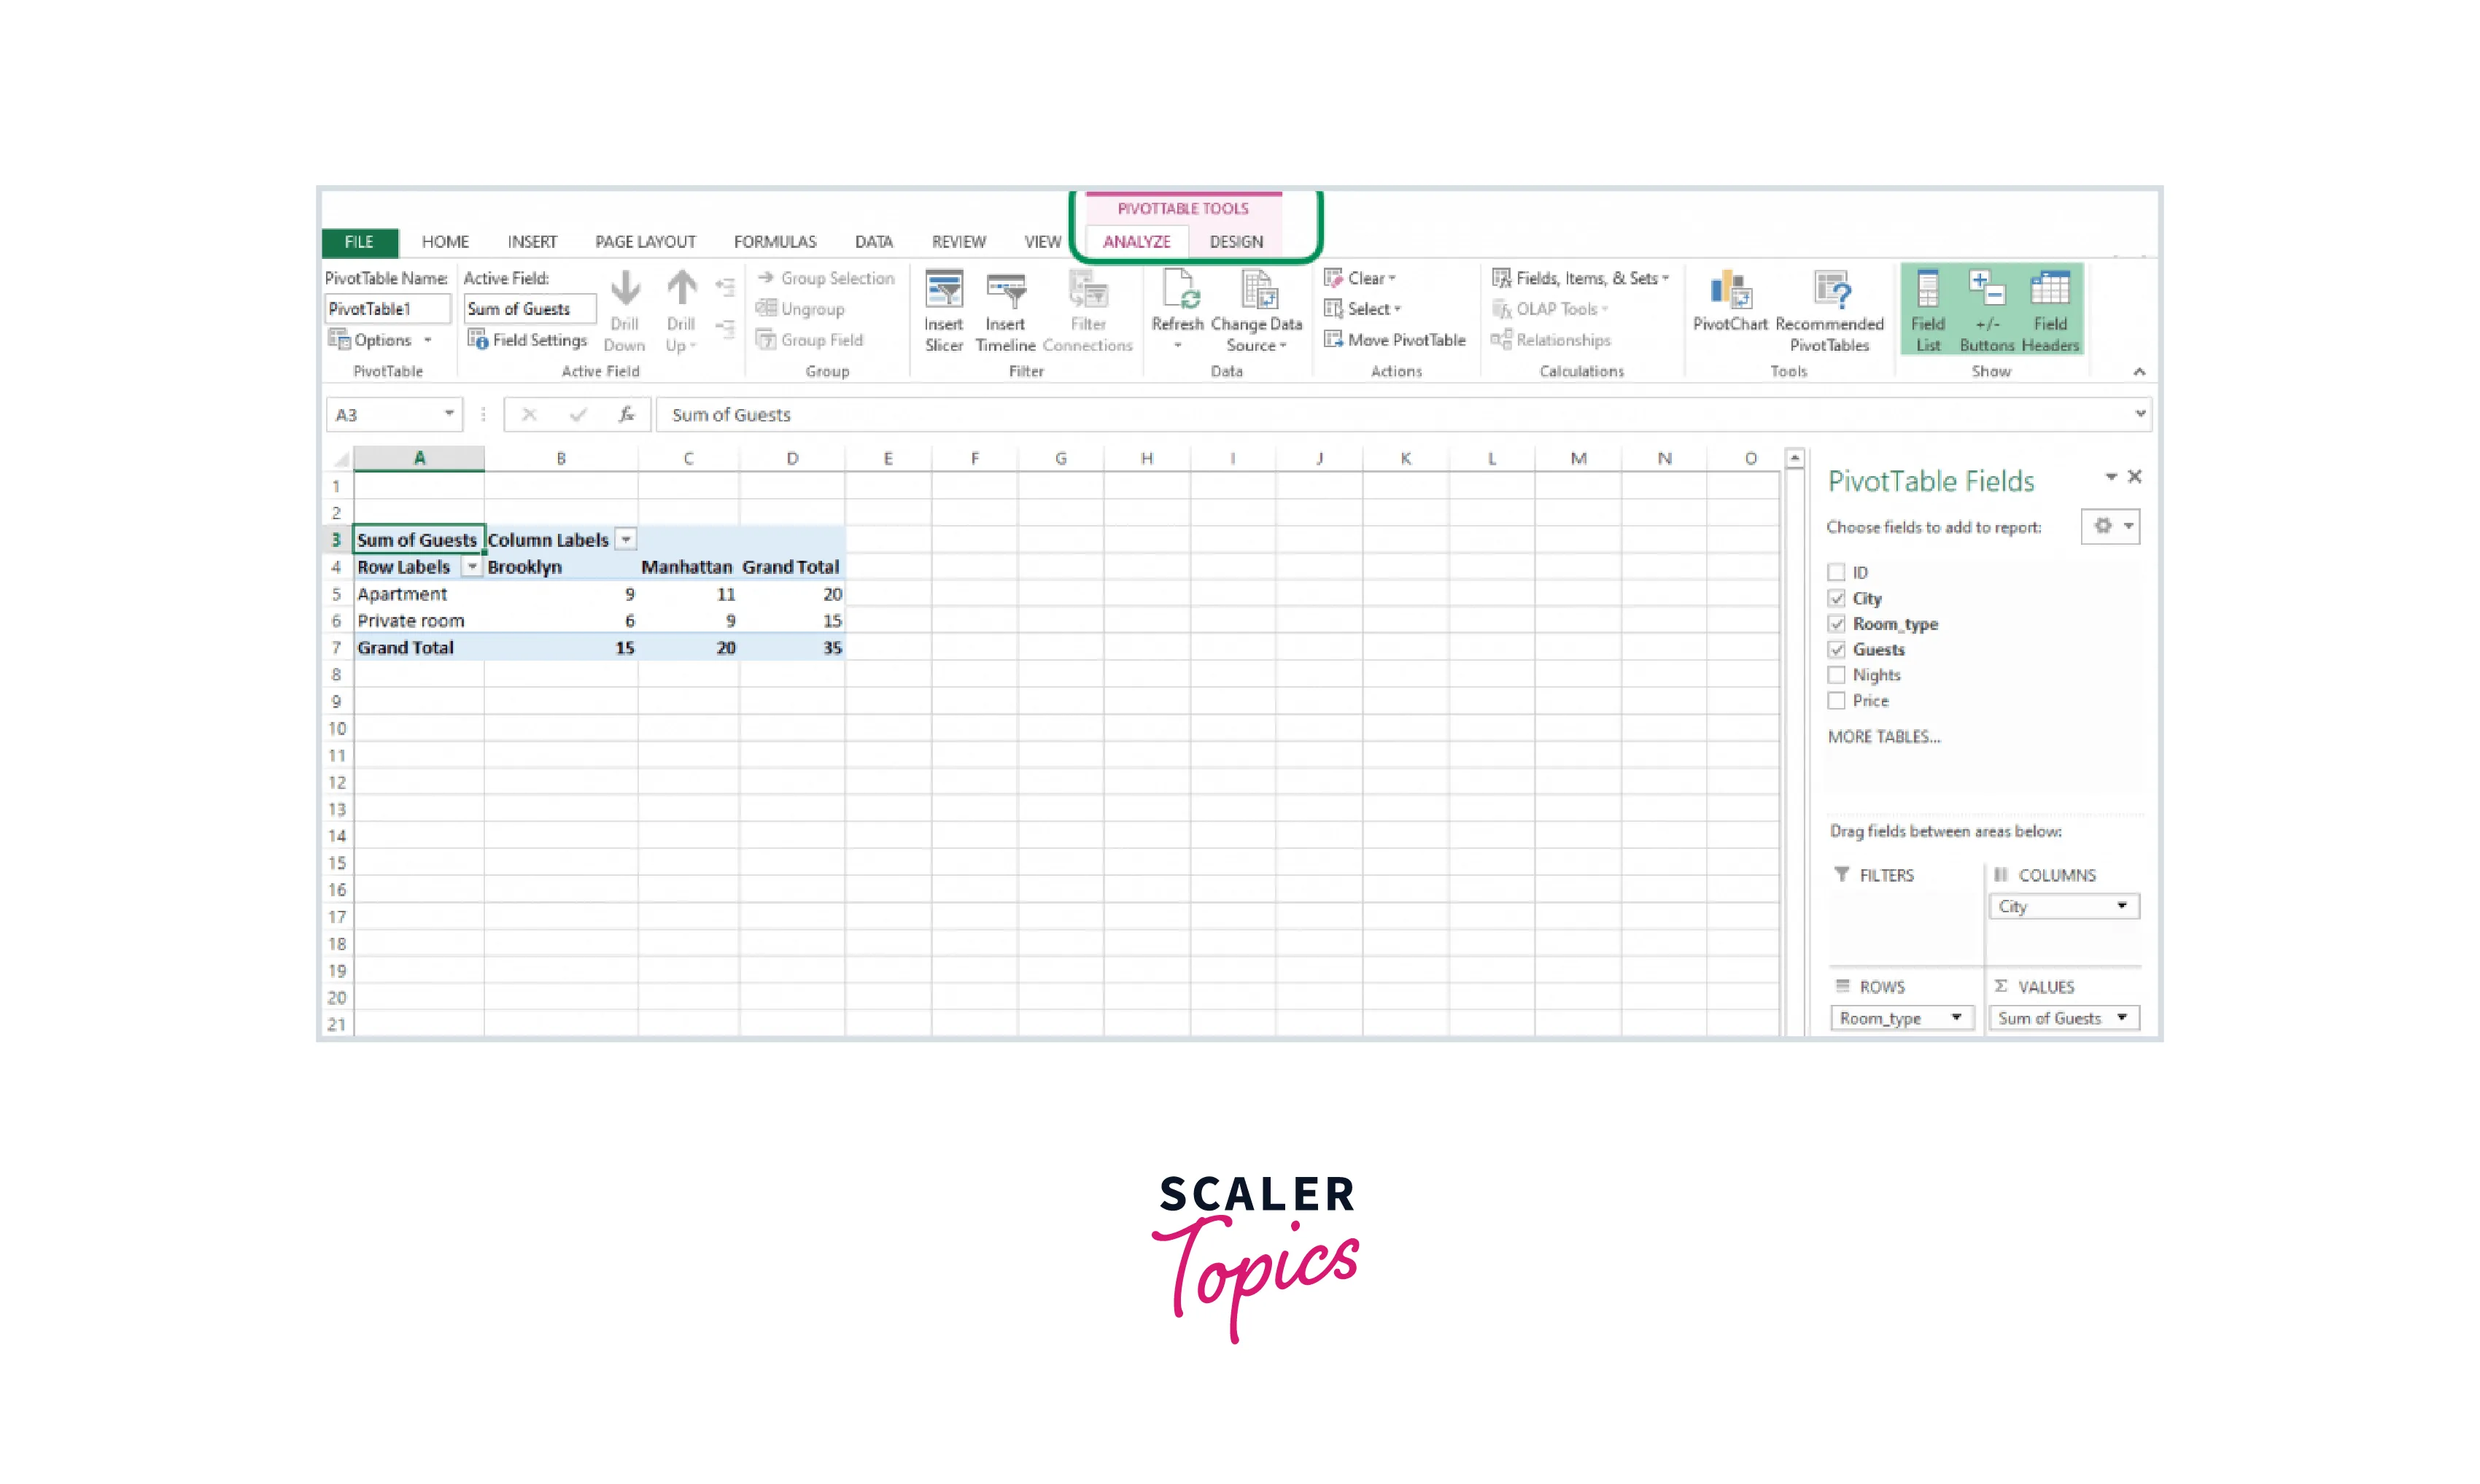
A pivot table in MS Excel is a powerful data analysis tool that allows you to analyze and summarize large amounts of data efficiently. It enables you to transform a table of raw data into a more manageable format that can be analyzed and visualized in different ways.
-
Summarizing data: Pivot tables allow you to quickly summarize data by aggregating it into categories or groups.
-
Identifying trends: Pivot tables can identify trends or patterns in data by sorting and filtering the data based on different criteria.
-
Comparing data: Pivot tables allow you to compare data from different sources or periods by combining data from multiple tables or worksheets.
-
Calculating percentages: Pivot tables can be used to calculate percentages or ratios using calculated fields or items.
-
Visualizing data: Pivot tables allow you to create charts and graphs based on your data, which can help you visualize trends and patterns more easily.
Conditional Formatting
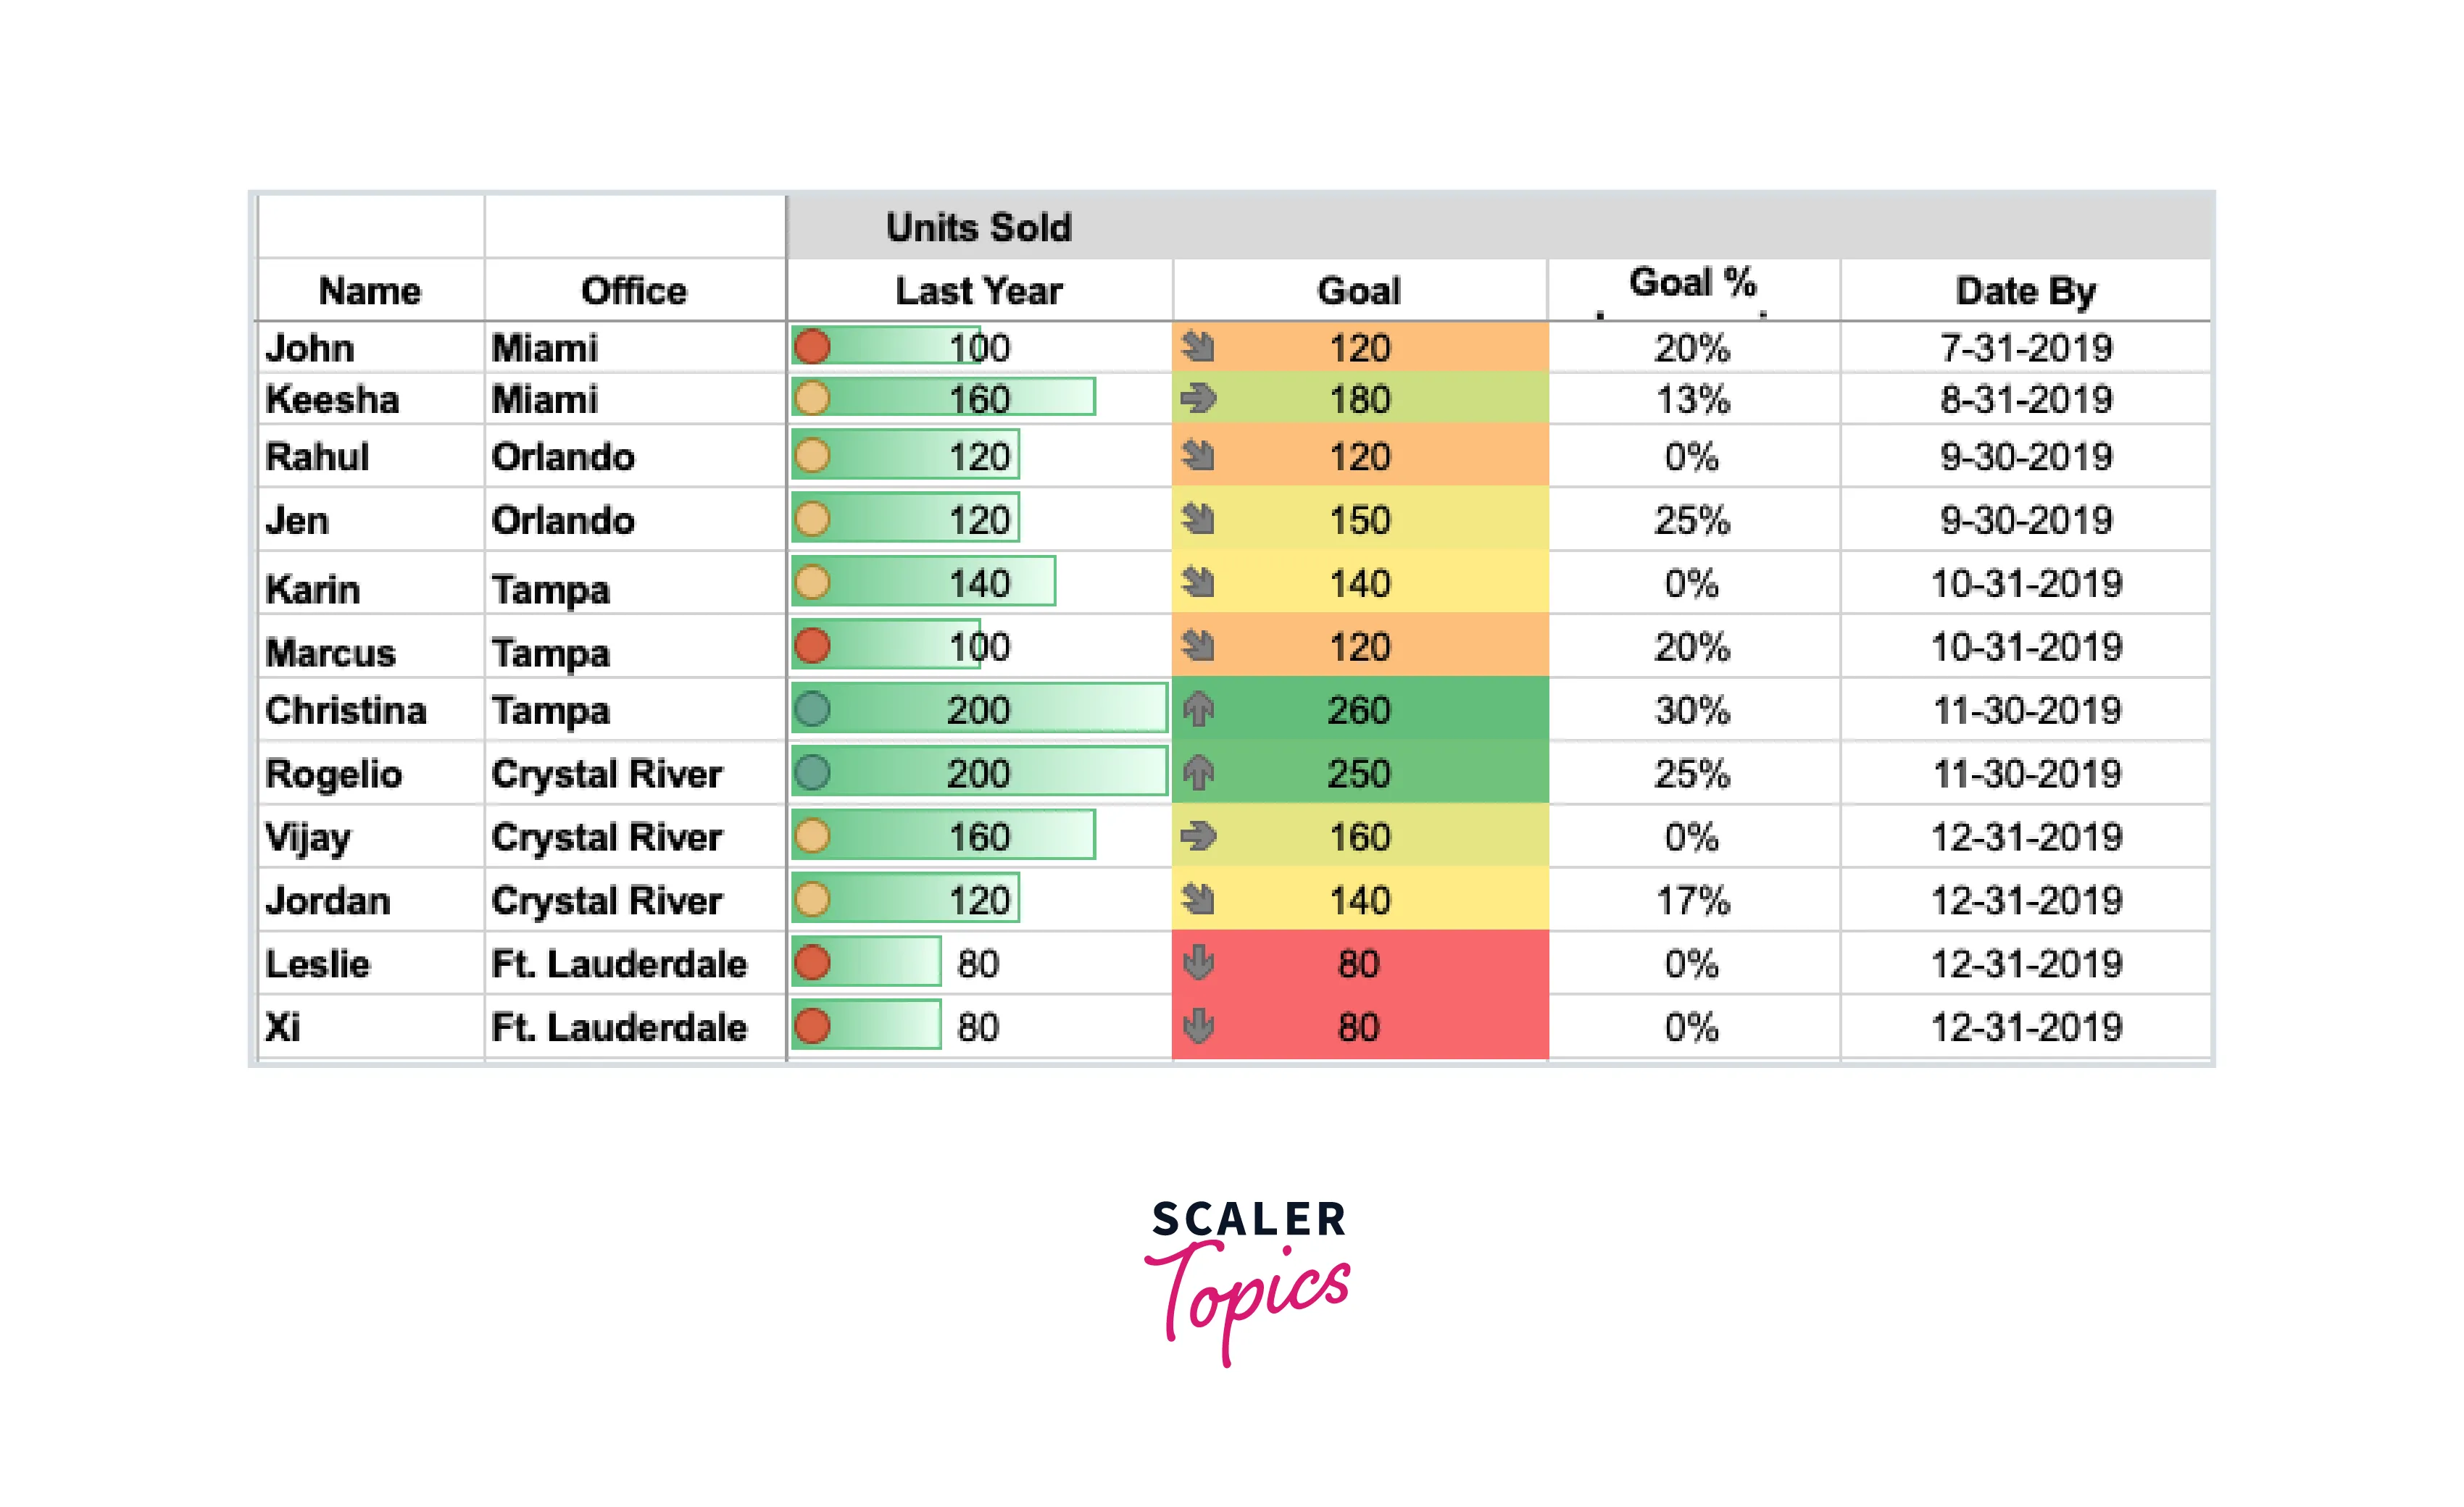
Conditional formatting in Microsoft Excel is a powerful feature that allows you to highlight cells or ranges of cells based on certain conditions or criteria. It can be a useful tool for data analysis as it lets you quickly identify patterns, trends, or outliers in your data. Here are some ways that conditional formatting can be used for data analysis:
-
Highlighting values above or below a certain threshold: You can use conditional formatting for highlighting values above or below a certain threshold, such as sales figures below a certain amount or inventory levels running low.
-
Identifying duplicate or unique values: You can use conditional formatting to identify duplicate or unique values in a range of cells, which can be useful for detecting errors or inconsistencies in your data.
-
Color-coding data based on categories: You can use conditional formatting to color-code data based on different categories or groups, such as sales data by product or customer, making it easier to identify patterns and trends.
-
Creating data bars or icon sets: You can use conditional formatting to create data bars or icon sets that show the relative size or value of different data points, which can help you visualize your data more easily.
-
Highlighting data that meets specific criteria: You can use conditional formatting to highlight data that meets specific criteria, such as overdue orders or sales that have increased by a certain percentage.
LOOKUP
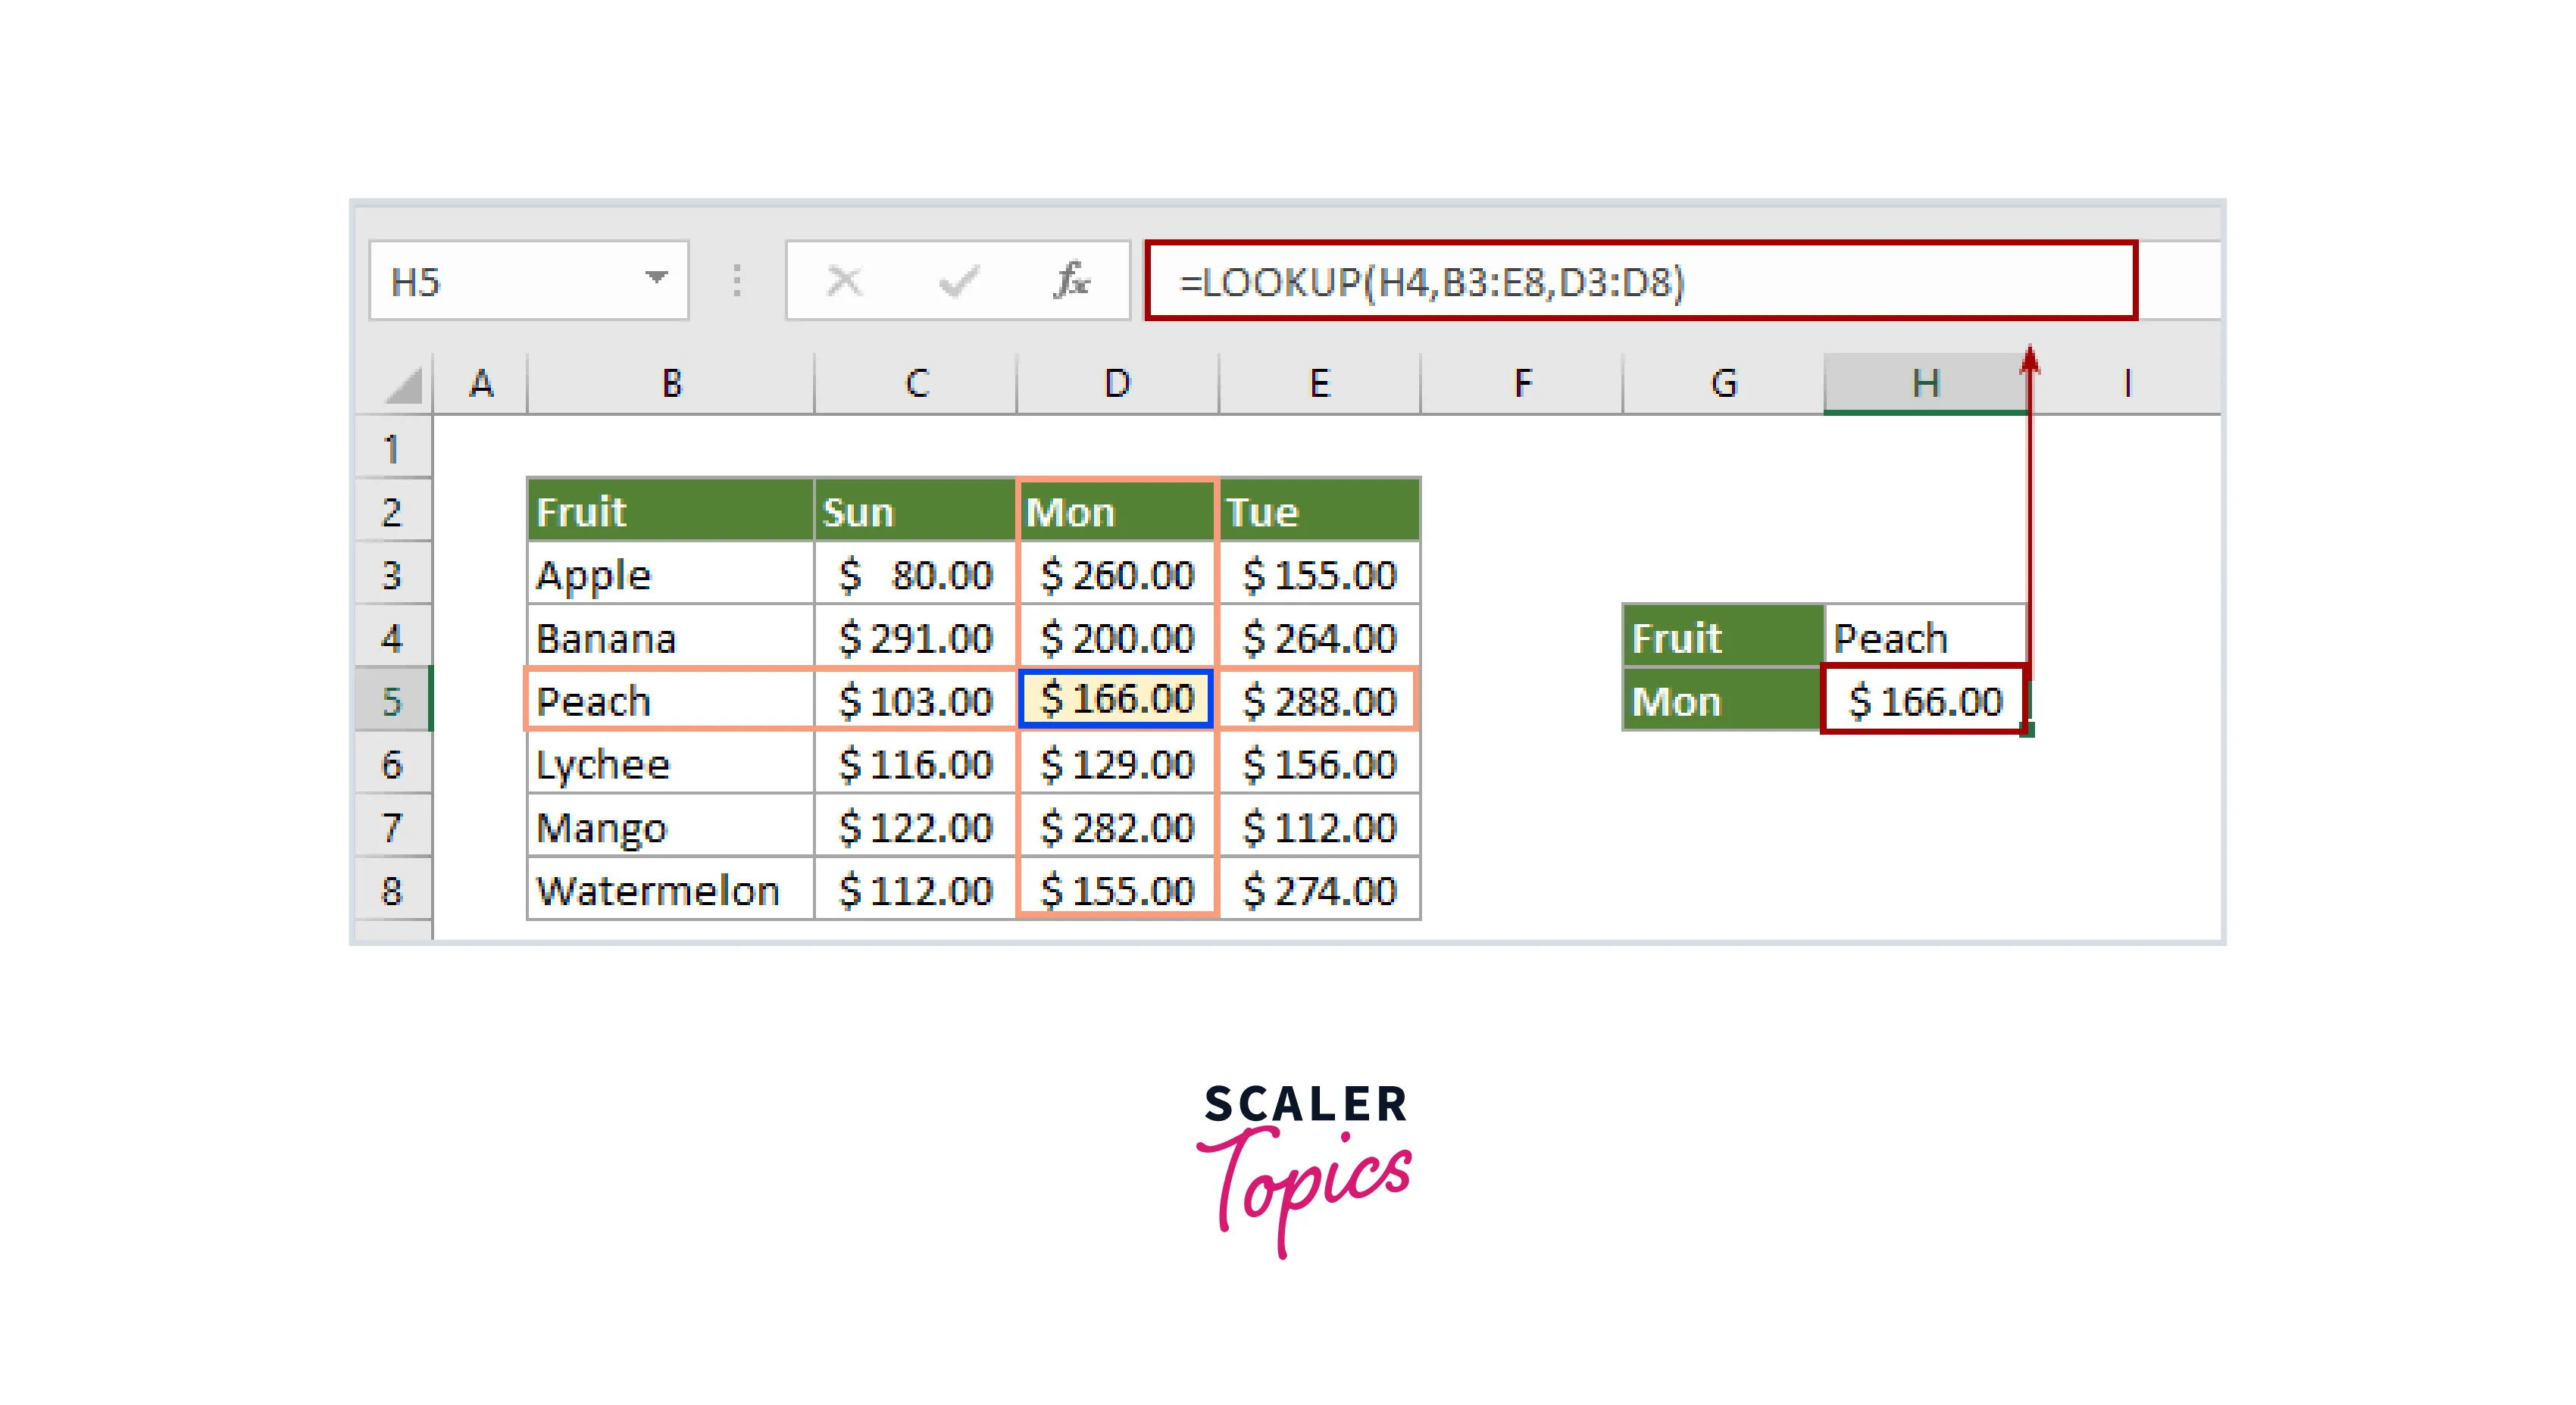
The LOOKUP function in Microsoft Excel is a powerful tool that allows you to search for a value in a table and return a corresponding value from another column in the same table. The function can be used for various purposes, including searching for data, filling in missing information, and creating more complex calculations.
There are two uses of ms excel using this feature for Data Analysts:
- Vector Form: The Vector Form of LOOKUP searches for 1 row (HLOOKUP) or 1 column (VLOOKUP) for a particular value. It then specifies the range comprising the values the Data Analyst wants to match. For example, the V in VLOOKUP signifies Vertical Search (in a single column), while the H in HLOOKUP signifies Horizontal Search (within a single row).
- Array Form: The Array Form of LOOKUP searches the given value in the first row or column of an Array. It then returns a value from the same position in the array’s last row or column. Therefore, the Array Form of LOOKUP is helpful if the values to be matched are in the array’s first row or column.
What-If Analysis
What-If Analysis in Microsoft Excel is a powerful tool that allows you to explore different scenarios by changing variables in a spreadsheet and observing the impact on the results. It has various purposes, such as forecasting future trends, evaluating the impact of different business decisions, and optimizing complex models.
There are three main types of What-If Analysis in Microsoft Excel:
-
Goal Seek: This tool determines the input required to achieve a specific output. For example, you might use Goal Seek to determine the required sales volume to reach a particular revenue target.
-
Data Tables: This tool allows you to analyze the impact of changing two or more input variables on the results. For example, you might use a data table to analyze the impact of changing both the price and the quantity sold on the revenue of a product.
-
Scenario Manager: This tool allows you to create and compare scenarios by changing multiple input variables. For example, use the Scenario Manager to compare the impact of different marketing strategies on the sales and revenue of a product.
Data Visualization
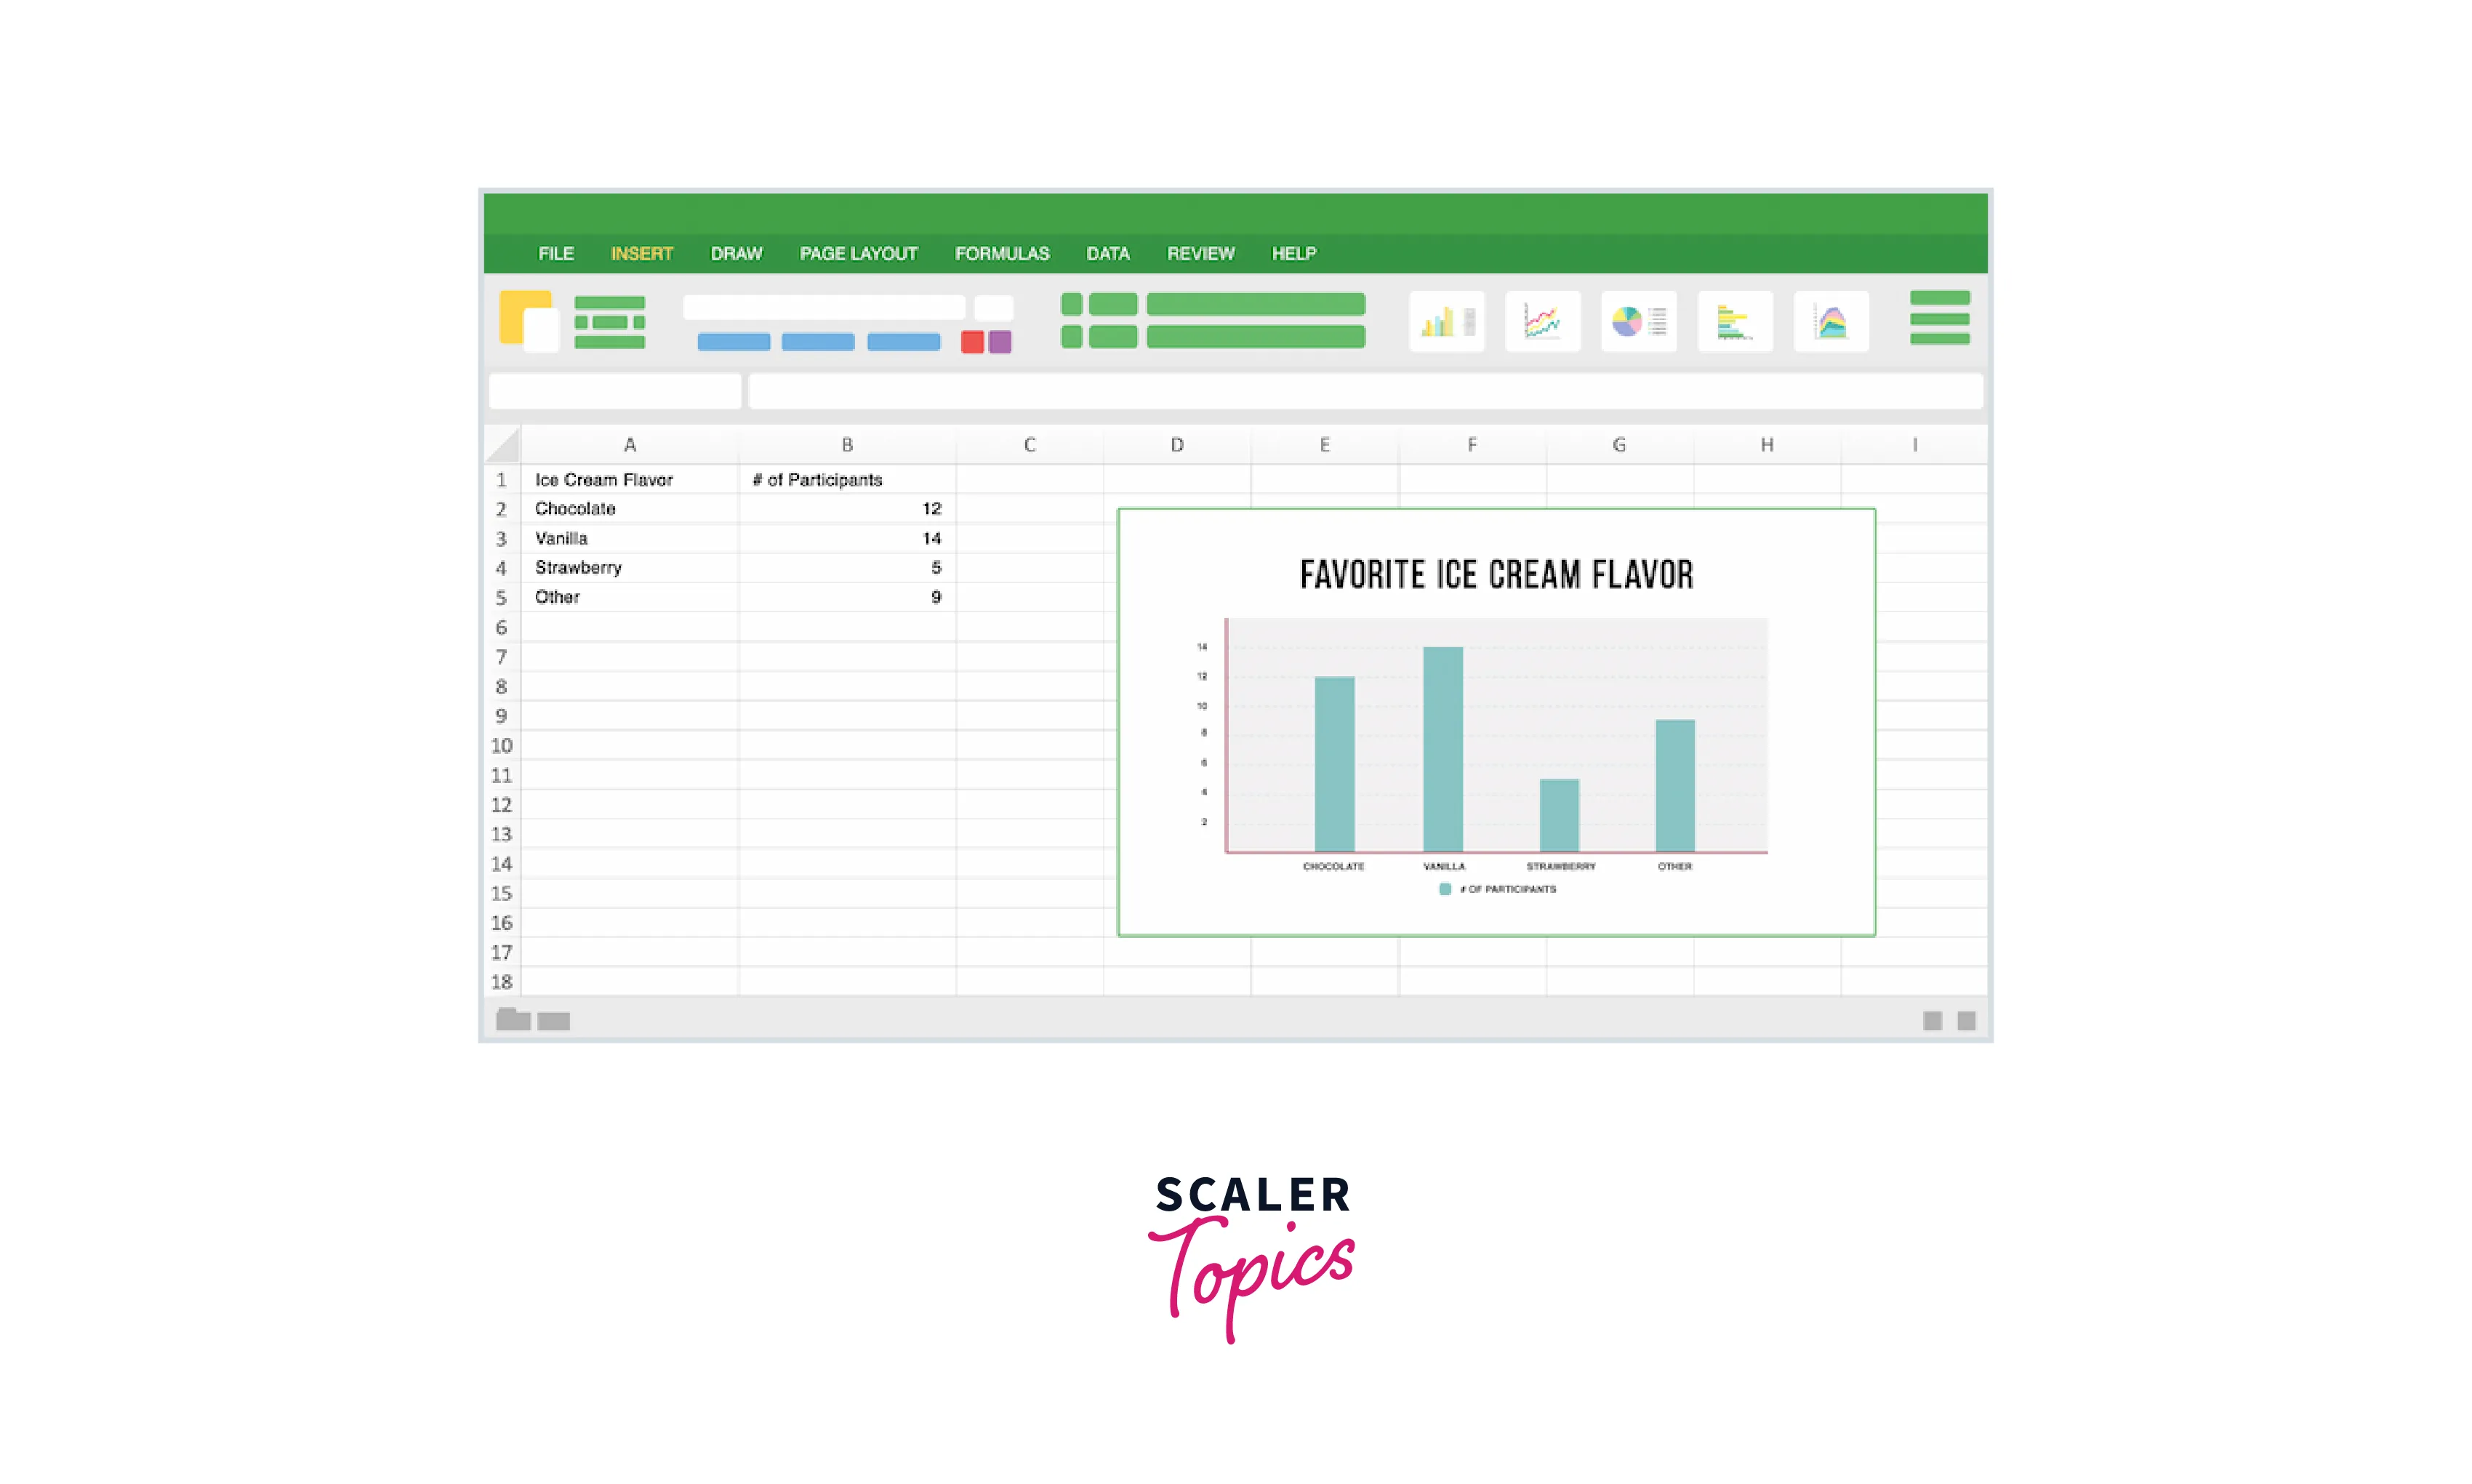
`Microsoft Excel provides several data visualization tools to help you clearly and compellingly present your data. Some of these tools include:
-
Charts: Excel offers various chart types, such as bar charts, line charts, pie charts, scatter plots, and more.
-
PivotTables: PivotTables allow you to summarize and analyze large amounts of data quickly and easily.
-
Sparklines: Sparklines are small, inline charts that allow you to display trends and patterns within your data.
-
Data bars and color scales: Data bars and color scales are visual aids that allow you to quickly see how your data compares to other data points.
Functions
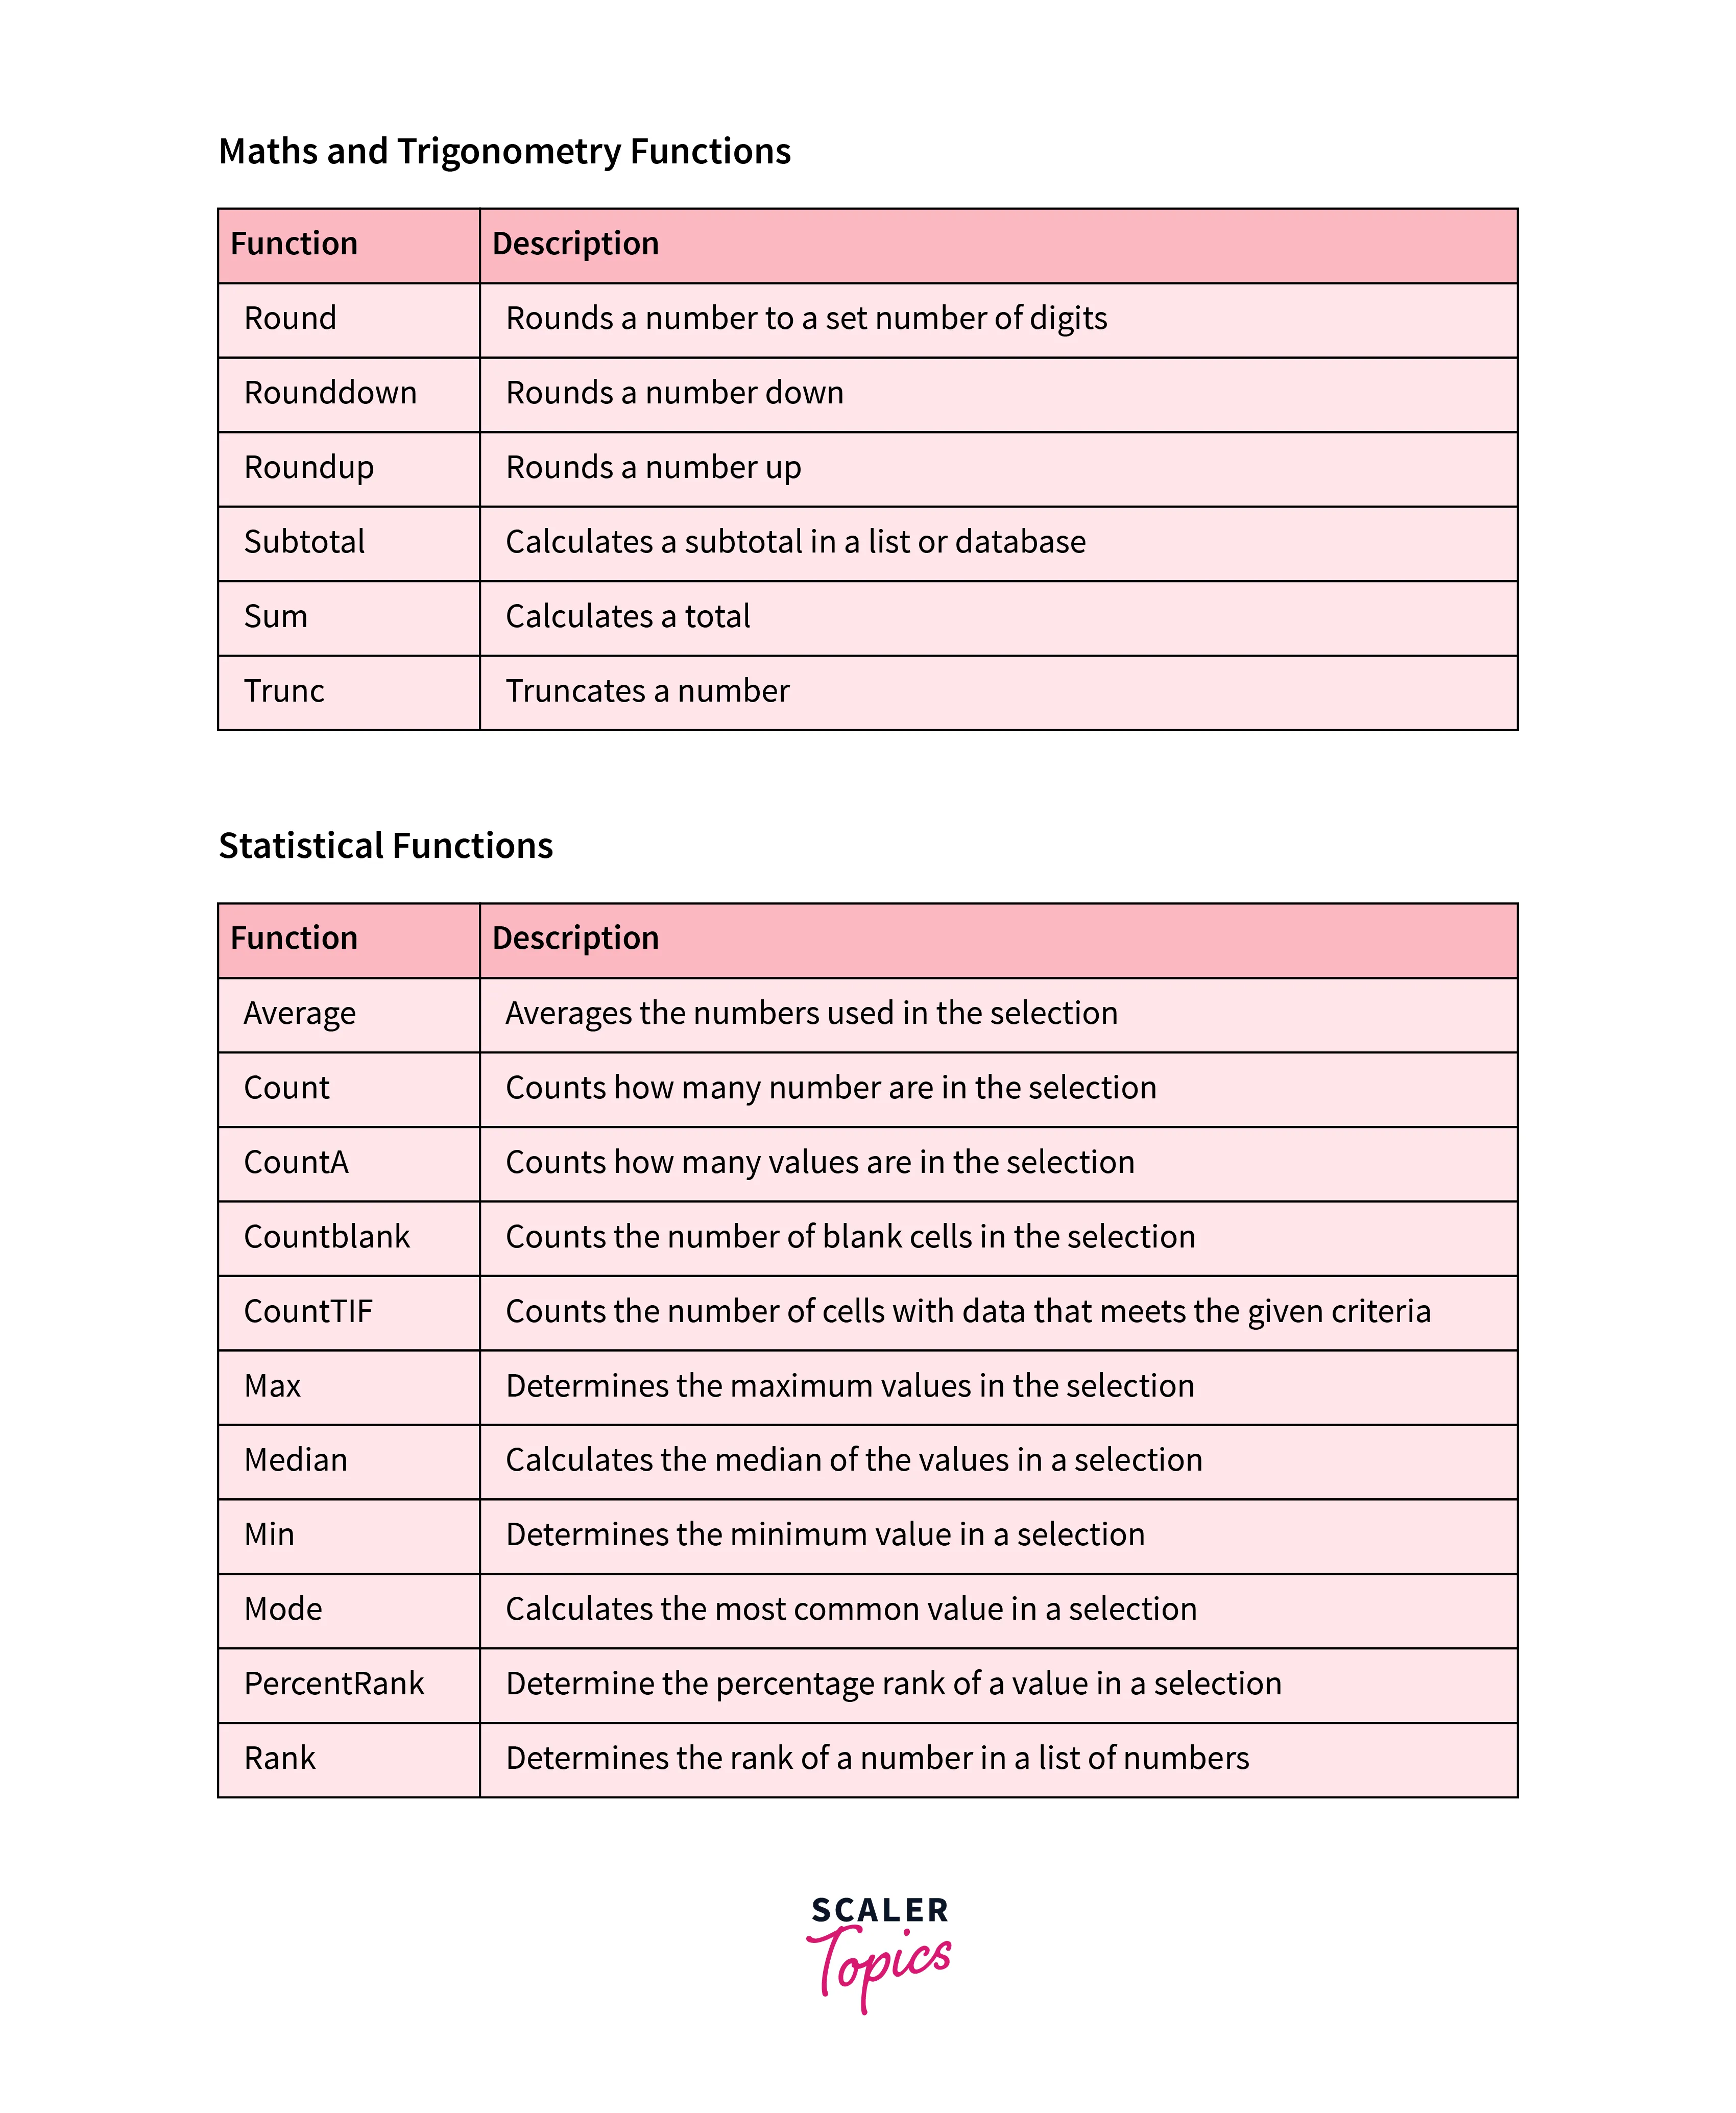
Microsoft Excel has a variety of functions that are useful for data analytics. Here are some examples:
- SUM: adds up a range of cells
- AVERAGE: calculates the average of a range of cells
- COUNT: counts the number of cells that contain data
- MIN: returns the smallest value in a range of cells
- MAX: returns the largest value in a range of cells
- IF: performs a logical test and returns one value if the test is true and another value if the test is false
- VLOOKUP: searches for a value in a table and returns a corresponding value in the same row
- CONCATENATE: combines two or more text strings into one
- LEFT: returns a specified number of characters from the beginning of a text string
- RIGHT: returns a specified number of characters from the end of a text string
- TRIM: removes extra spaces from a text string
- LEN: returns the length of a text string
- DATE: creates a date based on year, month, and day values
- YEAR: extracts the year from a date
- MONTH: extracts the month from a date
- DAY: extracts the day from a date
These are just a few examples of the many functions available in Excel that can be useful for data analysis. Learning how to use these functions effectively is important to make the most of Excel's capabilities for data analytics.
Pros & Cons of Excel in Data Analysis
Excel is a commonly used tool for data analysis due to its user-friendly interface and familiarity` among professionals. However, there are pros and cons to using Excel for data analysis.
Pros:
-
User-friendly: Excel has a user-friendly interface that allows even non-technical users to easily perform basic data analysis tasks such as sorting, filtering, and formatting data.
-
Versatile: Excel can handle various data types, including text, numbers, dates, and formulas. This allows for various data analysis tasks, such as calculations, charts, and pivot tables.
-
Easy to share: Excel files can easily be shared with others, allowing collaboration on data analysis projects.
-
Customizable: Excel allows for customizing charts, graphs, and other visualizations to convey data insights better.
Cons:
-
Limited data handling: Excel has limitations in handling large data sets and complex data structures. It can slow down or crash when working with large data or complex formulas.
-
Manual data entry: Excel requires manual data entry, which is prone to errors and can be time-consuming.
-
Lack of data validation: Excel does not have built-in data validation features, which can lead to errors in the analysis due to inaccurate or incomplete data.
-
Security issues: Excel files can be easily modified and manipulated, creating security issues for sensitive data.
Conclusion
The key takeaways from this article are:-
- Microsoft Excel is a popular software tool for organizing, analyzing, and visualizing data.
- Excel is widely used in businesses and research organizations for data analysis because of its accessibility, versatility, and ease of use.
- What-If Analysis in Microsoft Excel is a powerful tool that allows you to explore different scenarios by changing variables in a spreadsheet and observing the impact on the results.
- Conditional formatting in Microsoft Excel is a powerful feature that allows you to highlight cells or ranges of cells based on certain conditions or criteria.
