What-if Scenarios Tool
Overview
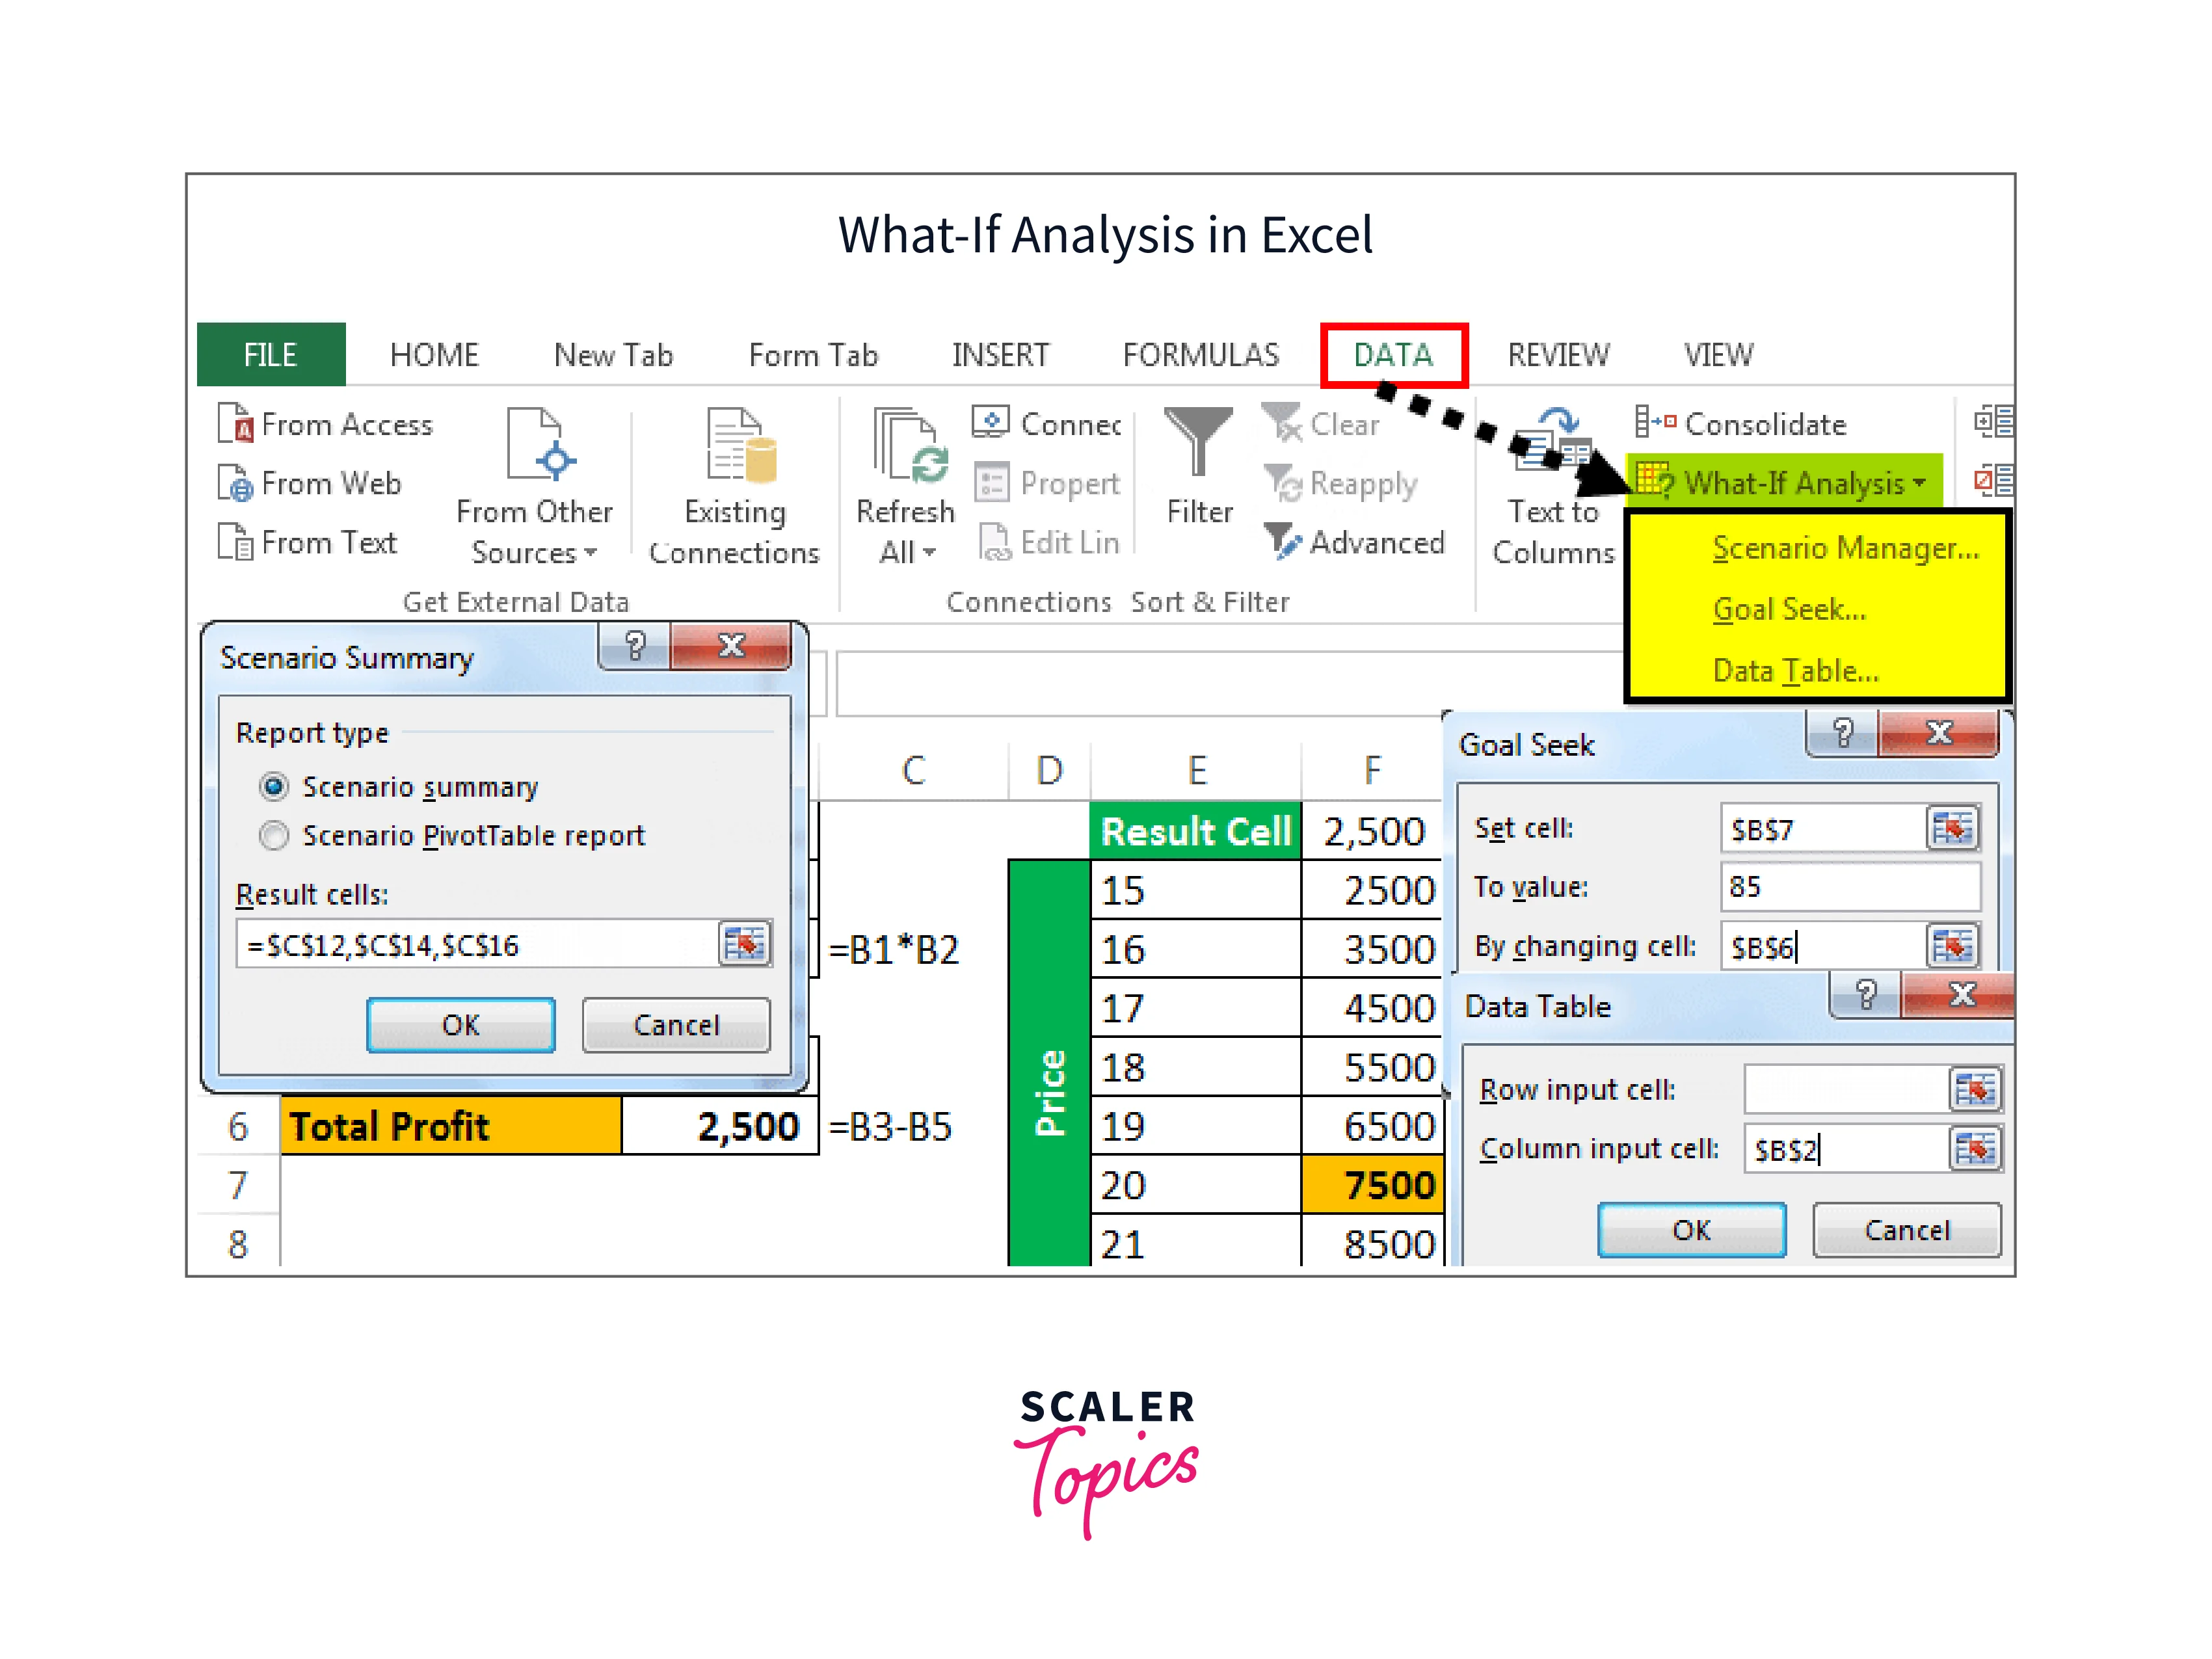
Excel is a powerful tool that is widely used for data analysis and financial modelling. One of the most useful features is What-if analysis in Excel, which allow users to explore different scenarios and see how changes in one variable affect other variables in a model. These what-if analysis tools in Excel are particularly useful for financial modelling, budgeting, and forecasting, where it is important to understand how changes in assumptions or inputs will affect the overall outcome of a model. This article will provide an overview of the different what-if analysis tools available in Excel, including the Scenario Manager, Goal Seek, and Data Tables.
Introduction to What-if Analysis
Excel is an extremely powerful tool that has become the industry standard for data analysis, financial modelling, and forecasting. Its what-if analysis tools, which give users a way to check how changes to one variable would impact other variables within a model, are one of the main factors contributing to its popularity. These tools are quite helpful in a variety of situations, but financial modelling, budgeting, and forecasting are three areas where they shine. That is why learning what is what-if analysis in Excel and how to use what-if analysis in Excel is important
The process of developing a mathematical representation of a financial situation or system is known as financial modelling. It consists of creating models that can be used to forecast a company's, project's, or investment's performance. Financial models sometimes take a variety of factors into account, including market trends, interest rates, revenue, and costs. Making informed business decisions requires having a thorough understanding of how adjustments to these factors can affect a model's ultimate result.
The what-if analysis in Excel gives users a way to investigate many possibilities and examine how adjustments to the input values affect a model's output. Excel can be used, for instance, by a financial analyst to simulate the financial performance of a company in various market scenarios. The analyst can investigate how variations in these variables will affect the profitability of the business by adjusting variables like revenue growth, cost of products sold, and interest rates.
Excel's what-if analysis tools capabilities are quite helpful for budgeting and forecasting in addition to financial modelling. While forecasting involves projecting future patterns based on historical data, budgeting entails creating a strategy for how to allocate resources over a given period. In both situations, it is essential to comprehend how changes in input values may impact a model's overall result to make wise judgments.
Excel can also be used by a forecaster to simulate how various economic scenarios will affect the financial performance of a company. The forecaster can investigate how various economic scenarios would affect the company's income, expenses, and profitability by adjusting variables like GDP growth, inflation rates, and interest rates.
In this article, we will focus on three of the most commonly used what-if analysis tools
- Scenario Manager:
Scenario Manager is a tool in Excel that allows users to create, save, and compare different sets of input values in a model, making it easy to explore and compare different scenarios. - Goal Seek:
Goal Seek is an Excel tool that allows users to find the input value needed to achieve a specific goal, by adjusting a related input value. - Data Tables:
Data Tables in Excel are a tool that allows users to explore how changes in two or more input values will affect the output of a formula, by creating a table that shows the results of different combinations of input values.
What-if Analysis Scenario Manager
What-if analysis tools Scenario Manager is a feature of Microsoft Excel that enables users to explore different outcomes based on different input values. Users can create multiple scenarios and compare them side by side, allowing them to make informed decisions based on the data. The tool is commonly used in financial planning, risk management, and other areas where decisions are based on complex models and data.
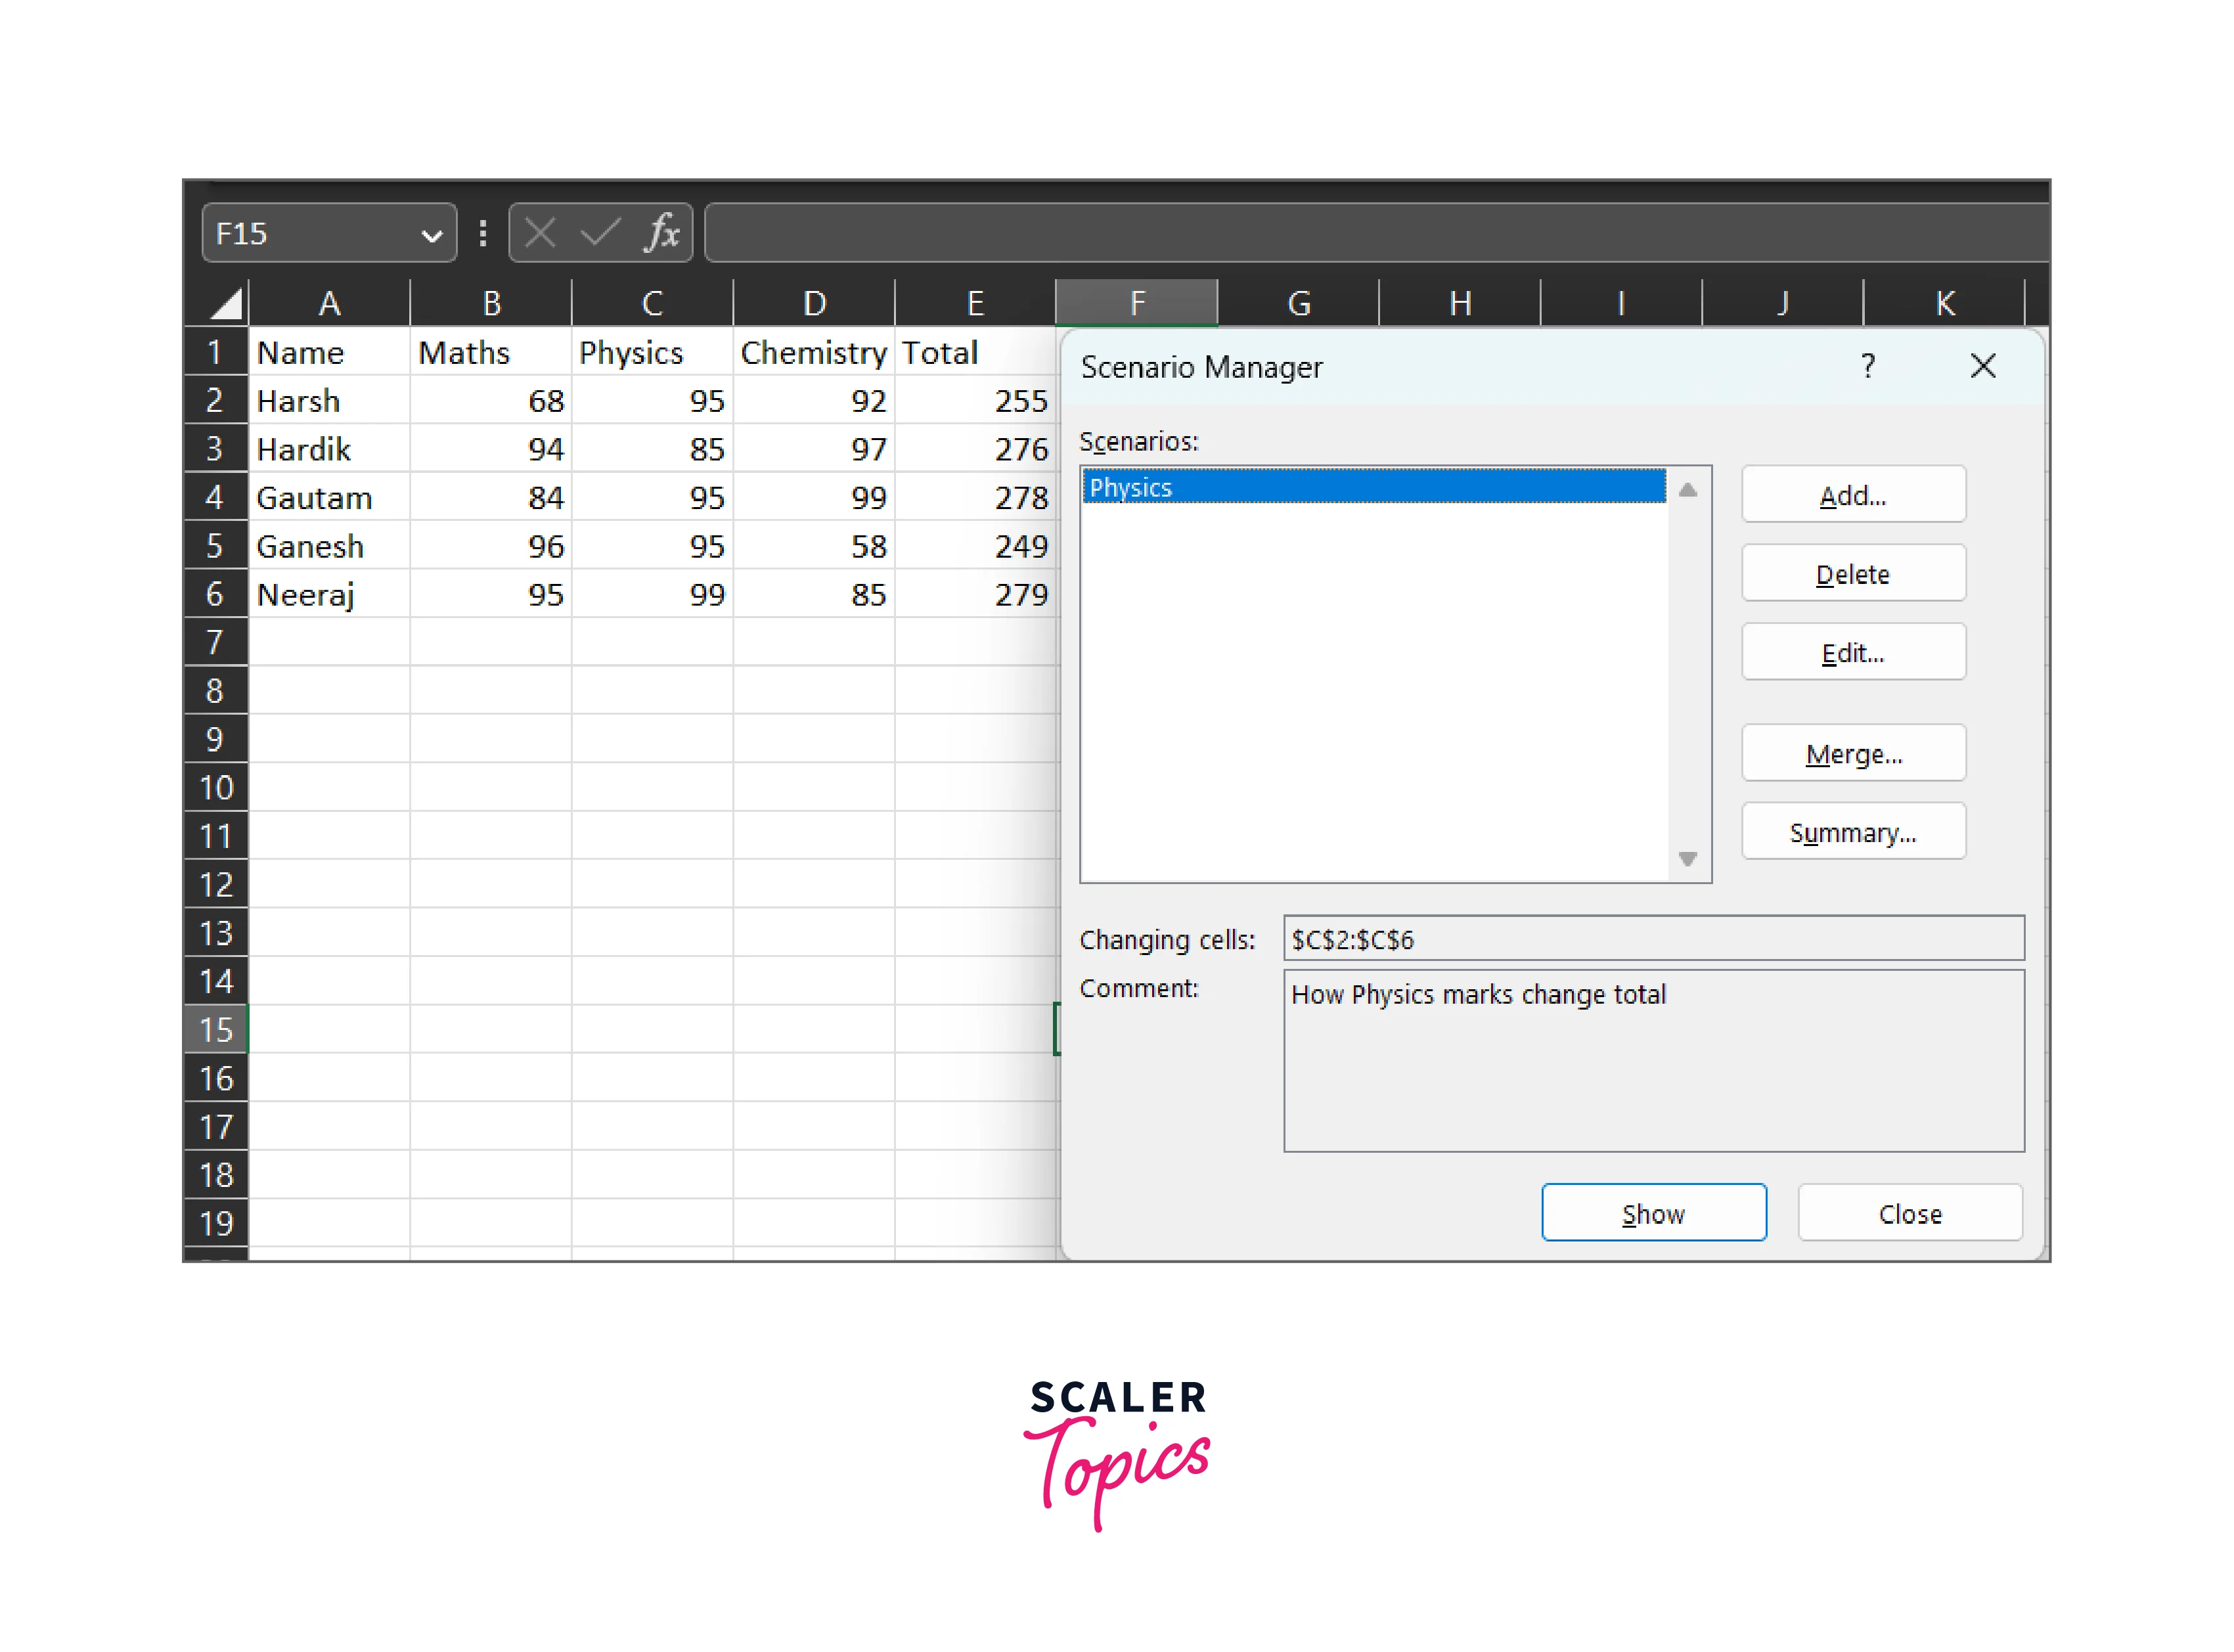
Using What-if analysis tools Scenario Manager is relatively easy, and it starts with creating a spreadsheet with the necessary data. Here's a step-by-step guide on how to use What-if analysis tool Scenario Manager:
-
Create a spreadsheet with the data you want to analyze. The data should be organized in columns and rows, with one row for each variable you want to analyze.
-
Identify the variable(s) that you want to analyze. These are the factors that can affect the outcome of the decision you want to make.
-
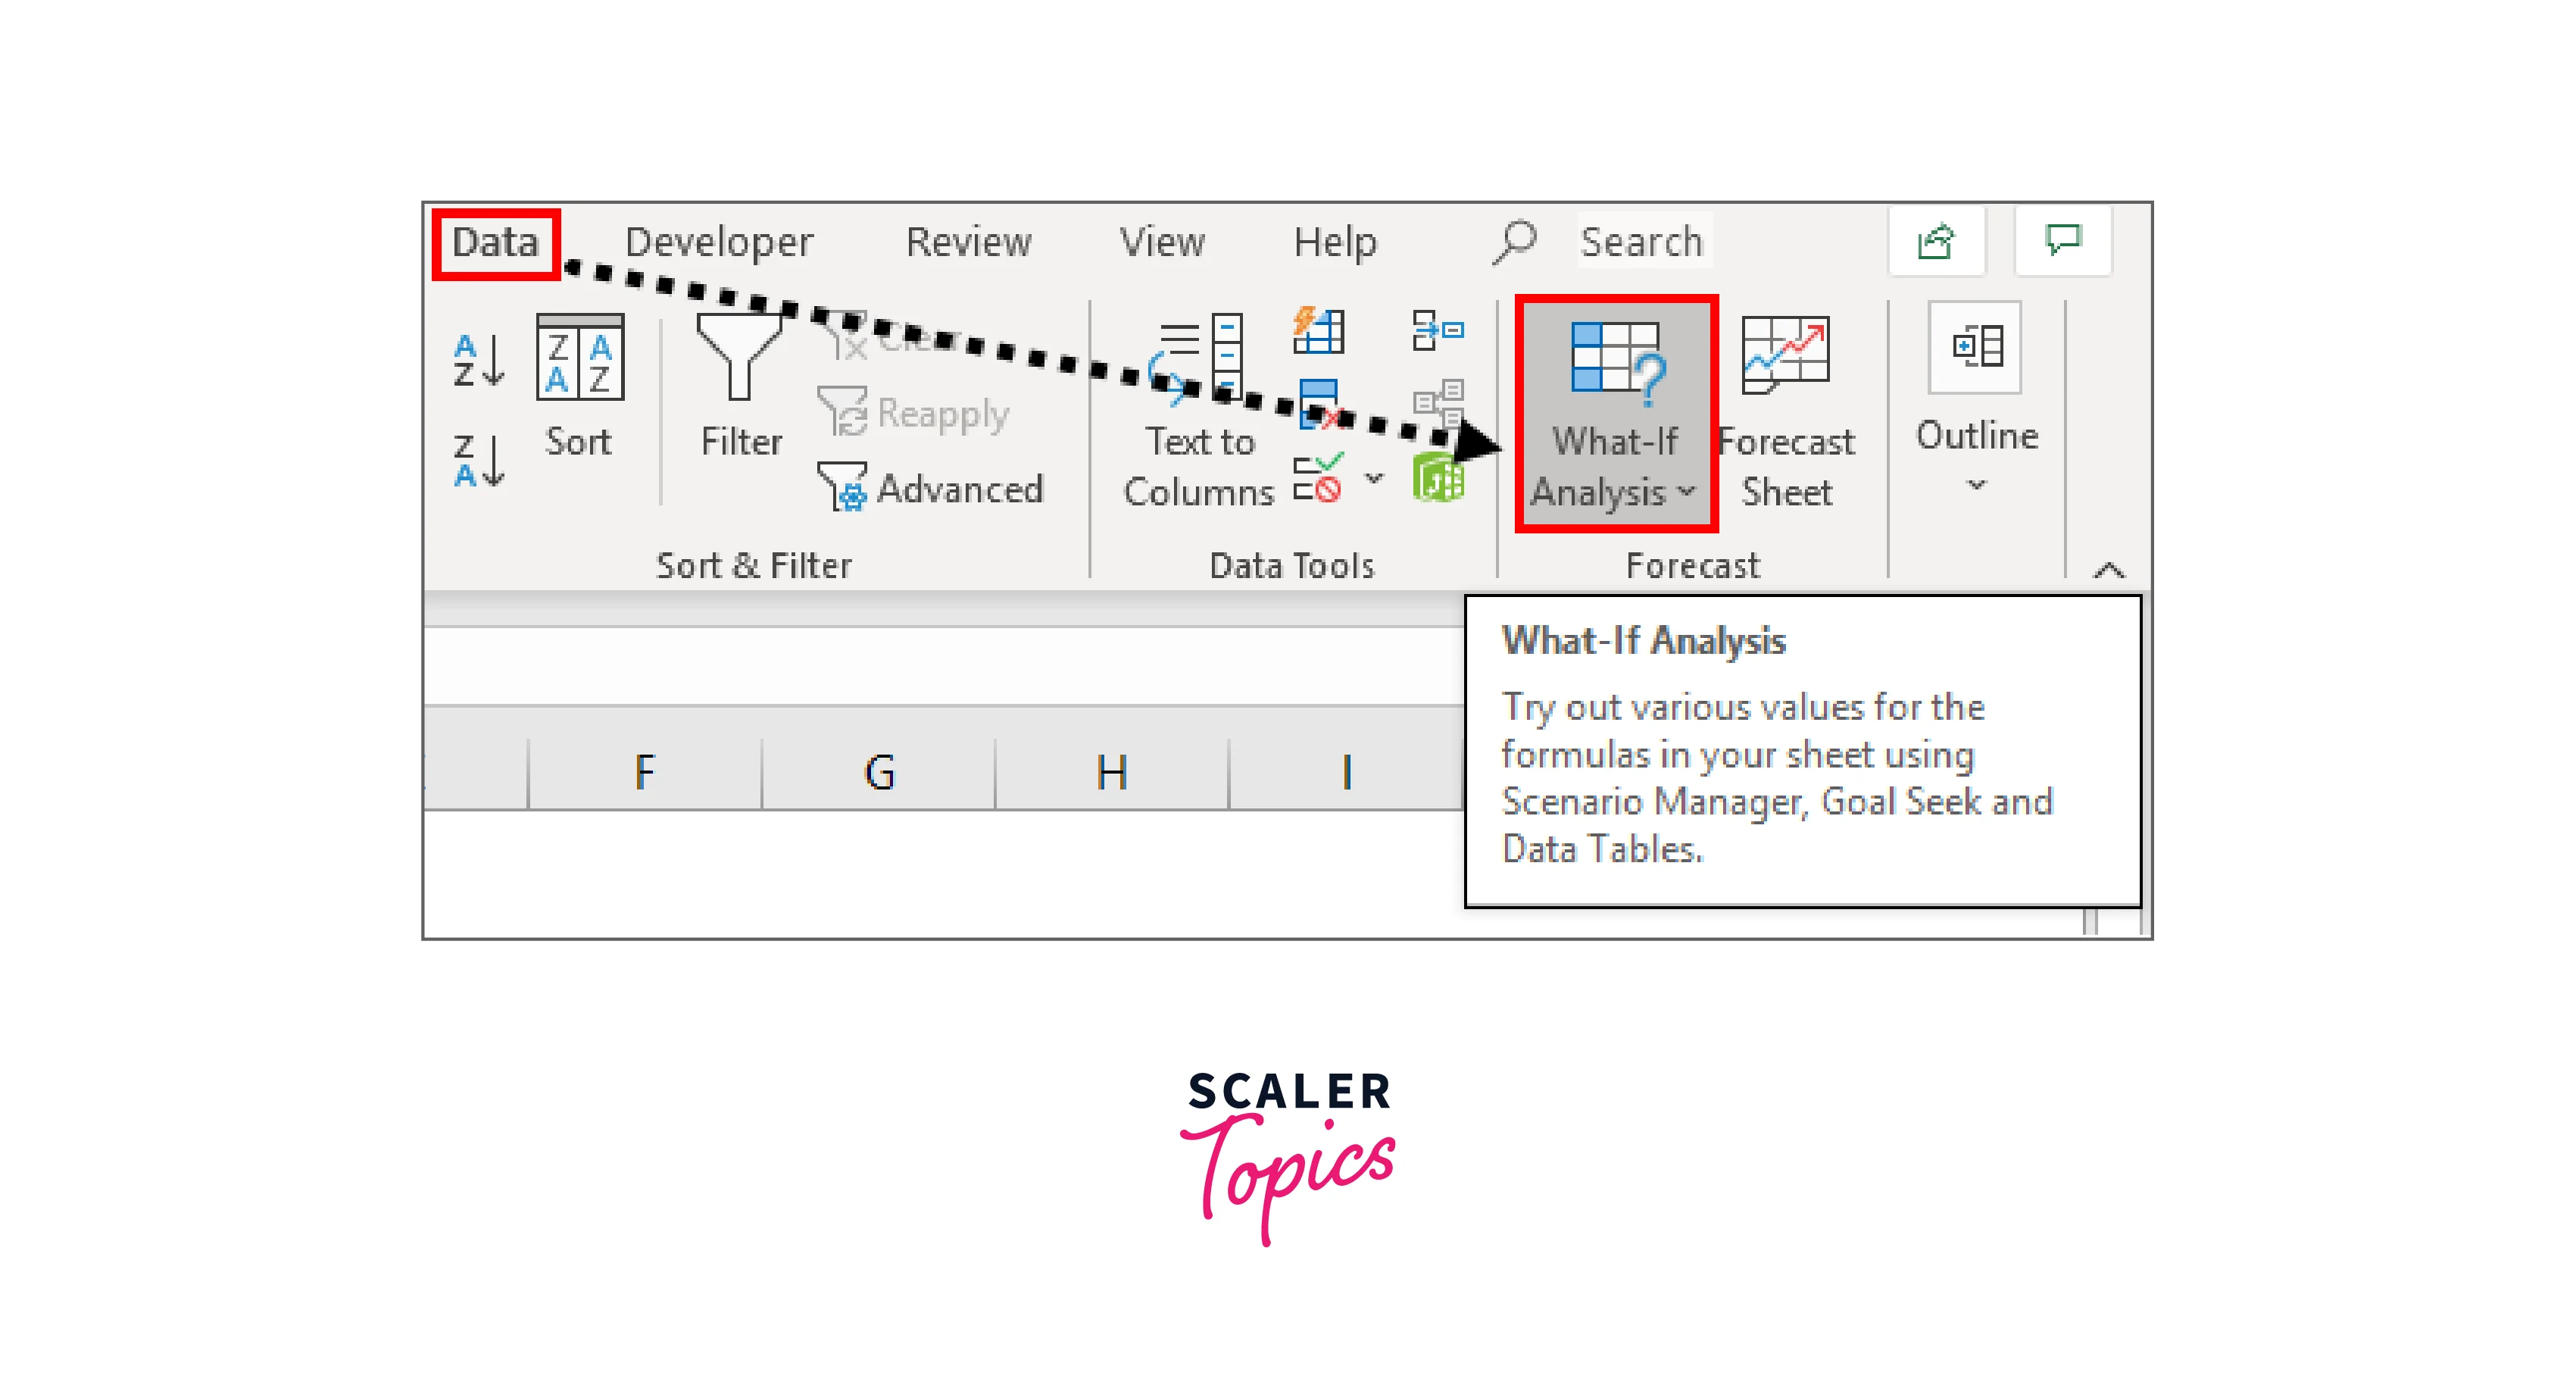
Select the "Data" tab in Excel and click on "What-if Analysis" from the "Forecast" group.
-
Choose "Scenario Manager" from the drop-down menu.
-
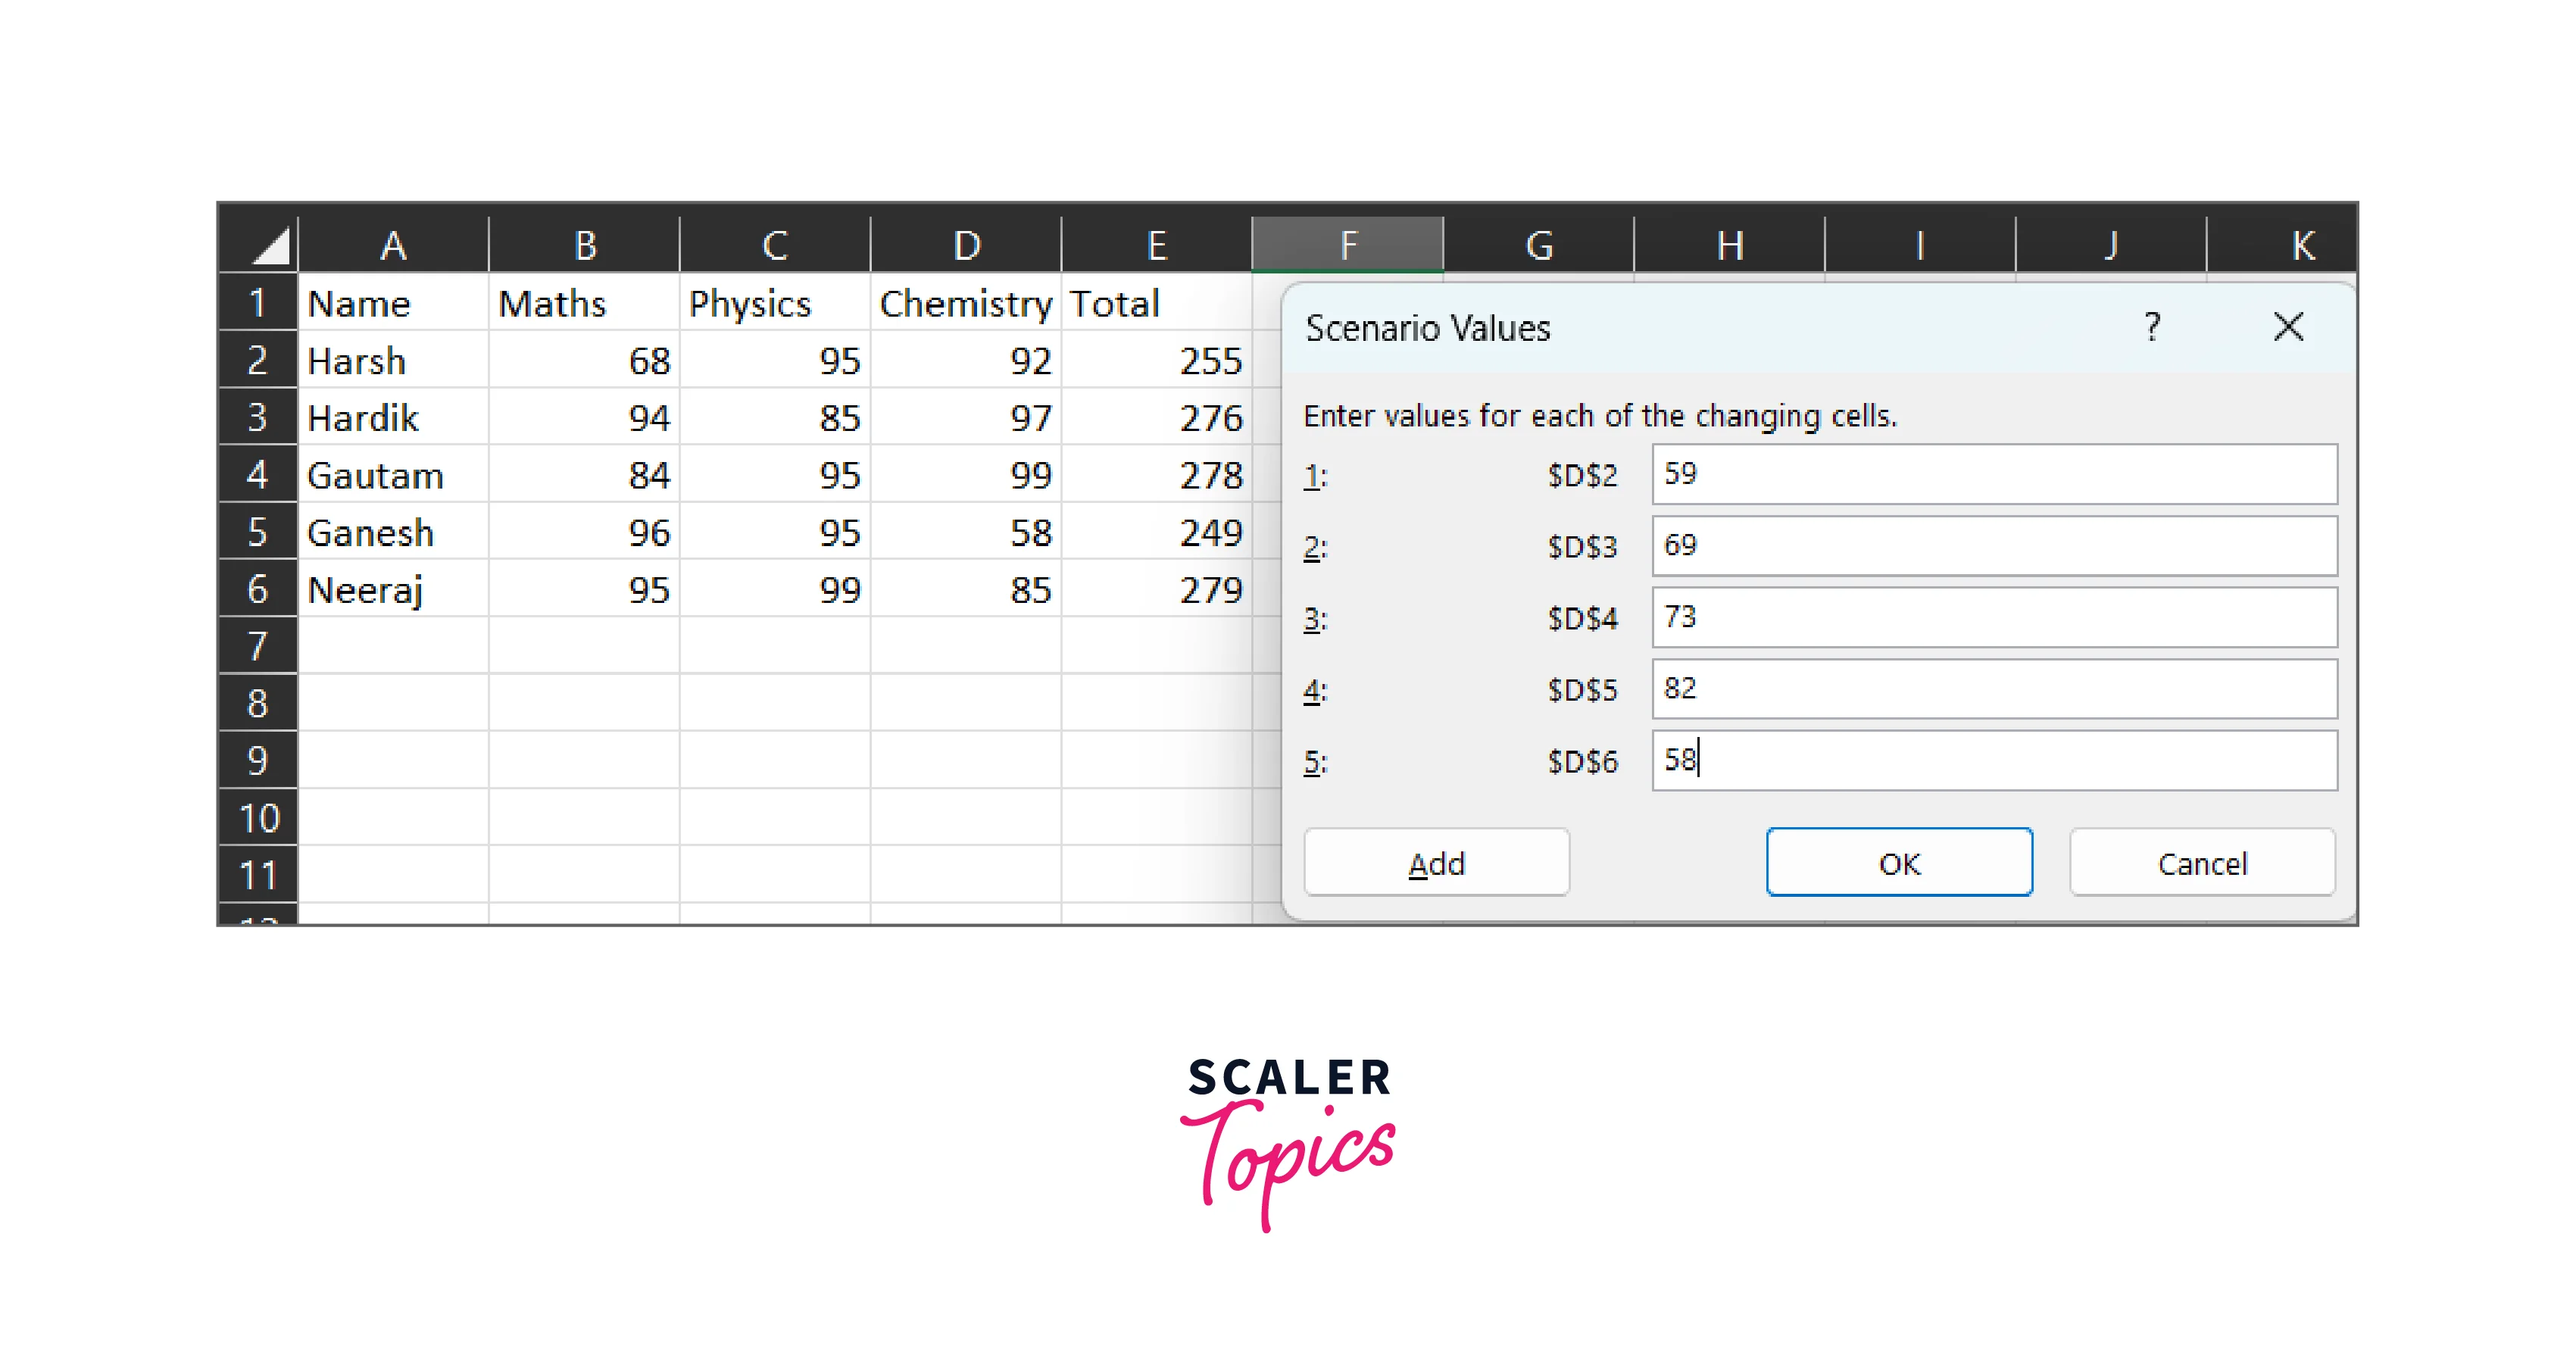
Click on "Add" to create a new scenario.
-
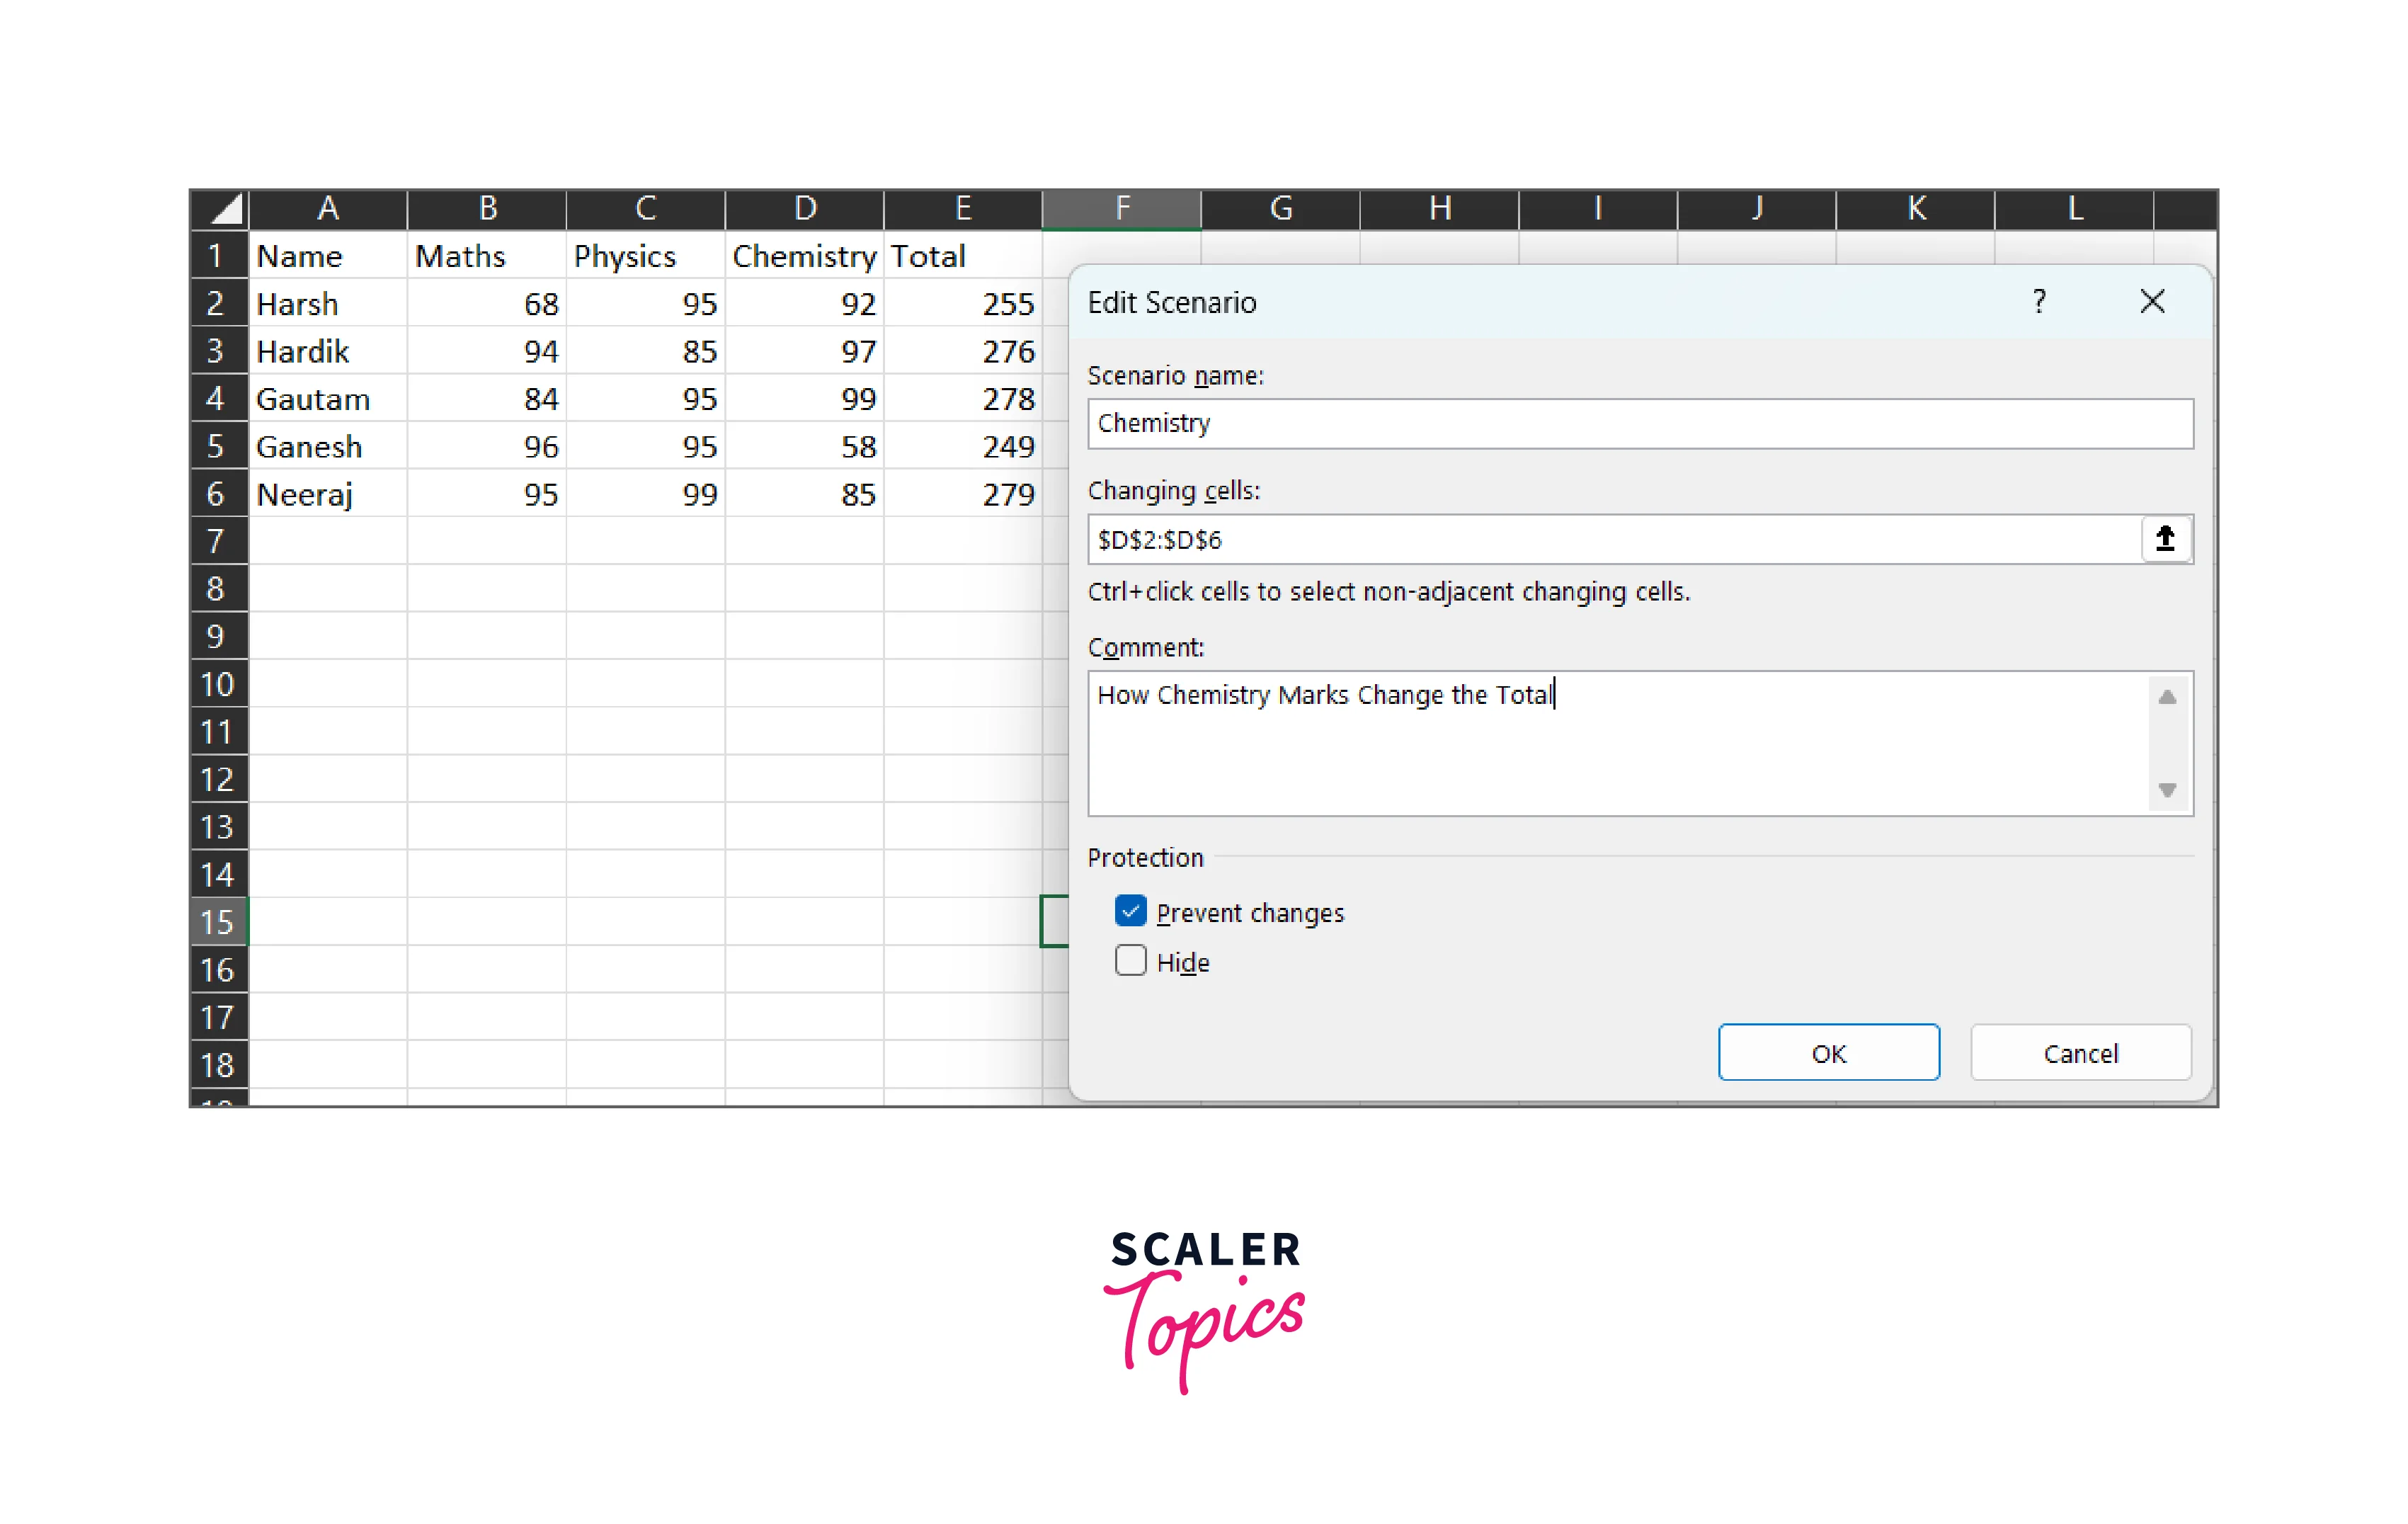
Enter a name for the scenario and select the cell(s) that contain the input values you want to change.
-
Enter the new value(s) for the input variable(s) in the "Value" field.
-
Click on "OK" to save the scenario.
-
Repeat steps 5-8 to create additional scenarios.
-
To compare scenarios, go back to the "Scenario Manager" and select the scenarios you want to compare.
-
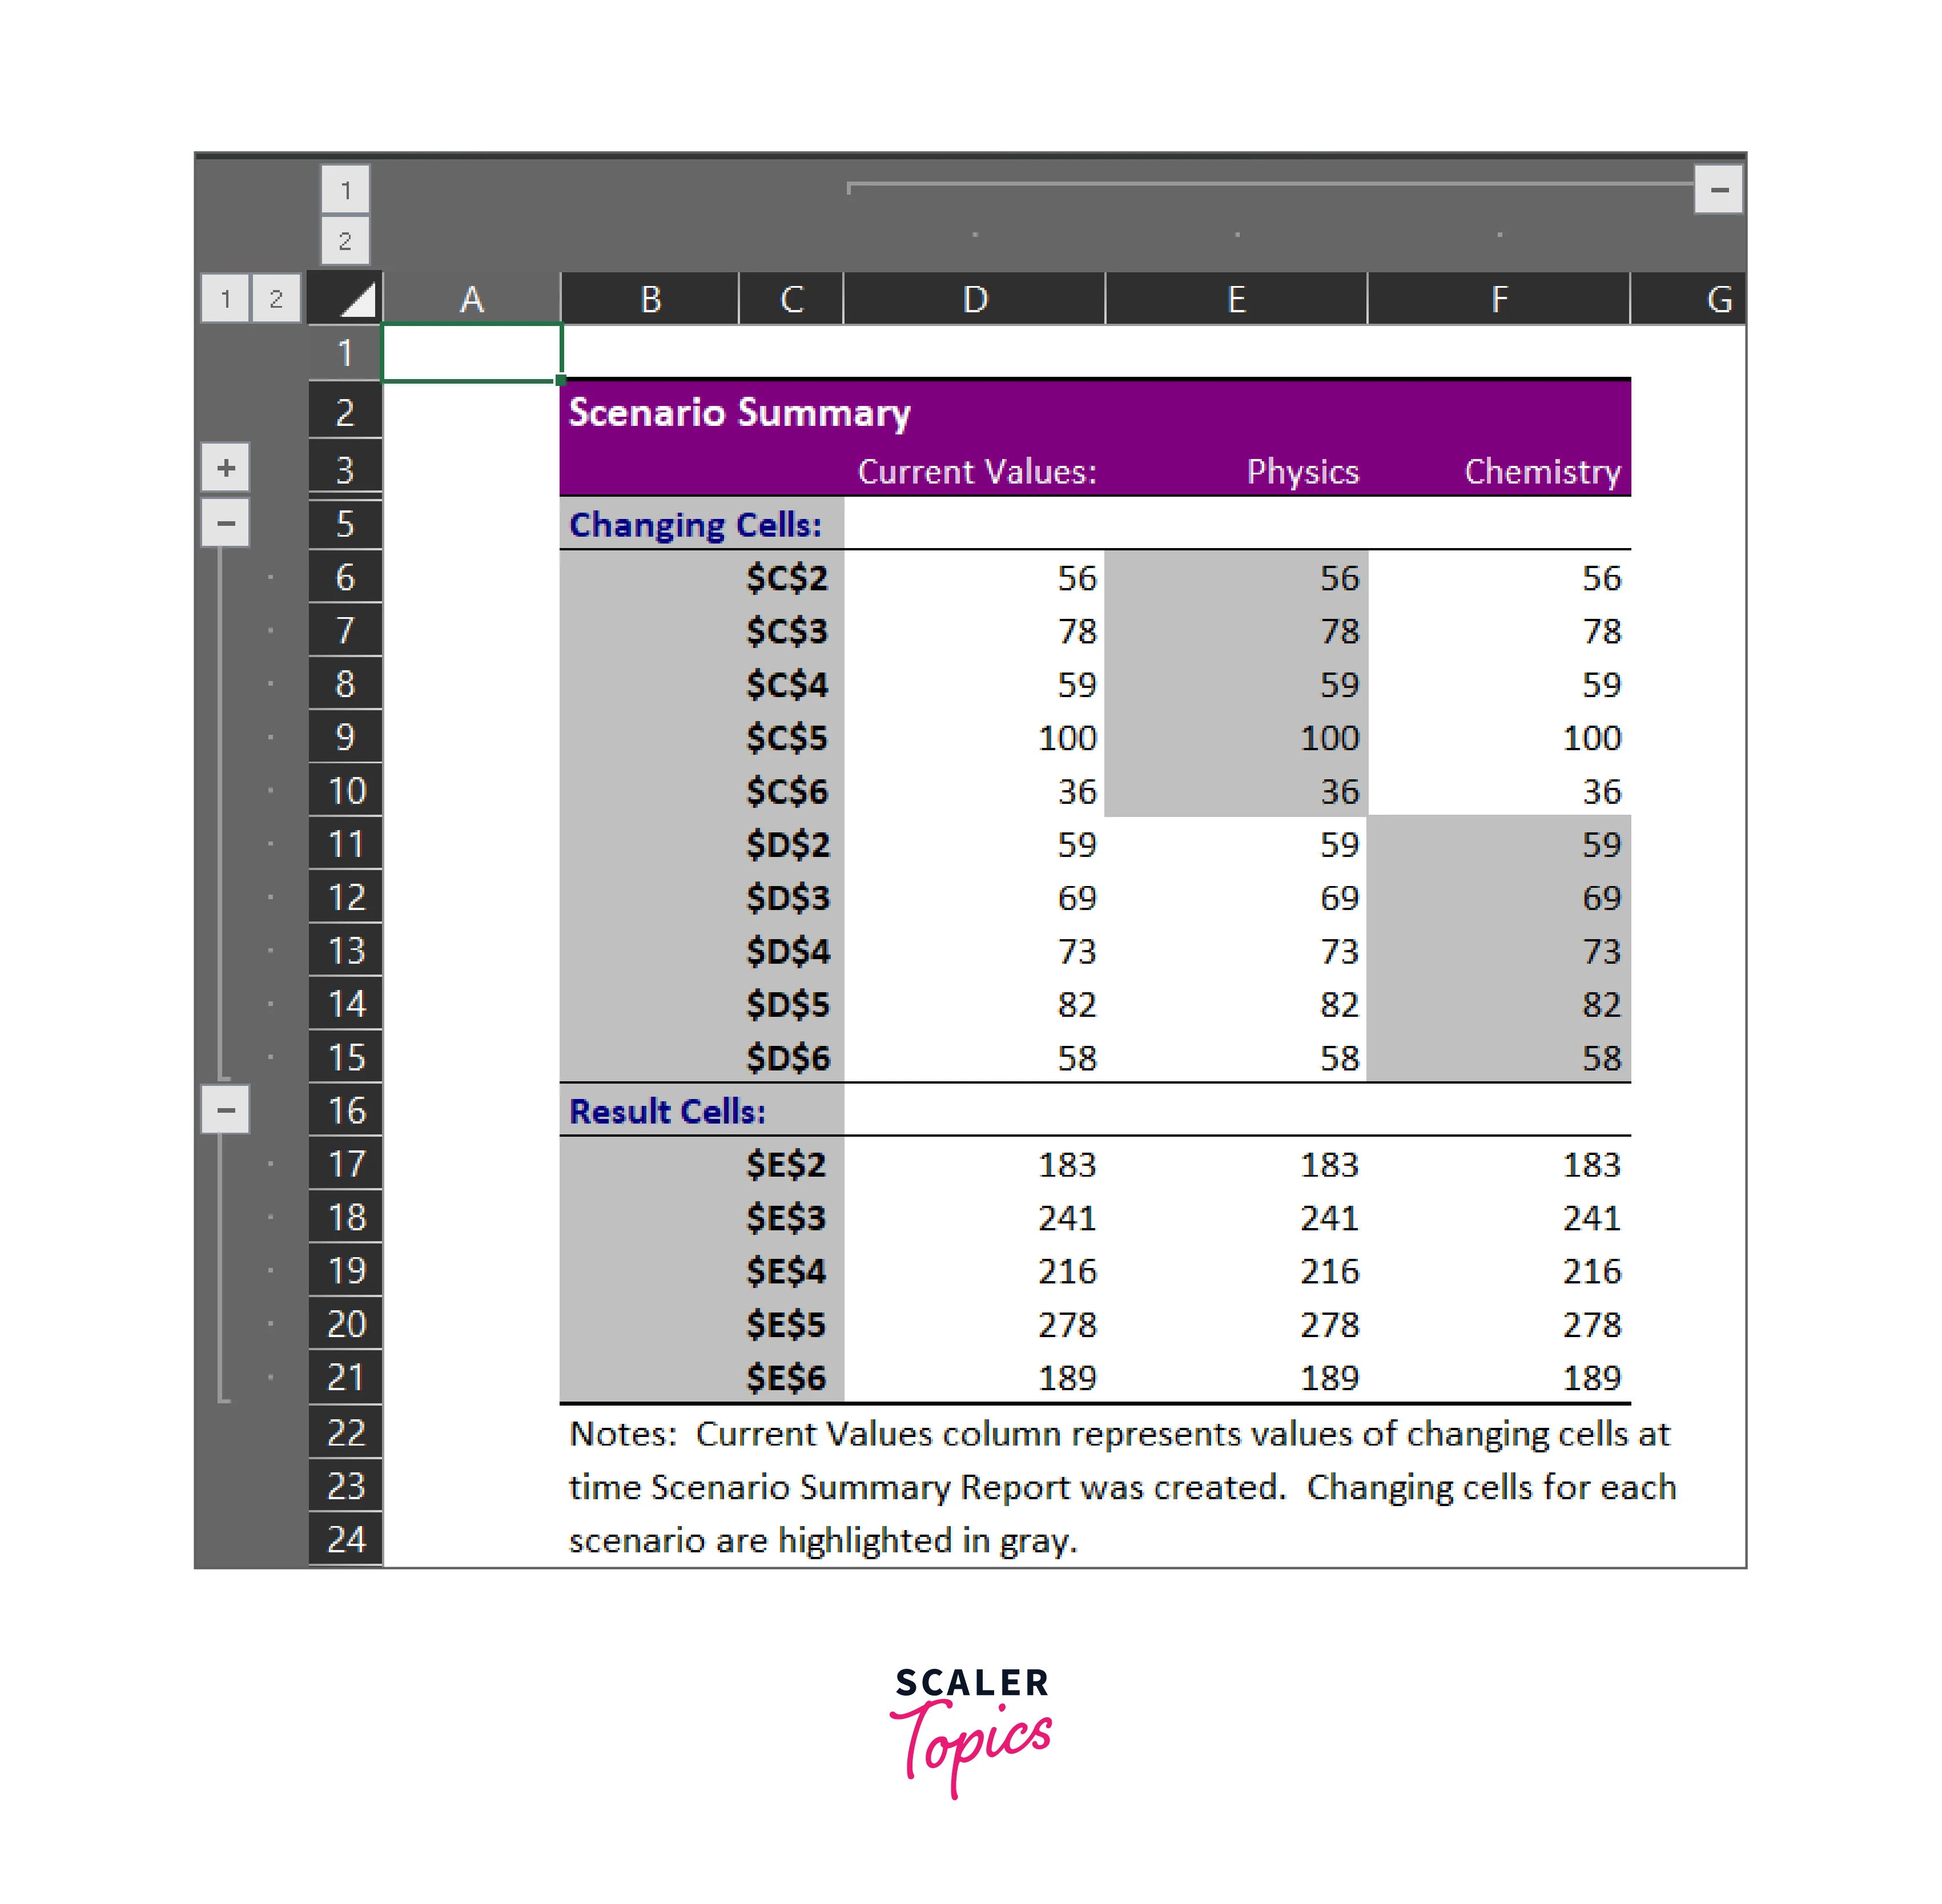
Click on "Summary" to create a summary report of the scenarios. The report will show the input variables for each scenario and the resulting output value.
-
Analyze the report and use the information to make an informed decision.
What-if Scenario Manager is a powerful tool that can help users make informed decisions based on data analysis. By creating different scenarios and exploring different outcomes, users can identify the best course of action for a particular situation.
What-if Analysis Goal Seek in Excel
What-if Goal Seek is a What-if Analysis tool in Excel that allows users to determine the input value needed to achieve a specific output value. The tool is particularly useful for solving unknown input values.
For example, if a user wants to achieve a specific profit margin, they can use What-if Goal Seek to determine the sales volume needed to achieve that profit margin.
What-if analysis tool Goal Seek is commonly used in financial modeling, forecasting, and decision-making. The tool enables users to determine the input values needed to achieve specific output values, allowing them to make informed decisions based on data analysis. Here is a step-by-step instruction on how to use this what-if analysis tool in Excel:
Step - 1: Set up the Spreadsheet
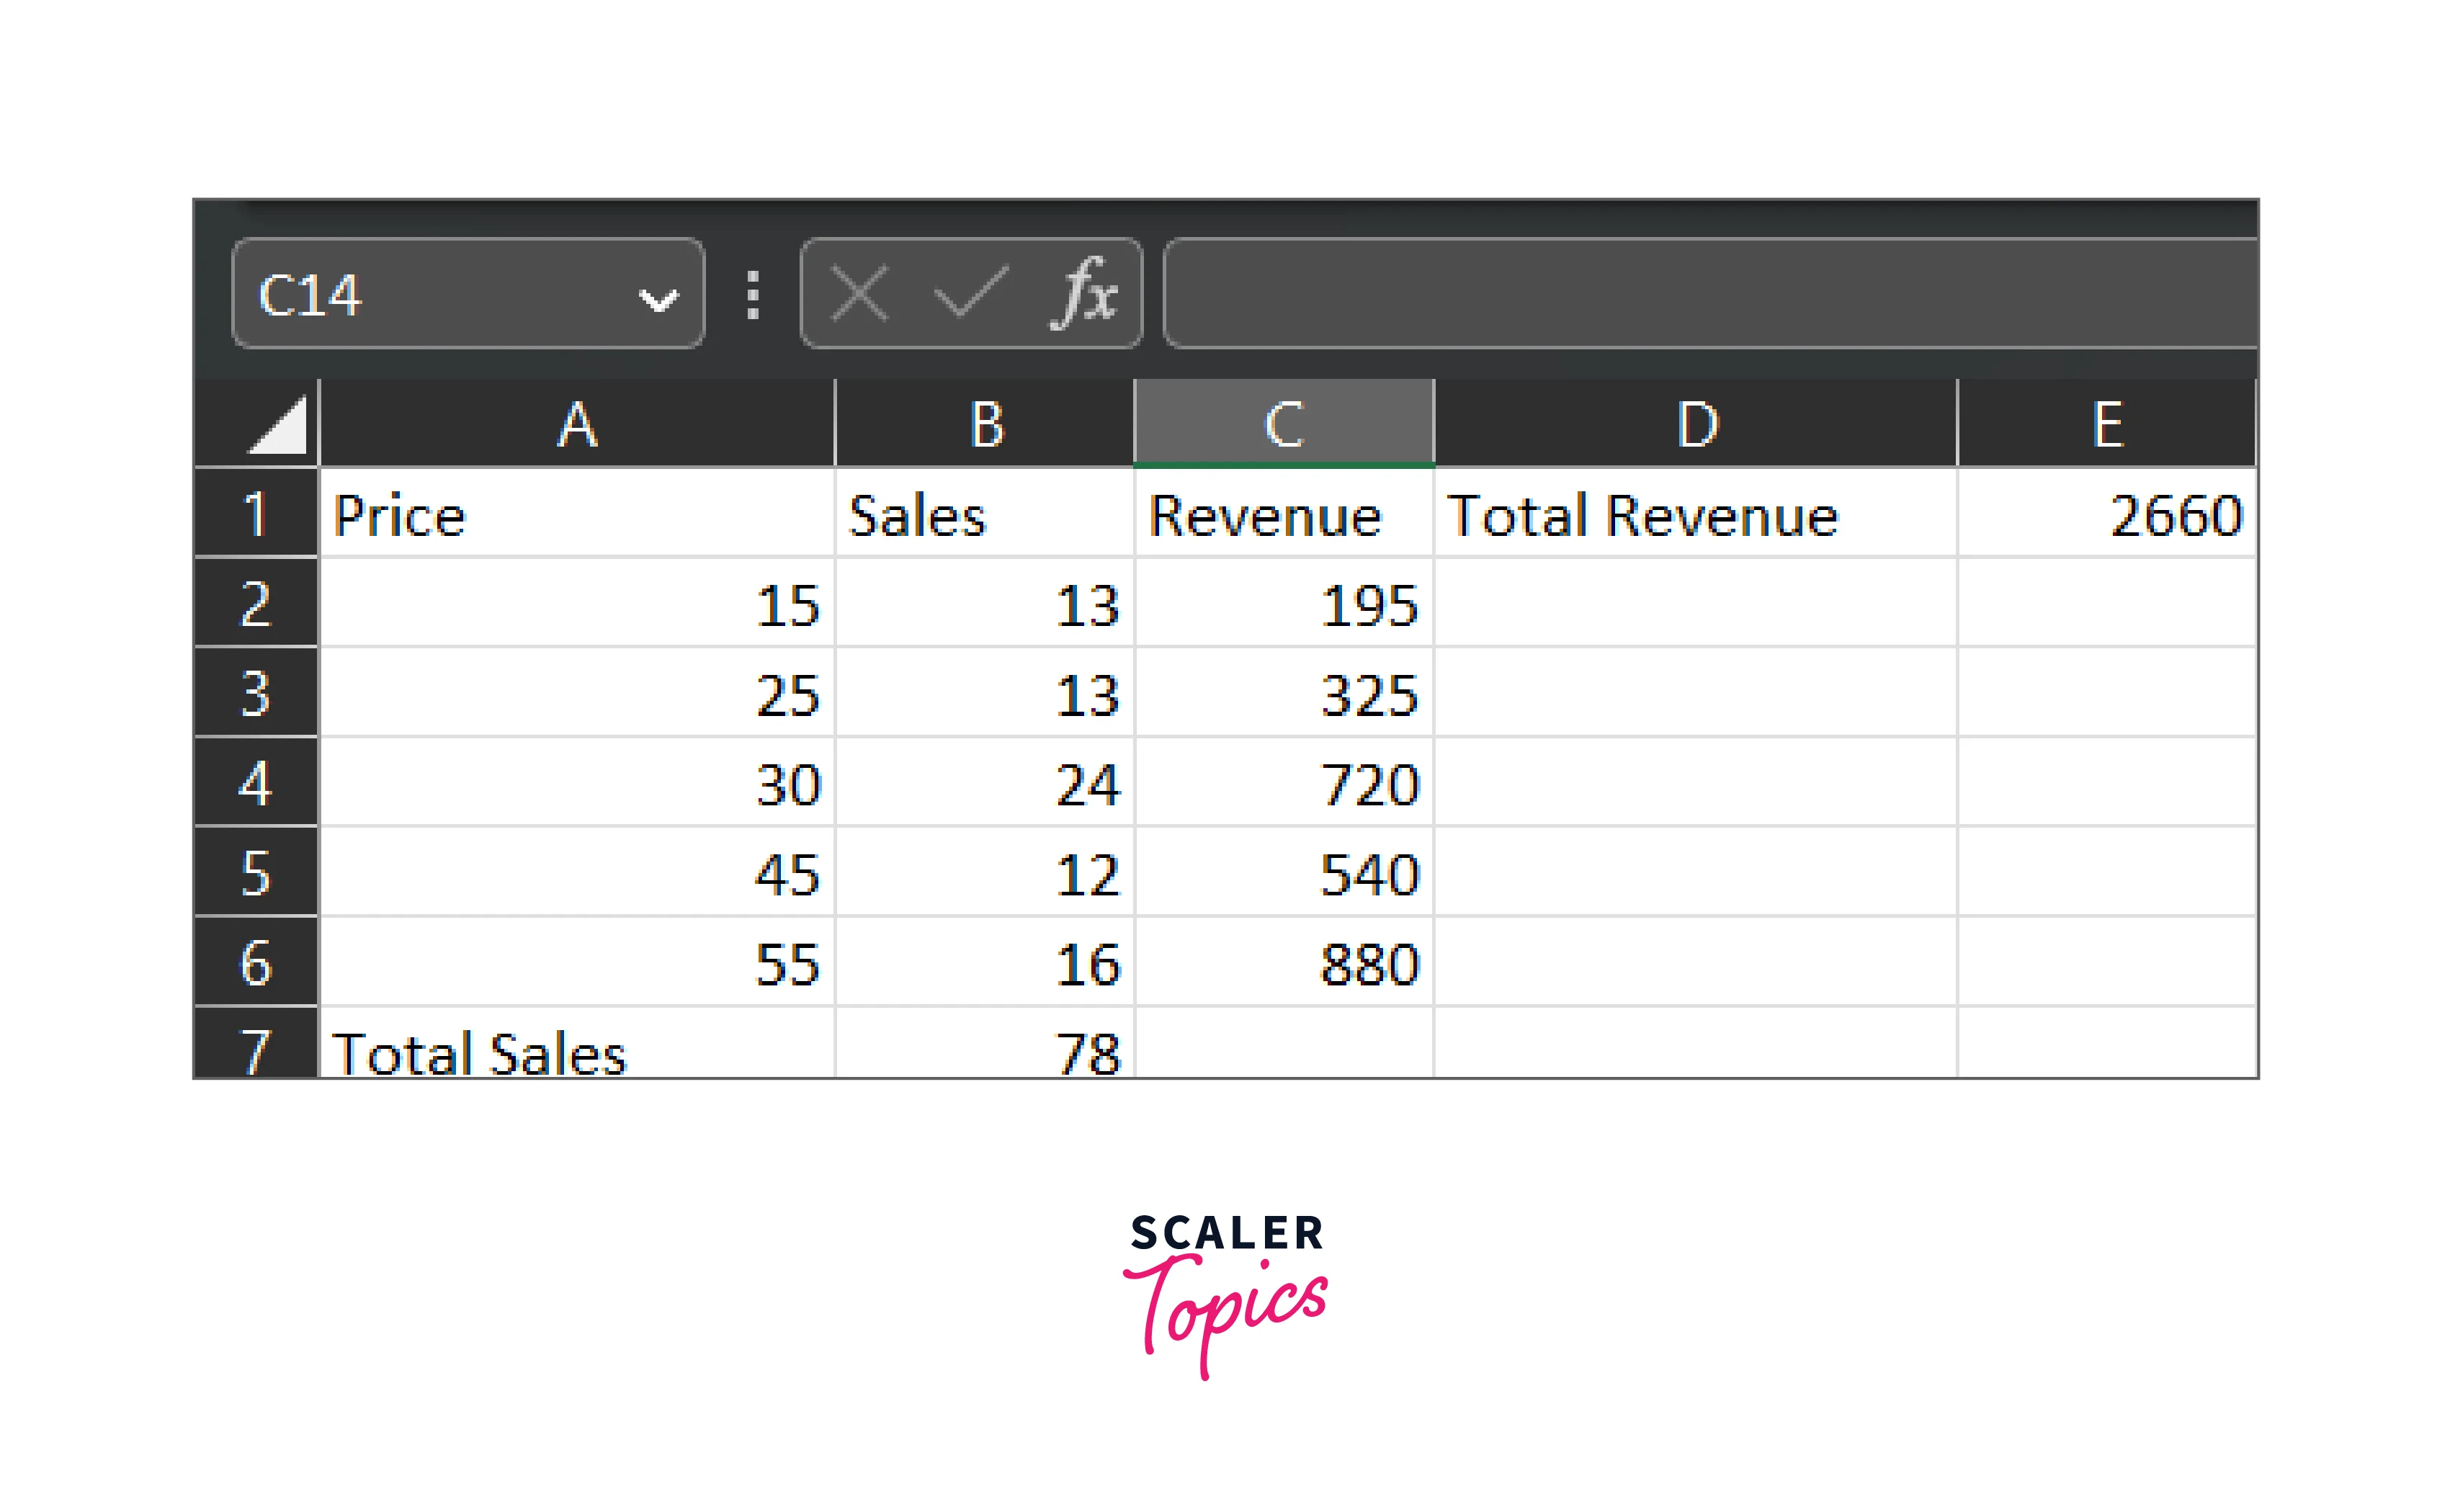
- The first step in using What-if Goal Seek in Excel is to set up the spreadsheet.
- This involves creating a table that shows the input values, the output values, and the target value.
- In this example, we will use a simple spreadsheet that calculates the total revenue based on the price and the sales volume.
Step - 2: Identify the Target Value
- The next step is to identify the target value. In this example, our target value is a total revenue of 5000.
Step - 3: Select the Goal Seek Tool
- To access the Goal Seek tool, go to the Data tab on the Excel ribbon and click on the What-if Analysis button.
- Then, select Goal Seek from the drop-down menu.
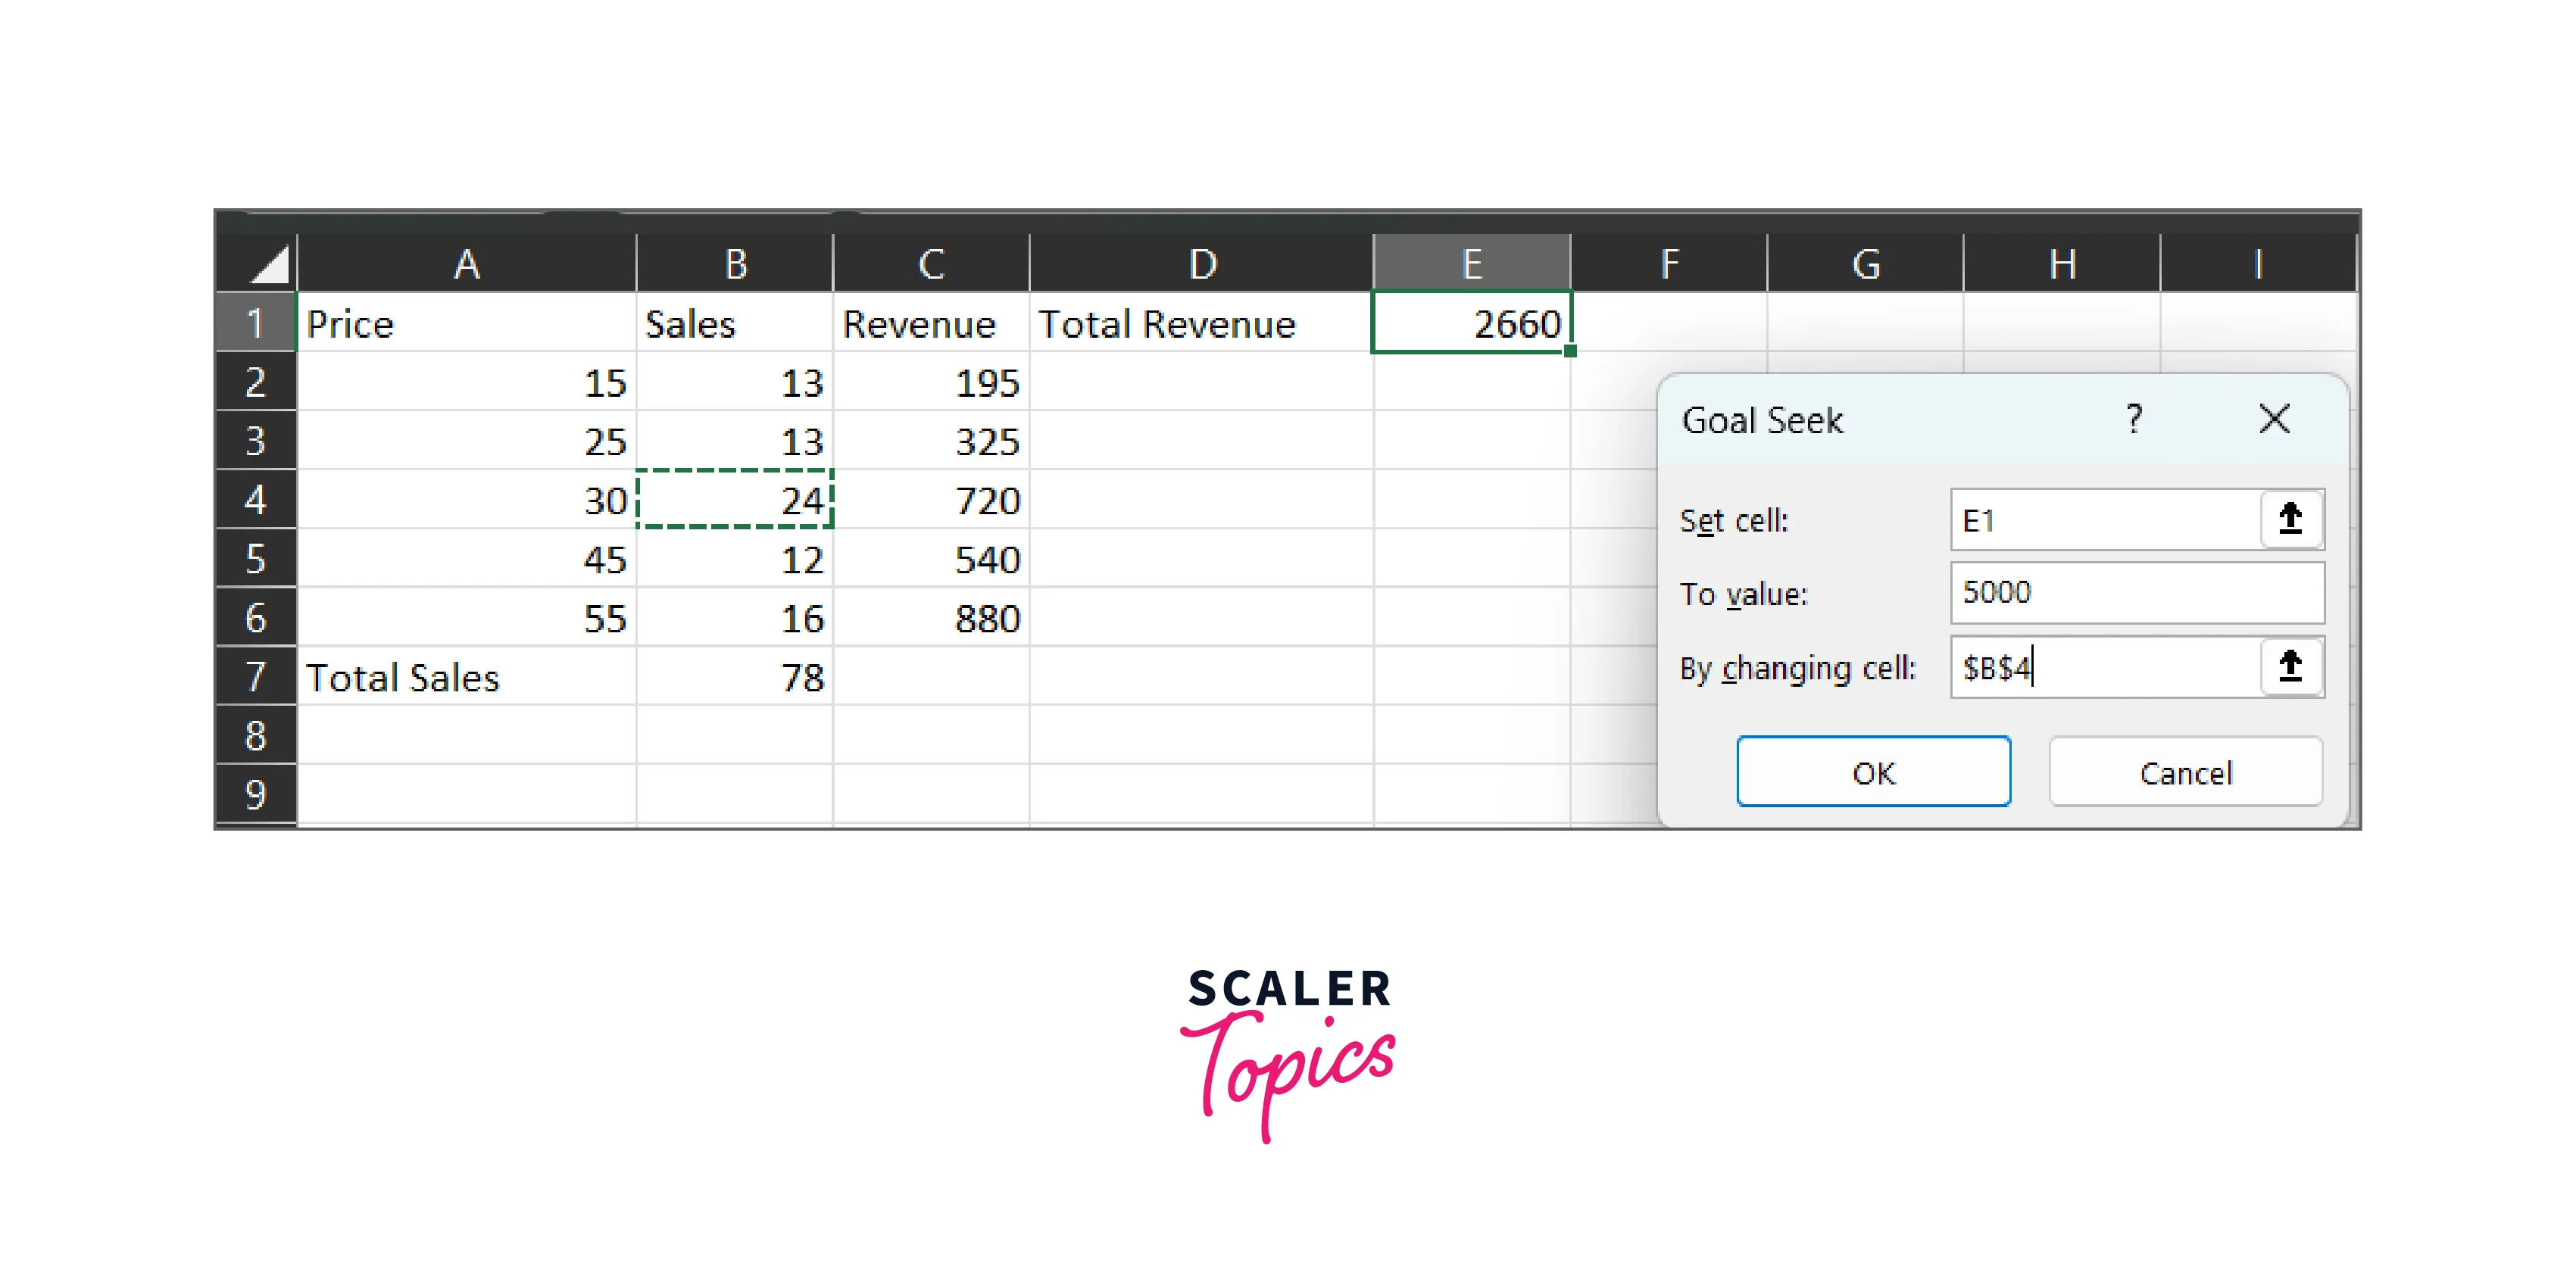
Step - 4: Set the Parameters
-
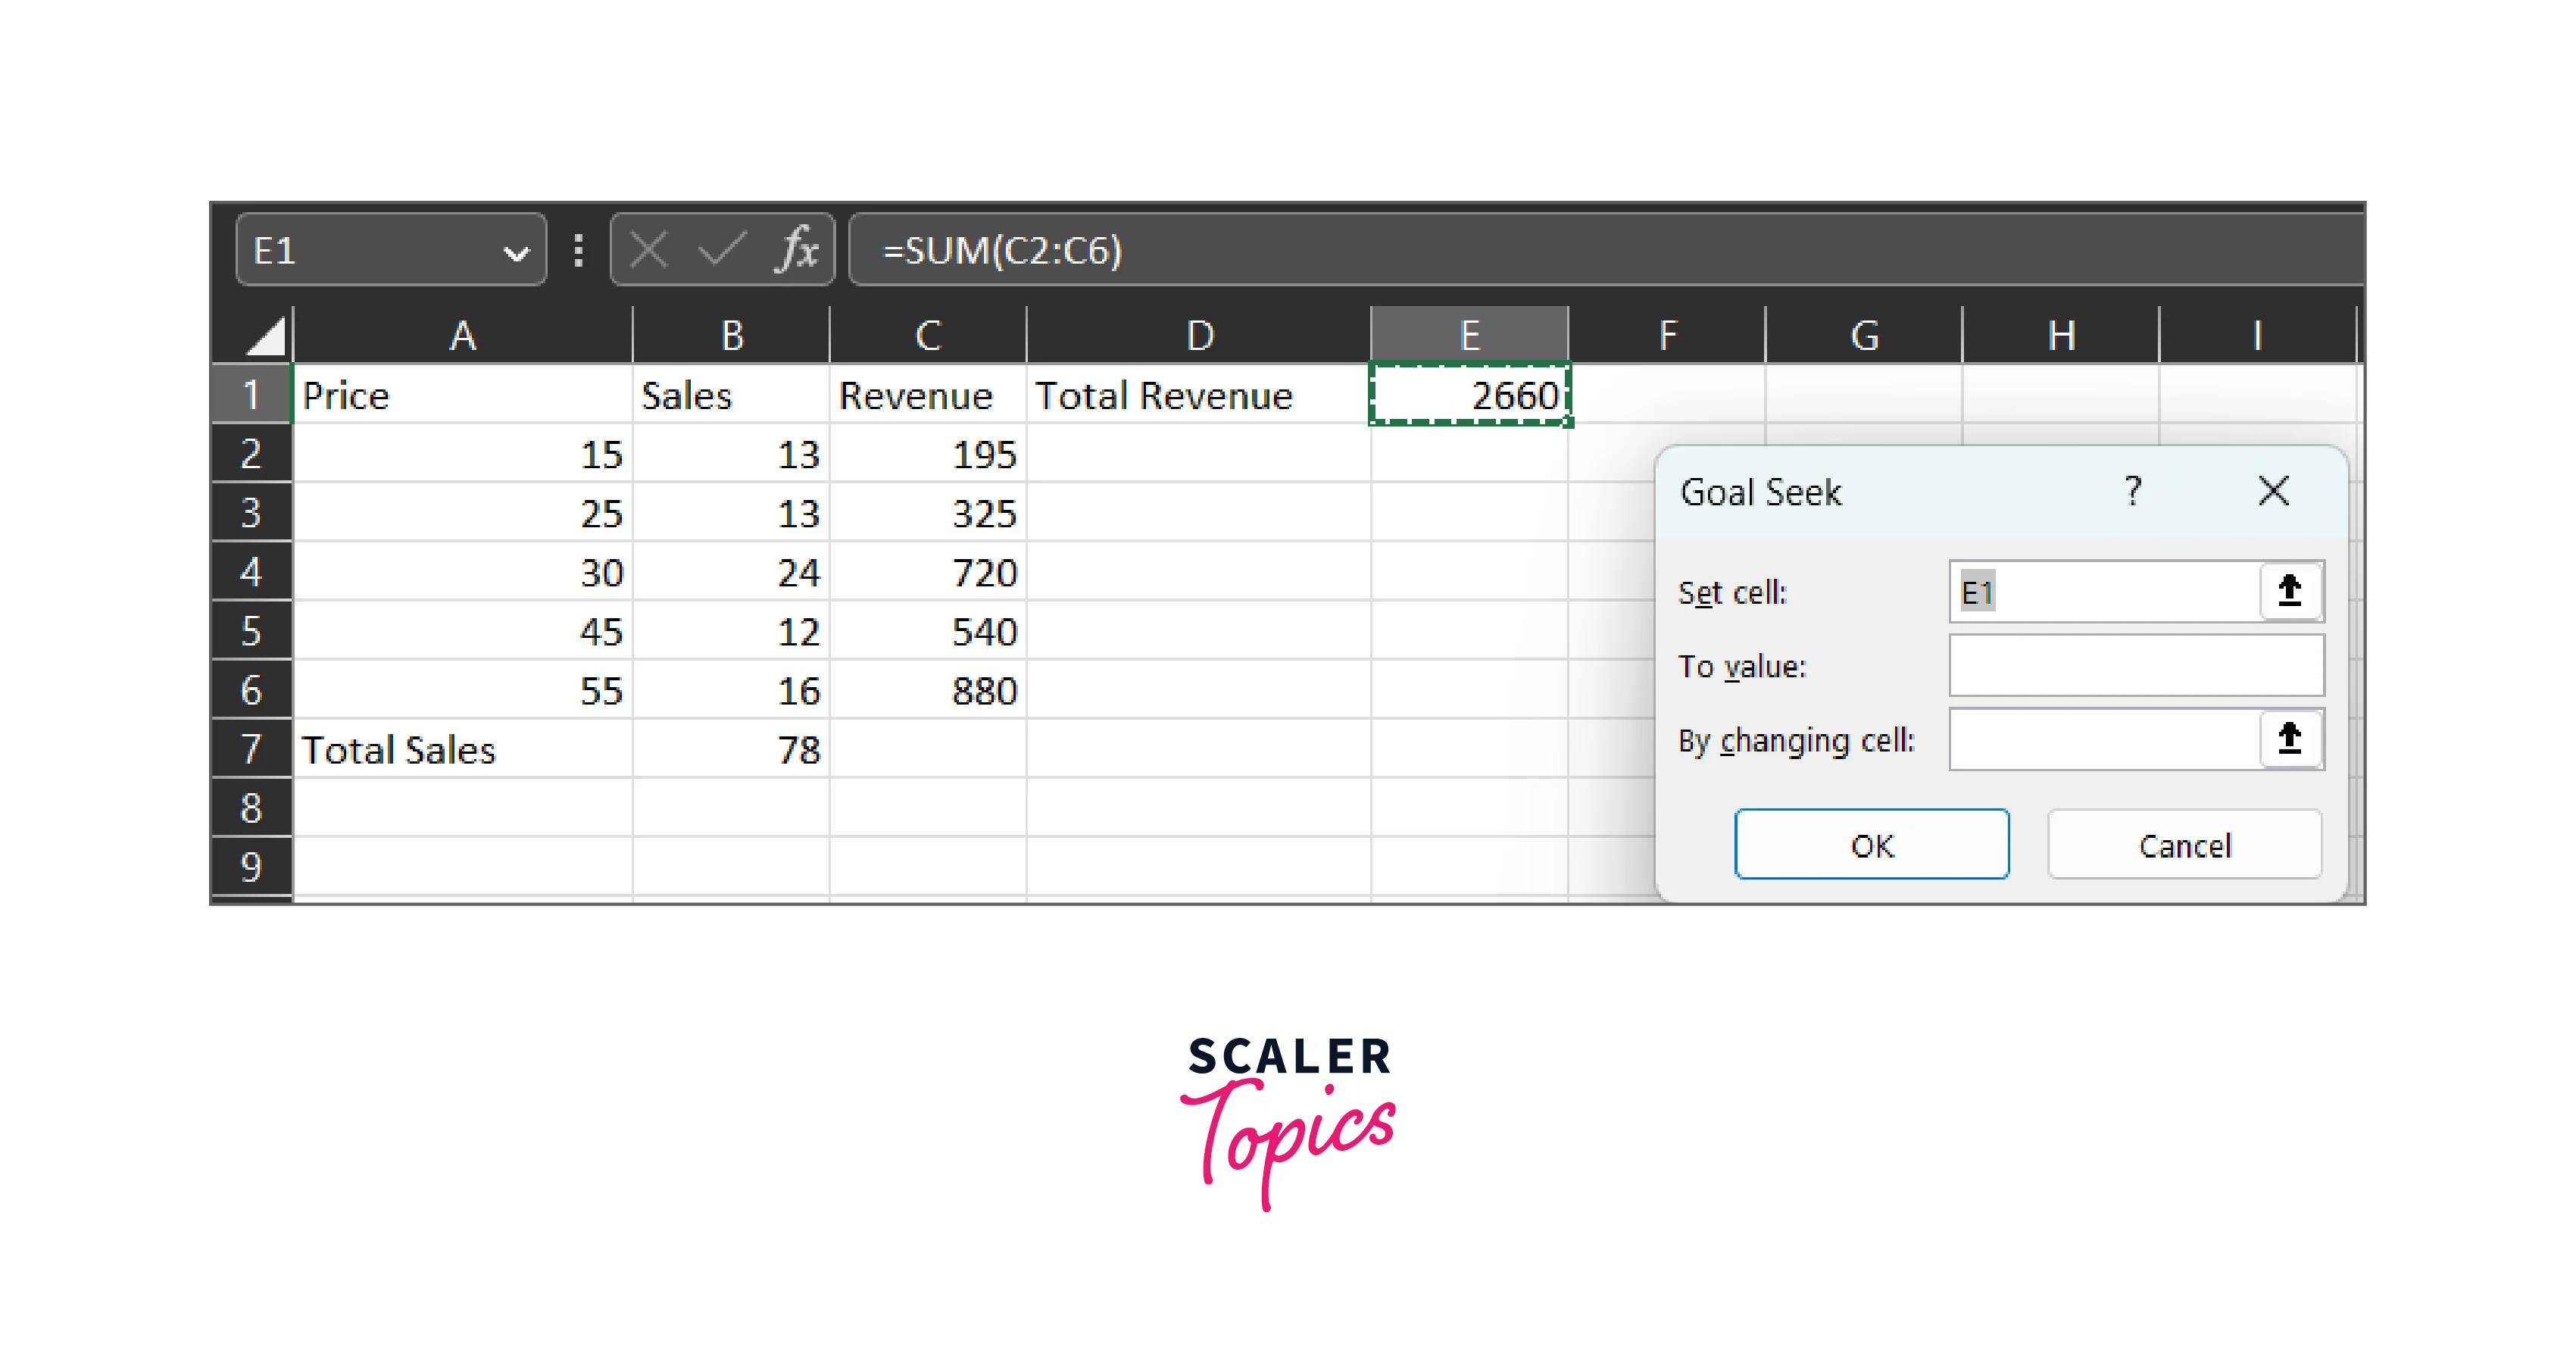
In the Goal Seek dialog box, set the parameters as follows:
- Set the "Set cell" field to the cell that contains the output value (total revenue).
- Set the "To value" field to the target value (5000).
- Set the "By changing cell" field to the cell that contains the input value (sales volume).
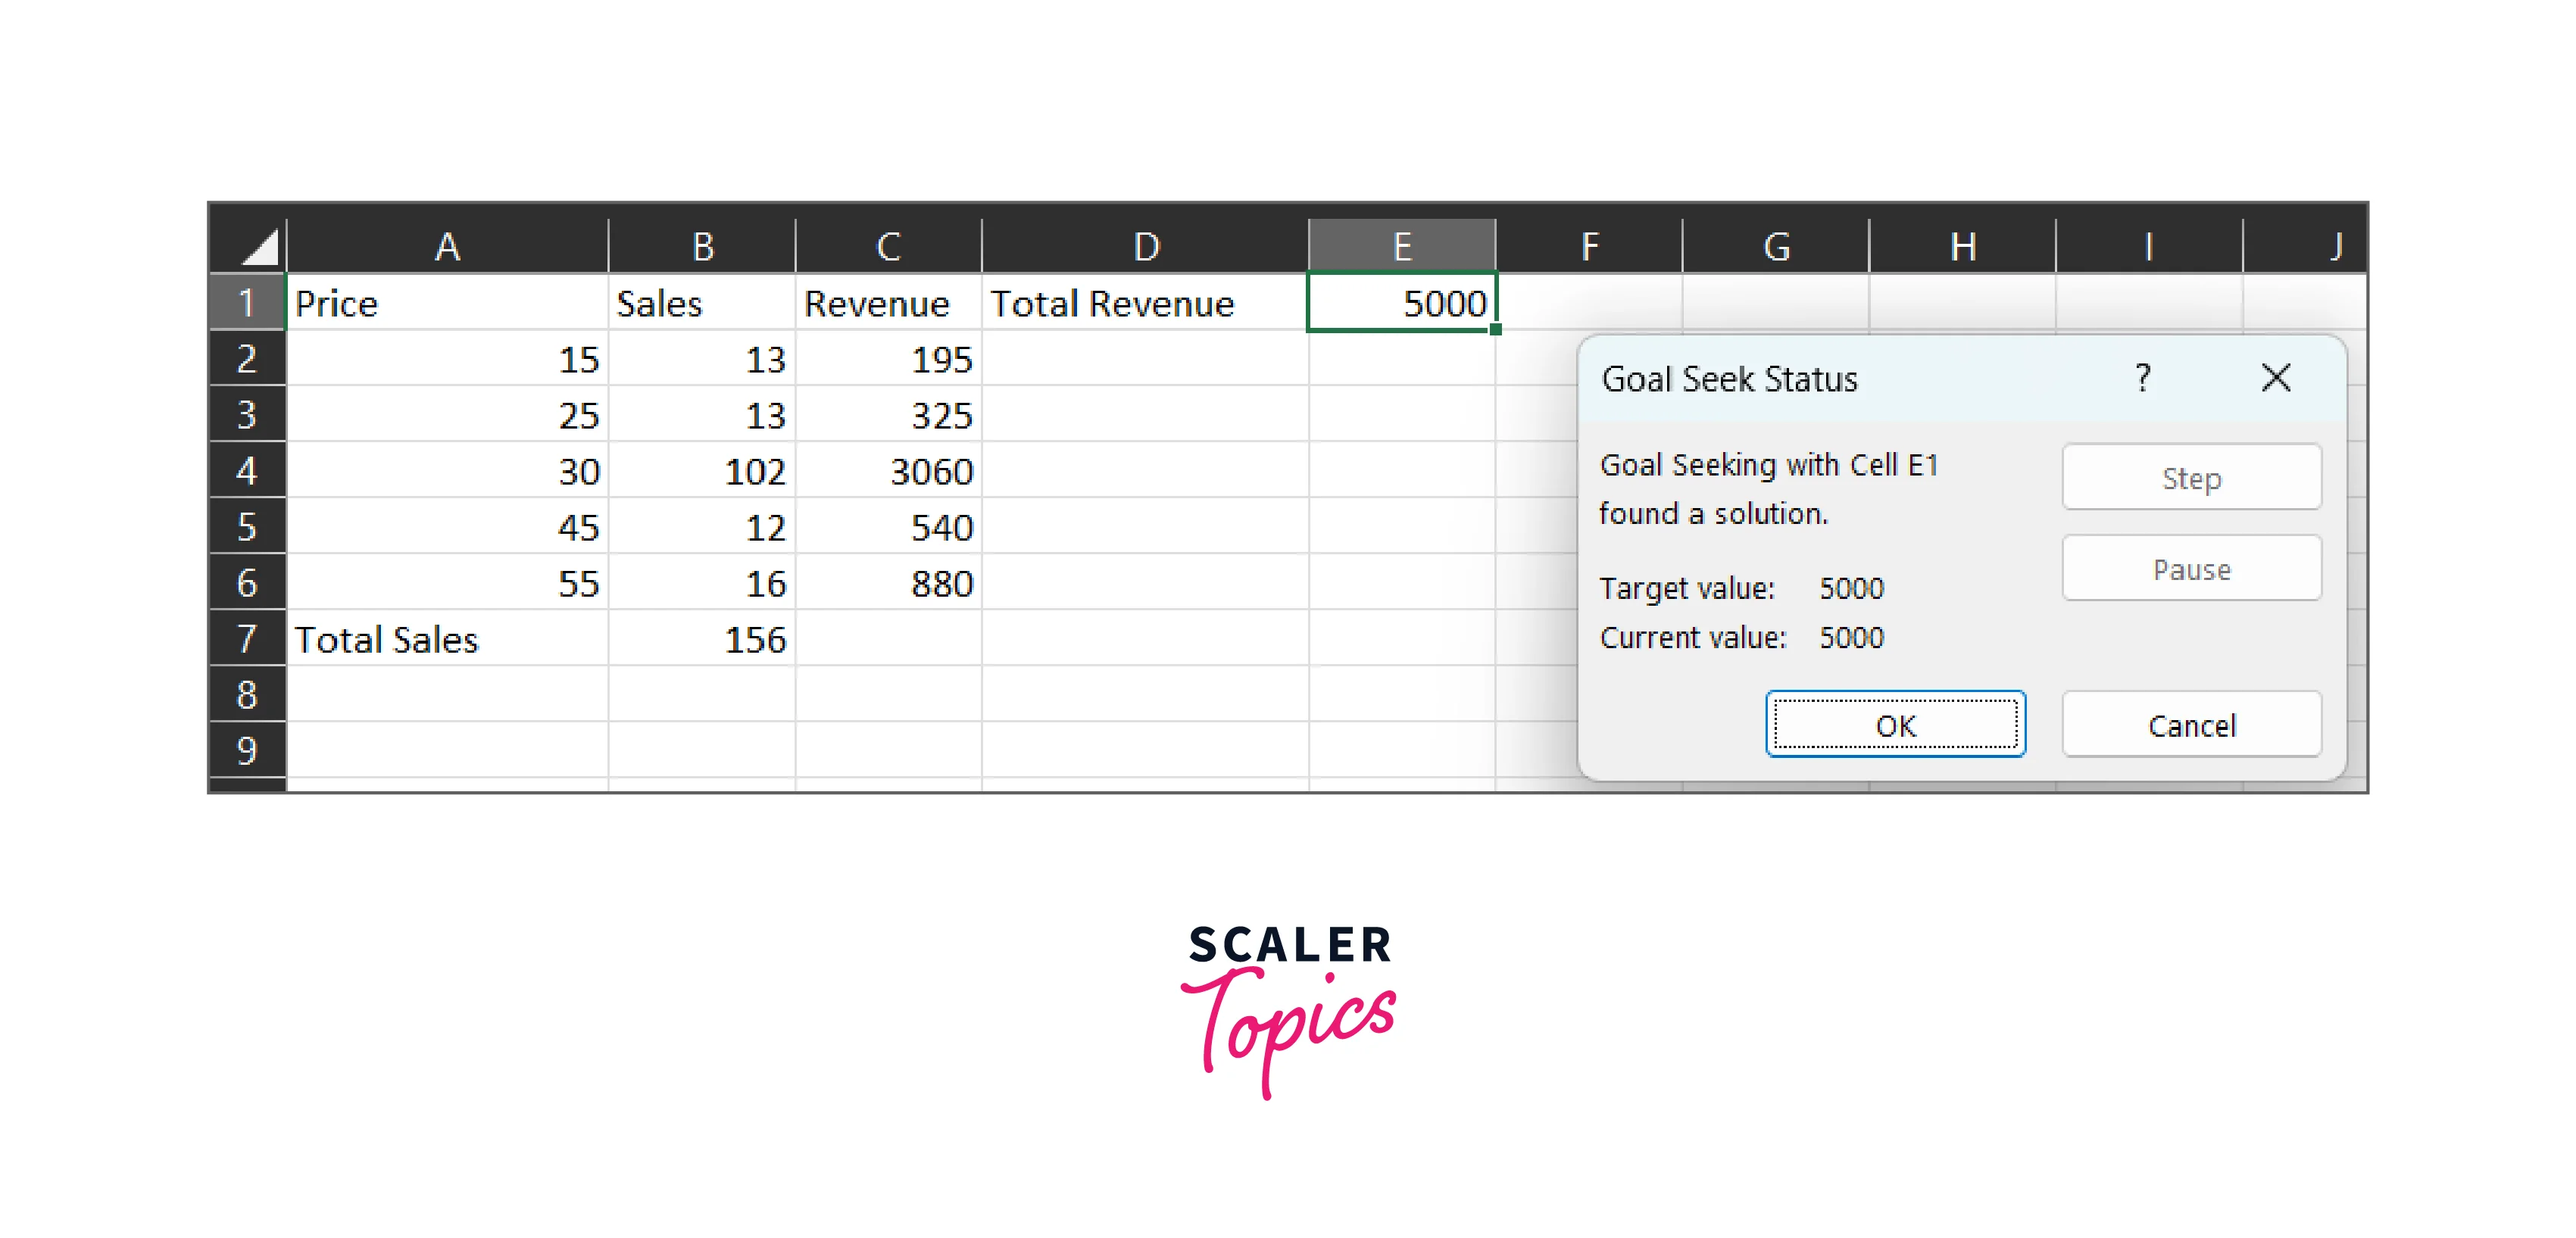
Step - 5: Run the Goal Seek Tool
- Once you have set the parameters, click on the OK button to run the Goal Seek tool.
- Excel will then determine the input value needed to achieve the target value.
Step - 6: Analyze the Results
- After running the Goal Seek tool, Excel will update the input value (sales volume) to the value needed to achieve the target value.
- You can then analyze the results and make informed decisions based on the data.
What-if Analysis Data Table
A What-if Data Table is a What-if Analysis tool in Excel that enables users to explore various scenarios by changing input values and observing the resulting output values. The tool is particularly useful for performing complex data analysis, such as sensitivity analysis, risk analysis, and financial forecasting.
A What-if Data Table is essentially a two-dimensional grid that shows the different combinations of input values and the resulting output values. The tool enables users to change the input values and see how the output values change in response. Here's a step-by-step instruction on how to use the data table:
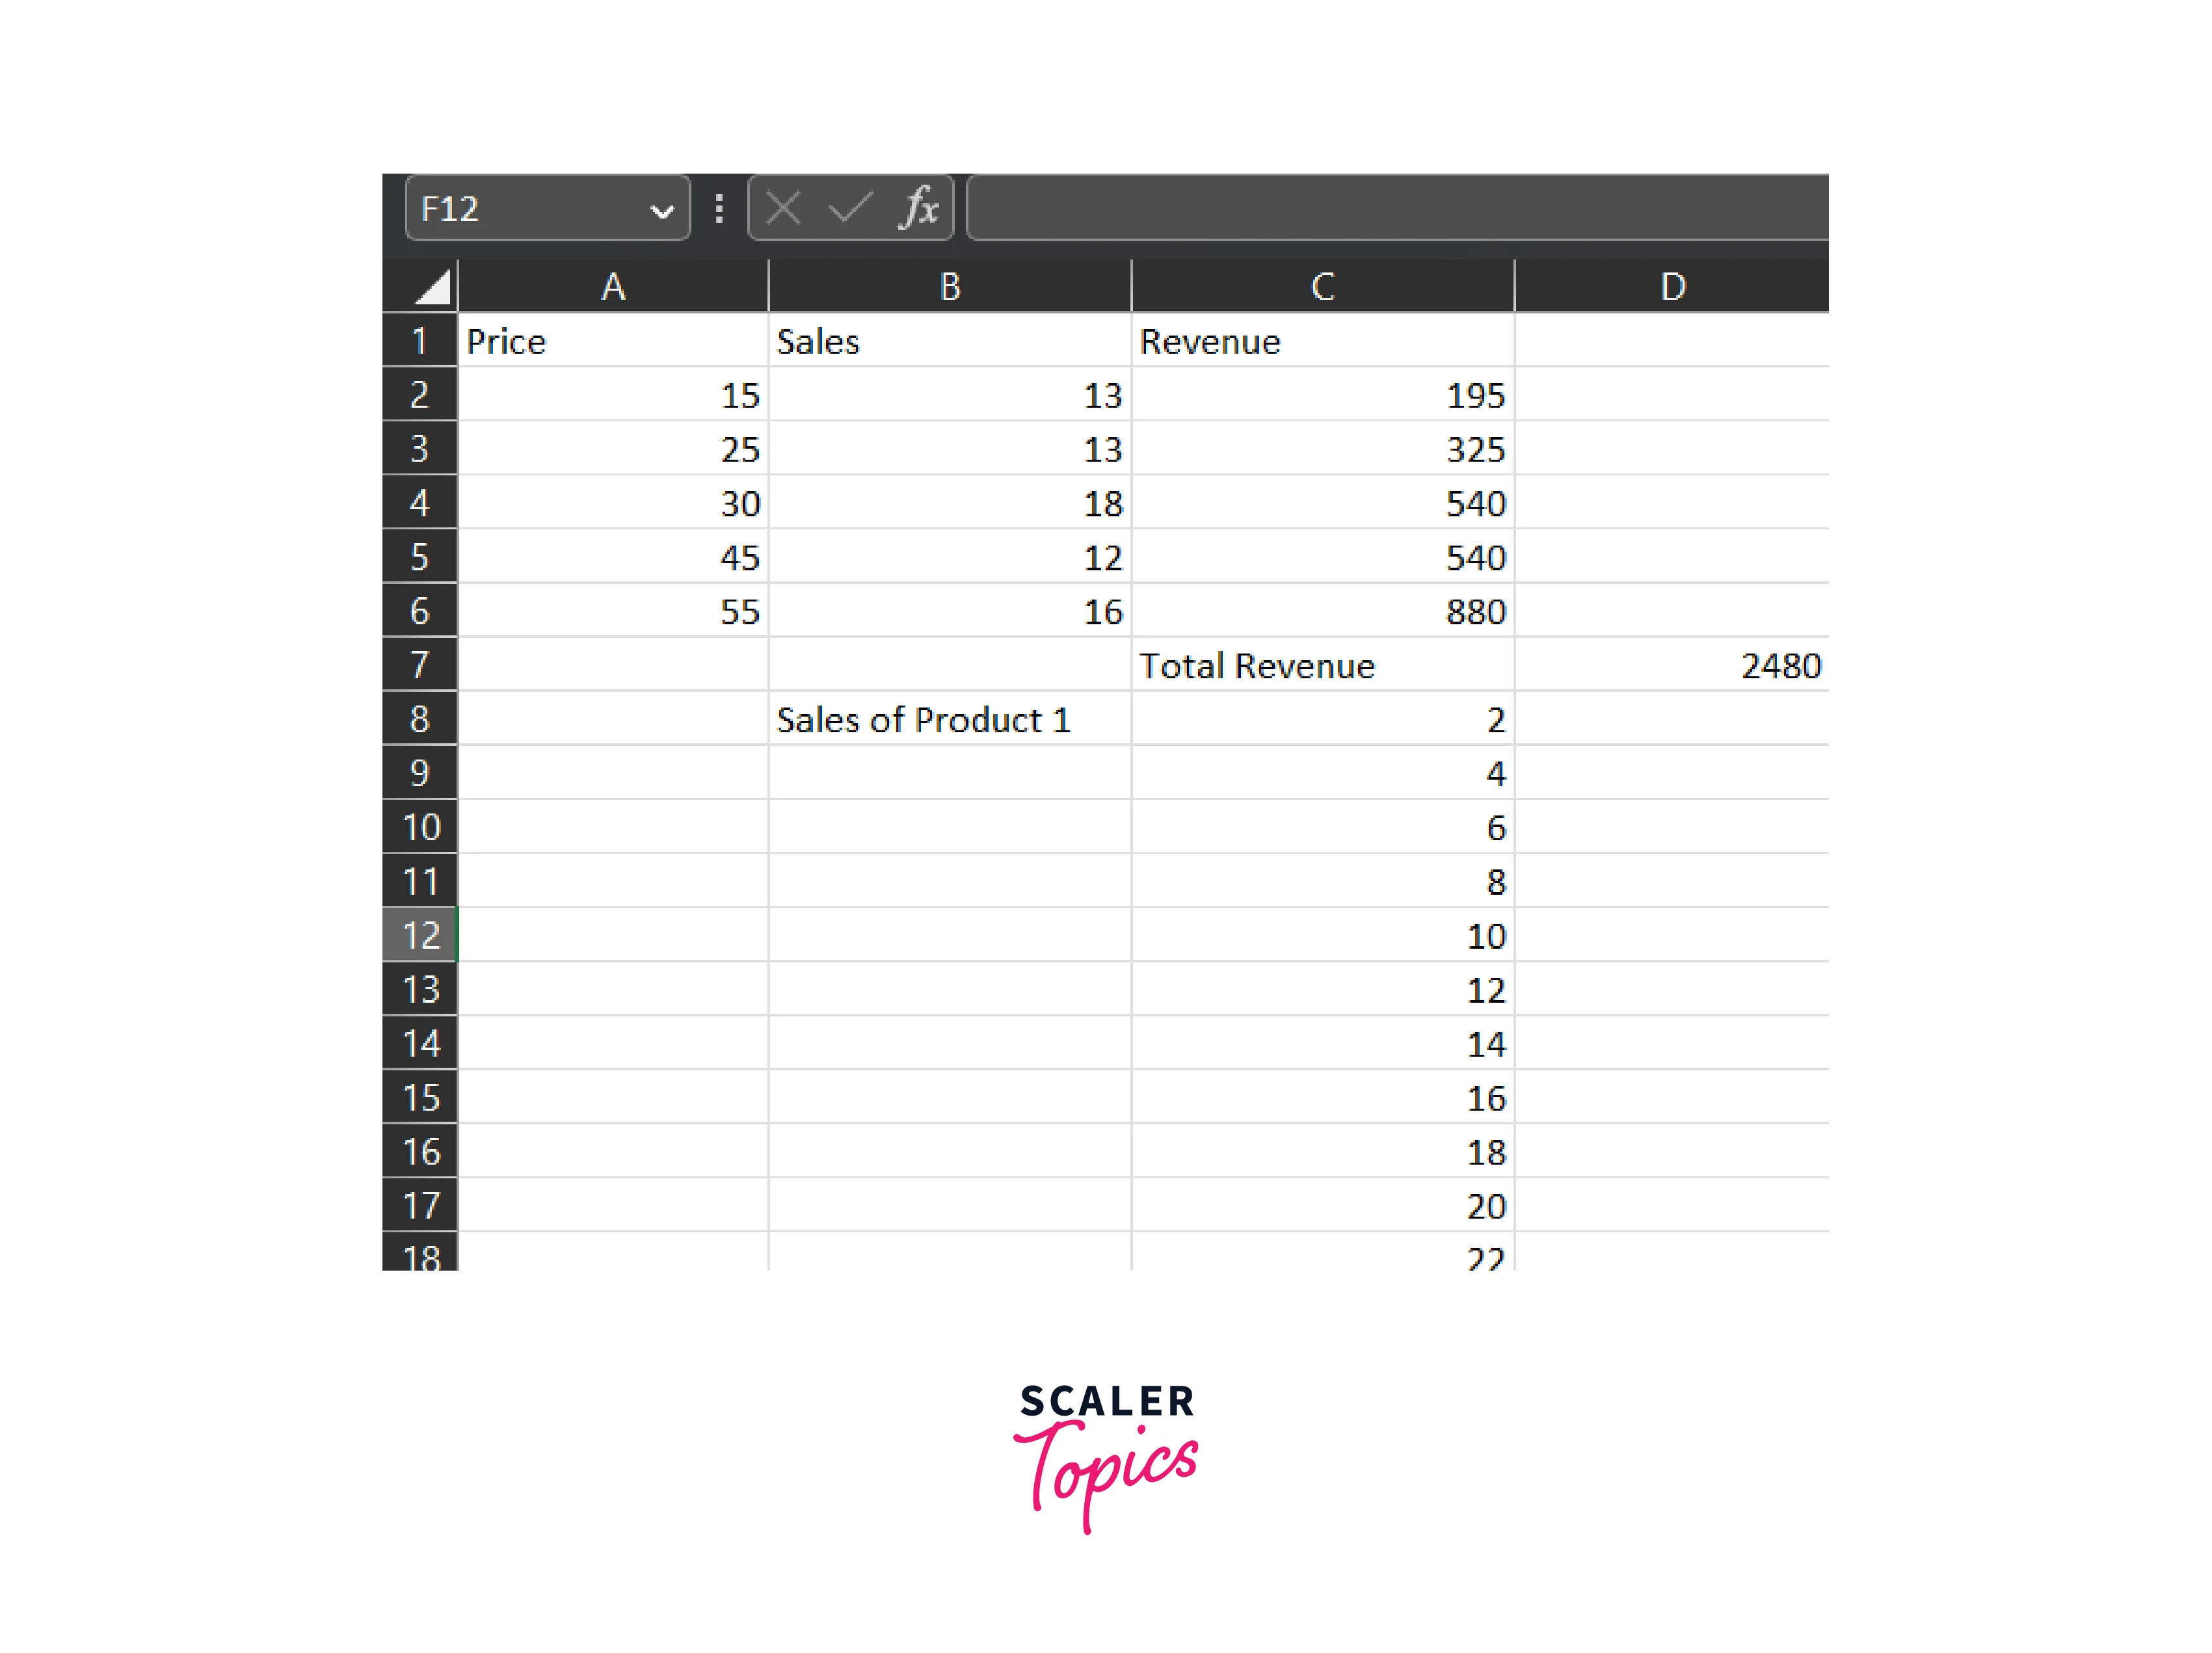
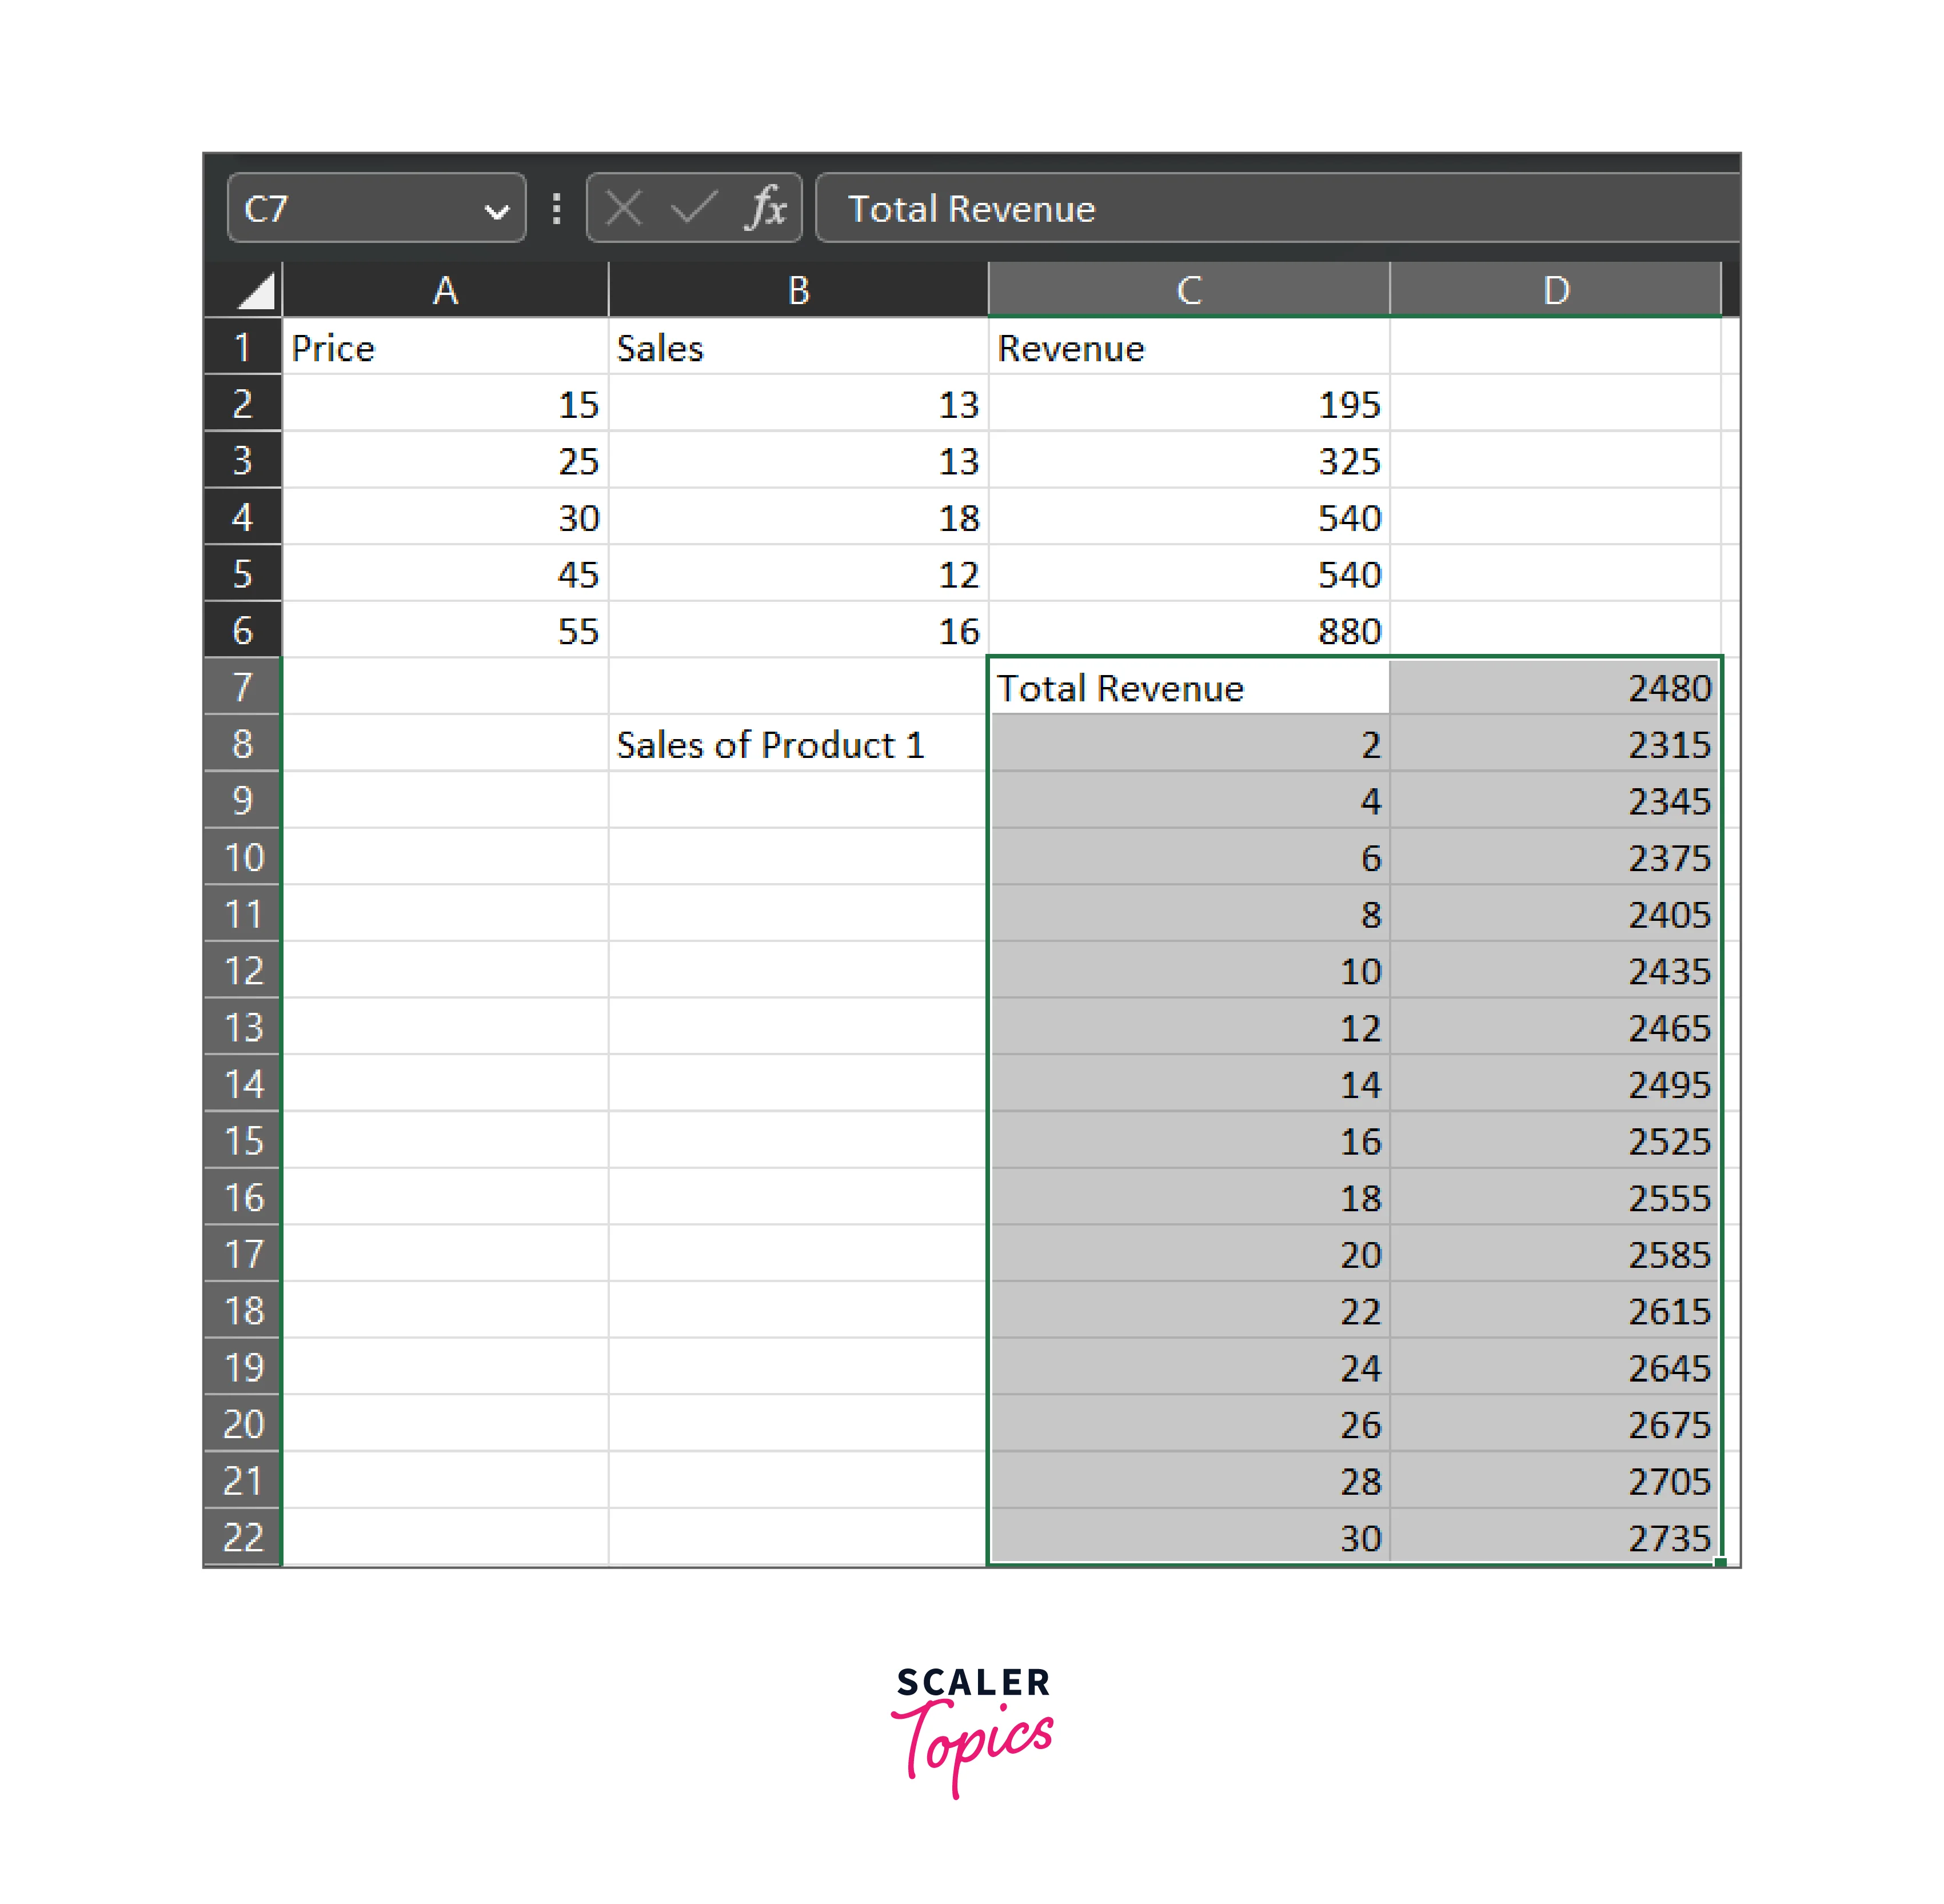
Step - 1: Set up the Spreadsheet
- The first step in using What-if Data Tables in Excel is to set up the spreadsheet.
- This involves creating a table that shows the input values, the output values, and the target value.
- In this example, we will use a simple spreadsheet that calculates the total revenue based on the price and the sales volume.
Step - 2: Create a One-Variable Data Table
- To create a one-variable data table, first, select the cell that contains the formula that calculates the output value (total revenue), then go to the Data tab on the Excel ribbon and click on What-if Analysis.
- Then, select Data Table from the drop-down menu.
- In the Data Table dialog box, set the parameters as follows:
- In the "Column input cell" field, enter the cell that contains the input value (price).
- In the "Row input cell" field, leave it blank.
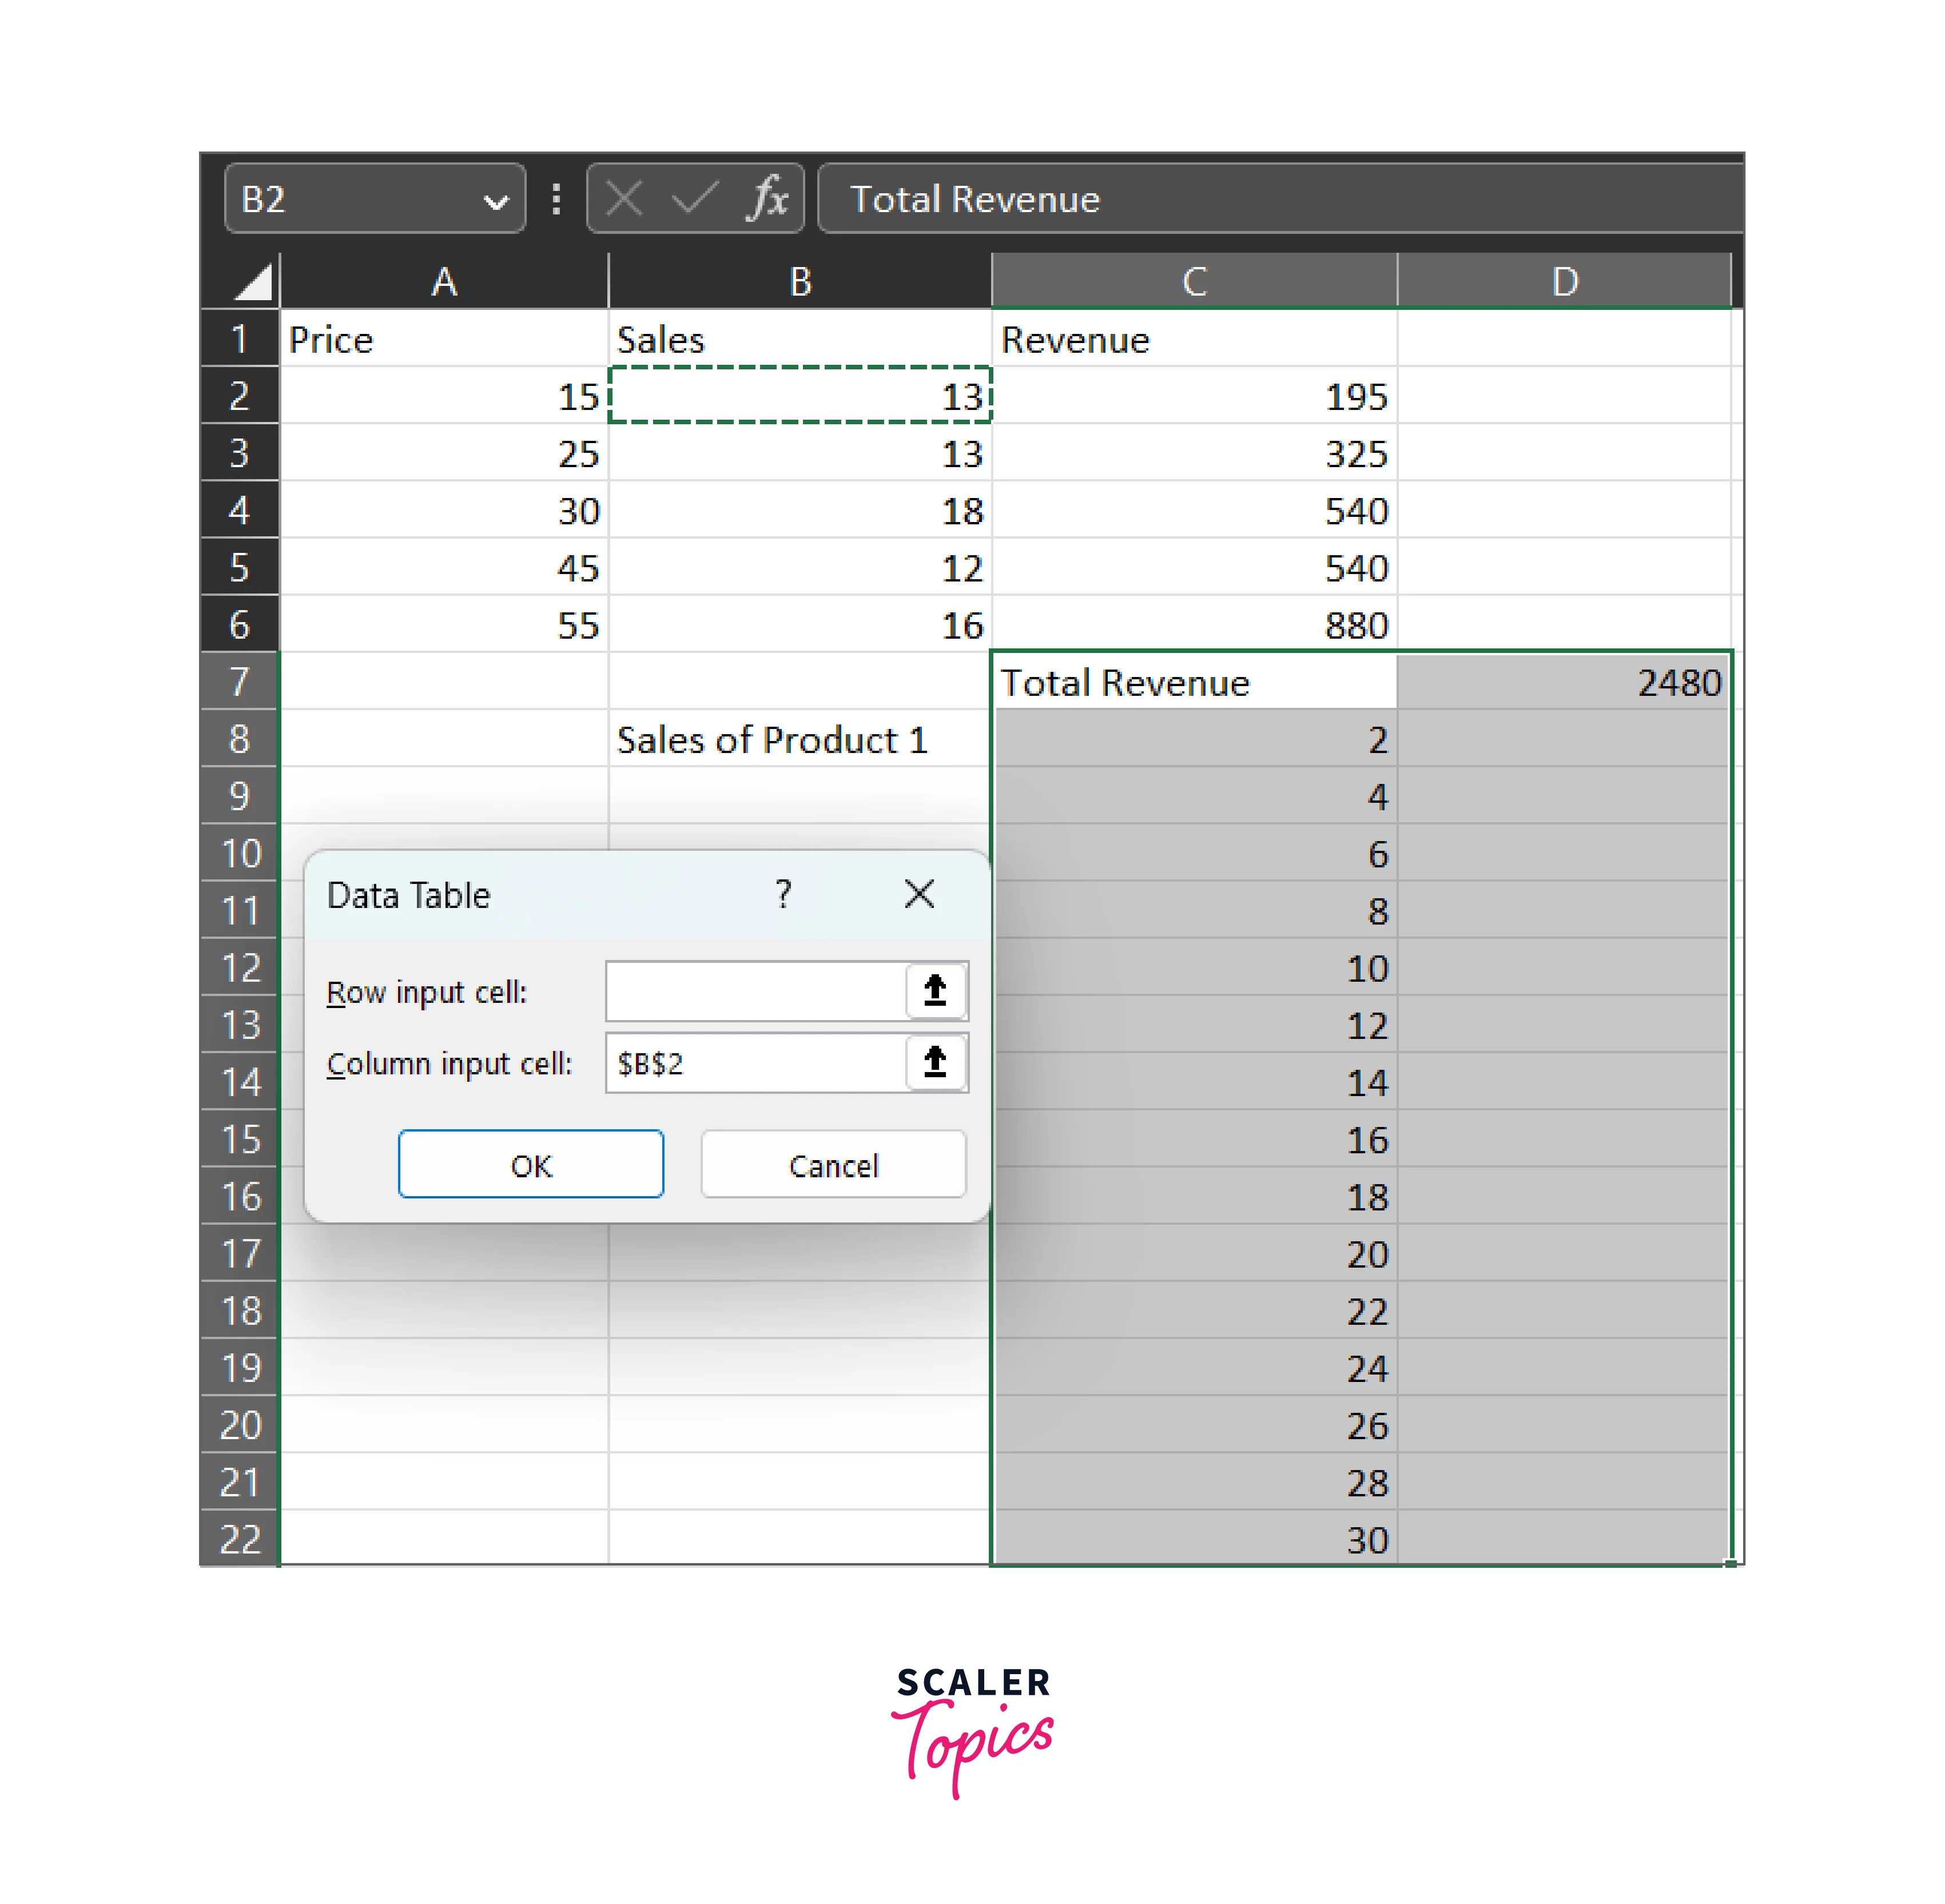
- Click OK to create the one-variable data table.
Step - 3: Analyze the Results
- After creating the one-variable data table, Excel will generate a table that shows the different combinations of input values and the resulting output values.
- You can then analyze the results and make informed decisions based on the data.
Step - 4: Create a Two-Variable Data Table
- To create a two-variable data table, first, select the cell that contains the formula that calculates the output value (total revenue), then go to the Data tab on the Excel ribbon and click on What-if Analysis in Excel.
- Then, select Data Table from the drop-down menu.
- In the Data Table dialog box, set the parameters as follows:
- In the "Column input cell" field, enter the cell that contains the first input value (price).
- In the "Row input cell" field, enter the cell that contains the second input value (sales volume).
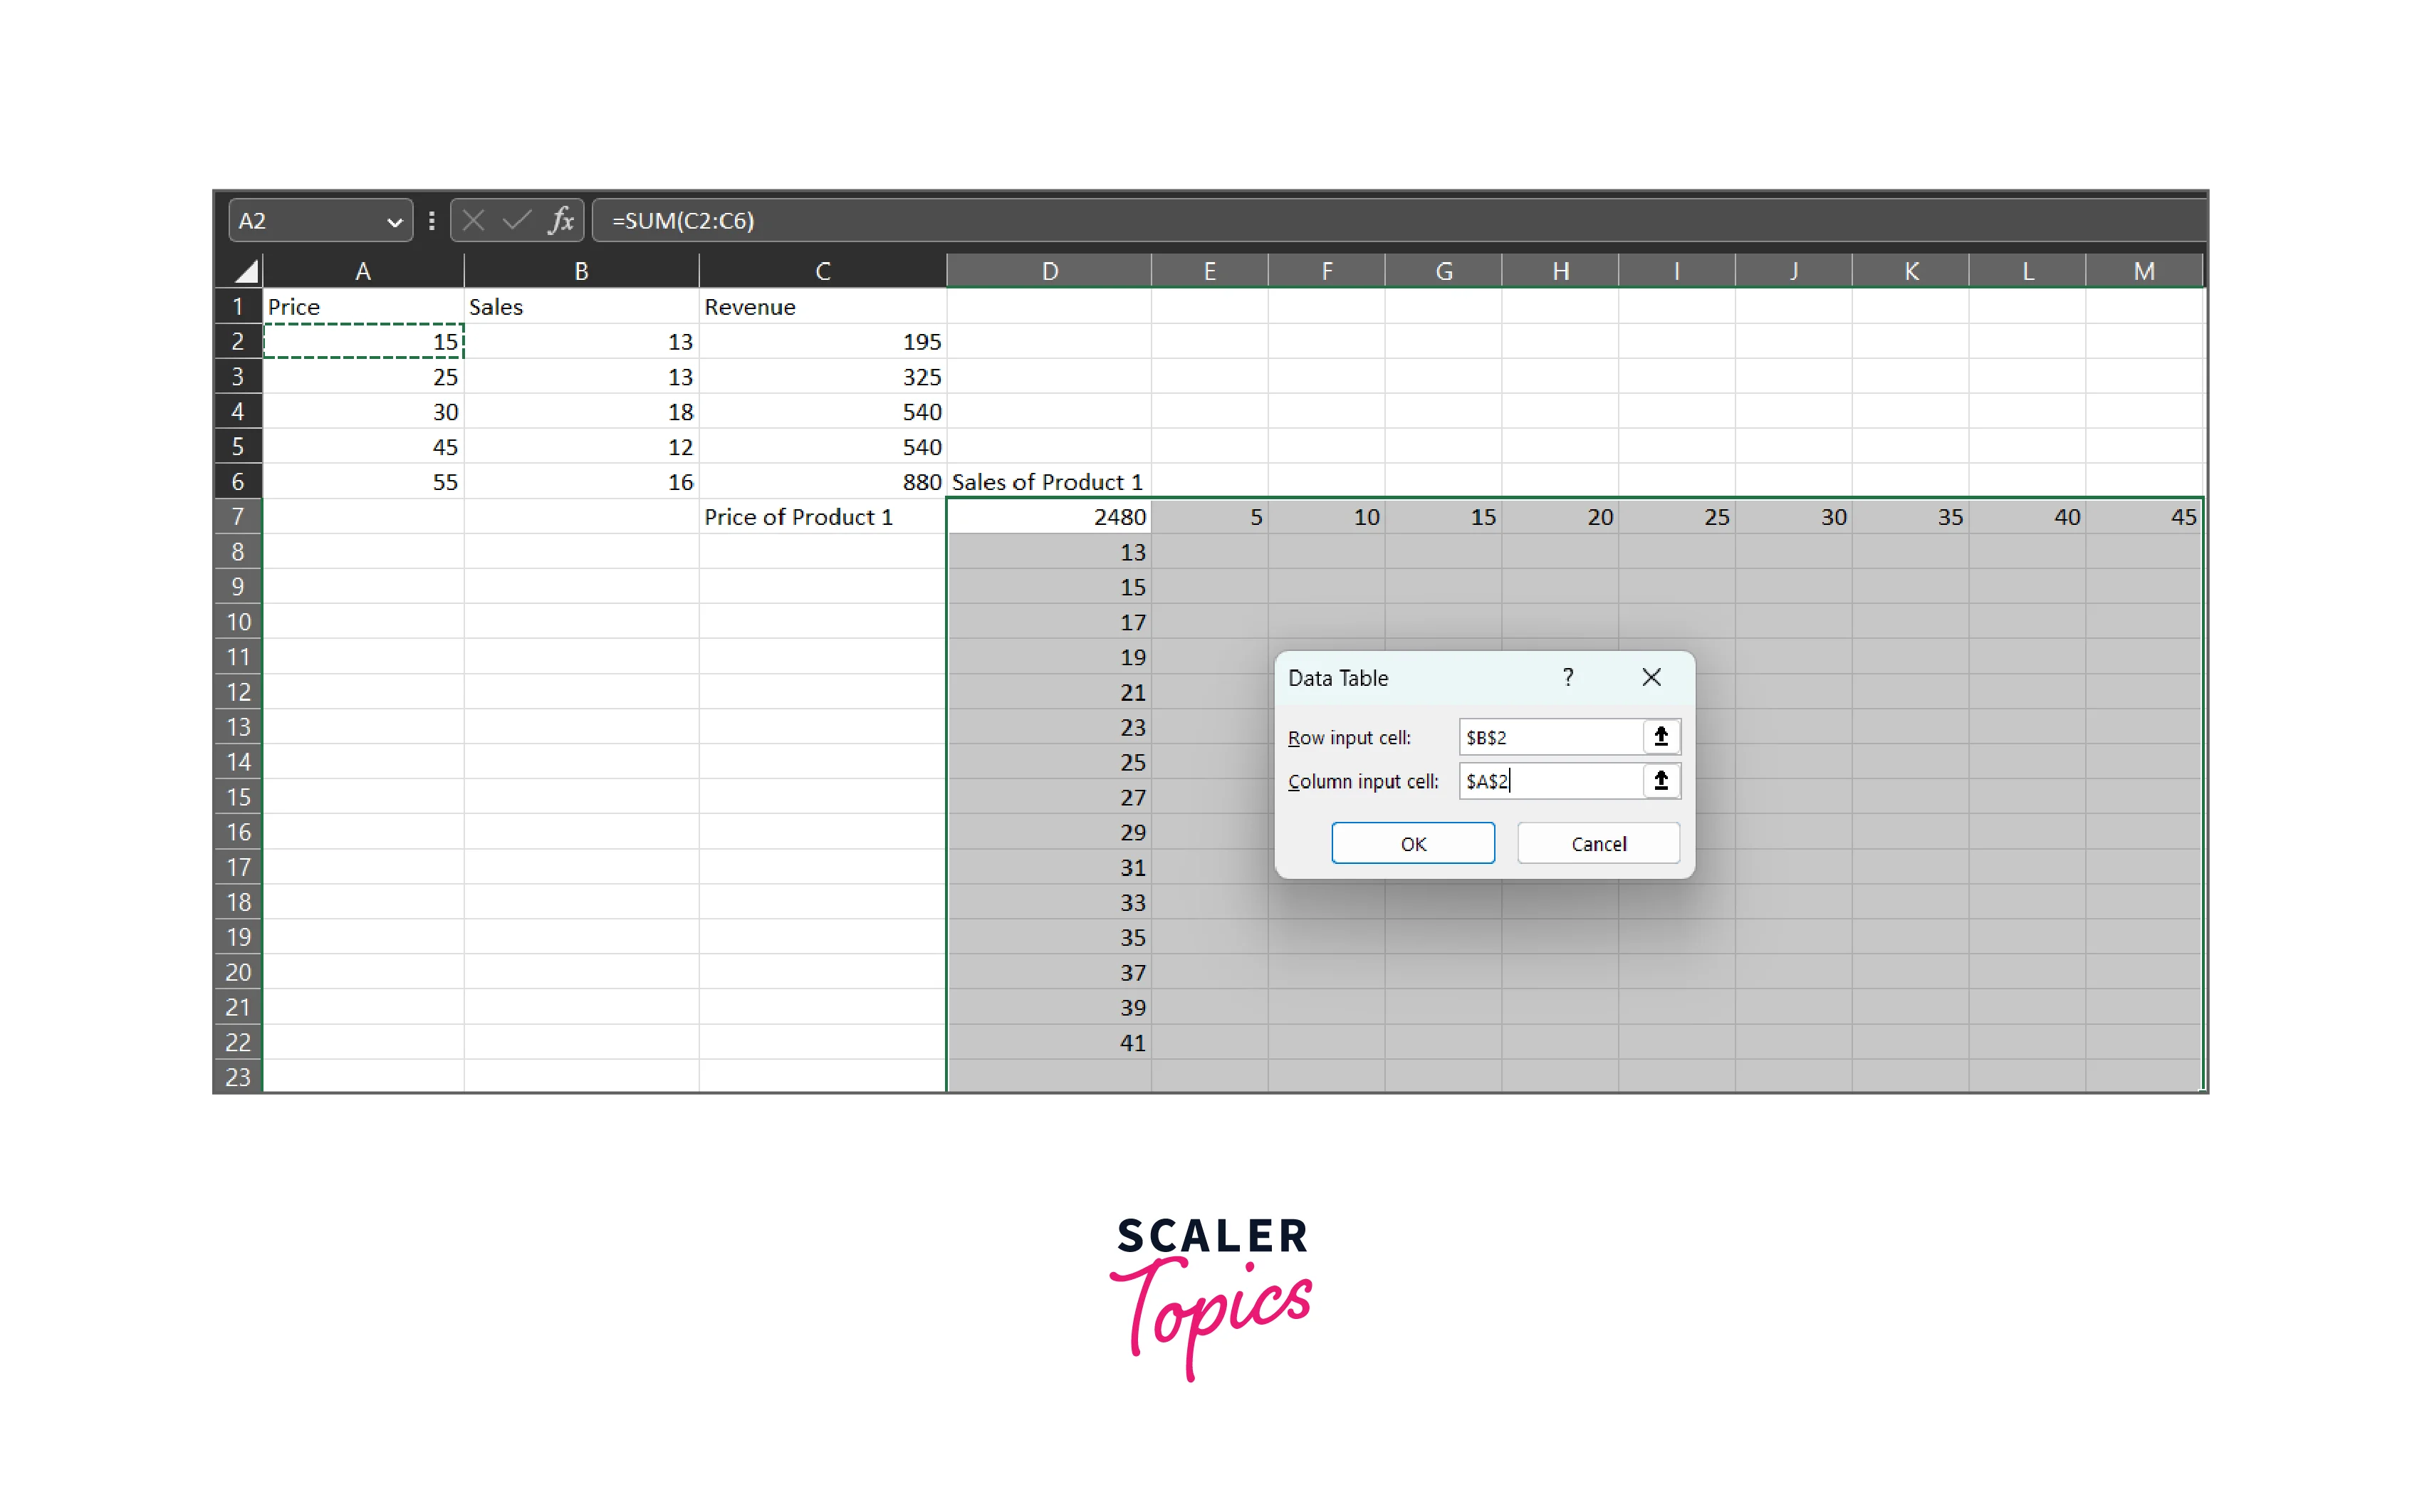
- Click OK to create the two-variable data table.
Step - 5: Analyze the Results
- After creating the two-variable data table, Excel will generate a table that shows the different combinations of input values and the resulting output values.
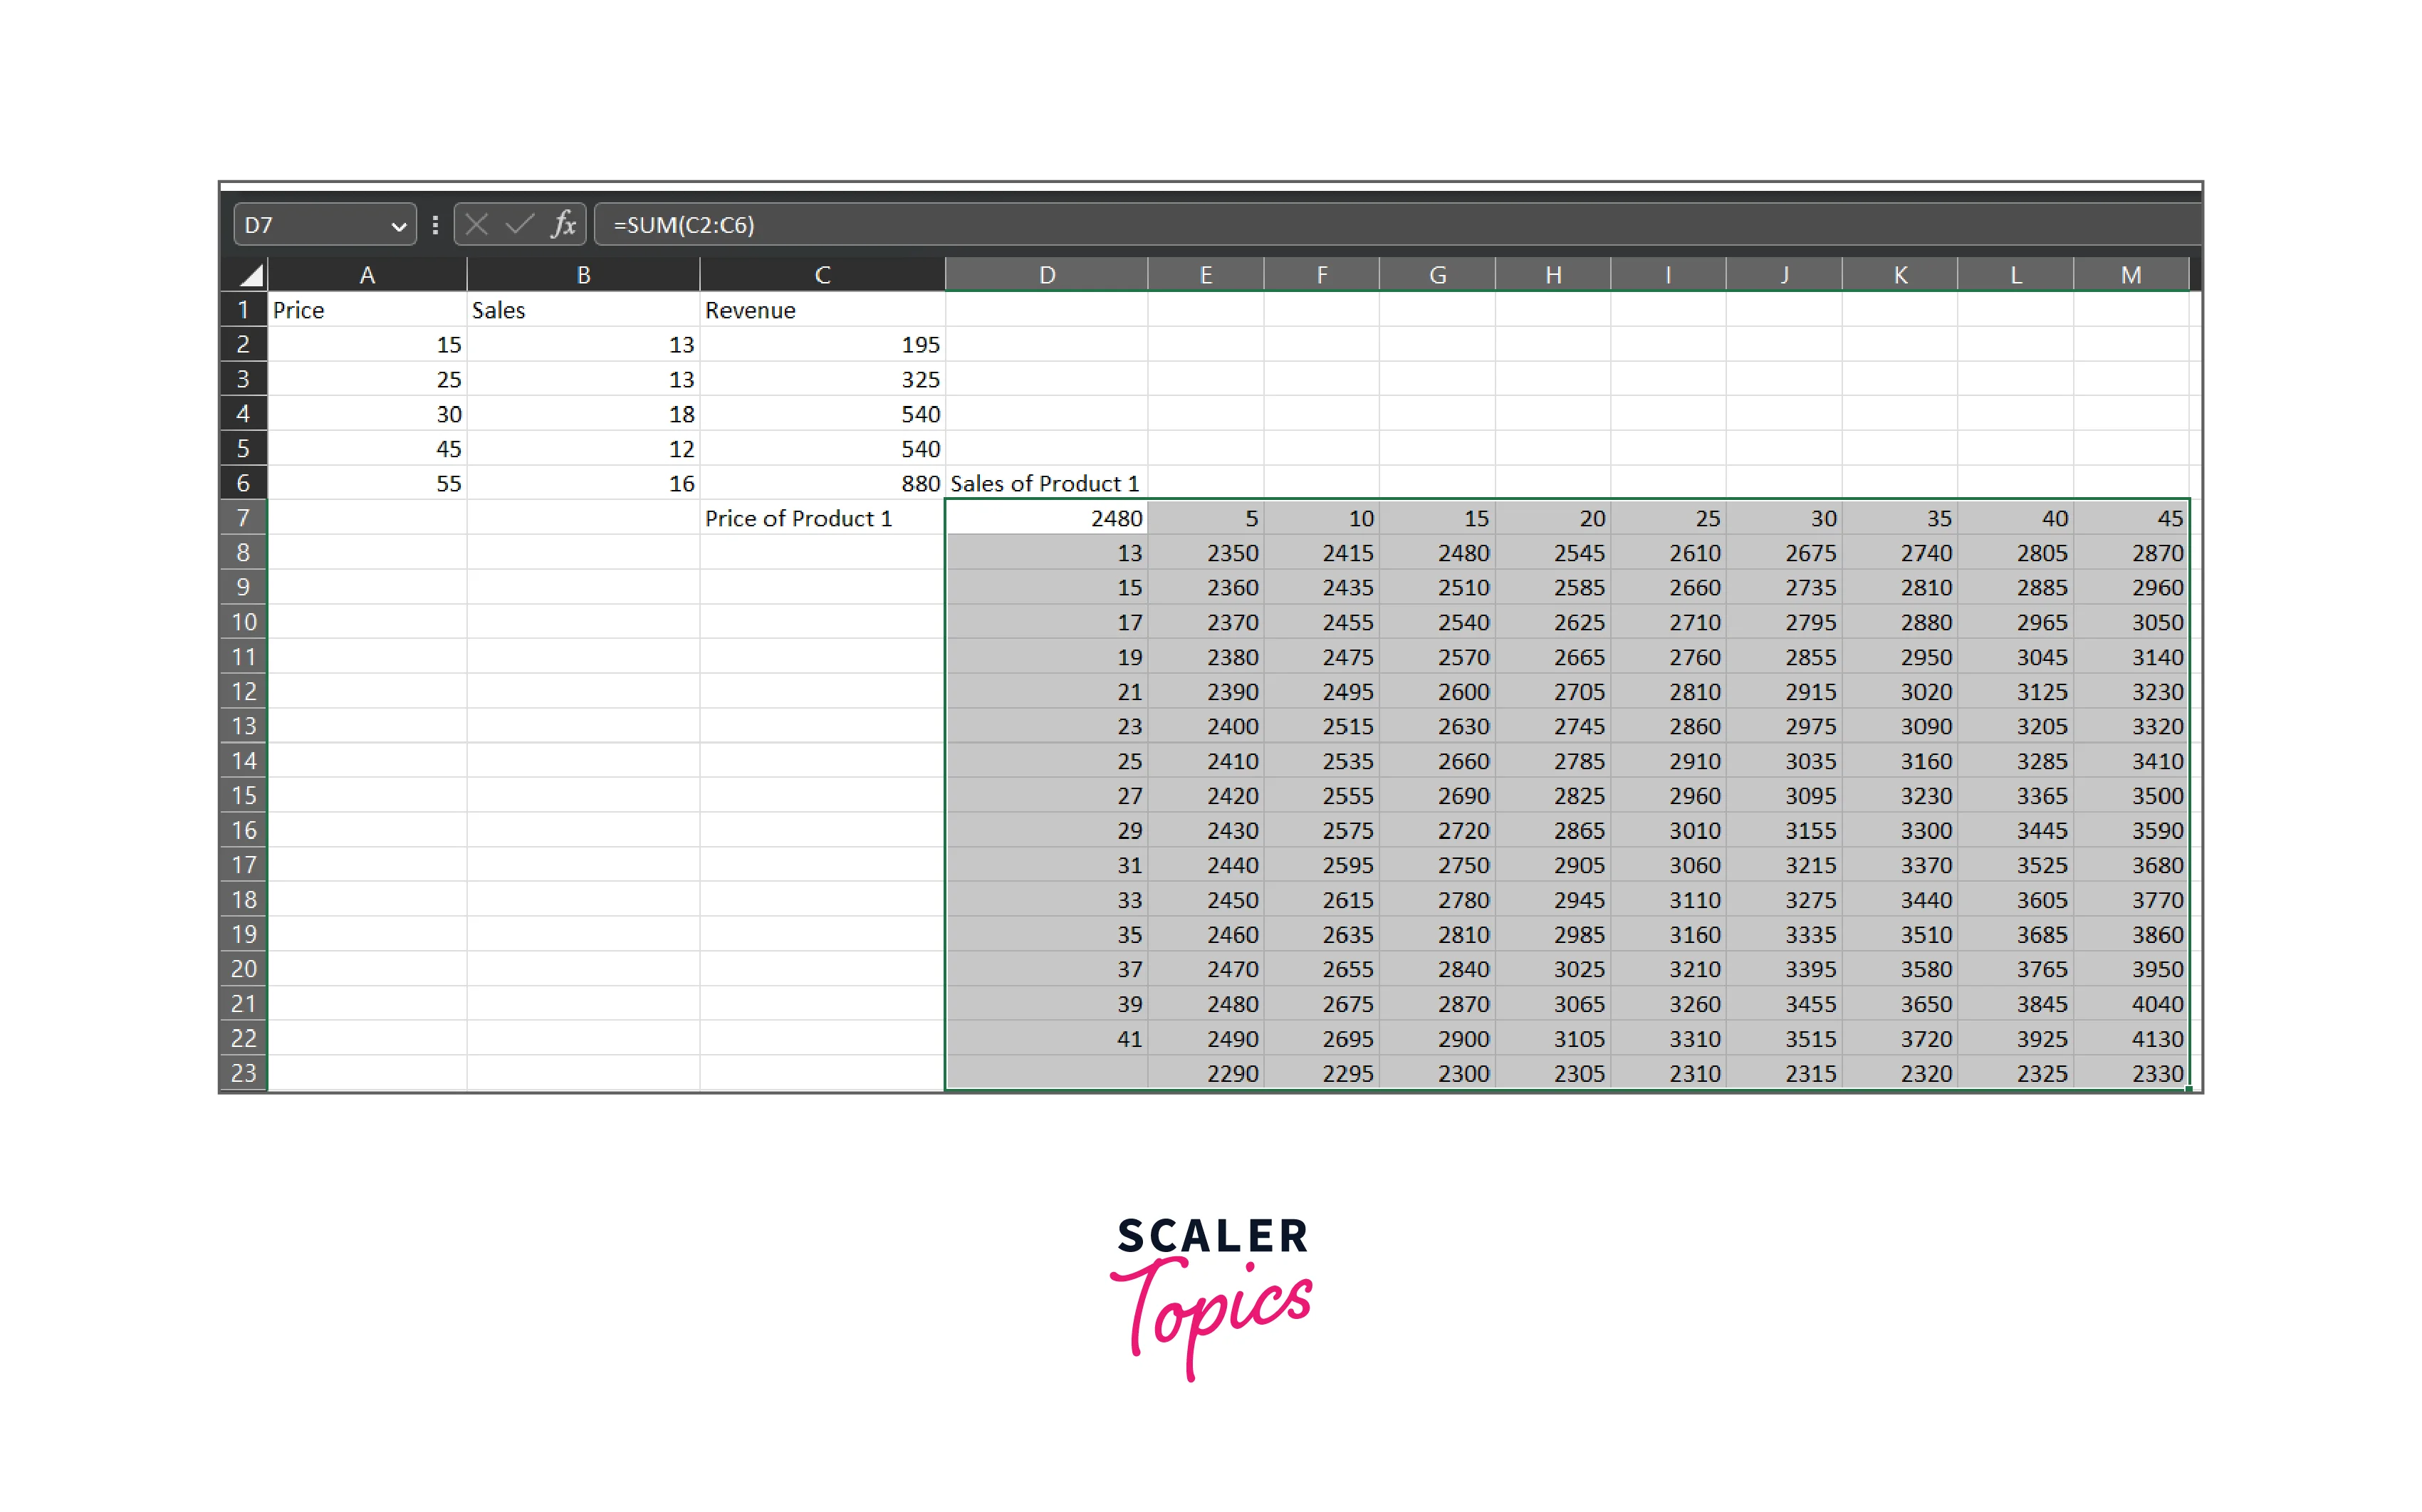
- You can then analyze the results and make informed decisions based on the data.
Conclusion
- The What-if Analysis in Excel is a powerful set of features that enables users to explore different scenarios and analyze the impact of various factors on their data.
- It includes several What-if Analysis tools, including Scenario Manager, Goal Seek, and Data Table, each of which serves a different purpose and offers unique benefits.
- Scenario Manager enables users to create and manage multiple scenarios based on their data.
- Goal Seek enables users to calculate the input value required to achieve a specific output value.
- Data Table enables users to generate a table of results based on multiple input values.