What is Analysis of Variance (ANOVA)?

When exploring the statistical tools available for analyzing differences among group means, a fundamental question arises: What is ANOVA? Analysis of Variance (ANOVA) serves as a cornerstone in the realm of statistics, providing a method to ascertain whether there are any statistically significant differences between the means of three or more independent groups.
Analysis of Variance (ANOVA)
Analysis of Variance (ANOVA) is a statistical method used to test the degree to which two or more groups differ from each other in an experiment or study, such as comparing the average heights of plants subjected to different fertilizer treatments. The essence of what is ANOVA in statistics lies in its ability to decompose observed variances within a dataset into components attributable to various sources of variation. This breakdown allows researchers to determine whether the means of several groups are equal, essentially testing the null hypothesis that samples in all groups are drawn from populations with the same mean values.
ANOVA operates under the principle that any differences in the sample means could be due to two sources: variance within each group or variance between the groups. By comparing the variance (or variability) within groups against the variance between groups, ANOVA helps in assessing the impact of one or more factors on a dependent variable without the need for multiple t-tests, which could increase the risk of error. This makes the ANOVA test a powerful tool for researchers looking to understand the interaction between different variables and their combined effect on the data observed.
Important Terminologies in ANOVA
Understanding the key terminologies in ANOVA is essential for grasping how it works and interpreting its results accurately. Here are some of the most important terms:
- Population:
A complete set of similar items or events which is the subject of statistical analysis. - Sample:
A subset of the population selected for the actual experiment or observation. - Factor:
A variable that is manipulated in the experiment. It's an independent variable that categorizes groups. - Levels:
The different conditions or values of the factor in the study. - Treatment:
Different conditions applied to the groups in the experiment. - Dependent Variable:
The outcome or response that the experiment measures. - Independent Variable:
The variable that is changed or controlled in the experiment to test its effects on the dependent variable. - Between-Group Variance:
Variation due to the interaction between the different groups. This measures how much the group means differ from the overall mean. - Within-Group Variance:
Variation within each group, measuring how much the individual observations in each group differ from their respective group mean. - F-ratio (F-statistic):
A ratio of the between-group variance to the within-group variance. It's used to determine whether the observed variances are significant. - Null Hypothesis (H0):
The hypothesis that there is no effect or no difference, implying that any observed differences are due to random chance. - Alternative Hypothesis (H1 or Ha):
The hypothesis that there is an effect or a difference, suggesting that observed differences are due to the factor being tested. - P-value:
The probability of observing the test results under the null hypothesis. A lower p-value (<0.05, typically) indicates strong evidence against the null hypothesis. - Degrees of Freedom:
The number of independent pieces of information in the data that are used in the calculation of the statistic.
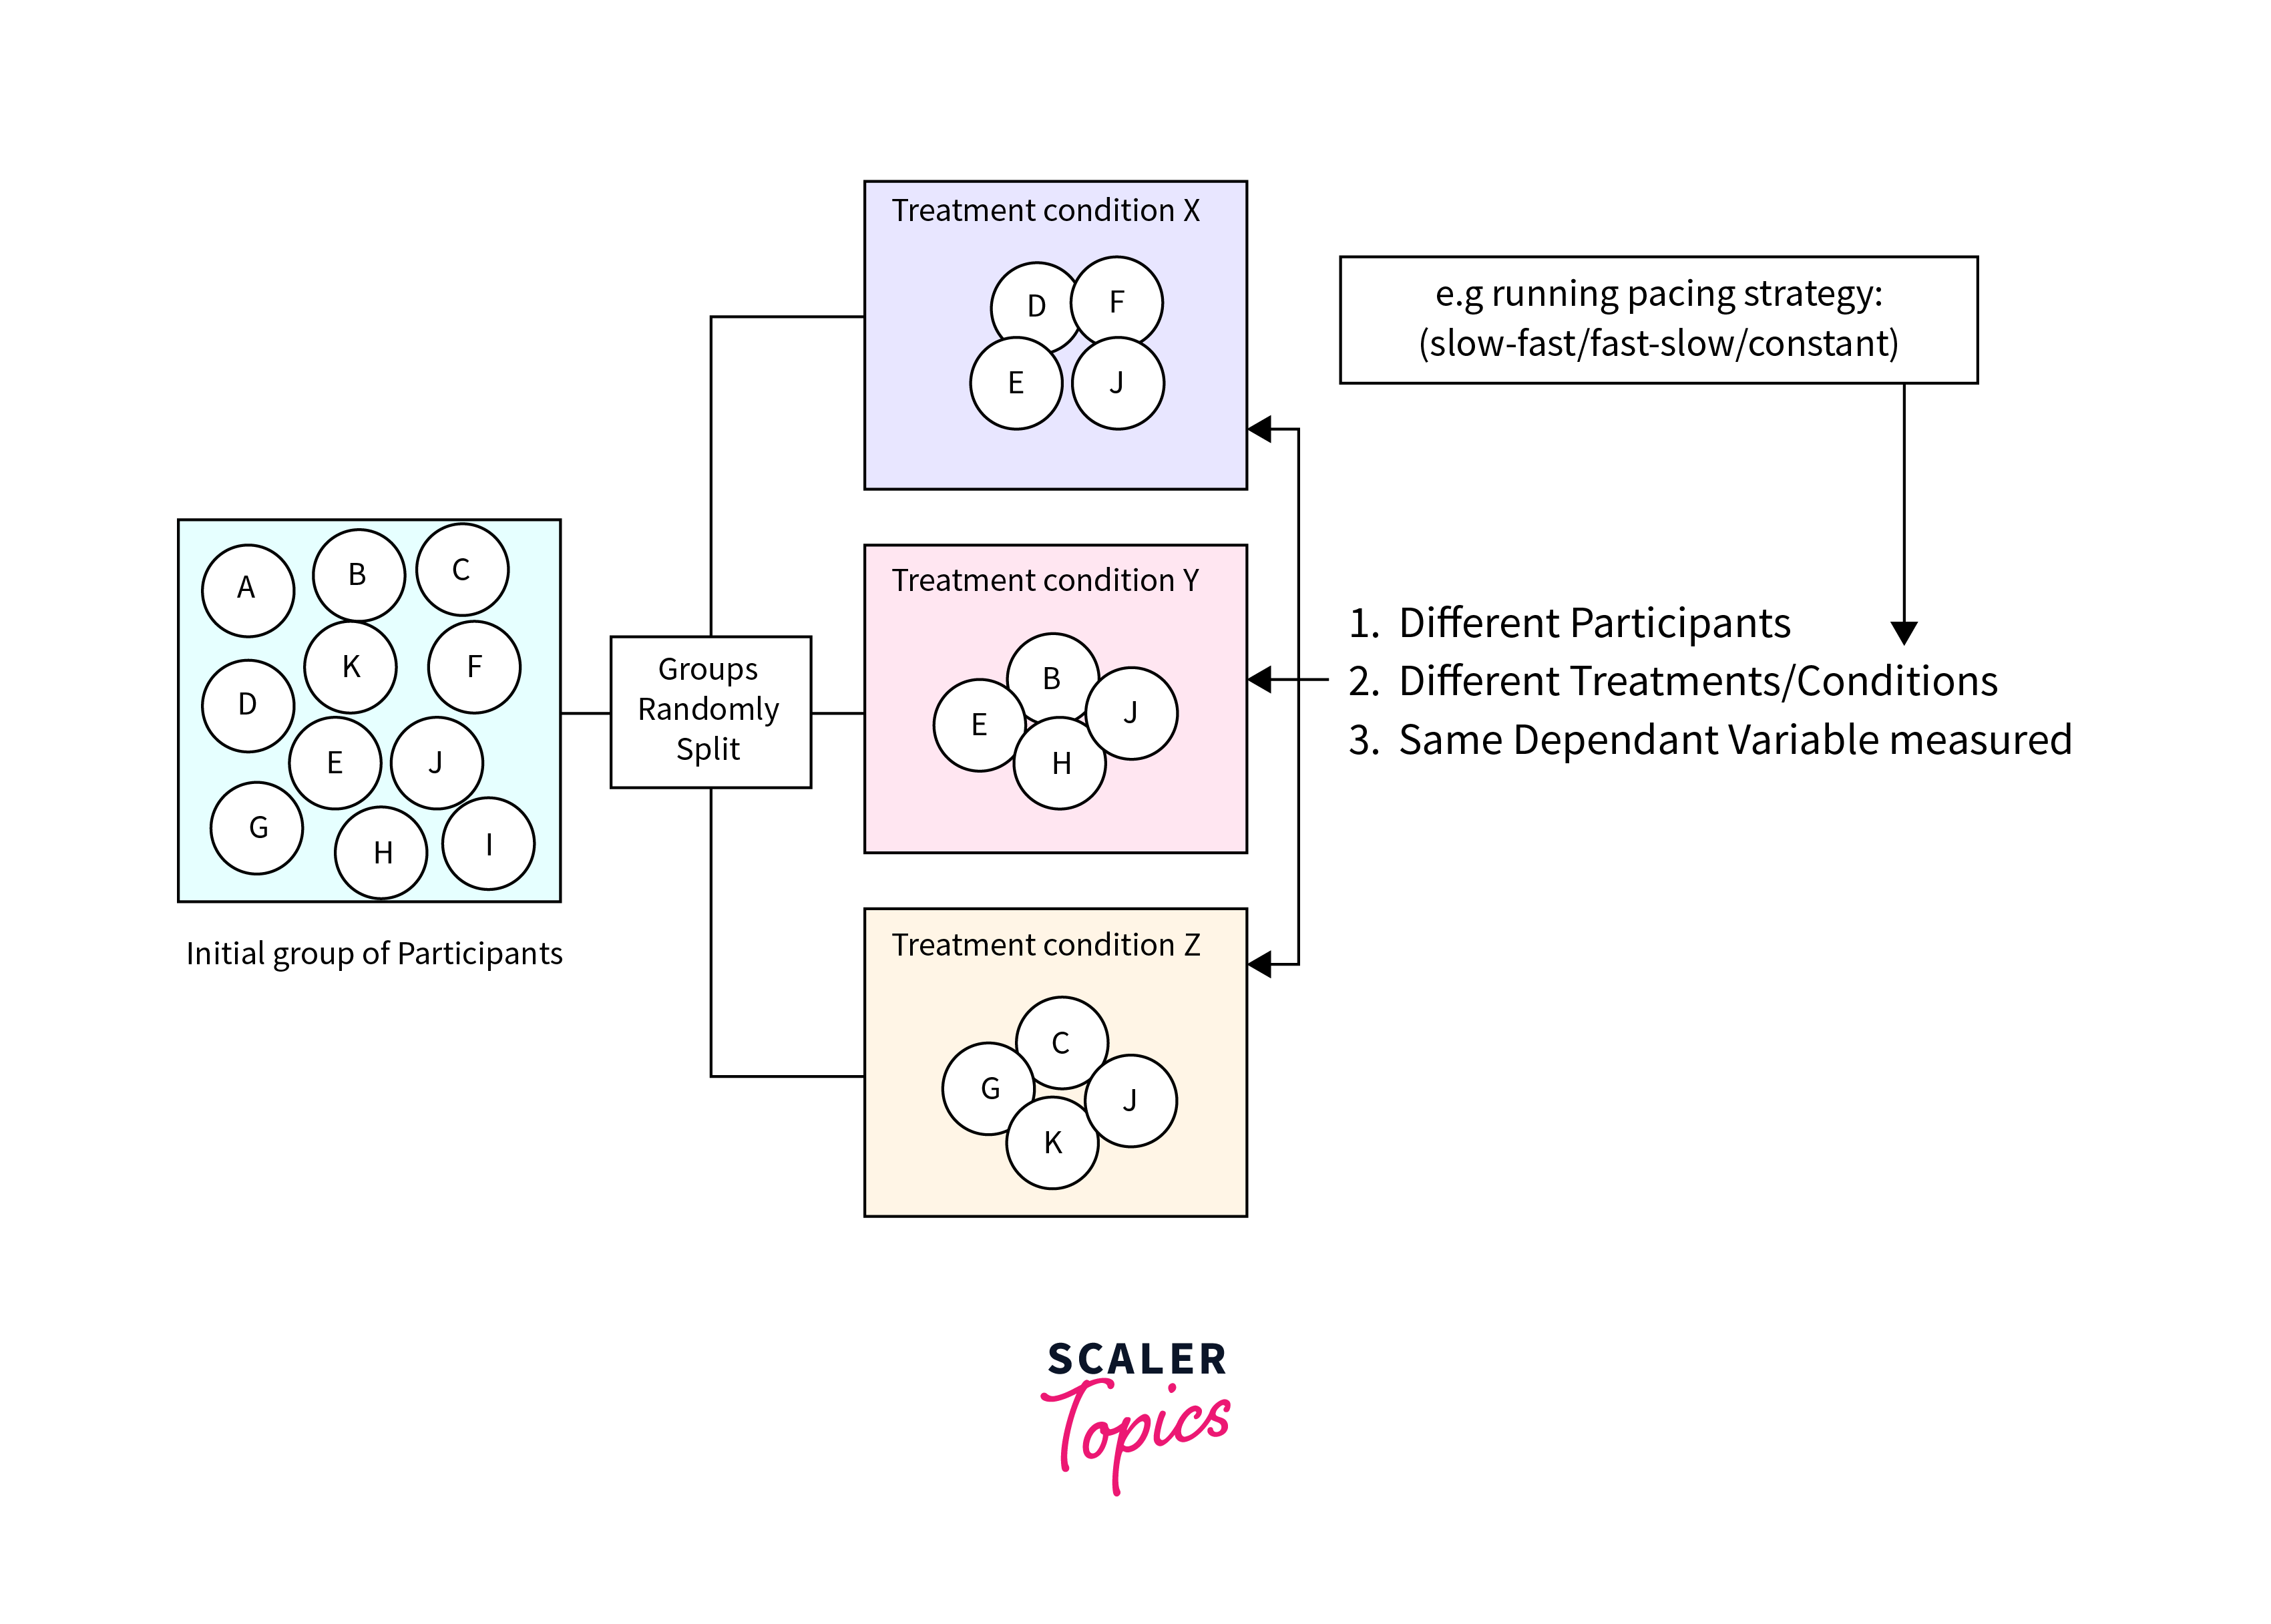
Single Factor or One Way ANOVA
One-way ANOVA, a cornerstone method for understanding what is ANOVA in statistics, focuses on analyzing the effect of a single factor on a dependent variable across two or more groups. It’s ideal for comparing the means of three or more independent (unrelated) groups to ascertain if at least one group mean significantly differs from the others.
Step by Step Performance
-
Step - 1: Define the Hypothesis:
- Null Hypothesis (H0):
All group means are equal. - Alternative Hypothesis (H1):
At least one group mean is different.
- Null Hypothesis (H0):
-
Step - 2: Select Significance Level:
- Typically, a 5% significance level is chosen, meaning there's a 5% risk of concluding a difference exists when there isn't one.
-
Step - 3: Calculate the F-Ratio:
- Between-Group Variance:
Calculate the mean of each group, the overall mean, and then the variance between these means. - Within-Group Variance:
Calculate the variance within each group. - The F-ratio is the quotient of the between-group variance and the within-group variance.
- Between-Group Variance:
-
Step - 4: Determine Degrees of Freedom:
- Between-group degrees of freedom:
(where is the number of groups). - Within-group degrees of freedom:
(where is the total number of observations).
- Between-group degrees of freedom:
-
Step - 5:
Find the Critical F-Value: From an F-distribution table, find the F-value that corresponds to the degrees of freedom and the significance level. -
Step - 6:
Compare F-Ratios: Compare the calculated F-ratio to the critical F-value. If the calculated F-ratio is greater, reject the null hypothesis.
Advantages
- One-way ANOVA is straightforward to perform and interpret, making it accessible for researchers with varying levels of statistical knowledge.
- It’s relatively robust to violations of normality and homogeneity of variances, especially with larger sample sizes.
- Allows the comparison of more than two groups at once, reducing the risk of type I errors associated with multiple t-tests.
Limitation
- Limited to examining the effect of a single factor, ignoring potential effects due to the interaction of multiple factors.
- Relies on assumptions of normality, independence, and homogeneity of variances, which might not always be met.
- When the null hypothesis is rejected, further post-hoc tests are needed to identify exactly which groups differ from each other, adding complexity.
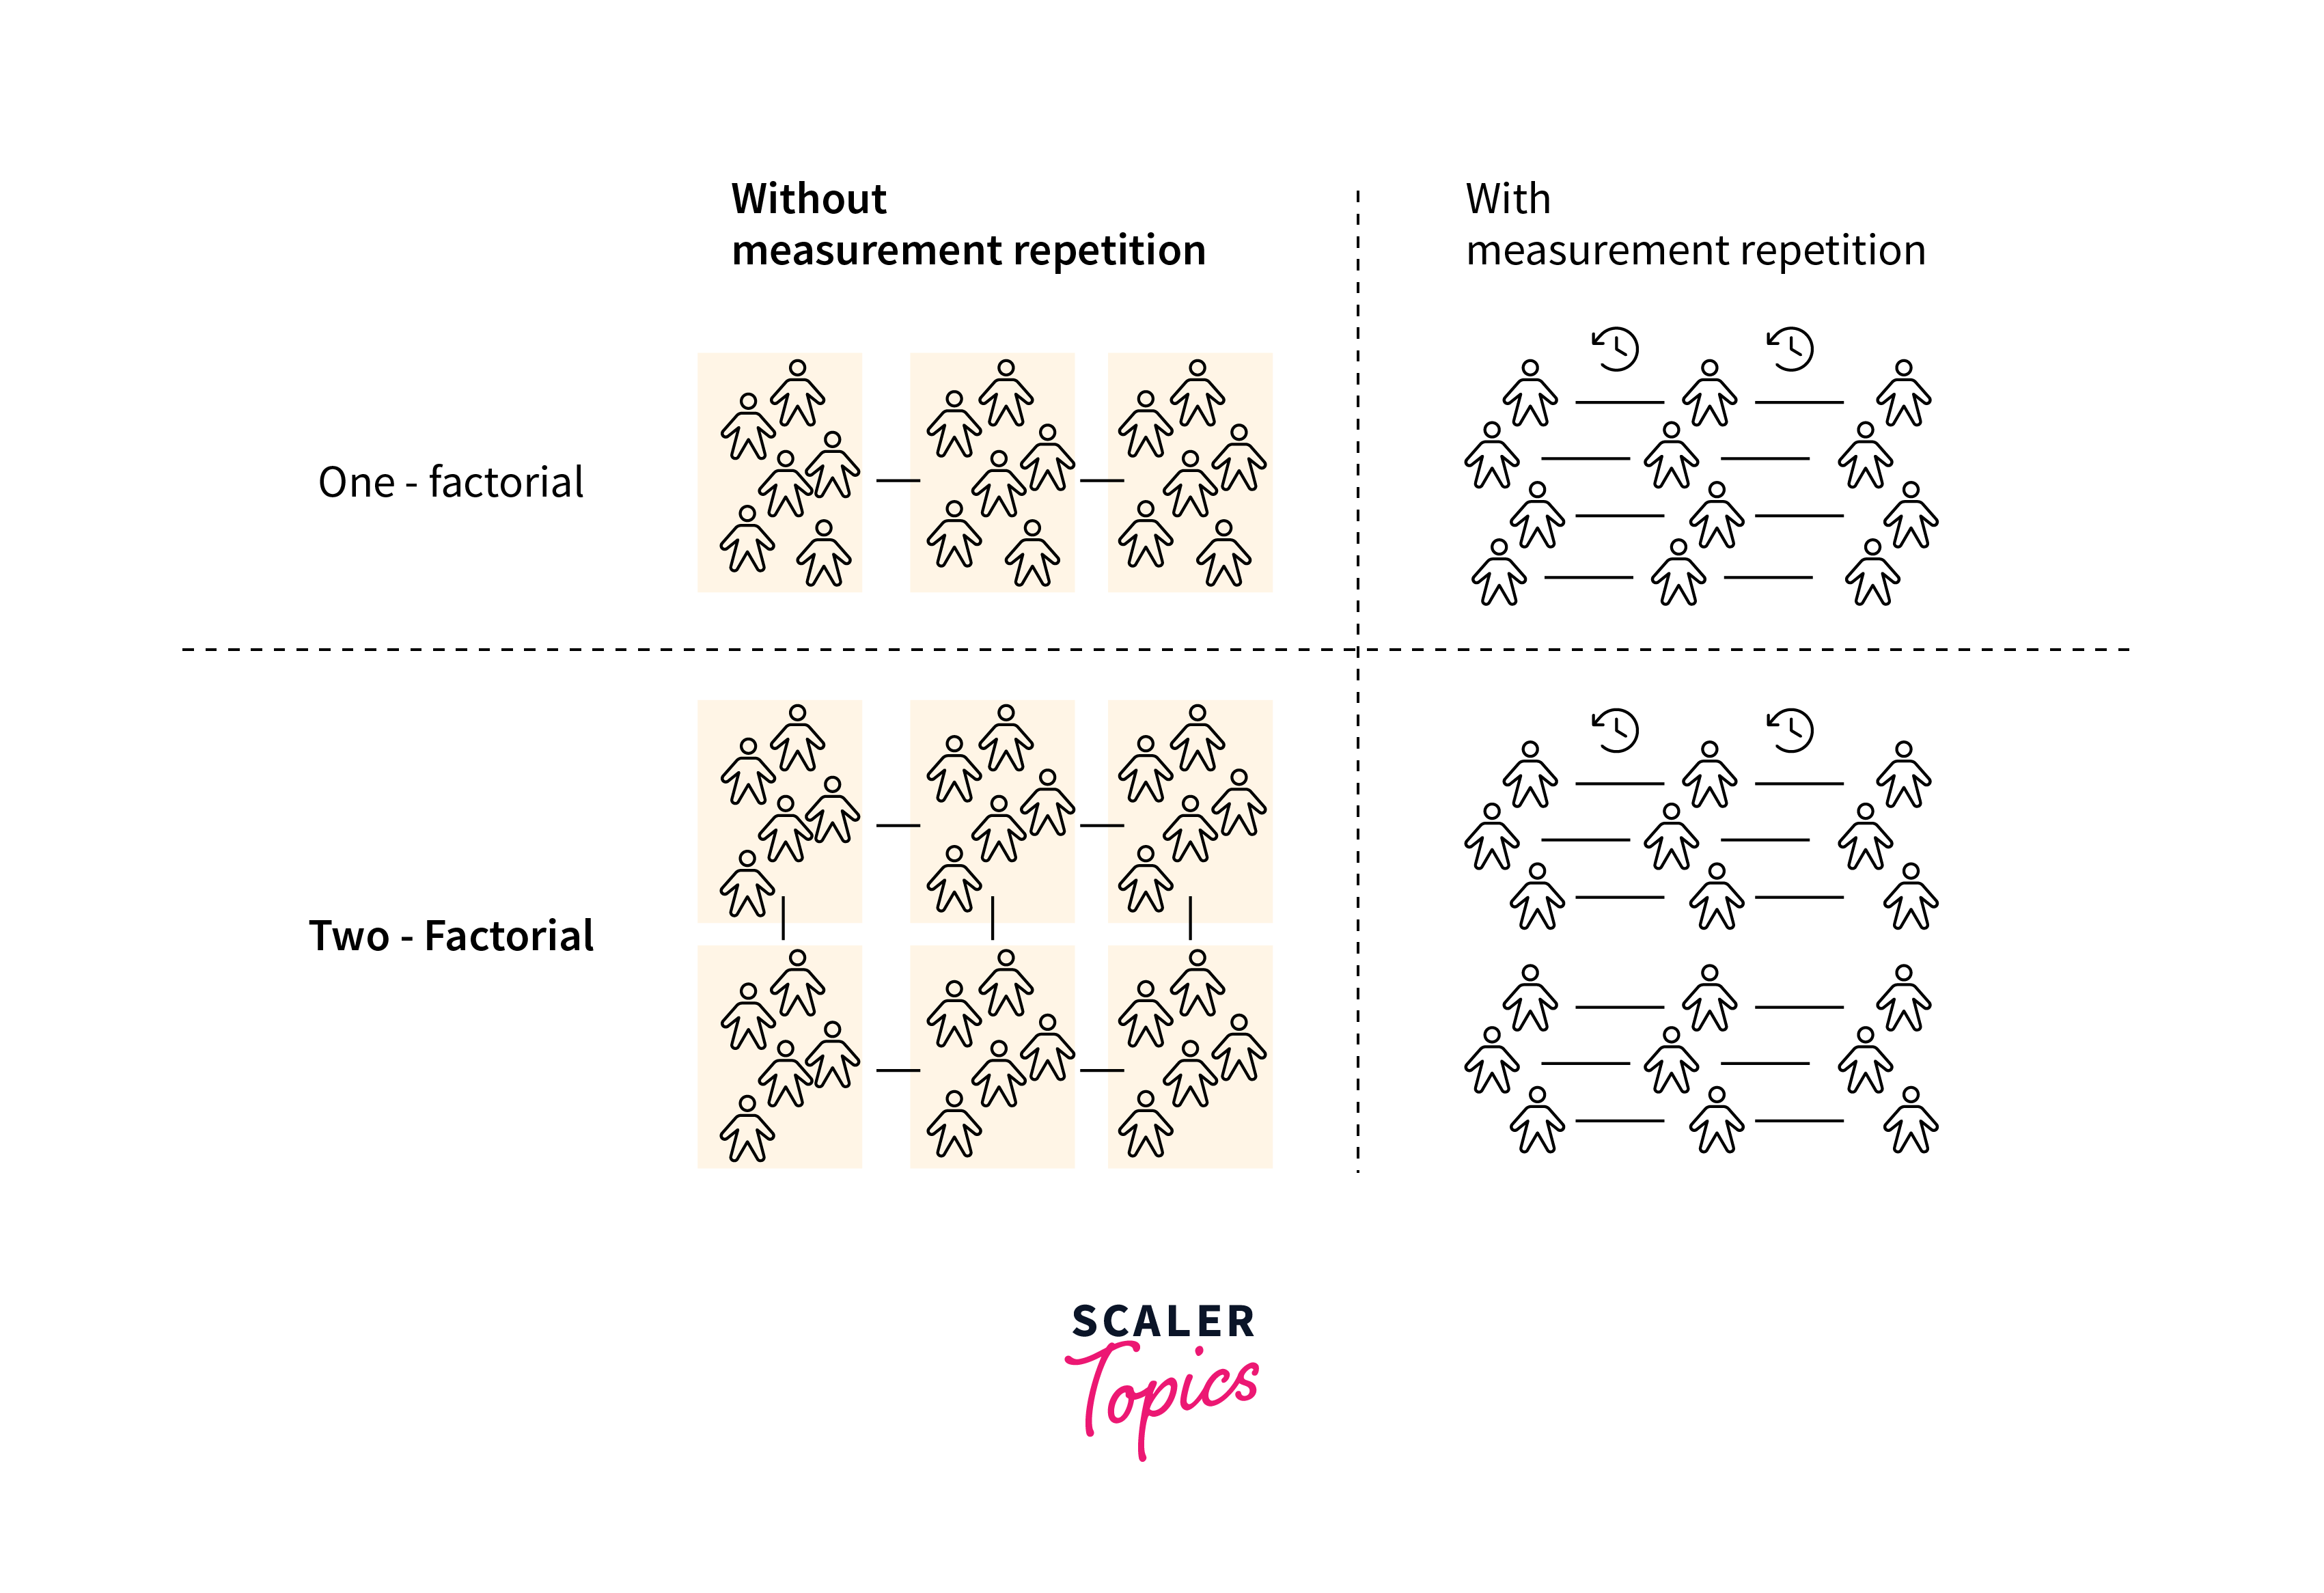
Two Way ANOVA
Two-Way ANOVA, an extension of One-Way ANOVA, examines the impact of two independent variables (factors) on a dependent variable, allowing for the evaluation of the main effect of each factor as well as the interaction effect between the factors. This test provides a more detailed analysis of what is ANOVA in statistics when multiple variables influence the outcome.
Step by Step Performance
-
Step - 1: Define the Hypotheses:
- Null Hypotheses (H0):
- There is no significant difference in the dependent variable means due to the first factor.
- There is no significant difference in the dependent variable means due to the second factor.
- There is no significant interaction effect between the two factors on the dependent variable.
- Alternative Hypotheses (H1):
-
At least one level of the first factor affects the dependent variable significantly.
-
At least one level of the second factor affects the dependent variable significantly.
-
There is a significant interaction effect between the two factors on the dependent variable.
-
- Null Hypotheses (H0):
-
Step - 2: Select Significance Level
Typically, is chosen, indicating a 5% risk level of concluding a difference or interaction exists when there isn't one. -
Step - 3: Calculate the F-Ratios:
- Between-Groups Variance for Each Factor:
Calculate means for each level of the factors, the overall mean, and the variance between these means for each factor. - Interaction Variance:
Calculate the means for each combination of levels of the two factors and their variance with the overall mean. - Within-Group Variance:
Calculate the variance within each group. - The F-ratios are then calculated for each main effect and the interaction effect by dividing their respective variances by the within-group variance.
- Between-Groups Variance for Each Factor:
-
Step - 4: Determine Degrees of Freedom:
- For each factor:
(where is the number of factors). - For interaction:
. - Within-group:
(where is the total number of observations).
- For each factor:
-
Step - 5: Find the Critical F-Values:
Use an F-distribution table to find the critical F-values corresponding to the degrees of freedom for each factor and the interaction. -
Step - 6: Compare F-Ratios:
Compare the calculated F-ratios to their respective critical F-values. If a calculated F-ratio exceeds the critical value, the null hypothesis related to that factor or interaction is rejected.
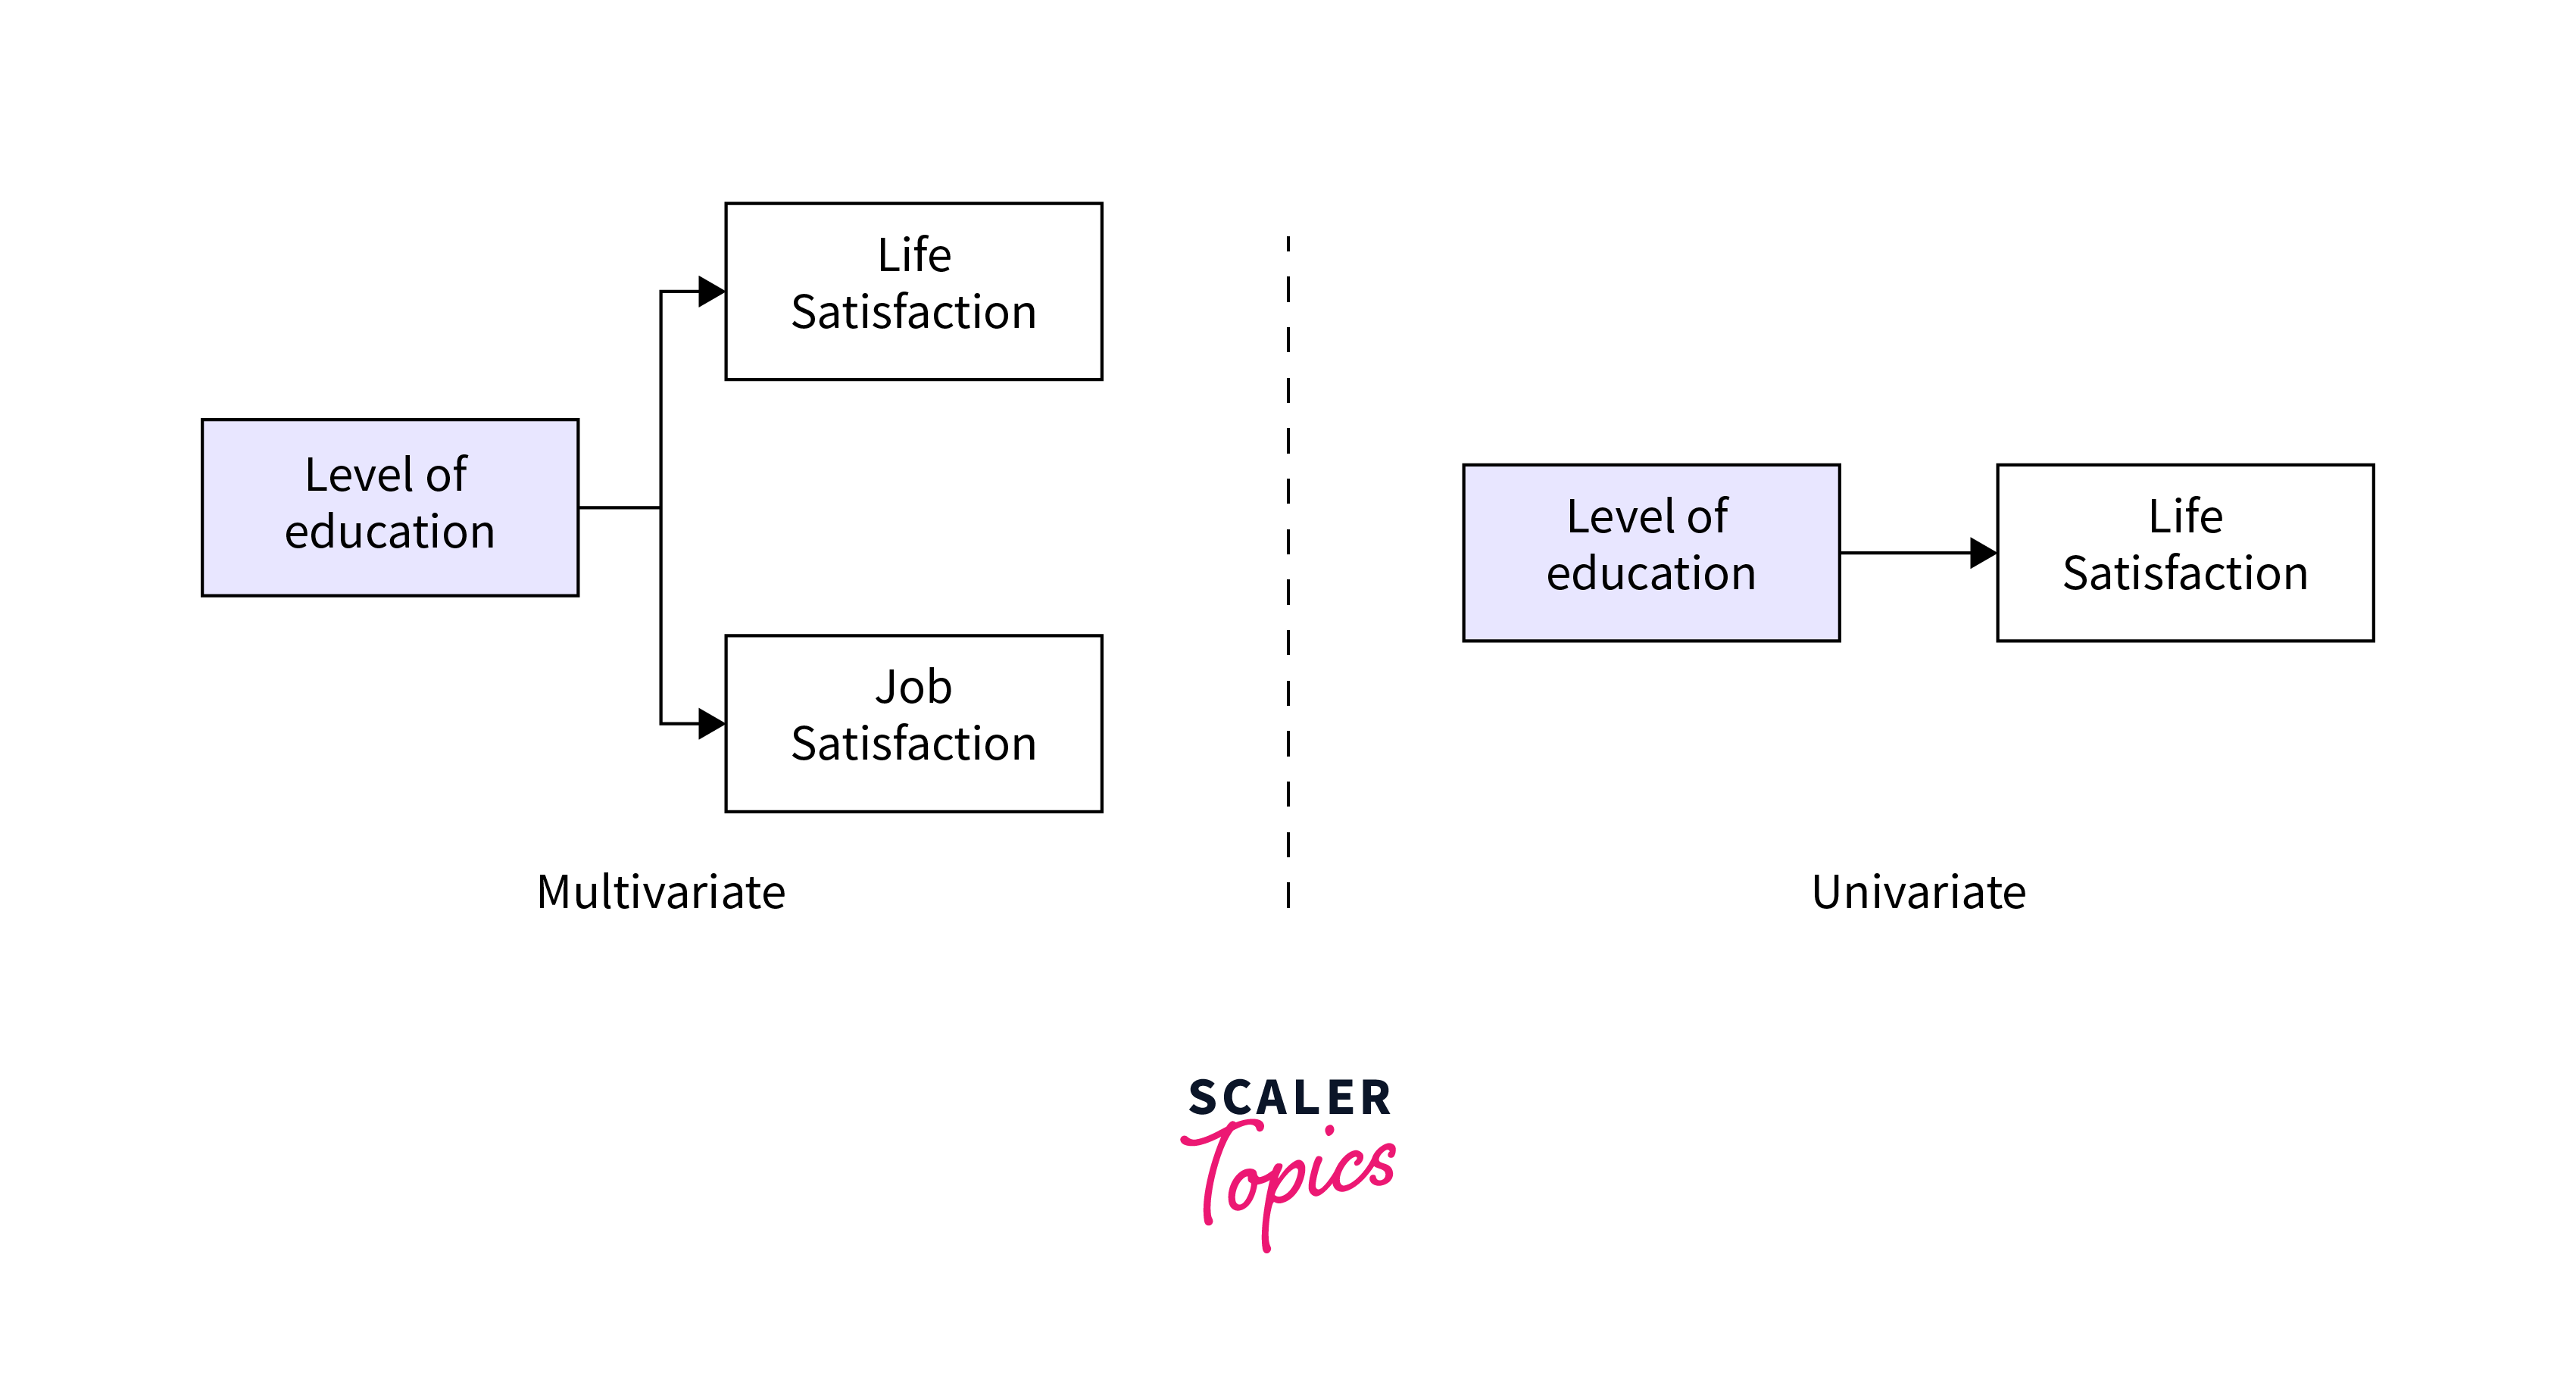
Multivariate ANOVA (MANOVA)
Multivariate Analysis of Variance (MANOVA) extends ANOVA by assessing the impact of one or more independent variables on two or more dependent variables simultaneously. This approach is useful when researchers are interested in understanding how factors affect multiple outcome measures, offering insights into the relationships among dependent variables and how they interact with the independent variables.
Steb by Step Performance
-
Step - 1: Define the Hypotheses:
- Null Hypothesis (H0):
The means of the dependent variables are equal across the levels of the independent variable(s). - Alternative Hypothesis (H1):
At least one mean of the dependent variables differs across the levels of the independent variable(s).
- Null Hypothesis (H0):
-
Step - 2: Select Significance Level:
- As with other ANOVA tests, a common choice is , which indicates a KaTeX parse error: Expected 'EOF', got '%' at position 2: 5%̲ risk of mistakenly rejecting the null hypothesis.
-
Step - 3: Prepare the Data:
Ensure that the data meets MANOVA assumptions, including multivariate normality, homogeneity of variance-covariance matrices, and absence of multicollinearity among the dependent variables. -
Step - 4: Calculate MANOVA Statistics:
- Compute the multivariate test statistics, such as Wilks’ Lambda, Pillai’s Trace, Hotelling’s Trace, or Roy’s Largest Root, based on the sum of squares and cross-products matrices for both within and between groups.
-
Step - 5: Determine Degrees of Freedom:
- The degrees of freedom for MANOVA are a bit more complex, involving both the number of dependent variables and the sample size.
-
Step - 6: Find Critical Values and Interpret:
- Use the calculated statistics to find the corresponding critical values from statistical tables.
- Interpret the results based on these values to determine whether to reject the null hypothesis.
-
Step - 7: Post-hoc Analysis (if needed):
- If the null hypothesis is rejected, conduct post-hoc tests to explore the specific differences among group means. This may involve conducting separate ANOVAs for each dependent variable or using multivariate post-hoc comparisons.
FAQs
Q. What is the primary purpose of ANOVA?
A. The primary purpose of ANOVA is to determine whether there are any statistically significant differences between the means of three or more unrelated groups.
Q. How does Two-Way ANOVA differ from One-Way ANOVA?
A. While One-Way ANOVA examines the effect of a single factor on a dependent variable, Two-Way ANOVA assesses the impact of two independent factors and their interaction on a dependent variable.
Q. Can ANOVA be used for non-normal data?
A. ANOVA is robust to minor violations of normality, especially with larger sample sizes, but for significantly non-normal data, non-parametric alternatives like the Kruskal-Wallis test might be more appropriate.
Q. What is MANOVA and when should it be used?
A. MANOVA (Multivariate Analysis of Variance) is used to analyze the impact of one or more independent variables on two or more dependent variables simultaneously, ideal for examining complex relationships and interactions between factors and outcomes.
Conclusion
- ANOVA, including its variants One-Way, Two-Way, and MANOVA, serves as a comprehensive statistical tool for analyzing the differences among group means across one or more factors.
- From simple comparisons between groups (One-Way ANOVA) to more complex interactions between factors (Two-Way ANOVA) and multiple dependent variables (MANOVA), ANOVA offers versatility in handling various research designs and questions.
- Understanding what is ANOVA in statistics is crucial for researchers and analysts in making informed decisions based on the significance of data differences, thereby guiding scientific and business insights.
- Successful application of ANOVA tests relies on meeting certain assumptions such as normality, independence, and homogeneity of variances, highlighting the importance of preliminary data analysis.
- Mastery of ANOVA concepts lays the groundwork for further statistical learning and application, including multivariate statistical techniques and complex experimental designs.