What is OLAP (Online Analytical Processing)
Overview
OLAP (Online Analytical Processing) is a computing software that allows users to extract and analyze data from multiple perspectives, providing insights into complex business processes. It provides a multidimensional view of data that enables faster and more efficient analysis. OLAP systems are widely used in business intelligence, financial reporting, planning, and other applications that require complex data analysis. In this article, we will describe what is OLAP and how OLAP systems work. We will also cover what is OLAP cube, what is OLAP system guidelines, what is OLAP system types, and what is OLAP system uses.
What is OLAP?
OLAP (Online Analytical Processing) is a technology that enables users to analyze data from multiple dimensions, allowing for faster and more efficient analysis of complex business processes.
OLAP systems are used in various applications, such as business intelligence, financial reporting, sales analysis, supply chain management, etc. OLAP generates reports in business intelligence, performs ad-hoc analysis, and visualizes data using charts and graphs.
OLAP is important because it provides users with a multidimensional view of data that allows for faster and more efficient analysis. It enables users to extract and analyze data from multiple perspectives, providing insights into complex business processes. OLAP systems also provide a user-friendly interface that makes it easy for users to generate reports, perform ad-hoc analysis, and visualize data using various charts and graphs. This makes it easier for organizations to make informed decisions based on data-driven insights.
What is OLAP Cube?
An OLAP cube, a multidimensional cube, is a data structure used in OLAP systems to represent and analyze data from multiple dimensions. OLAP cube allows for quick and efficient data mining. OLAP cubes are at the heart of OLAP systems. They provide a multidimensional view of data, allowing users to analyze data from different perspectives. OLAP cubes consist of multiple dimensions and measures organized in a hierarchical structure. Users can navigate the cube by selecting dimensions and measures to analyze the data.
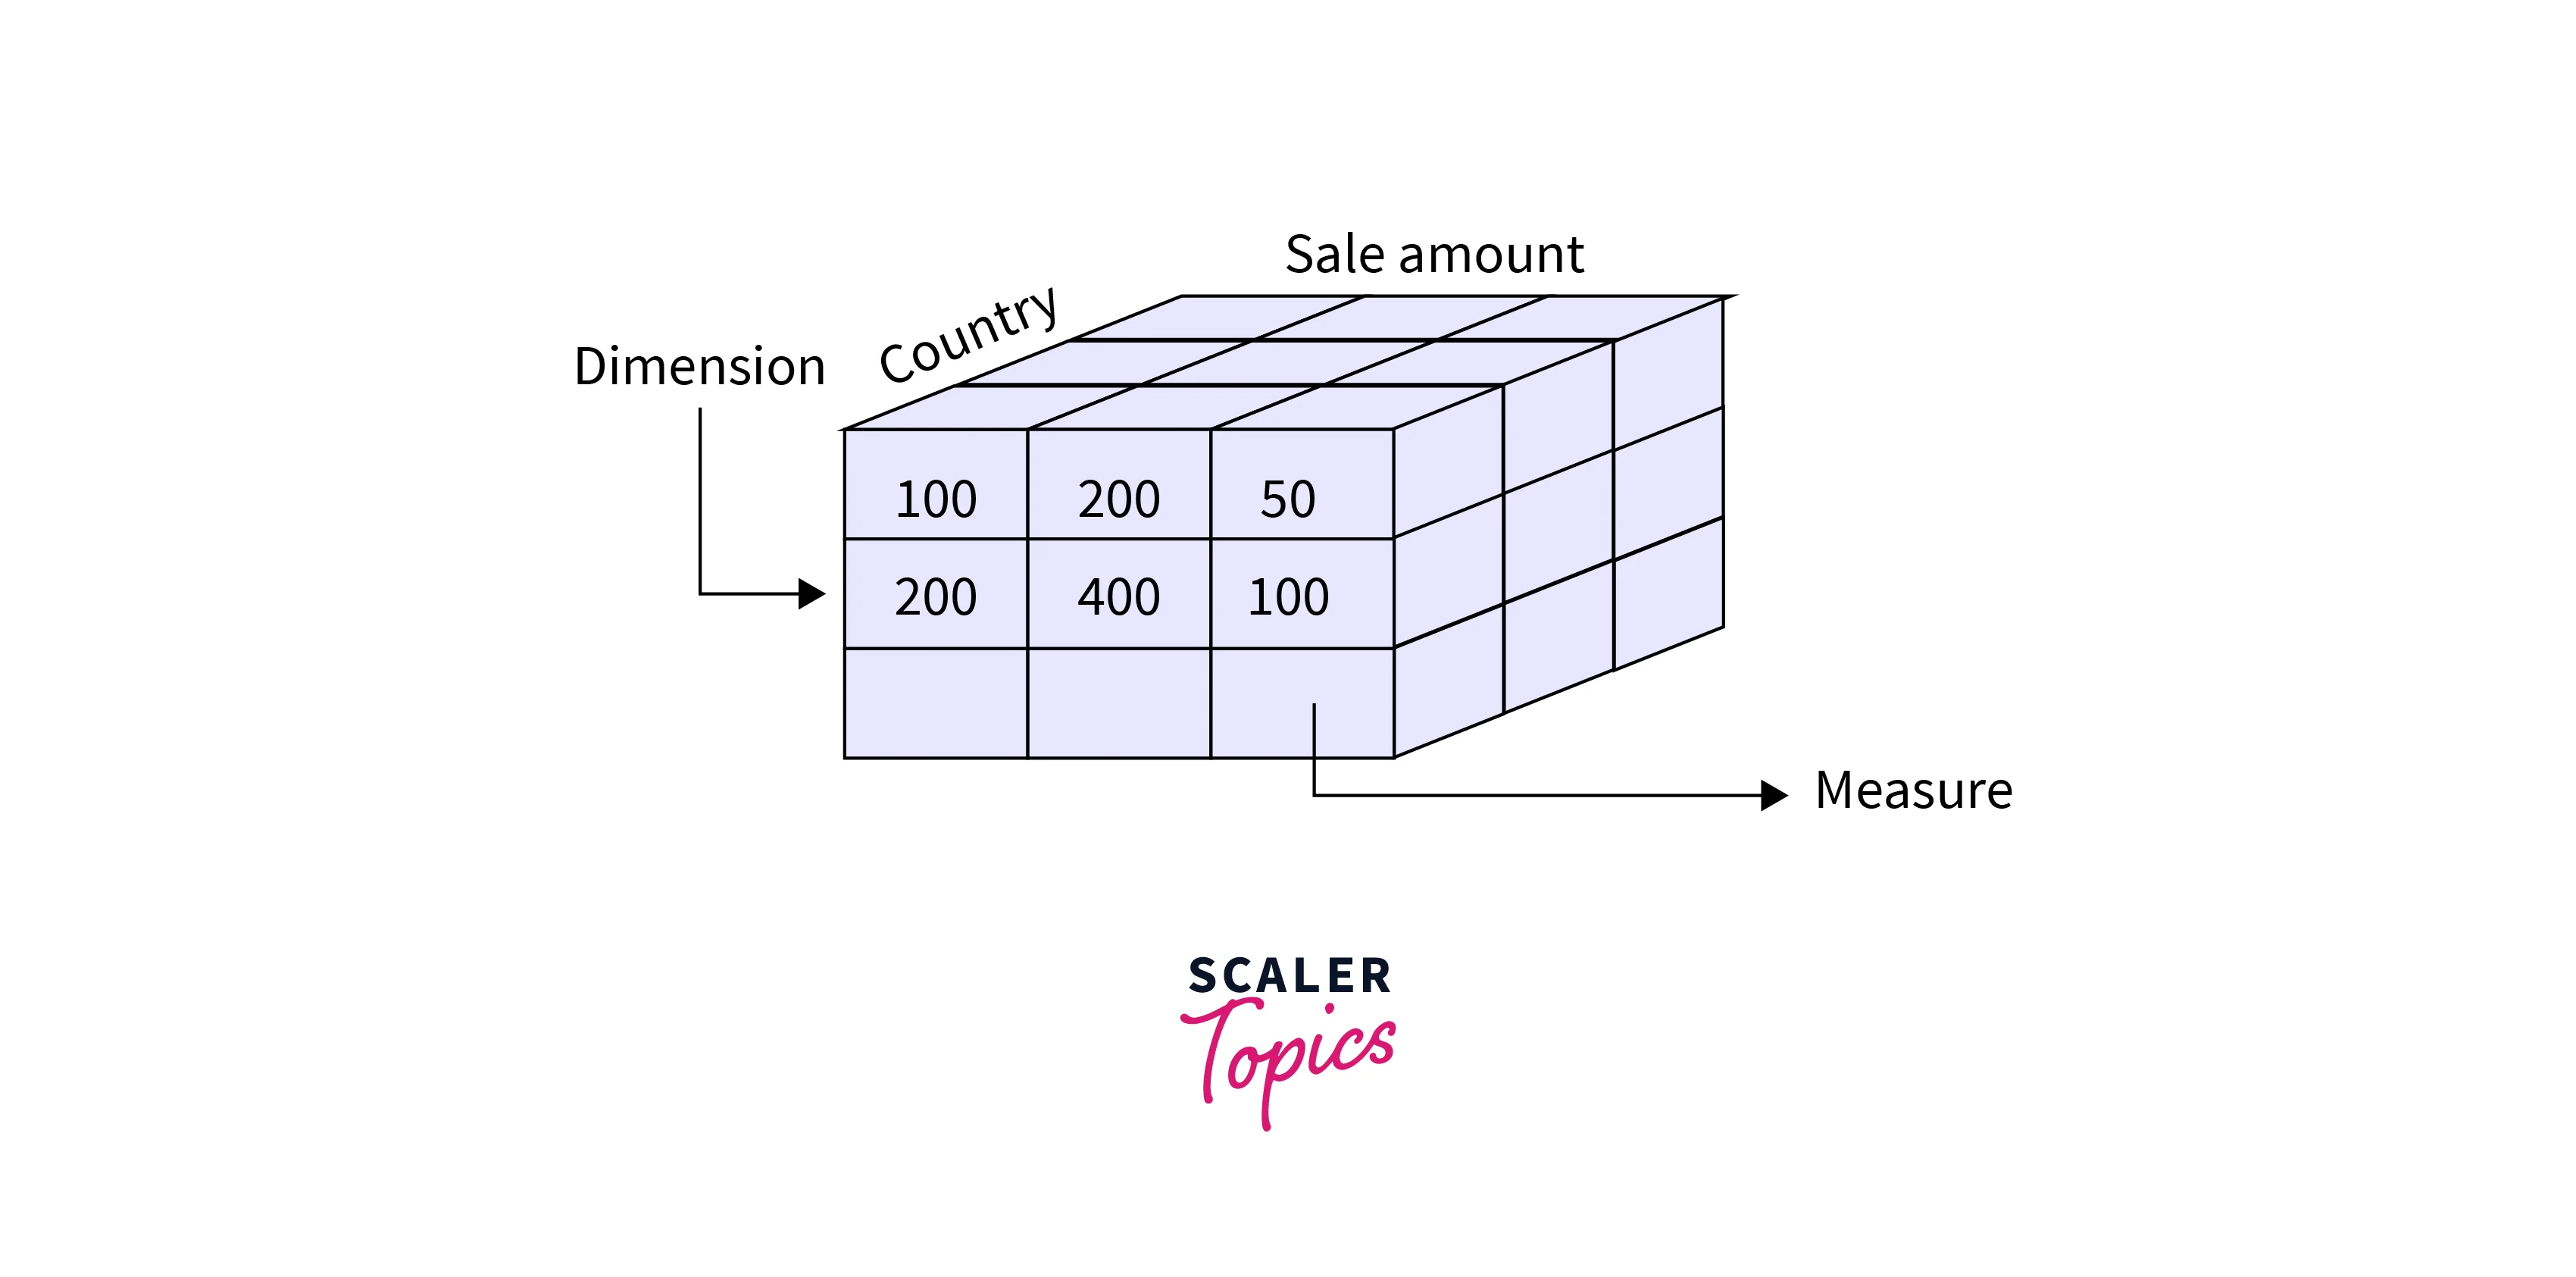
For example, in a sales cube shown above, the measures might include sales amount, revenue, or profit, while the dimensions might include country, product, or time. Each cell in the cube represents the intersection of a specific combination of dimensions and measures. The cube can be sliced, diced, and rotated to view the data from different perspectives and to perform various types of analysis.
OLAP cubes can be created using specialized software tools, which typically use a process called data aggregation to transform large volumes of transactional data into a more compact, multidimensional format that can be queried and analyzed more efficiently. Cubes can be stored on disk or in memory and accessed by various OLAP tools and applications to perform data analysis, reporting, and visualization.
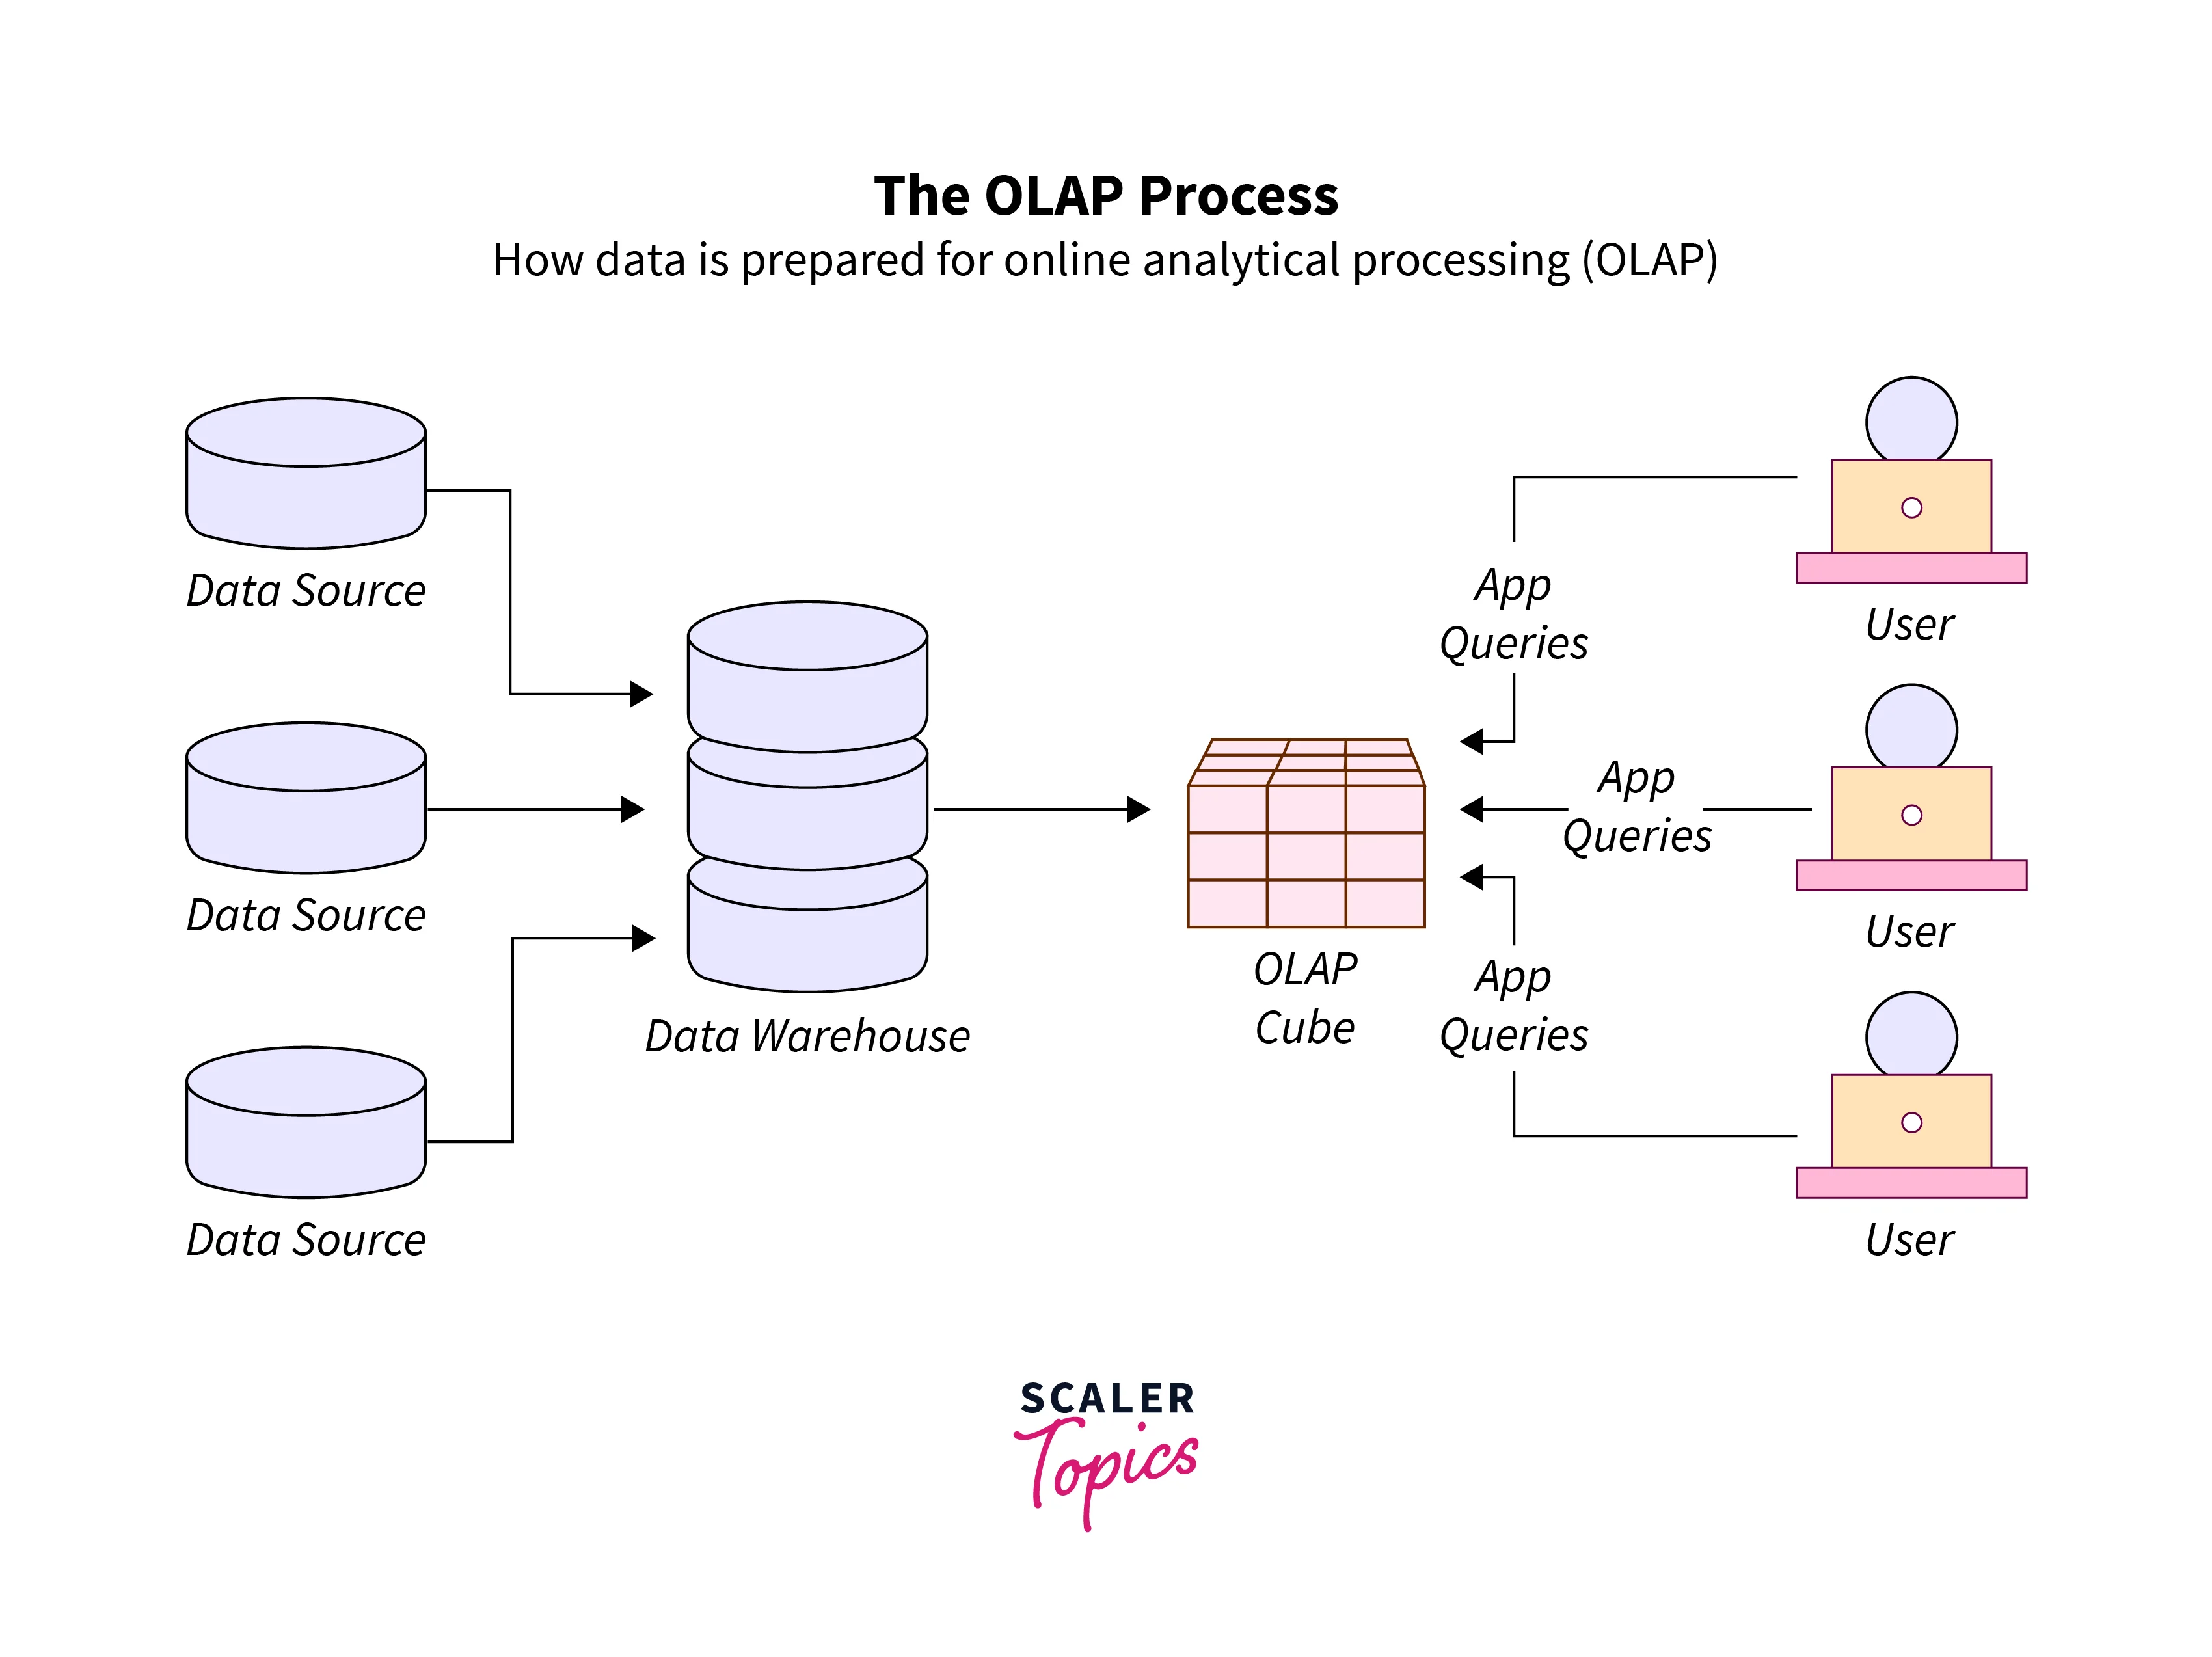
How do OLAP Systems Work?
The OLAP system typically consists of three main segments -
- Data Extraction -
In the first segment of the OLAP process, data is extracted from various sources such as databases, spreadsheets, and other data repositories. The data is then transformed and loaded into the OLAP system. - OLAP Cube -
The second segment of the OLAP process involves the creation of an OLAP cube. The OLAP cube is a multidimensional data structure representing data in multiple dimensions, such as time, geography, and product. The cube contains measures (such as sales revenue) and dimensions (such as product categories), and each cell in the cube represents a specific intersection of a measure and a dimension. - User Interface -
The third segment of the OLAP process involves the user interface, which allows users to access and interact with the OLAP cube. Users can use various OLAP tools and applications to analyze the data in the cube, including slicing and dicing the data based on different dimensions, drilling down into the data to view more detailed information, and generating reports and visualizations of the data. The user interface can be customized to meet the specific needs of different users and can be designed to be user-friendly and intuitive, even for non-technical users.
A typical OLAP process is shown in the figure below -
OLAP Guidelines
Dr. E.F. Codd, the inventor of the relational database model, proposed 12 guidelines, also known as "Codd's Rules," for OLAP systems. Here are the 12 OLAP guidelines based on Codd's Rules -
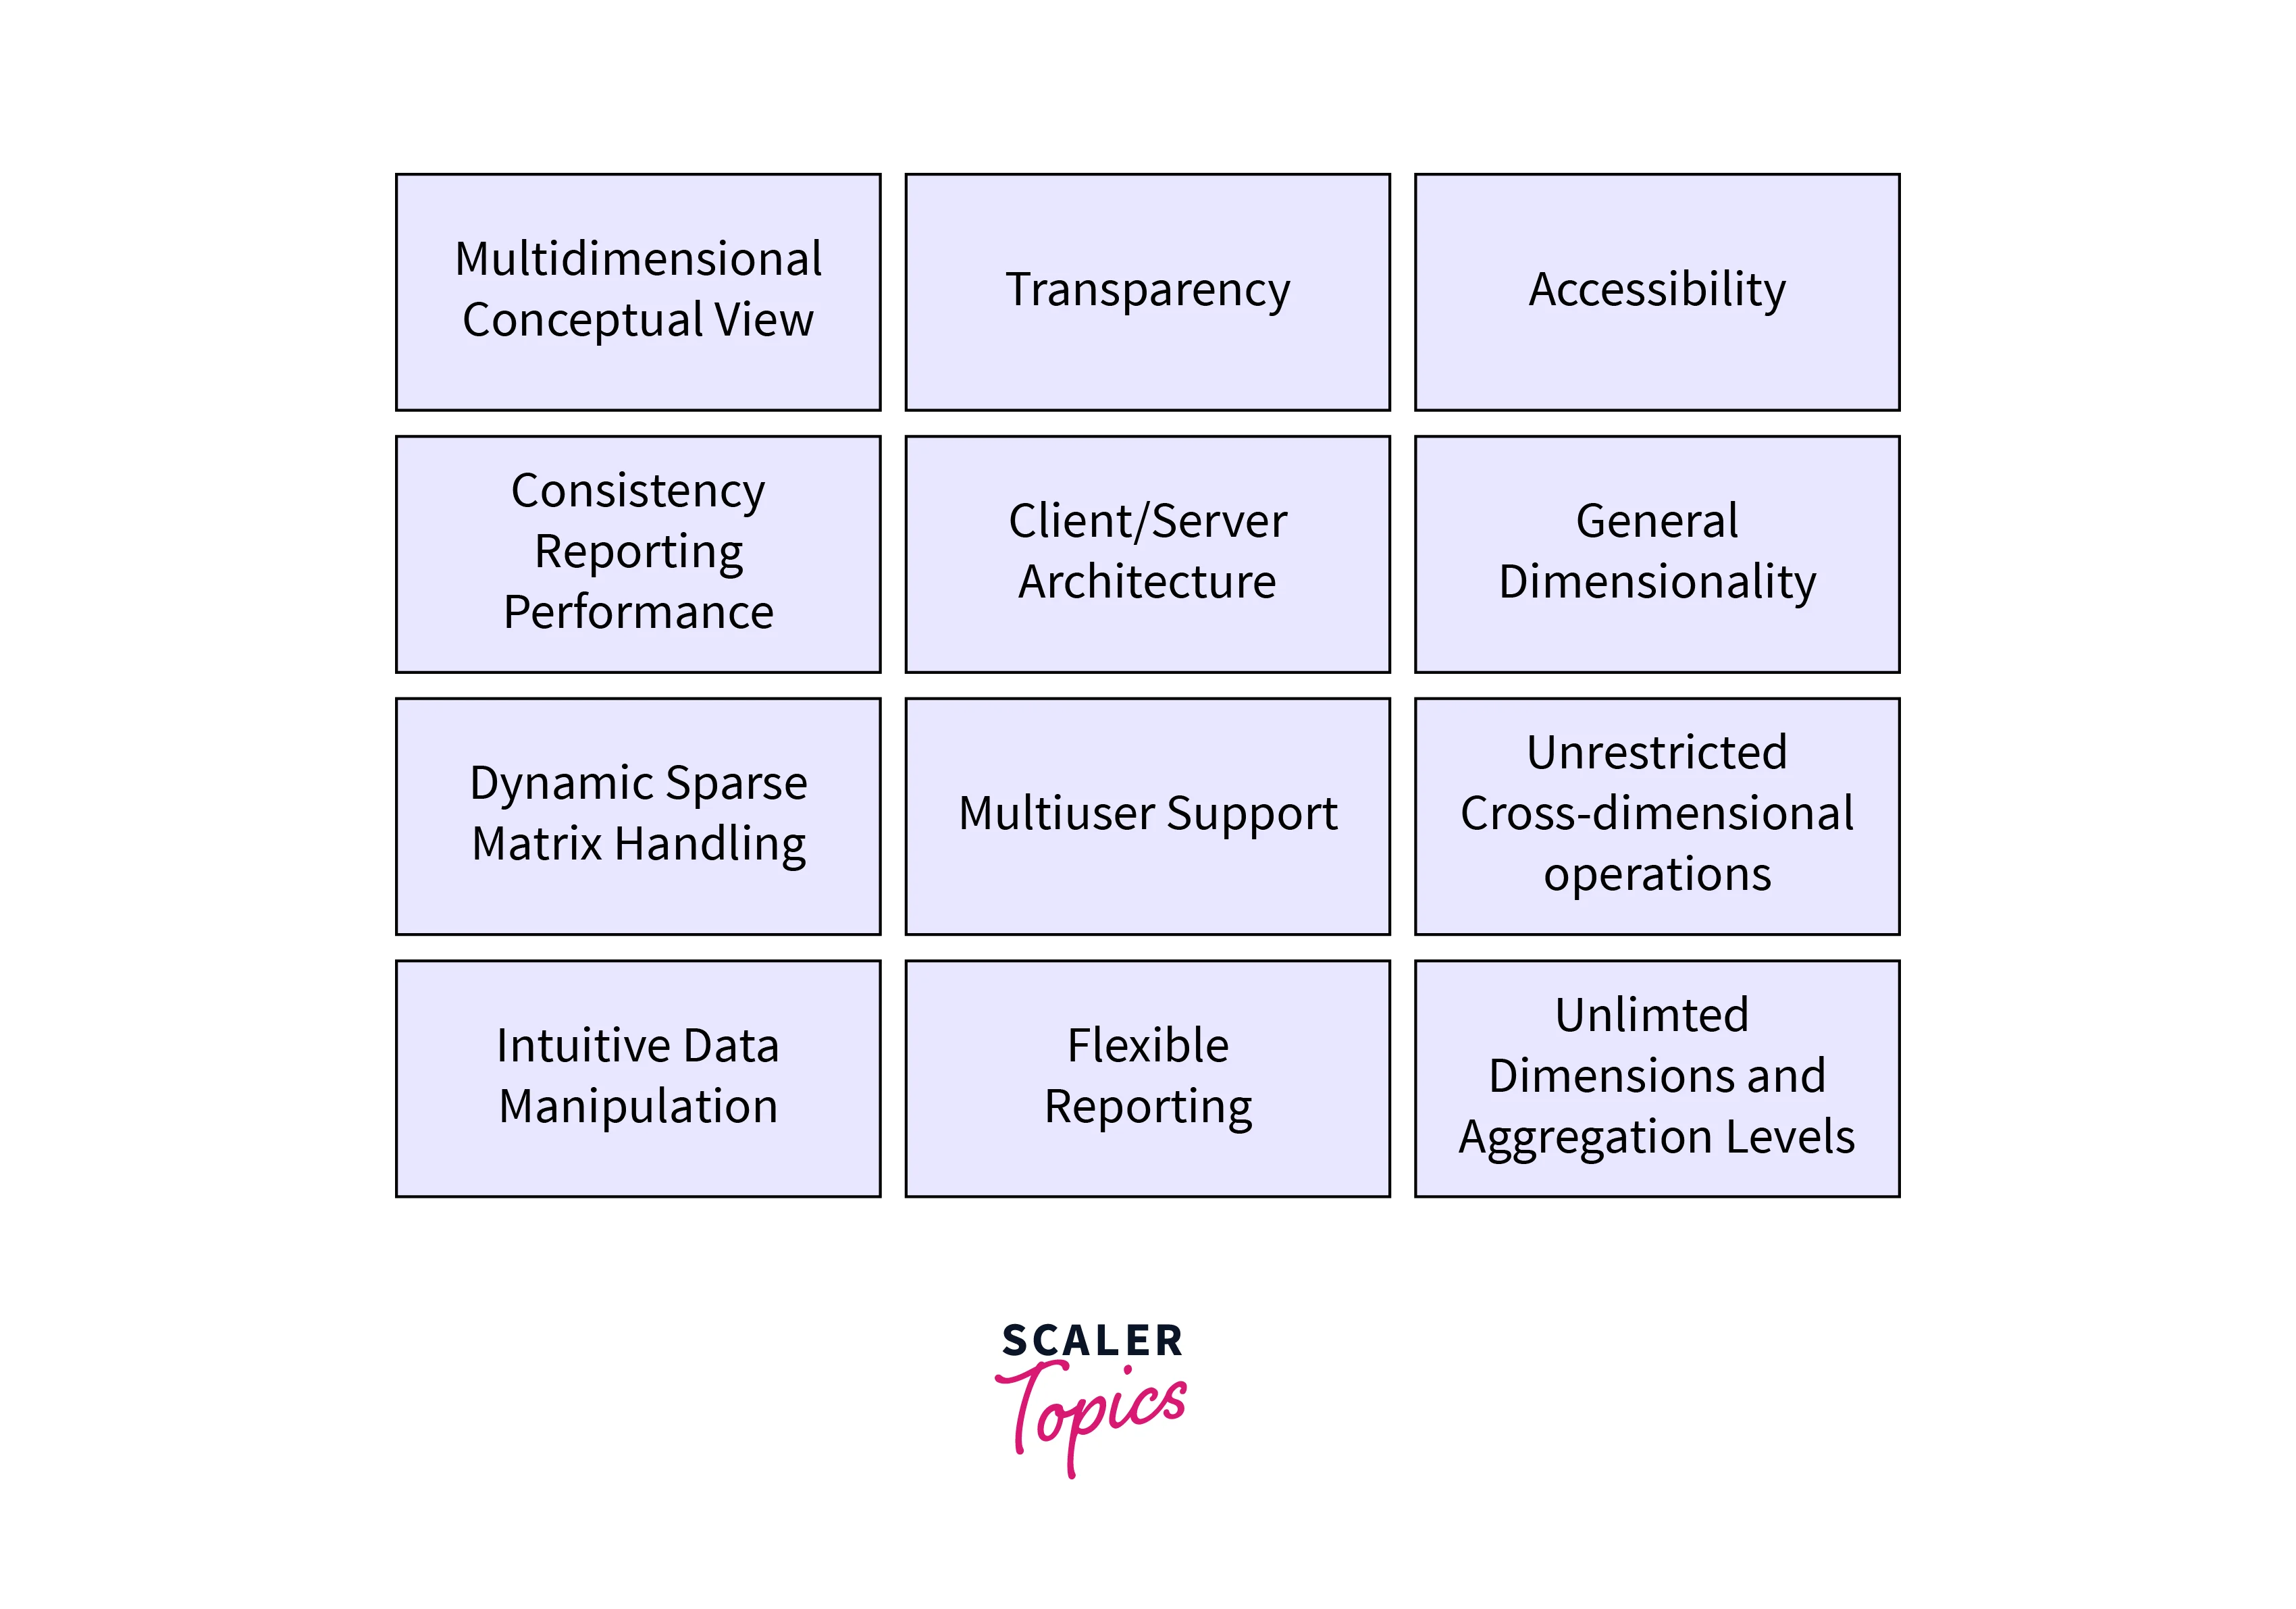
- Multidimensional Conceptual View -
This guideline emphasizes the importance of providing a multidimensional view of data to enable users to analyze data from multiple perspectives. This view allows users to perform complex data analysis and obtain insights that would be difficult to achieve with a single-dimensional view of the data. - Transparency -
The transparency guideline is essential in ensuring that users can view and analyze the data without needing to know the underlying structure of the data. This rule helps simplify the user experience and increases the system's usability by removing technical complexities. - Accessibility -
The accessibility guideline highlights the importance of ensuring that the OLAP system is accessible to a wide range of users with varying technical expertise. The system should be easy to use and navigate, regardless of the user's level of technical knowledge. - Consistent Reporting Performance -
Consistent reporting performance is crucial to ensure that users can generate reports quickly and accurately, regardless of the size or complexity of the data. This guideline emphasizes the need to optimize performance to provide users with a seamless reporting experience. - Client-Server Architecture -
The client-server architecture guideline stresses the importance of designing an OLAP system with a client-server architecture to enable multiple users to access and analyze the data simultaneously. This architecture also provides a scalable solution that can be easily adapted to handle increasing amounts of data. - Generic Dimensionality -
This guideline emphasizes the importance of creating an OLAP system that can handle any data type, regardless of its dimensionality. This feature allows users to perform analysis on various types of data and supports the expansion of the system as new types of data are added over time. - Dynamic Sparse Matrix Handling -
OLAP systems should be able to handle large, sparse data sets efficiently. This guideline is important because OLAP systems typically deal with large amounts of data, and sparse data sets can be particularly challenging to handle. Efficient handling of sparse data sets can improve the performance and usability of the OLAP system. - Multi-User Support -
OLAP systems should support multiple users accessing and analyzing the data simultaneously. This guideline is important because teams or organizations often use OLAP systems, and multiple users may need to access and analyze the data simultaneously. Multi-user support can improve the collaboration and productivity of the team. - Unrestricted Cross-Dimensional Operations -
Users should be able to perform cross-dimensional operations without restrictions. This guideline is important because users often need to analyze data from multiple dimensions to gain insights and identify trends. Unrestricted cross-dimensional operations can enable users to perform complex analyses and better understand the data. - Intuitive Data Manipulation -
Users should be able to manipulate the data easily and intuitively without requiring specialized training. This guideline is important because OLAP systems are often used by non-technical users without extensive data analysis training or experience. Intuitive data manipulation can make the system more user-friendly and accessible to a wider range of users. - Flexible Reporting -
OLAP systems should provide flexible reporting options, including ad-hoc and user-defined reporting. This guideline is important because users may have different reporting needs depending on their role or the specific insights they seek. Flexible reporting can allow users to generate custom reports and visualizations that meet their unique needs. - Unlimited Dimensions and Aggregation Levels -
OLAP systems should be able to handle an unlimited number of dimensions and aggregation levels to provide maximum flexibility for data analysis. This guideline is important because data analysis needs can vary greatly depending on the business or organization. The ability to handle unlimited dimensions and aggregation levels can ensure that the OLAP system can adapt to changing analysis needs over time.
Types of OLAP Systems
There are three main types of OLAP systems -
- MOLAP (Multidimensional OLAP) -
MOLAP systems store data in a multidimensional cube format, allowing rapid data retrieval and analysis. They typically provide fast query response times but may be limited in their ability to handle large data sets. - ROLAP (Relational OLAP) -
ROLAP systems store data in traditional relational database tables and use SQL queries to retrieve and analyze data. They are typically more flexible and can handle larger datasets than MOLAP systems but may have slower query response times. - HOLAP (Hybrid OLAP) -
HOLAP systems combine the strengths of both MOLAP and ROLAP systems by storing summary data in a multidimensional cube format and more detailed data in a relational database. This allows for both fast query response times and the ability to handle larger data sets.
Uses of OLAP Systems
OLAP systems are widely used in business intelligence and data mining applications. Some of the common uses of OLAP systems include the following -
- Financial Analysis -
OLAP systems are commonly used in finance to analyze financial data and performance metrics, such as sales revenue, expenses, profit margins, and inventory levels. - Sales and Marketing Analysis -
OLAP systems can help companies analyze customer behavior and buying patterns, track sales performance by product or region, and identify market trends and opportunities. - Supply Chain Management -
OLAP systems can track inventory levels, manage supply chain logistics, and optimize production schedules. - Human Resource Management -
OLAP systems can help organizations analyze HR data, such as employee turnover rates, compensation and benefits, and workforce demographics. - Healthcare Analytics -
OLAP systems are increasingly used in healthcare to analyze patient data, track healthcare outcomes, and identify patterns and trends in disease prevalence and treatment effectiveness.
Conclusion
- OLAP systems are a type of database system used for business intelligence and data analysis applications, allowing users to perform multidimensional analyses of large datasets. They are important because they enable organizations to gain insights into complex data sets, make better decisions, and improve overall business performance.
- The OLAP process involves data extraction, aggregation, and analysis through a multidimensional cube and a user interface for querying and reporting.
- OLAP systems have a wide range of applications, including financial analysis, sales and marketing analysis, supply chain management, human resource management, and healthcare analytics.