One Sample & Two Sample Z-Tests in Excel
Overview
IQ Analysis of a population sample in Excel is a method of examining the intelligence quotient (IQ) data of a group to derive meaningful insights. Excel's vast array of statistical tools like histograms, mean, median, mode, standard deviation, and various charting capabilities allow for comprehensive analysis. Users can easily calculate, visualize, and interpret IQ distributions, analyze variance, identify trends and patterns, and make informed decisions based on these insights. This process is vital in fields like education, psychology, and research, aiding in understanding cognitive abilities and developing effective strategies.
What are we building?
We are going to build an Excel project to demonstrate the IQ Analysis of a population sample in Excel.
Pre-requisites
- Data Analytics in Excel
- Z-test in Excel
- T-test
How are we going to build this?
To produce samples, Excel offers a tool for data analysis called sampling.
- The population must first be defined as a range in an Excel spreadsheet for the tool to function. The tool will then use the following input parameters to decide how to conduct the sampling.
- Enter the data range containing the population values you wish to sample in the input range field.
- Select one of the two sampling intervals listed below for the sampling method:
- Periodic - In this situation, you must define the Period n during which sampling is to occur. Then, the output column receives copies of the nth value in the input range and the following nth values. Once the input range has been exhausted, sampling is stopped.
- You must specify the Random Number of Samples in this situation. The resulting set of values is chosen at random within the input range. A value may be chosen many times. (Sampling involves replacement, for example).
Following the Sampling Method's description, the result is a column range containing a sample from the input range's data.
Final Output
Requirements
The Analysis ToolPak can help you develop complex statistical or engineering studies faster and with fewer steps. The tool uses the required statistical or engineering macro functions to calculate and present the results in an output table once you supply the necessary data and parameters for each analysis—some tools not only output tables but also charts.
One worksheet at a time is the only one on which the data analysis features can be used. When you run a data analysis on grouped worksheets, the first worksheet will display the results, while the remaining worksheets will display empty prepared tables. Recalculate the analysis tool for each worksheet to do data analysis on the remaining worksheets.
Select the Add-Ins category from the File tab, Options, and Add-Ins.
If you're using Excel 2007, select Excel Options by clicking the Microsoft Office Button picture.
- Select Excel Add-ins in the Manage box, then click Go.
- Select Tools > Excel Add-ins from the file menu if you use Excel for Mac.
- Check the Analysis ToolPak checkbox in the Add-Ins box, then click OK.
- Click Browse to find Analysis ToolPak if it isn't listed in the Add-Ins available box.
- When requested to install the Analysis ToolPak, if it isn't already on your machine, choose Yes.
Building IQ Analysis of a population sample in Excel
1. One Sample Z-Test in Excel
To determine whether a population mean significantly differs from an assumed value, a one-sample z-test in excel is used.
Let's say that the average IQ in a population has a mean of 100 and a standard deviation of 15.
A scientist wants to know if a new drug affects IQ levels, so she enrolls 20 patients to take it for a month, and at the end of the month, she records their IQ scores.
If we want to find out if the new drug significantly affects IQ levels, we may use the Excel formula below to run a one-sample z-test:
=Z.TEST(A2
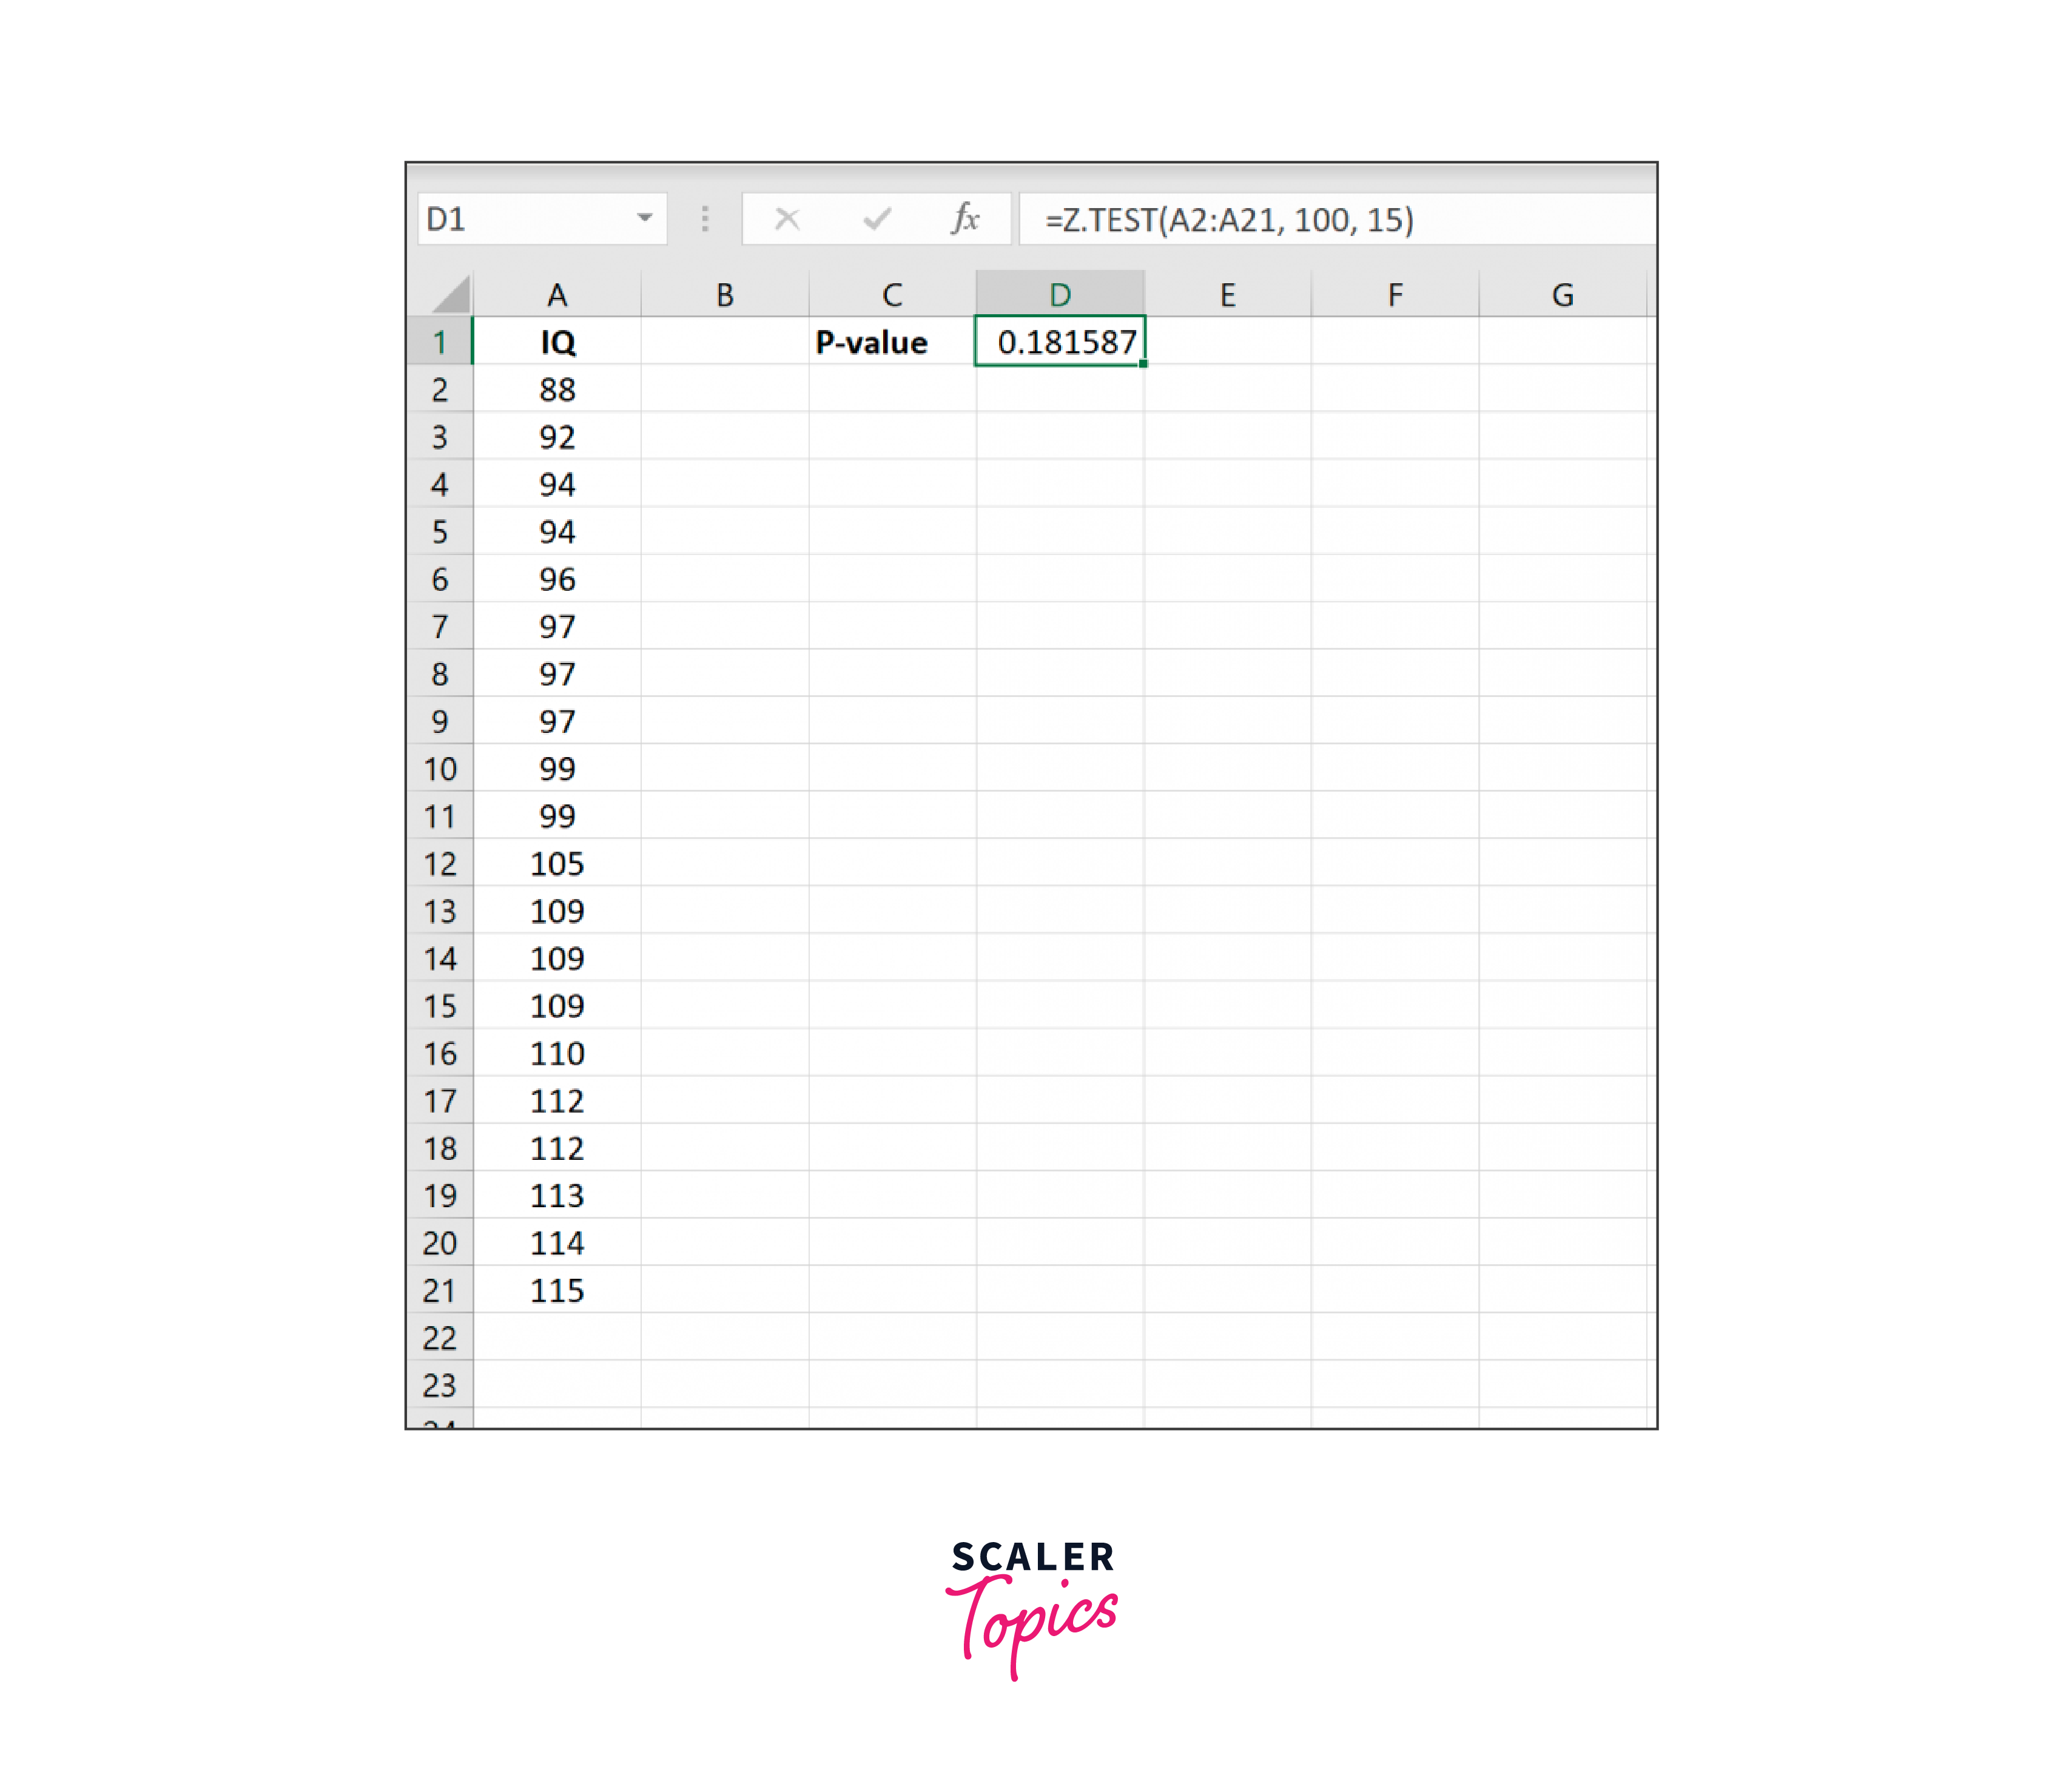
The p-value with one tail is 0.181587. Given that this is a two-tailed test, we may multiply this number by two to get the result p = 0.363174.
We need more information to reject the null hypothesis because this p-value is more than.05.
Thus, we conclude that the new drug has little to no effect on IQ.
2. Two Sample Z-Test in Excel
People's IQ levels are known to be normally distributed, with population standard deviations of 15 in each of the two cities.
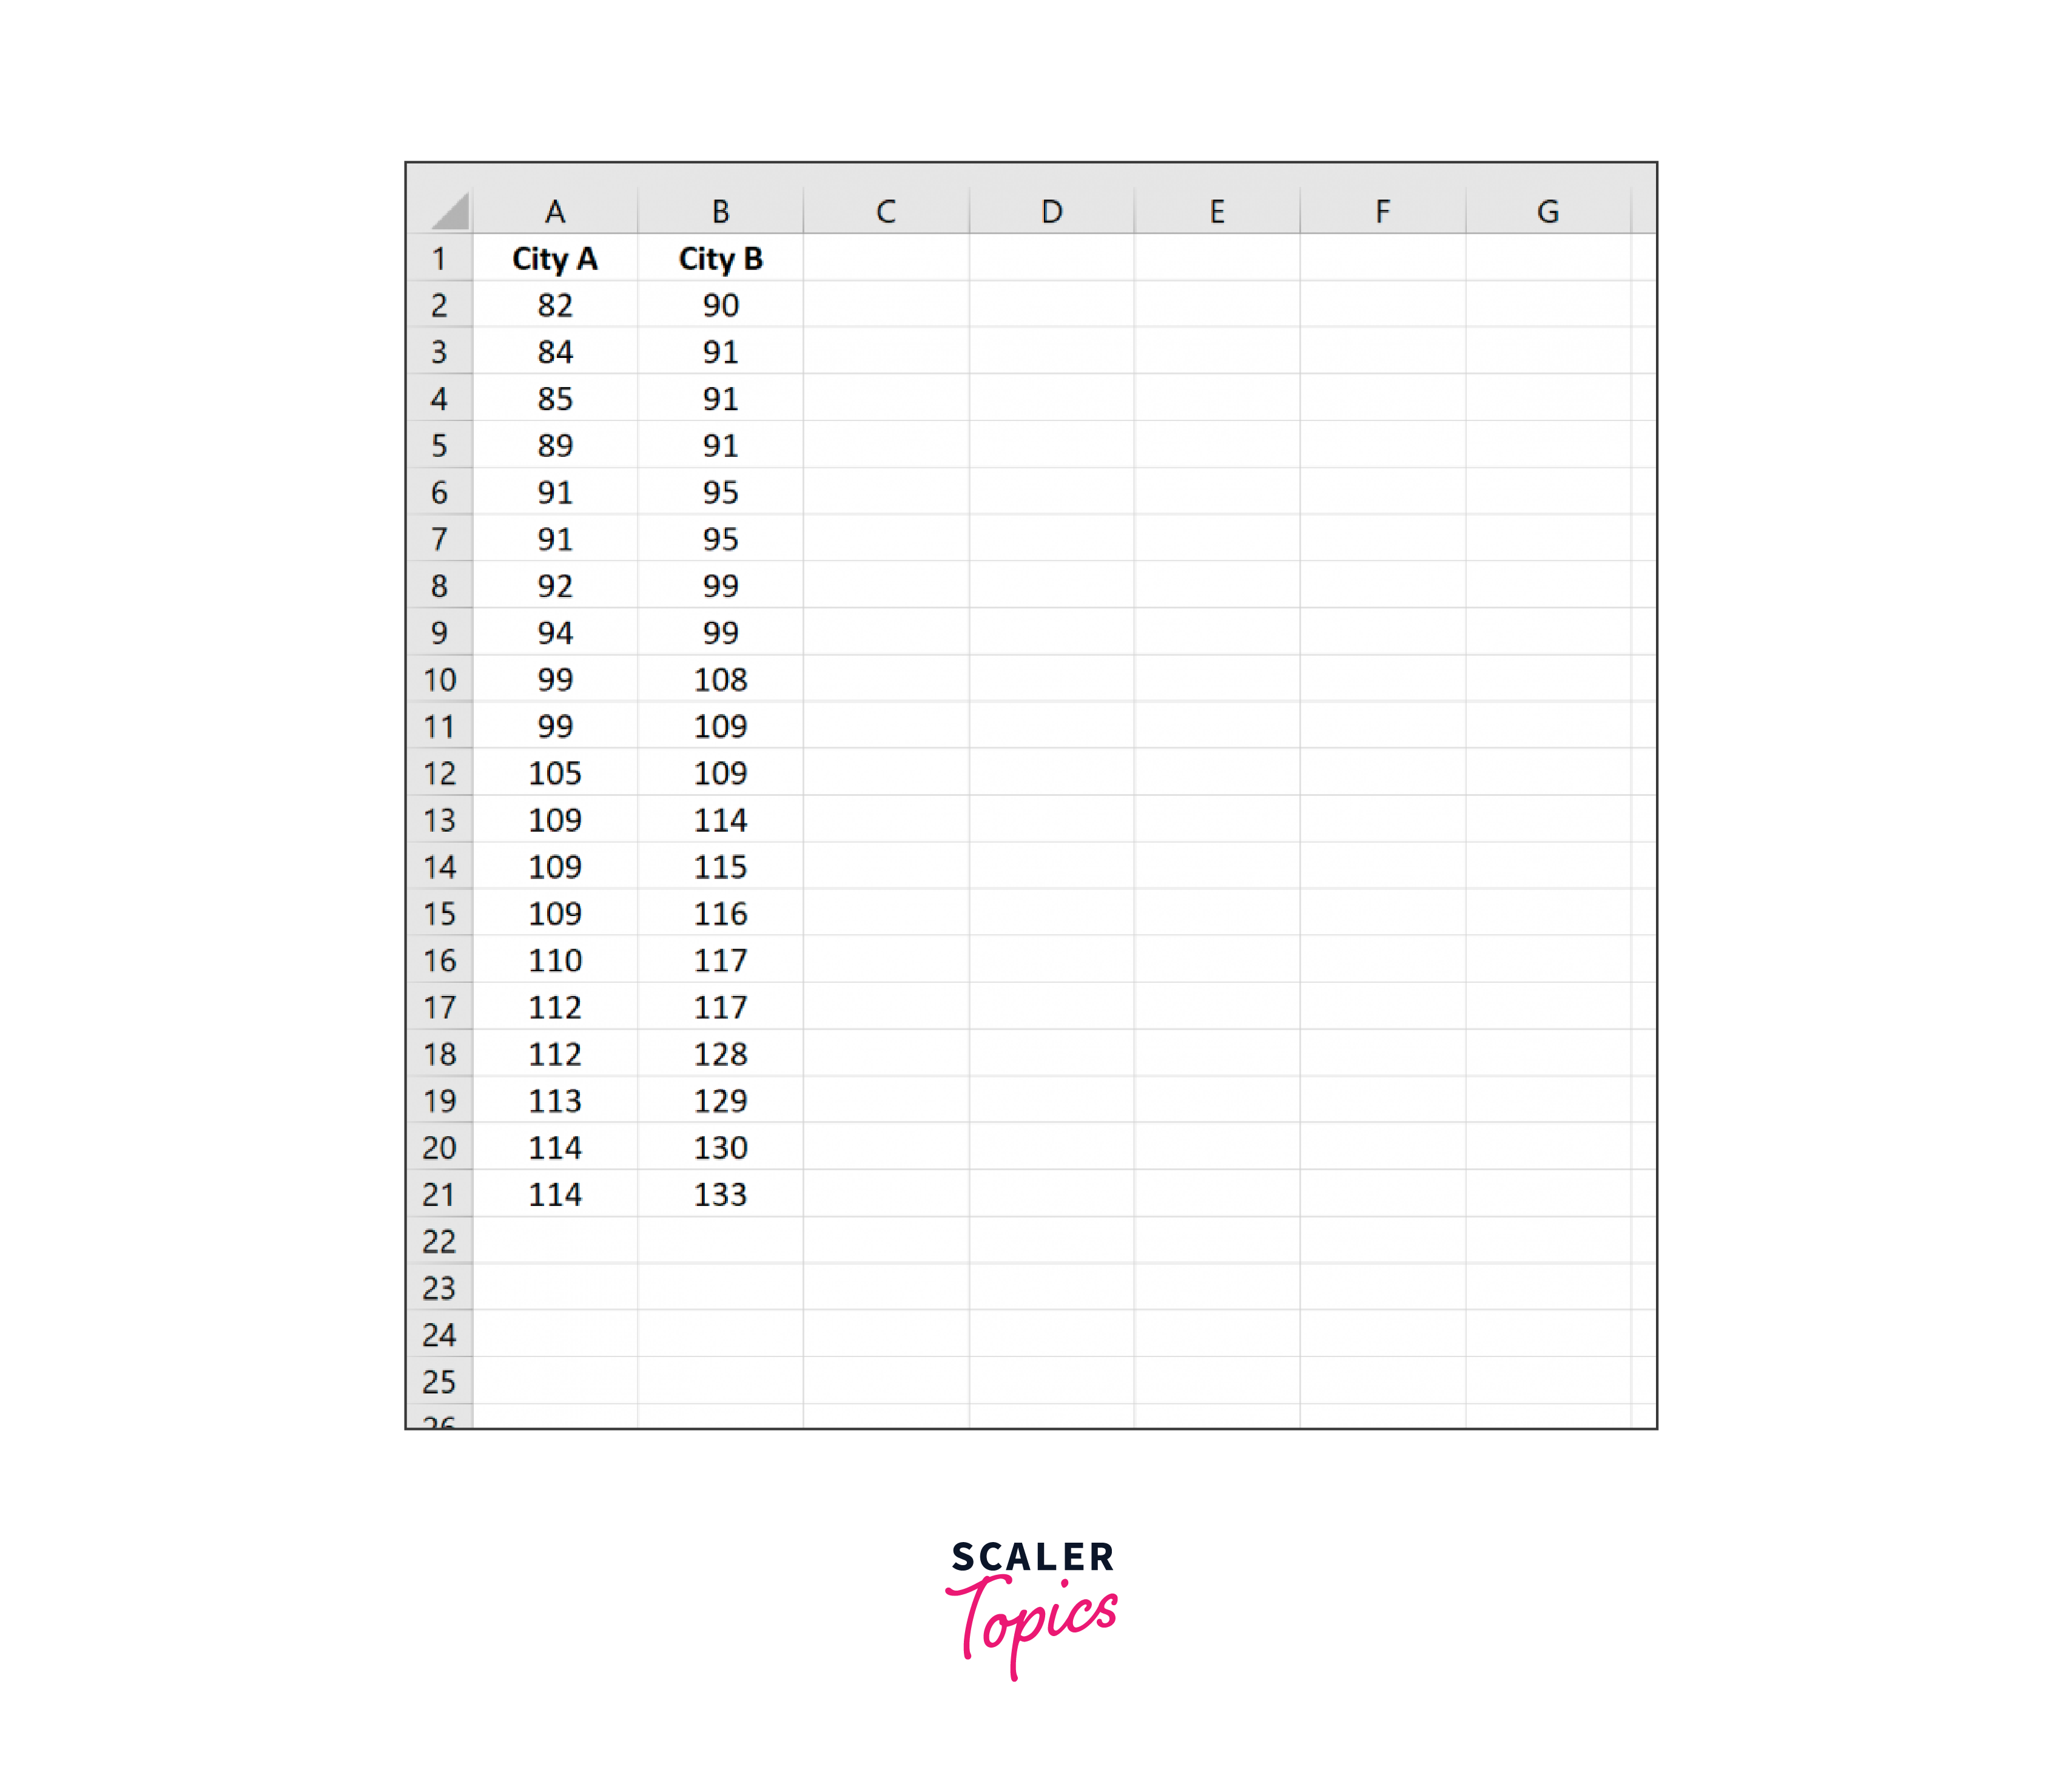
A scientist chooses a basic random sample of 20 people from each city and records their IQ scores to determine whether the mean IQ levels between people in cities A and B differ.
The IQ scores for each sample's participants are displayed in the following screenshot:
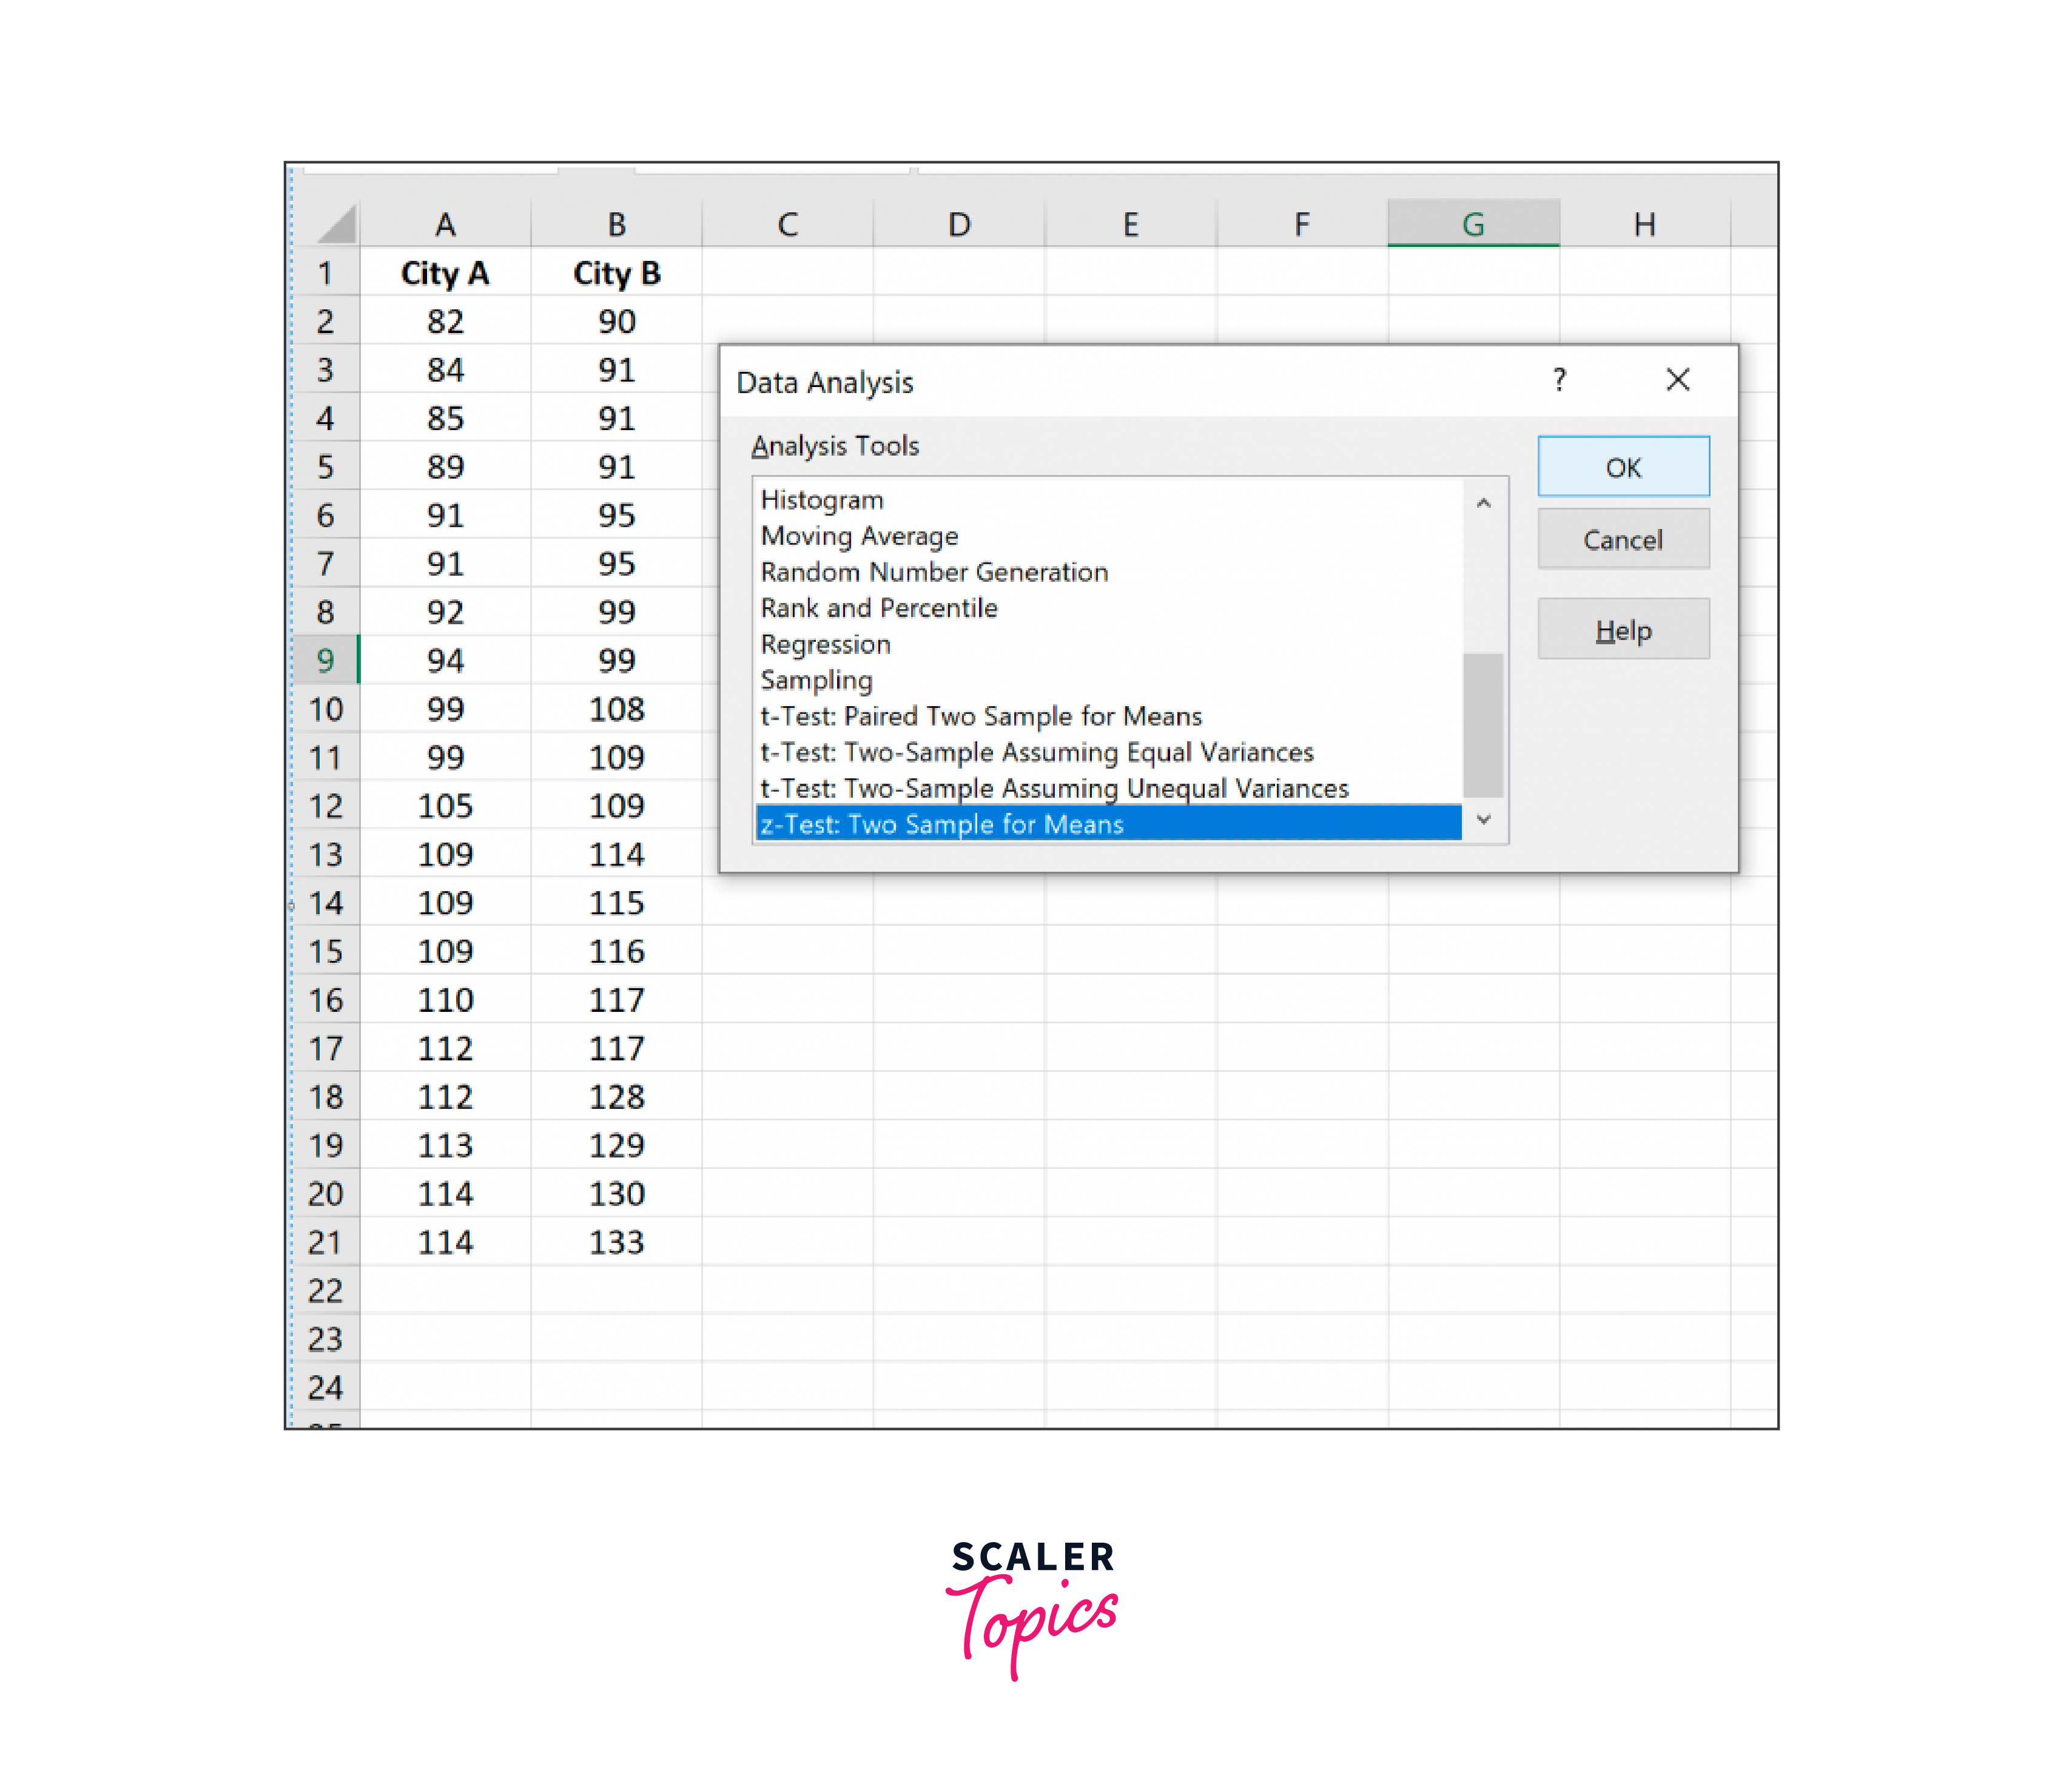
Click the Data tab in the top ribbon, then select the Data Analysis button from the Analysis group to run a two-sample z-test to see if the mean IQ level differs between the two cities.

You must first load the Analysis ToolPak in Excel if you don't see the Data Analysis option.
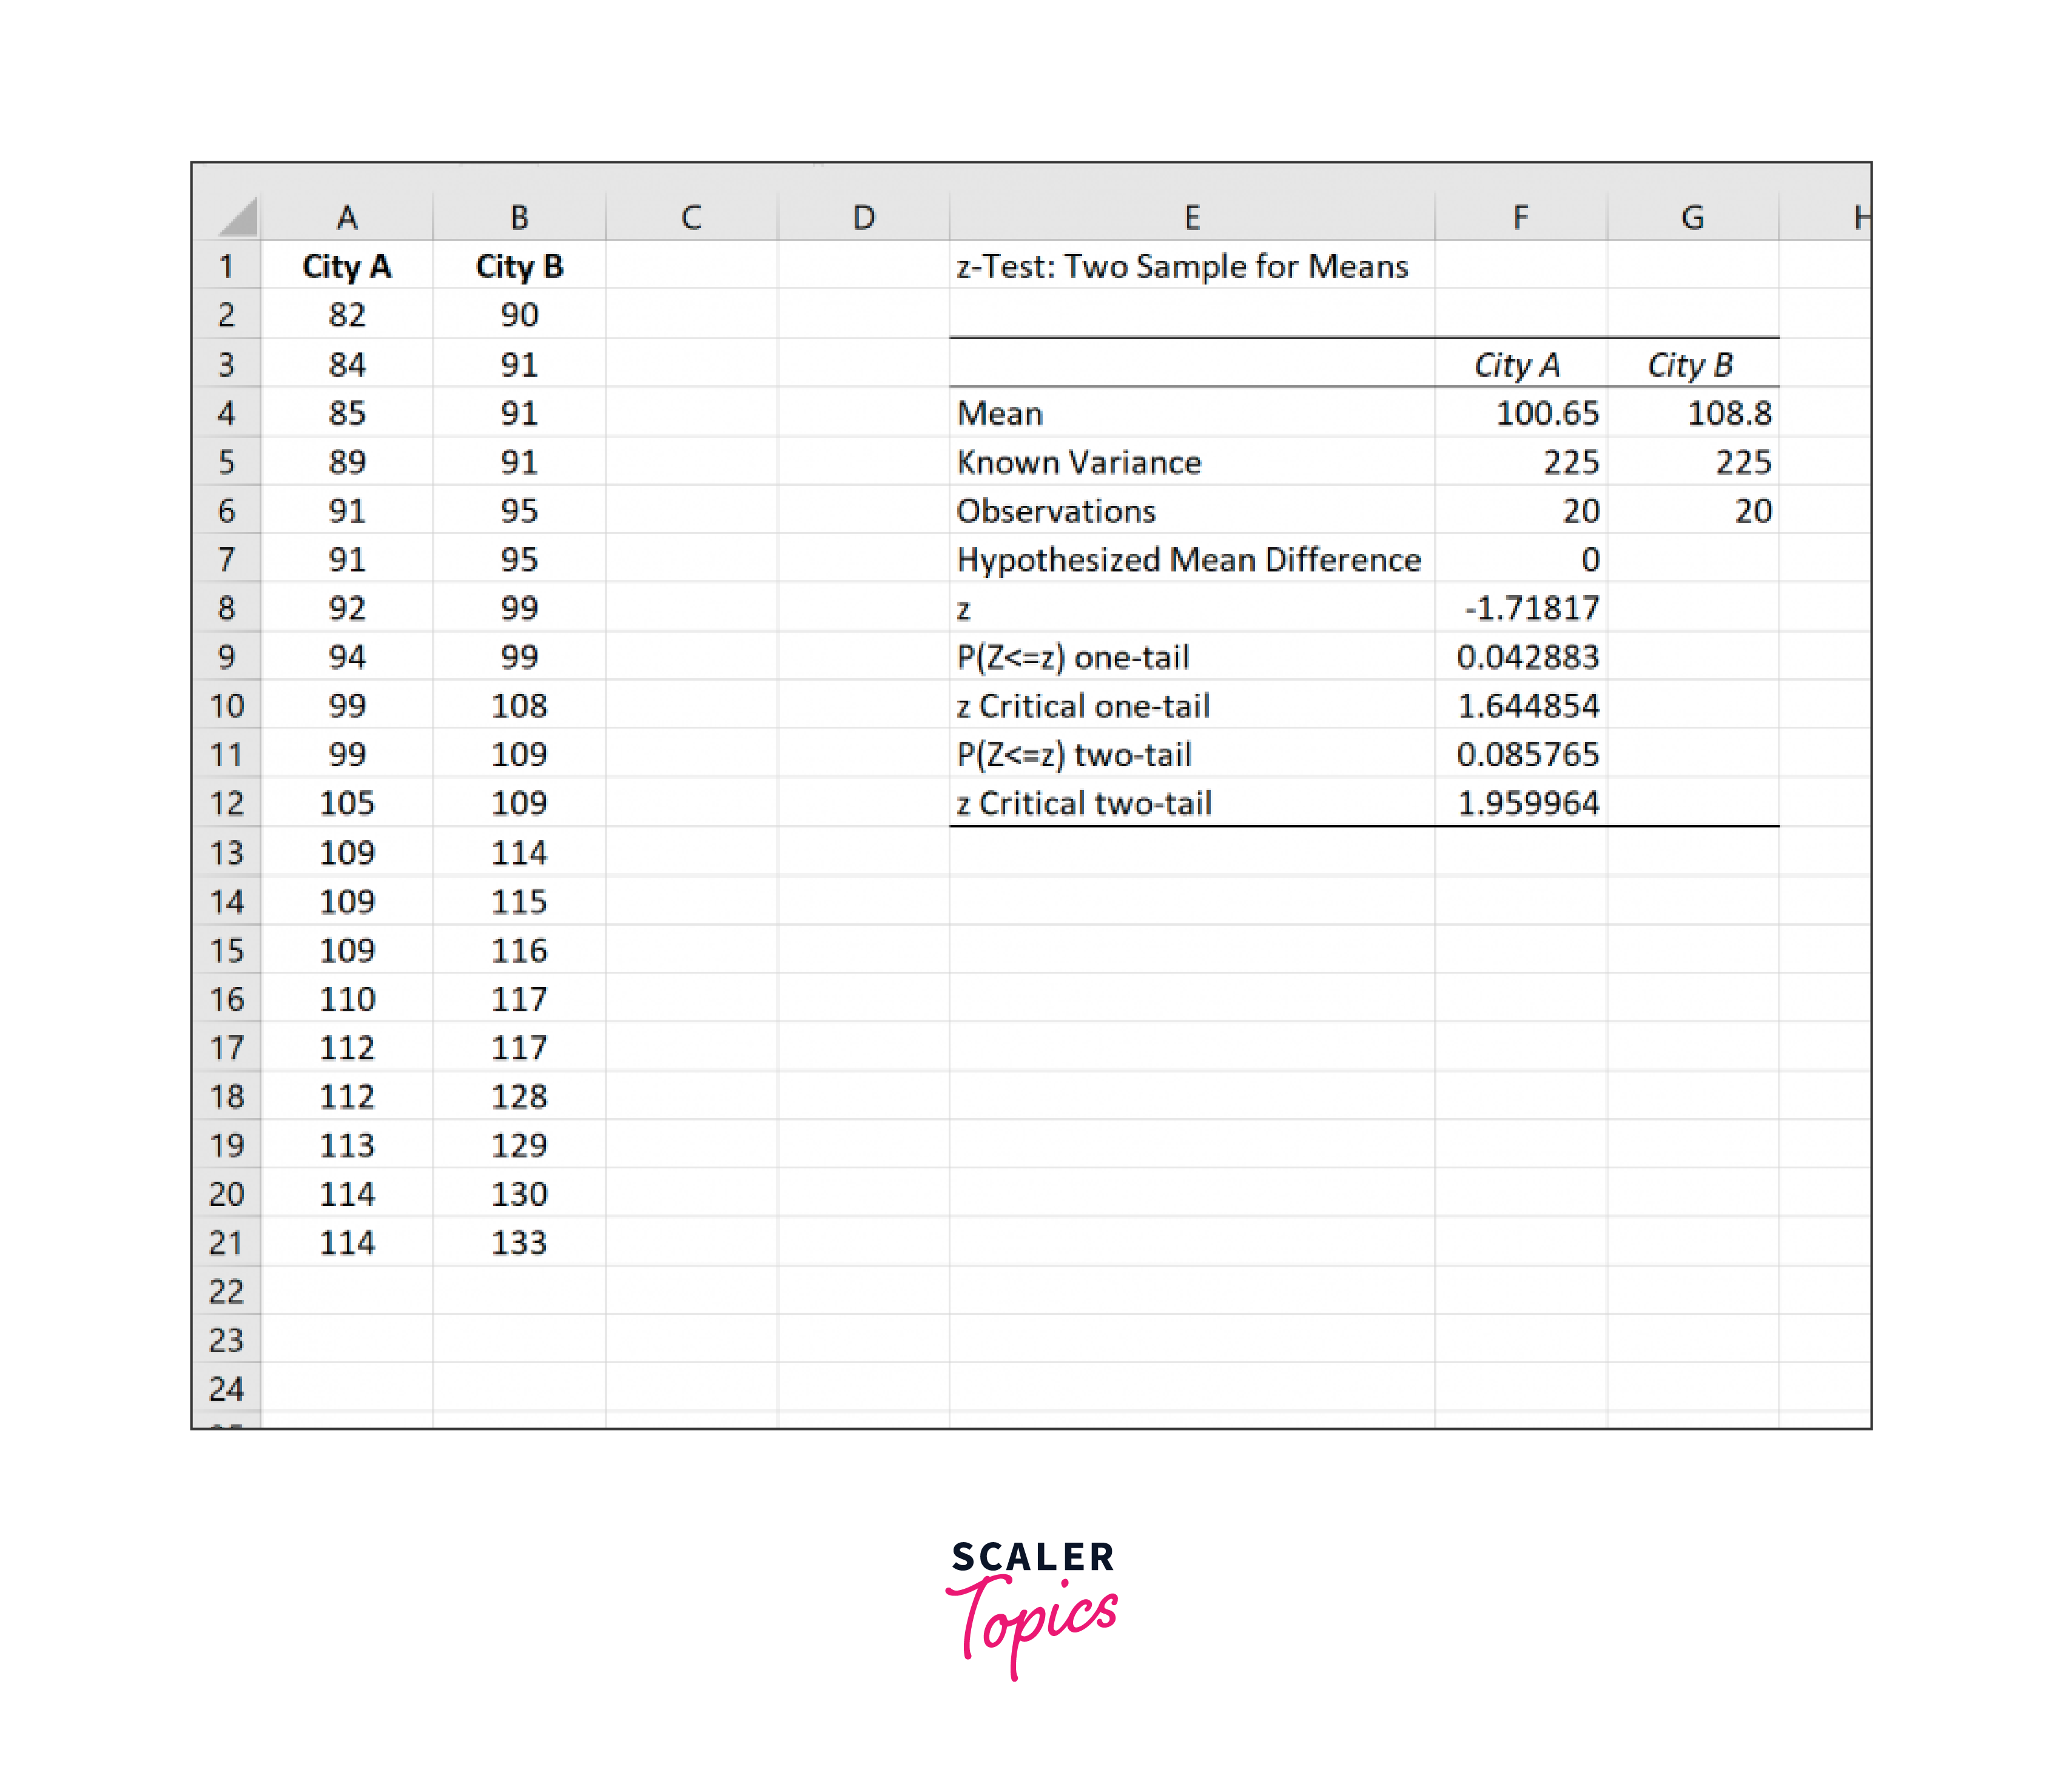
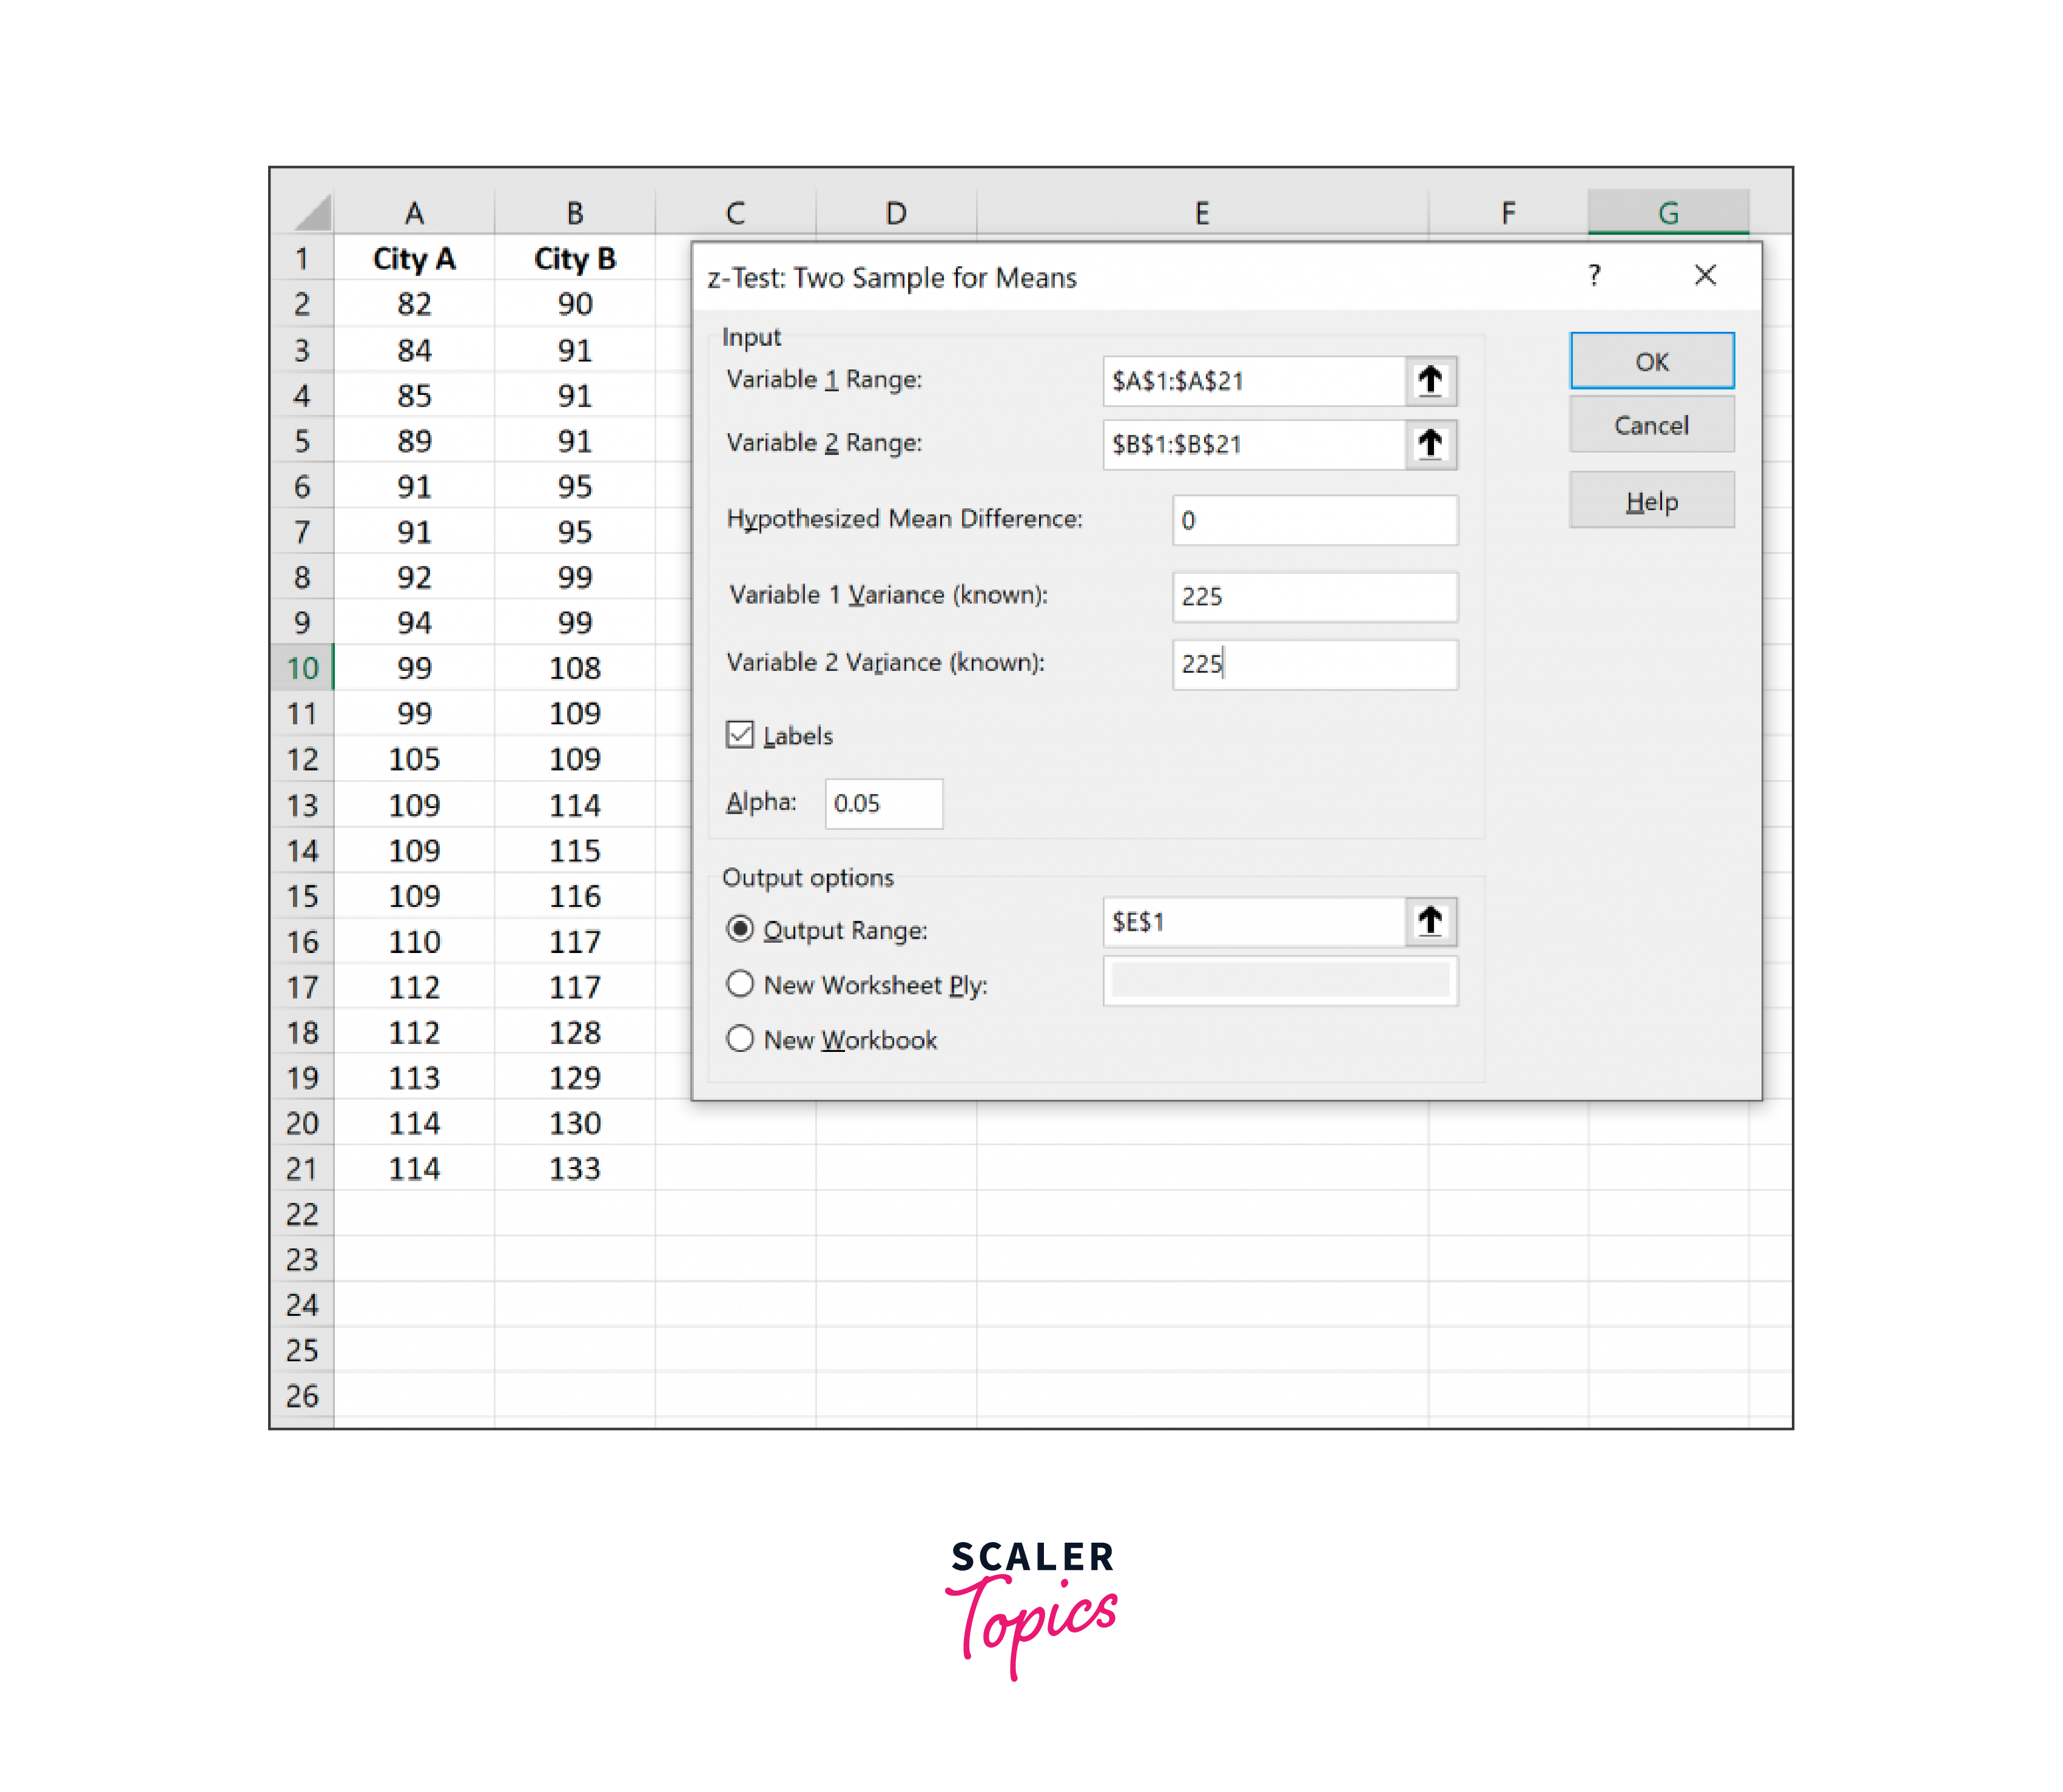
Select z-Test: Two Sample for Means in the new window that appears after clicking this button:
You can enter the following details after clicking OK:
The results will show up in cell E1 once you click OK:
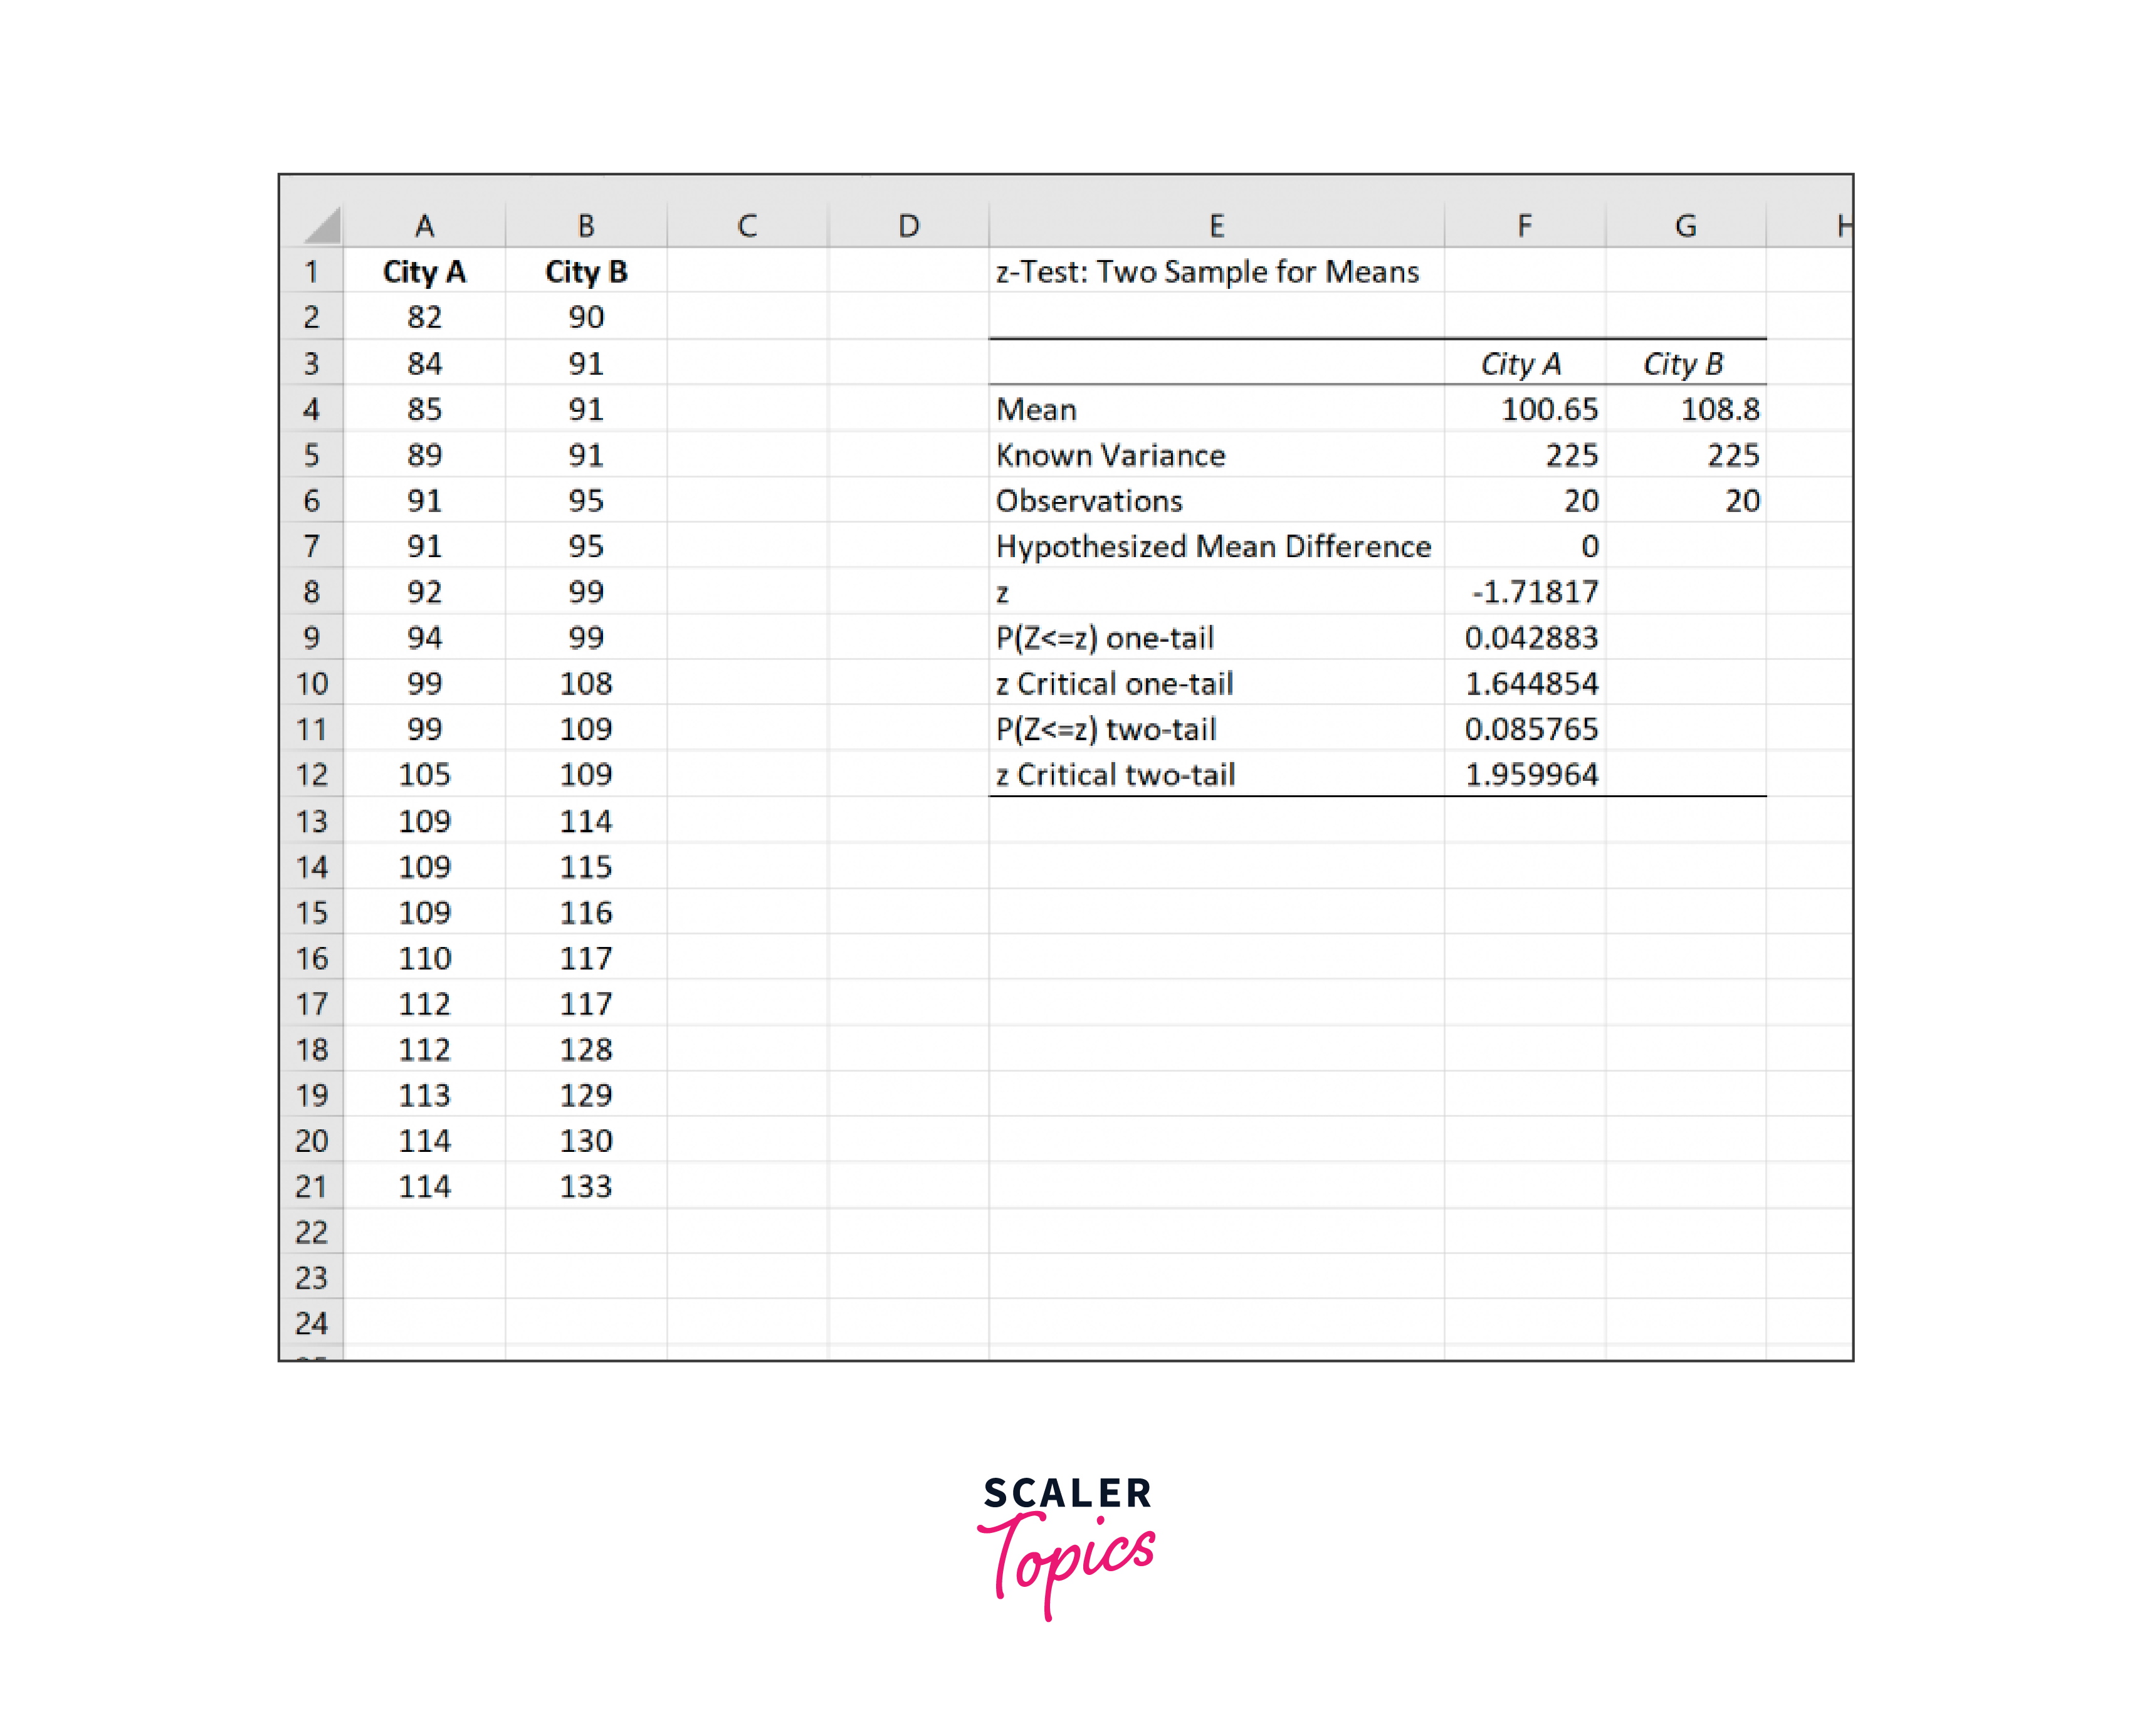
The two sample z-test in excel statistic is -1.71817, and the related p-value is.085765.
We lack adequate data to reject the null hypothesis because this p-value is more than.05.
As a result, there is not a significant disparity in the mean IQ between the two cities.
What is a Z-Test?
If you need to compare group means, use a Z test. To ascertain whether a population mean differs from a value that has been hypothesized, use the 1-sample analysis. Alternately, use the 2-sample variant to check whether the means of two populations differ.
An example of inferential statistics is the Z test.
To make inferences about populations, it uses samples. Z tests can be used, for instance, to evaluate the following:
Example: Does the average IQ of students in honors courses depart from the assumed value of 100? Do the mean scores for two IQ-boosting programs differ?
Learn when to use a T-test versus a Z-test in this article. The formula, assumptions, interpretation, and hypotheses underlying the Z test will next be reviewed.
Finally, we'll utilize the formula in a worked example to wrap things up.
Z-test vs T-test
| Criteria | Z-test | T-test |
|---|---|---|
| Definition | A Z-test is a statistical test used to determine whether two population means are different when the variances are known and the sample size is large. | A T-test is a statistical test used to compare the means of two samples to see if they're significantly different, especially when the sample size is small and variances are unknown. |
| Sample Size | Z-tests are more suitable for larger sample sizes (n>30) as they require a good approximation of a normal distribution. | T-tests are suitable for smaller sample sizes (n<30) and do not assume normal distribution. |
| Known Variance | Z-tests are performed when the population variance is known. | T-tests are performed when the population variance is unknown and estimated from the sample data. |
| Excel Function | Z-tests can be performed in Excel using standard functions like STANDARDIZE and NORM.S.DIST. | T-tests can be performed in Excel using built-in functions like T.TEST or T.INV. |
| Use Cases | Z-tests are often used in large-scale surveys, quality control, or A/B testing. | T-tests are often used in smaller experiments or studies, like clinical trials or student's t-tests in education or psychology. |
Testing
Use a Z-test when you are aware of the population standard deviation.
-
When to use Z-test? The ideal statistical practice is to perform a t-test regardless of the sample size when you have a sample estimate of the standard deviation, which will be the majority of the time. When the sample size is greater than 30, the distinction between the two analyses, however, disappears.
-
Z Test Hypotheses This approach evaluates population mean-related hypotheses using sample data (). Whether you're evaluating one sample or two samples will affect the hypothesis.
Hypotheses for the one-sample Z test
- H0, the null hypothesis ( = 0) The population means equals a predicted value.
- An alternative theory (HA) A hypothesized value ( 0) IS NOT equal to the population mean.
- Reject the null hypothesis when the p-value is less than or equal to your significance level (for example, 0.05). The variance between the hypothesized value and the sample mean is statistically significant. Your sample data lend weight to the idea that the population means differ from the figure proposed.
- Hypotheses for the two-sample Z-test Two population means are equal (1 = 2), proving the null hypothesis (H0). A different conclusion (HA): The means of two populations are not equal (1 2).
Reject the null hypothesis once more if the p-value is less than or equal to your significance level. The two means' difference is statistically significant. The idea that the two population means are different is supported by your sample data.
These theories are for analyses that have two sides. Instead, you can utilize directional, one-sided assumptions.
All Z tests rely on your data having a normal distribution. However, if your sample size is high enough, you can disregard this assumption because of the central limit theorem.
When normalcy is less of a concern, according to the following sample size guidelines:
- A one-sample is 20 observations or more.
- 15 or more in each group for a two-sample sample.
We know the population standard deviation. Use a Z test when you know the population standard deviation, as indicated in the Z test vs T test section. However, the discrepancy between the studies disappears when n is more than 30.
Conclusion
Here are a few important points from this article:
- To determine whether a population mean significantly differs from an assumed value, a one-sample z-test is used.
- To determine whether two population means are substantially different from one another, a two-sample z-test is employed.
- An example of inferential statistics is the Z test. To make inferences about populations, it uses samples.
- Z tests can be used, for instance, to evaluate the following:
- One example: Does the average IQ of students in major programs depart from the assumed value of 100?
- Do the mean scores for two IQ-boosting programs differ?